
Abstract
The implementation of structural health monitoring systems in civil engineering structures already in the construction phase could contribute to safer and more resilient infrastructure. Due to their lightweight, small size and high resistance to the environment, distributed optical fibre sensors stand out as a very promising technology for damage detection and quantification in reinforced concrete structures. In this article, the suitability of embedding robust distributed optical fibre sensors featuring a protective sheath to accurately assess the performance indicators, in terms of vertical deflection and crack width, of three reinforced concrete beams subjected to four-point bending is investigated. The results revealed that a certain strain attenuation occurs in embedded robust distributed optical fibre sensors compared to commonly used thin polyimide-coated distributed optical fibre sensors bonded to steel reinforcement bars. However, the presence of the protective sheath prevented the appearance of strain reading anomalies which has been a frequently reported issue. Performance wise, the robust distributed optical fibre sensors were able to provide a good estimate of the beam deflections with errors of between 12.3% and 6.5%. Similarly, crack widths computed based on distributed optical fibre sensor strain measurements differed by as little as ±20 µm with results from digital image correlation, provided individual cracks could be successfully detected in the strain profiles. Finally, a post-processing procedure is presented to generate intuitive contour plots that can help delivering critical information about the element’s structural condition in a clear and straightforward manner.
Keywords
Introduction
The loss of structural integrity of reinforced concrete (RC) structures due to ageing or premature deterioration is a global issue that puts the safety of the users at risk and has a negative cascading effect on the competitiveness and welfare of a country. However, the economic and environmental cost of replacing all the currently deficient structures would be simply too high. Therefore, the implementation of effective damage identification and assessment strategies is required to determine the severity of ongoing deterioration processes, thereby enabling infrastructure owners to design appropriate maintenance/repair/strengthening plans to ultimately extend the service life of existing civil engineering structures.
At the same time, it has been estimated that 75% of the infrastructure required to meet the needs of the world’s growing population and the increasing migration to urban areas has not yet been built. 1 This enormous demand for new infrastructure comes with the challenge of building a new generation of structures that are sustainable, climate resilient and energy efficient to promote the development of a more sustainable construction industry. Along these lines, the implementation of a structural health monitoring (SHM) system already in the construction phase could bring manifold advantages. Indeed, the detailed monitoring of a structure’s performance over its service life would enable the early detection of structural faults, which could prevent the occurrence of potentially catastrophic events while providing valuable information for the optimization of structural designs. Moreover, with a continuous reliable monitoring system in place, the current time-based inspection model could be replaced by a performance-based or risk-based inspection approach. Furthermore, today’s maintenance paradigm could shift from corrective to preventive, thus resulting in tremendous savings in infrastructure maintenance and a reduction of its associated social impact. However, to date, the use of SHM is not yet a common practice in civil engineering due to the lack of reliable, scalable and affordable monitoring solutions. 2
In this context, the development of damage detection systems based on optical fibre sensors has received significant attention in the last decades. Optical fibre sensors present several advantages compared to traditional sensors, such as small size, lightweight, chemical and corrosion resistance as well as immunity to electromagnetic fields. 3 Among the existing types of fibre optical measurements, fibre Bragg grating and Fabry–Perot have been widely researched and to date are the most used in practice. 4 However, these two types of sensors have certain limitations with respect to the maximum number of measuring points along an optical fibre and their spacing, thus being often referred to as quasi-distributed sensors. As such, being the position of critical sections in a structure unknown a priori, these sensors may miss out on key information, thereby failing to provide an accurate description of the structure’s condition.
More recently, distributed optical fibre sensors (DOFS) featuring unprecedented spatial resolutions have been developed, thereby opening for new possibilities in the development of damage detection systems for RC structures. The working principle of DOFS is based on the analysis of light backscattering that occurs along the fibre due to three different processes: Raman, Brillouin and Rayleigh scattering. Raman scattering is highly sensitive to temperature variations, but its application has been mostly limited to fields other than civil engineering. 5 Brillouin and Rayleigh scattering, however, are both sensitive to temperature and strain variations, yet they present fundamental differences with respect to spatial resolution and measuring range. Indeed, DOFS based on Brillouin optical time-domain reflectometry (BOTDR) feature a spatial resolution in the order of the tens of centimetres, 6 but their measuring range can reach lengths of up to 300 km. 7 Conversely, the sensing range of Rayleigh-based DOFS is currently limited to 70 m, but they boast an unmatched spatial resolution in the sub-millimetric scale. 8
In the last decade, several researchers have investigated the applicability of DOFS for the monitoring of RC structures. As a result of those investigations, the suitability of DOFS for strain monitoring and crack detection has been demonstrated experimentally for Brillouin-based DOFS9–12 and Rayleigh-based DOFS.13–17 Likewise, the viability of using DOFS in real onsite applications has also been proven in several cases, see, for example, the literature.18–23 However, one of the remaining challenges to unravel the full potential of DOFS is to enable the accurate and reliable assessment of crack widths and deflections based on strain measurements.
Significant work has been carried out recently in the assessment of crack widths using Rayleigh-based DOFS. Rodriguez et al.24,25 presented a methodology to estimate the crack width of bending and shear cracks from strain measurements of DOFS bonded to the surface of the concrete. However, the described method only provided an average crack width over a cracked region. Further experimental work by Berrocal et al. 26 revealed that, using strain measurements from DOFS bonded to the reinforcement, a good estimation of the crack width of multiple individual bending cracks along an RC beam can be achieved. Similarly, Poldon et al. 27 used nylon-coated DOFS installed on longitudinal reinforcement bars to calculate crack slips and widths as well as to assess the vertical deflections of RC beams through double integration of curvatures obtained from the strain at different heights. Brault and Hoult 28 had previously shown that multiple cracks as well as deflections could be also accurately measured using DOFS longitudinally bonded to the surface of RC beams. Despite the very promising results, the type of optical fibre sensor commonly used in the mentioned studies, that is, a thin polyimide-coated low-bend loss fibre featuring a diameter of between 125 and 155 µm, still presents important challenges with respect to its deployment in RC structures. Indeed, in addition to the fragile nature of the fibre requiring extreme care during handling, several studies have indicated that strain reading anomalies (SRAs) are commonly observed at points where the DOFS cross a crack, both when bonded to the concrete surface and to the embedded reinforcement,17,29–31 highlighting the importance of choosing the correct combination of adhesive and protective coating.
Different types of DOFS, better suited for the demands of onsite operations, are also available. These present one or more protective layers (cladding, coatings, buffers, etc.) around the glass core. However, due to the lower shear stiffness of these intermediate layers, the strains measured are somewhat attenuated compared to the actual strains in the substrate material. A mechanical transfer model based on shear lag theory formulated by Feng et al. 32 was later used by Billon et al. 33 to correlate strain measurements with the crack width of a single crack using coated DOFS embedded into an adhesive tape and bonded to the surface of the concrete. Bassil et al. 34 also used a mechanical transfer model to demonstrate its applicability to the crack width estimation of multiple cracks by means of strain measurements of coated DOFS embedded in an RC beam. In a different study, Bassil et al. 35 adapted the strain transfer model to include the effect of imperfect bonding and assessed its performance with wedge splitting tests using several commercially available fibre optic cables with protective coatings. Interestingly, the study showed that the proposed model yielded large errors for robust fibres, that is, optical fibre cables with protective metal tubes, which was attributed to the relatively high stiffness of the steel layer compared to that of the fibre.
This article reports the results of a study investigating the suitability and performance of robust optic fibre cables to assess cracking and deflections of RC beams. In particular, the work focuses on the analysis of Rayleigh scattering–based DOFS measurements without the use of strain transfer models between the fibre core and the substrate element. To that end, laboratory experiments were carried out to compare the performance of robust fibre optic cables to other conventional measurement techniques, such as digital image correlation (DIC), as well as to common polyimide-coated fibre optic cables without a protective sheath. Furthermore, this study demonstrates how, through the analysis and post-processing of the DOFS measurement, the acquired sensor data can be visualized as clear and intuitive contour plots to facilitate the understanding of the monitored element’s structural condition.
Description of the experiments
The experiments carried out in this work involved two different types of test. First, uniaxial tensile tests on bare steel reinforcement bars were carried out to assess the accuracy of robust fibre optic cables compared to commonly used axial extensometers and uncoated DOFS. Subsequently, three large-scale RC beams were subjected to two load cycles under four-point bending in order to test the adequacy of robust DOFS, deployed in a multi-layer configuration, for the identification of crack formation and location as well as to determine beam deflections and the width of all detected cracks. In the following, detailed information about the most relevant aspects of the experimental programme is presented.
Specimen geometry
Three reinforcement bars with a total length of 1000 mm and 16 mm of nominal diameter were used for the uniaxial tensile tests. A 3-mm deep and 3.5-mm wide groove was carved along the central 700 mm of each bar, leaving approximately 150 mm on either side to have 90 mm of grip length in the clamps of the testing machine plus some extra space to ensure the DOFS could be bent out without exceeding the minimum bending radius recommended by the manufacturer.
The beams used in the bending tests had a total length of 3000 mm and a rectangular cross-section of 200 mm × 250 mm. Each beam was reinforced with three ∅16 mm rebars at the bottom and two ∅10 mm rebars at the top. Moreover, six ∅8-mm closed-loop stirrups equally spaced at 200 mm were placed on either side of the beams. All reinforcements were made of normal ductility carbon-steel (B500B) with a nominal yield strength of 500 MPa. Plastic spacers were placed between the stirrups and the bottom and lateral sides of the form to ensure a clear concrete cover of 25 mm. The ends of the bottom bars were bent upwards to improve the anchorage. Moreover, the tensile bars protruded from the beam on one end to create a safe way out for the thin DOFS. The geometry and reinforcement layout of the beams is presented in Figure 1.
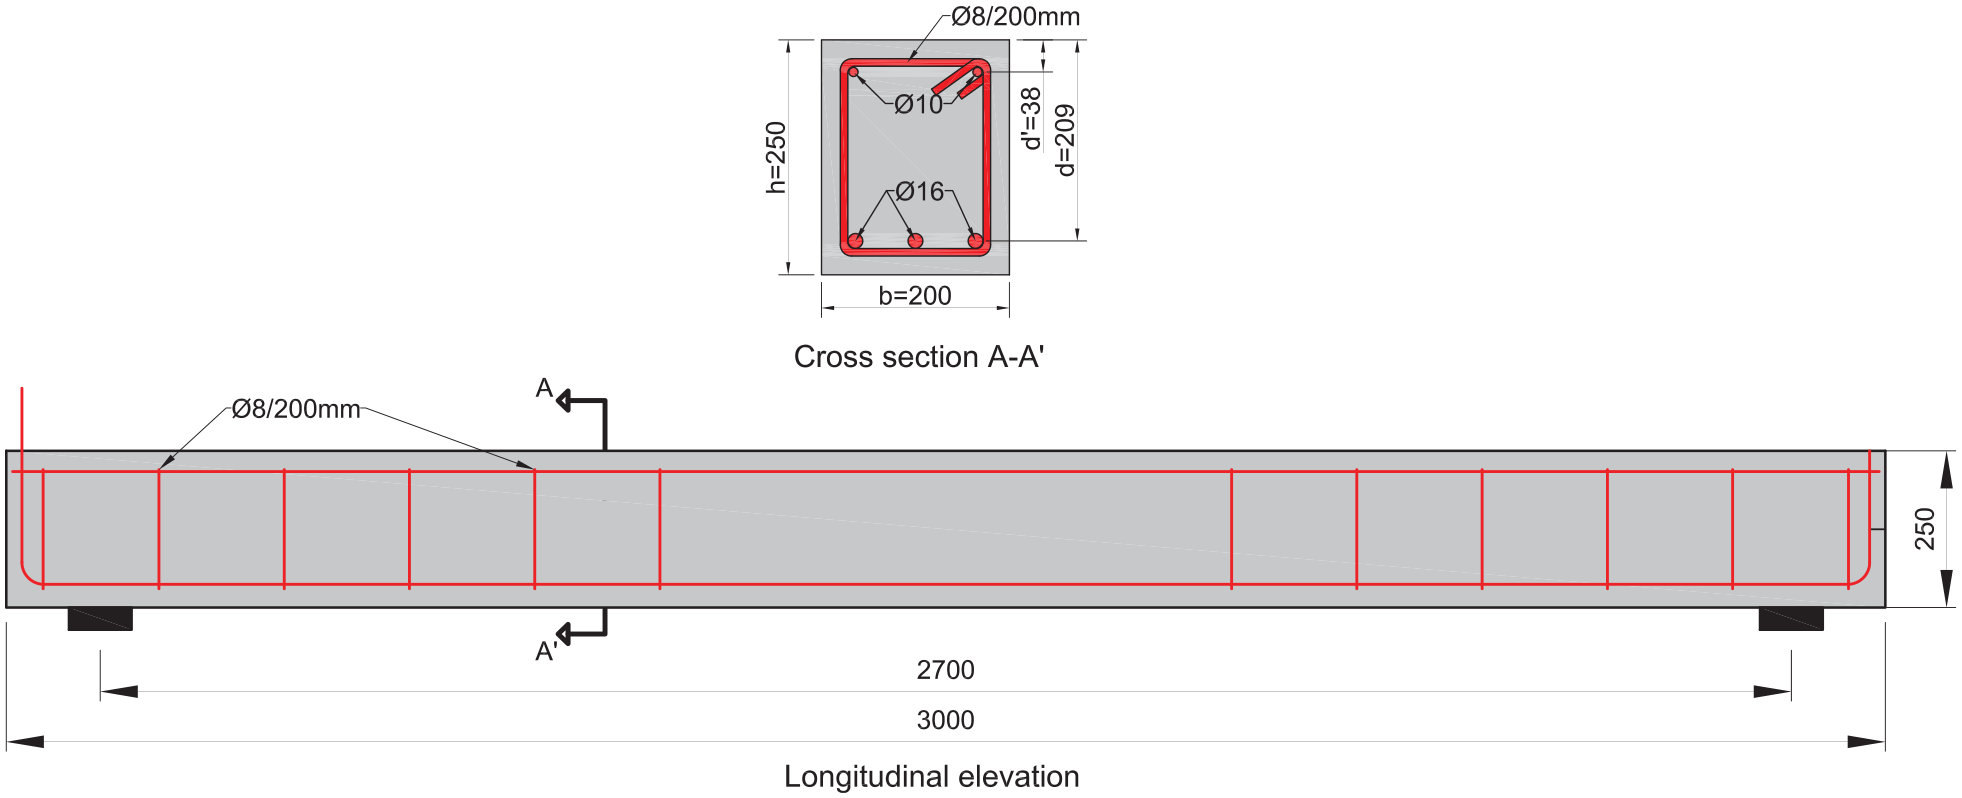
Geometry and reinforcement layout of the beam specimens (all measurements in mm).
Materials and sample preparation
A concrete mix with a water-to-cement ratio (w/c) of 0.45 was used to cast all the beams. The mix included a sulphate-resistant Portland cement with low C3A content and moderate heat development. Moreover, the mix was designed to be self-compacting in order to remove the need of compaction and vibration, thereby minimizing the risk of accidentally damaging the thin embedded DOFS. The mix proportions are given in Table 1.
Concrete mix proportions, in kg/m3.
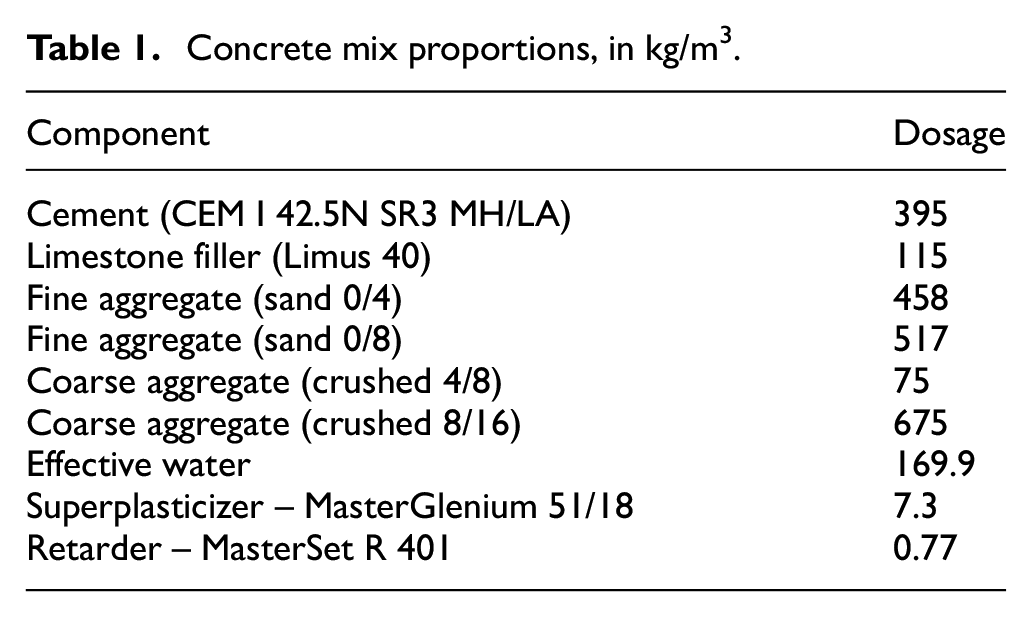
After casting, the beams were stored for 15 days in an indoor climate (20°C ± 2°C and 60% ± 10% relative humidity (RH)) covered with a polyethylene sheet to reduce moisture evaporation until testing. The concrete compressive strength at 28 days was 68.2 MPa (coefficient of variation (CoV) = 5.6%) based on tests performed in accordance with EN 12390-3:2003 36 on three 150 mm cubes.
DOFS installation and strain monitoring
As previously mentioned, several procedures have been described in the literature for the installation of DOFS in RC elements. The most common procedures include mounting the fibre onto the hardened concrete surface, embedding it into the concrete or attaching the fibre to the reinforcement either by bonding it to its surface or inserting it into a previously etched groove.
To date, there is no installation method that can be regarded as optimal since the suitability of the method may depend on the application at hand, the context of the structure, namely, new or existing structures, and the sought outcome. Whereas the performance of the DOFS can be strongly influenced by the type of adhesive used, 37 the installation method is to a large extent dictated by the type of fibre optic cable being targeted. As an example, Figure 2(b) shows the two types of fibre optic cable used in this study. The thin polyimide-coated fibre, with a thickness of only 125 µm, can be easily fit anywhere in a structure without the need of doing any modifications to accommodate it, at the expense of requiring additional measures to reduce the risk of fibre breakage. Conversely, the robust cable BRUsens V9 from Solifos, featuring an inner steel tube and an external rugged polyamide cladding, can be easily handled and deployed without the risk of rupture, but its 3.2 mm diameter makes it less suitable for surface applications.
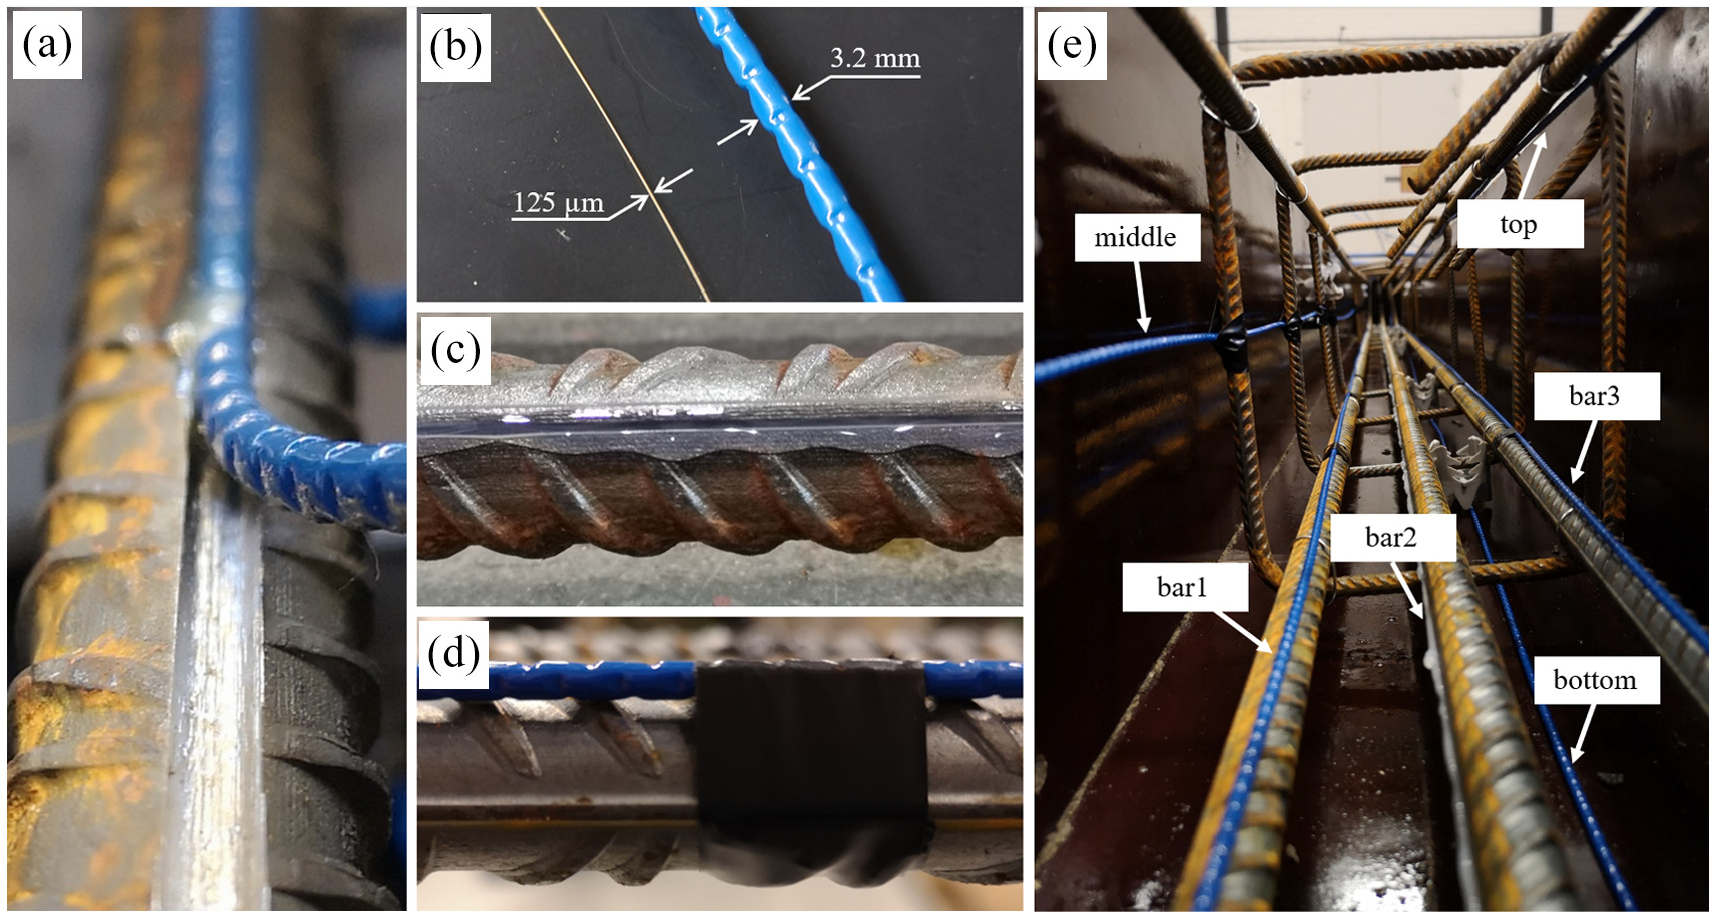
Installation of the optical fibre sensors: (a) installation of robust DOFS cable in a reinforcement bar by inserting it into a previously milled groove; (b) comparison of thin and robust DOFS; (c) installation of thin DOFS on the surface of a reinforcement bar by bonding it with cyanoacrylate adhesive and protecting it with silicone; (d) installation of robust DOFS on the surface of a reinforcement bar by mechanically anchoring the cable to the reinforcement with electric tape; and (e) multi-layer configuration of embedded DOFS in the beam specimens.
Based on the above, in this study, the thin DOFS were bonded directly onto the steel bars at the concavity created by the longitudinal ridge. The thin DOFS were glued using cyanoacrylate adhesive after removing the mill scale and degreasing the area with acetone. Before embedding the instrumented rebar in the concrete, a protective layer of a one-component waterproof oxygen-free silicone rubber was also applied on the bonded DOFS, see Figure 2(c). For the robust DOFS, two different approaches were followed for the uniaxial and bending tests, respectively. For the former, the DOFS were inserted into a semi-circular groove carved along the reinforcement and bonded with a two-component epoxy resin, see Figure 2(a). For the latter, the robust DOFS were installed either supported along a longitudinal rebar, bridging the stirrups or resting on the formwork using electric tape to fix them in place, see Figure 2(d). Note that the use of two different bonding strategies was due to the need of an improved adhesion technique in the uniaxial tests that could provide continuous bond along the bar in the absence of surrounding concrete.
In the uniaxial tests, one DOFS of each type was installed on either side of the tested rebar. In the beams, a single robust DOFS was used to monitor strains at five different positions spanning the distance between the supports: above the two outer tensile rebars (bar 1 and bar 3); under one of the compressive rebars (top); at mid-height (middle); and at the bottom surface of the beam (bottom). Moreover, a thin DOFS was bonded to the remaining tensile rebar (bar 2). The DOFS installation configuration is depicted in Figure 2(e).
The Optical Distributed Sensor Interrogator (ODiSI) 6000 series from Luna Inc. was used as the interrogation unit. This instrument offers a strain resolution of 0.1 µε, a maximum strain range of ±15,000 µε and a sample rate that can go up to 250 Hz depending on the gauge pitch, cable length and number of active channels. In all tests, the largest available spatial resolution between measuring points provided by the interrogator was chosen, namely, 2.65 mm. This configuration provided a combined accuracy (instrument + interrogator) of ±30 µε, whereas the sample rate was set at 1 Hz. It should be noted that temperature compensation was not performed in any of the tests since these were carried out in a controlled laboratory environment and during a short time span.
In the uniaxial tests, an axial extensometer from MTS with a gauge length of 50 mm and a measuring range of ±25 mm was used to measure the average strain in the rebar. The extensometer was mechanically mounted on the rebar by means of two springs. In the bending tests, DIC was used on one of the lateral sides of the beams to measure the full-field deformation and surface strains. For that purpose, the commercially available system from GOM, ARAMIS®, consisting of an adjustable stereo-camera setup was employed with a sampling rate of one picture per second. The DIC system provided a maximum measurement volume of 980 × 795 × 795 mm3 which enabled the monitoring of the central part of the beam comprised between the two loading points. The results of the DIC were used as reference to assess the accuracy of the DOFS in determining the position and width of the cracks as well as the beam’s deflection.
Loading setup
The uniaxial tensile tests were carried out in an MTS universal testing machine with a maximum capacity of 250 kN. The notched bars, with the robust DOFS on one side and the thin DOFS on the opposite side, were introduced 90 mm into the machine grips at each end (DOFS were not bonded in the zones near the ends). After locking the grips, three load cycles between 0 and 37 kN were performed at a constant deformation rate of 0.5 mm/min. The upper bound of the loading cycles corresponds to one-third of the average yield force of the bars.
For the flexural tests, the beams were simply supported on rollers and loaded under four-point bending. The clear span between the centre of the supports was equal to 2700 mm. The load was introduced using a single actuator acting on the middle of a steel distribution beam equipped with two movable bearing supports symmetrically placed at 900 mm from the rollers, thus dividing the beam in three equal spans of 900 mm. Loading was applied under displacement control using a closed-loop feedback system at a displacement rate of 0.5 mm/min. Two load cycles were performed reaching a maximum total load of 60 kN and unloading down to 5 kN total load. The loading setup including the DOFS configuration is schematically illustrated in Figure 3.
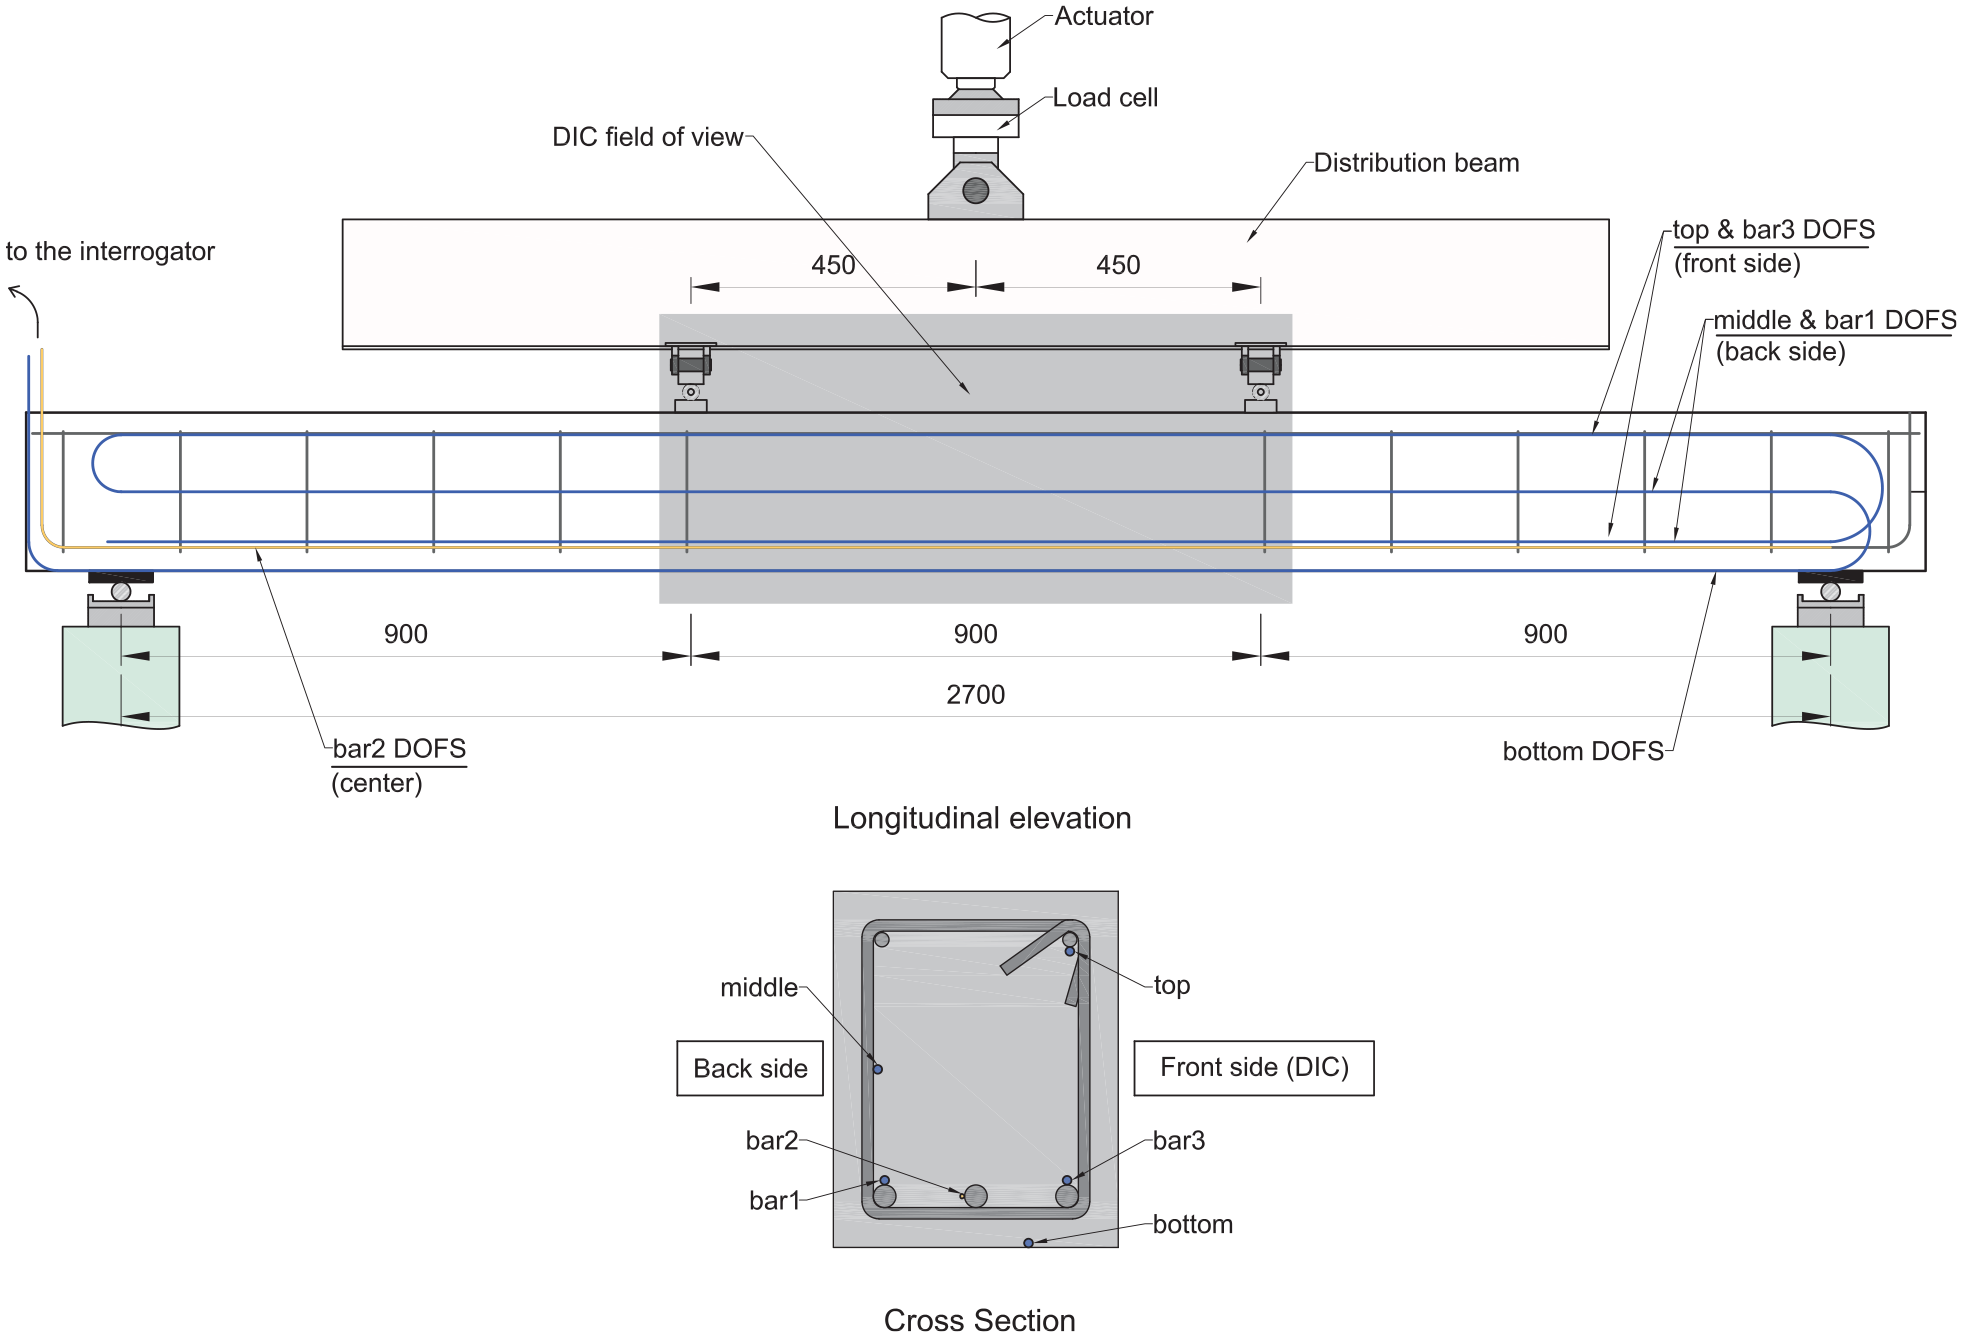
Loading setup and DOFS installation configuration for the RC beam specimens.
Results and discussion
DOFS strains in bare reinforcement bar under uniaxial tensile load
The main objective of the uniaxial tensile tests was to assess the accuracy of robust DOFS compared to conventional axial extensometers versus the more widely investigated thin DOFS. Figure 4 illustrates the evolution of the strain measurements obtained by the extensometer over time for the three load cycles performed. In the same plot, the averaged value of the DOFS strain measurements over the rebar’s central 50 mm is also depicted for both the thin and robust DOFS. The results showed a consistent difference of only 8 µε between the two DOFS, but a slightly larger difference between the DOFS and the extensometer. In particular, the greatest difference was observed at the peaks, where the DOFS exceeded the extensometer readings by 40 µε, and at the valleys, where the extensometers and the DOFS differed by 24 µε.
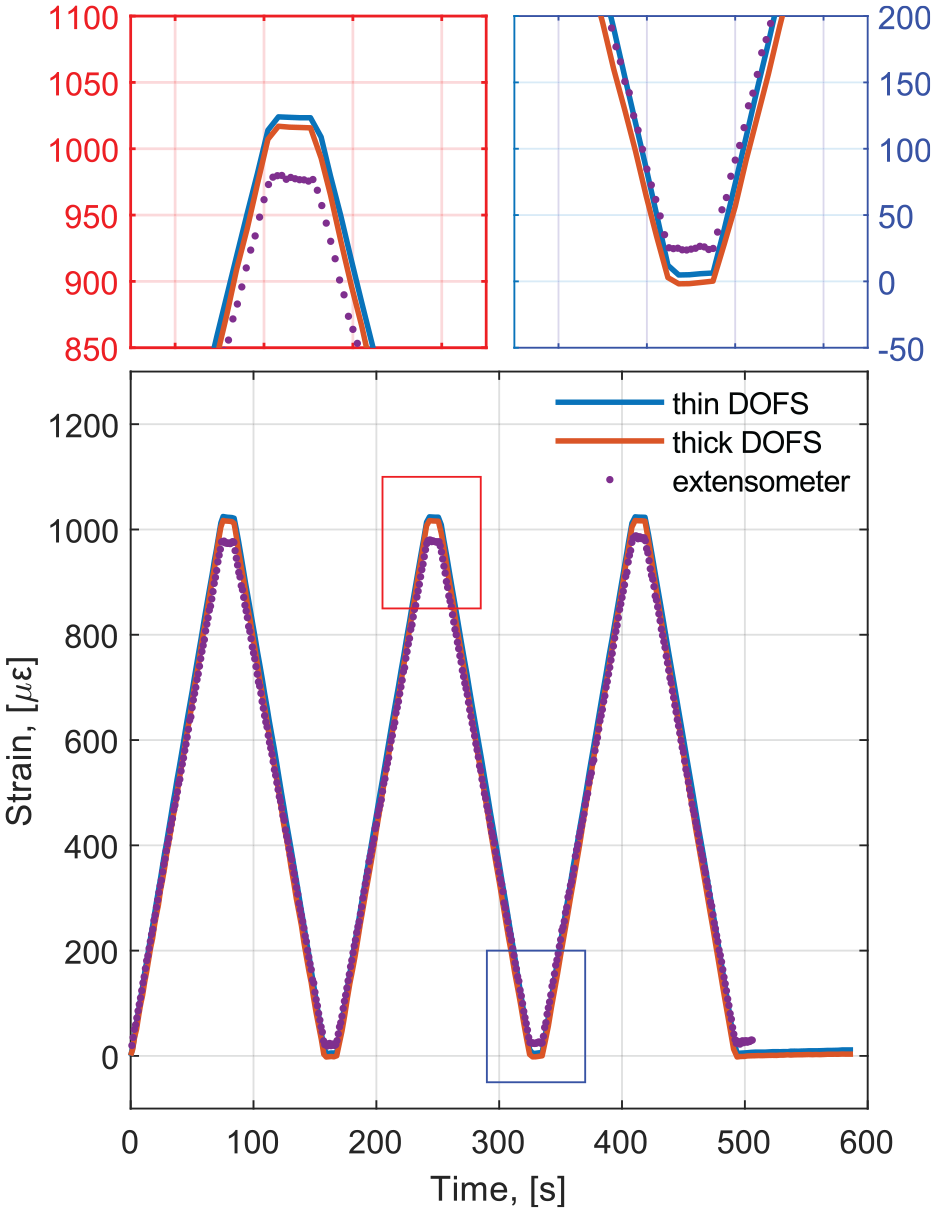
Comparison of mean DOFS strain and extensometer strain for thin and robust DOFS installed in a bare reinforcement bar subjected to three cycles of loading under uniaxial tension. The top plots display a zoomed view of the highlighted areas in the bottom plot.
Considering that in the uniaxial tensile tests the bars were completely unloaded between cycles, it can be inferred that the DOFS, in this case, provided more accurate results than the extensometer, which displayed a residual strain at zero load. This might have been caused by a small slip of the springs keeping the extensometer fixed to the rebar, which would then measure a smaller displacement than the initially accumulated, thereby reducing the total range as occurs in Figure 4. Moreover, a small difference in the calculated average strain could be also attributed to the effect of the transverse ribs. Nevertheless, the most noteworthy result from the uniaxial tests is that, as expected, in the absence of large strain gradients, robust DOFS perform similarly to thin DOFS, and thus, the effect of the external cladding can be regarded as negligible.
DOFS strain profiles in RC beams under four-point bending
Despite the good agreement observed between thin and robust DOFS in the previous section, there are several factors that may have a significant impact on the robust DOFS measurements when embedded in concrete. First, the non-uniform field of strains along the span of the beam will mobilize the shear response of the coating in the case of perfect bonding. Second, the appearance of cracks in the concrete will create steep strain gradients in the reinforcement bars. In that scenario, the strain transfer between the rebar and the DOFS would be sensitive to the properties and the thickness of the adhesive used as well as of the fibre coating/cladding. Nevertheless, both carving a notch along all the reinforcement bars in a structure to accommodate the robust DOFS and using adhesive to bond the robust DOFS to the rebar surface seem impractical solutions in real-scale projects. Therefore, robust DOFS were not directly bonded to the rebar, but instead were simply embedded in the concrete and fixed to the reinforcement with electrical tape, thereby providing strain measurements that might, in principle, differ from the thin DOFS bonded to the reinforcement. This aspect is investigated in the following.
Comparison of DOFS performance and data pre-processing
The strain profiles for two different load levels measured by the thin and robust DOFS for beam 2 are presented in Figure 5(a) and (b), respectively. The comparison of both figures immediately reveals clear differences in the strain output of the two DOFS. The measurements acquired by the robust DOFS feature a continuous strain profile with smooth slope changes and distinguishable strain peaks indicating the position, where bending cracks intersect the optical fibre cable. Despite the location of such strain peaks can still be identified in Figure 5(b), the strain measurements performed with the thin DOFS are irregular, with larger strain variations between peaks and valleys and affected by the presence of SRAs.
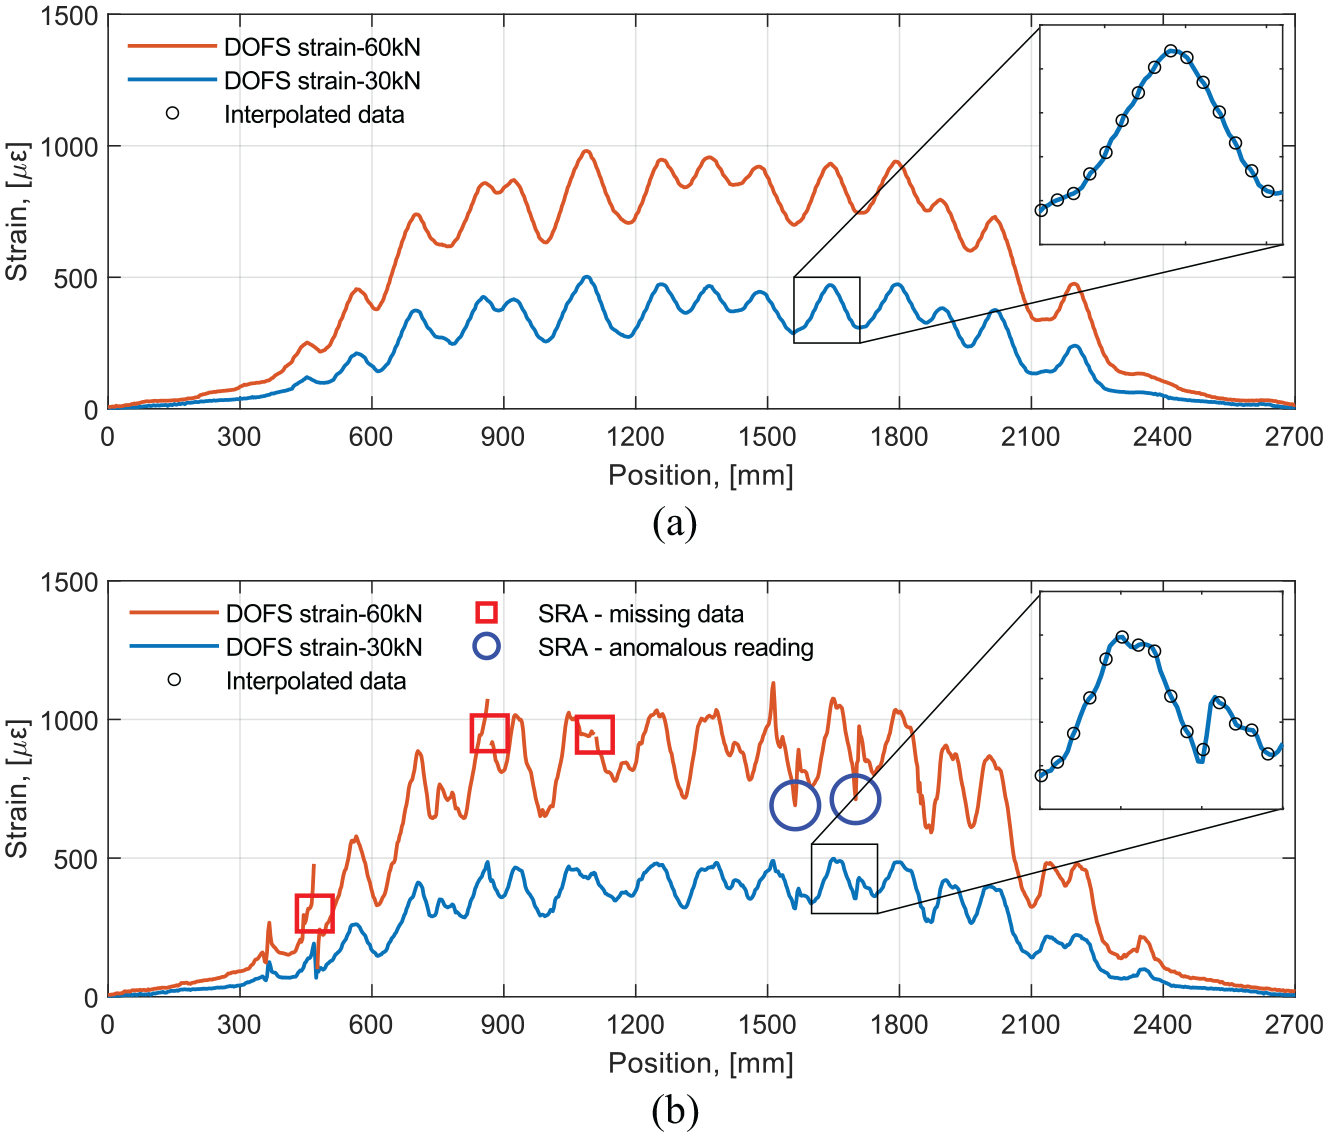
Comparison of distributed strain profiles obtained by DOFS embedded in an RC beam at two different load levels for (a) robust DOFS and (b) thin DOFS.
SRAs are inaccurate readings that manifest either as sudden changes of strain between two consecutive gauges leading to large strain peaks with no physical meaning, see blue circles in Figure 5(b), or as missing data points leading to discontinuous strain readings, see red squares in Figure 5(b). The presence of SRAs is highly undesirable as it gives rise to the potential loss of critical information, yet it is a well-known issue when embedding thin DOFS in concrete that has been reported by several researchers,17,30,37 often requiring the use of sophisticated post-processing algorithms to extract meaningful data. 31 Conversely, robust DOFS are less prone to suffer from SRAs since the protective cladding prevents the local clamping of the fibres upon cracking as well as other local effects that might impair the proper measuring of the fibre. However, the intermediate layers comprising the protective cladding produce an attenuation effect on the strain profiles leading to a reduction of the strain peaks and strains smearing over a longer length. Nevertheless, it can be observed that the magnitude of the strain profiles obtained by the two DOFS does not differ markedly; a difference that might be even overlooked if we consider that the measurements correspond to two different rebars. This indicates that, due to the combination of thickness and shear modulus of the cladding, this specific type of DOFS can provide a good estimation of the reinforcement strain even when the fibre is merely supported and fixed to it at discrete locations. It may be also observed that the differences between the two fibres are lower in the part of the beam corresponding to the coordinates between 900 and 1800 mm, as in this part the uniform bending derives on a uniform profile of strain, only disturbed by the presence of the cracks.
Furthermore, it should be noted that the obtained strain profiles did not require the high level of spatial resolution sampled by the DOFS with the current equipment settings, that is, 2.65-mm gauge pitch. Indeed, in Figure 5(a) and (b), a small region of one of the plotted strain profiles has been zoomed in together with the result of a piecewise cubic Hermite polynomial interpolation with a spatial resolution of 10 mm, displayed as black circles, illustrating that the features of the strain profiles can be effectively captured with larger gauge pitches, even for the thin DOFS. This finding had been previously discussed by Barrias et al. 37 and Brault and Hoult. 28 Consequently, the results discussed in the coming sections correspond to the analysis of the interpolated data with a spatial resolution of 10 mm.
Analysis of DOFS strains
In Figure 6, the strain profiles for the six different positions of the DOFS in beam 2 are presented for increasing load levels. As expected, the results followed the behaviour predicted by classical beam theory where the magnitude of the strain is maximum for the DOFS positioned at bottom and it decreases proportionally to the decrease in distance to the neutral axis, becoming negative for the DOFS positioned at the top reinforcement located in the compressive zone of the section. With respect to the load, the appearance of strain peaks, evidencing the formation of cracks, can be observed early in the loading process. Those peaks grow subsequently higher and more distinct with increasing load level.
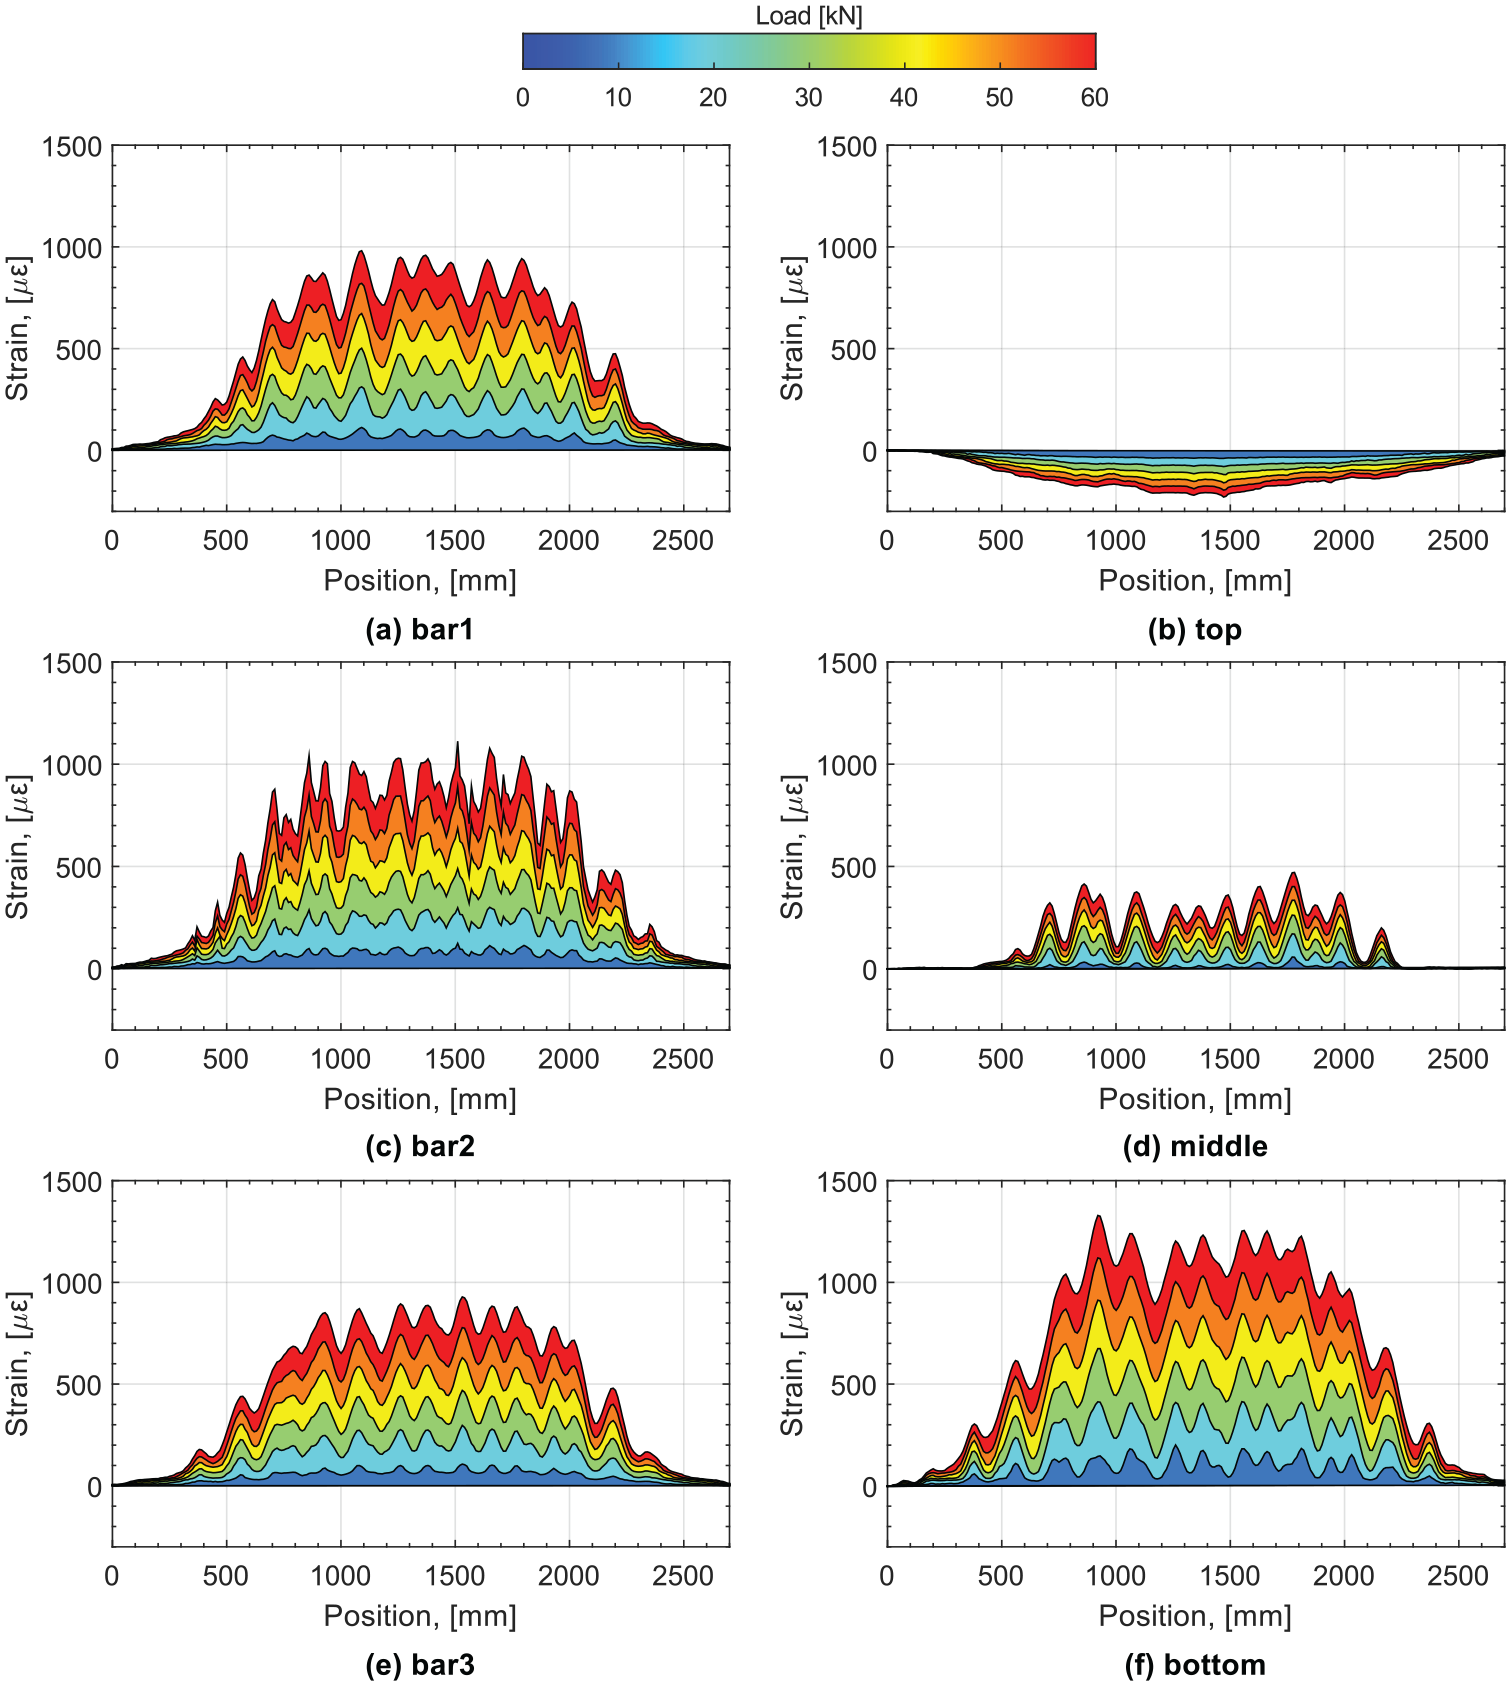
Comparison of strain profiles obtained by the different DOFS installed in beam 2 for increasing load levels.
A closer look to Figure 6(a) and (e) reveals that obvious differences exist between the strain profiles measured by the robust DOFS on the tensile reinforcement bars on either side of the beam. Although the maximum strain reached is similar in both cases, the number and the position of the strain peaks vary from one to another. Their variation in position indicates that cracks did not propagate perpendicularly to the main axis of the beam, whereas the difference in number suggests that either some cracks branched out towards one of the beam surfaces or some cracks did not fully propagate through the entire width of the beam.
The observation of different crack patterns on the front and back sides of the beam is further confirmed when comparing the strain profiles of the bar 1 and middle DOFS (Figure 6(a) and (d), respectively) and the strain profiles of the bar 3 and bottom DOFS (Figure 6(e) and (f), respectively). Indeed, despite the obvious difference in strain magnitude, the position of the strain peaks along the beam is in good agreement between the DOFS located in the same side of the beam, but differs with the DOFS located in the opposite side.
Assessment of beam deflections
In this section, a method is presented to calculate the beam deflections based on strain measurements from DOFS located at different heights of a beam. The suitability of the method, previously shown to yield good results with nylon-coated DOFS externally bonded to the concrete surface, 28 is here tested with robust DOFS embedded in the concrete. The method is based on the Euler–Bernoulli beam theory, which states that the deflection of a beam, y(x), fulfils the following relationship
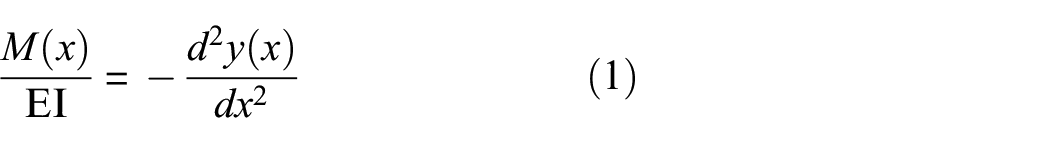
where M(x) is the bending moment distribution and EI is the flexural stiffness of the section which is constant for prismatic beams made of homogeneous linear elastic materials. The flexural rigidity is not constant in RC as cracks greatly decrease the flexural stiffness of the beam. However, the ratio M(x)/EI is equivalent to the curvature of the beam χ(x), which can be determined at any point of the beam as the change of normal strain per unit length across the beam’s height. As such, the curvature of the tested beams may be calculated based on the difference between the strains measured by two DOFS located at two different known heights. In this study, the DOFS located at the top and bottom rebars on the front side of the beam, that is, bar 3, were used to determine the curvature distribution along the beam according to
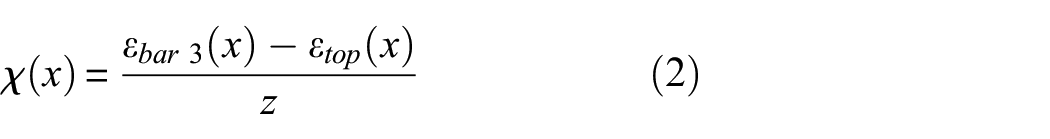
where z is the vertical distance between the DOFS taken as 155 mm in this study. Once the distribution of curvatures is determined for every point along the beam, the slopes and deflections can be determined by integrating the curvatures once and twice, respectively, and using two known boundary conditions to determine the integration constants. In this case, the boundary conditions applied were a null deflection of the beam at both supports corresponding to the simply supported scheme presented in Figure 3.
An example of the distribution of curvatures, slopes and deflection along the beam is presented in Figure 7 for beam 2 at peak load. As observed, the shape of the curvature distribution keeps a close resemblance to the strain profile due to the relatively smooth profile of the compressive strains. Therefore, the peaks in the curvature profile also indicate the location of cracks, which act like hinges exhibiting a greater curvature than in the surrounding uncracked concrete due to the local loss of flexural stiffness at the cracked sections. The slopes and deflections also follow the expected antisymmetric and symmetric distributions, respectively, according to the applied loading and boundary conditions.
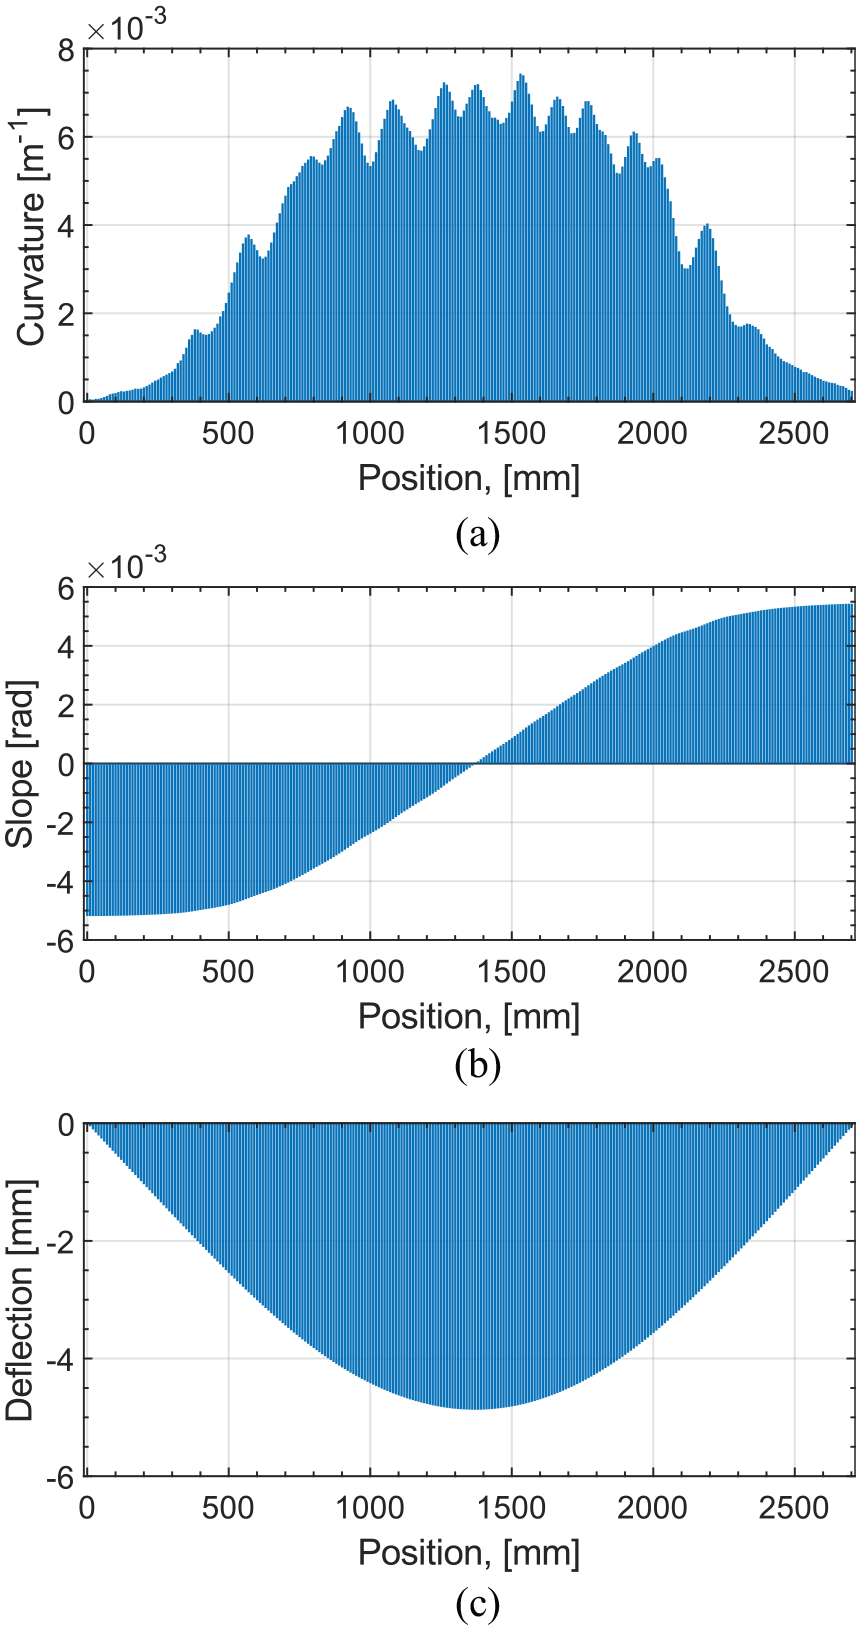
Result of computing distributed (a) curvatures, (b) slopes and (c) deflections for beam 2 at peak load from robust DOFS strain measurements.
In order to quantify the accuracy of the presented method, the evolution of the maximum deflection calculated by the robust DOFS was compared to the maximum deflection measured by the DIC system for the entire loading procedure. The results of the comparison for the three beams are presented in Figure 8(a) to (c). The absolute error computed as the difference between the values of the DIC and the DOFS and the relative error computed as the ratio between the absolute error and the DIC values are displayed in Figure 8(d) to (f).
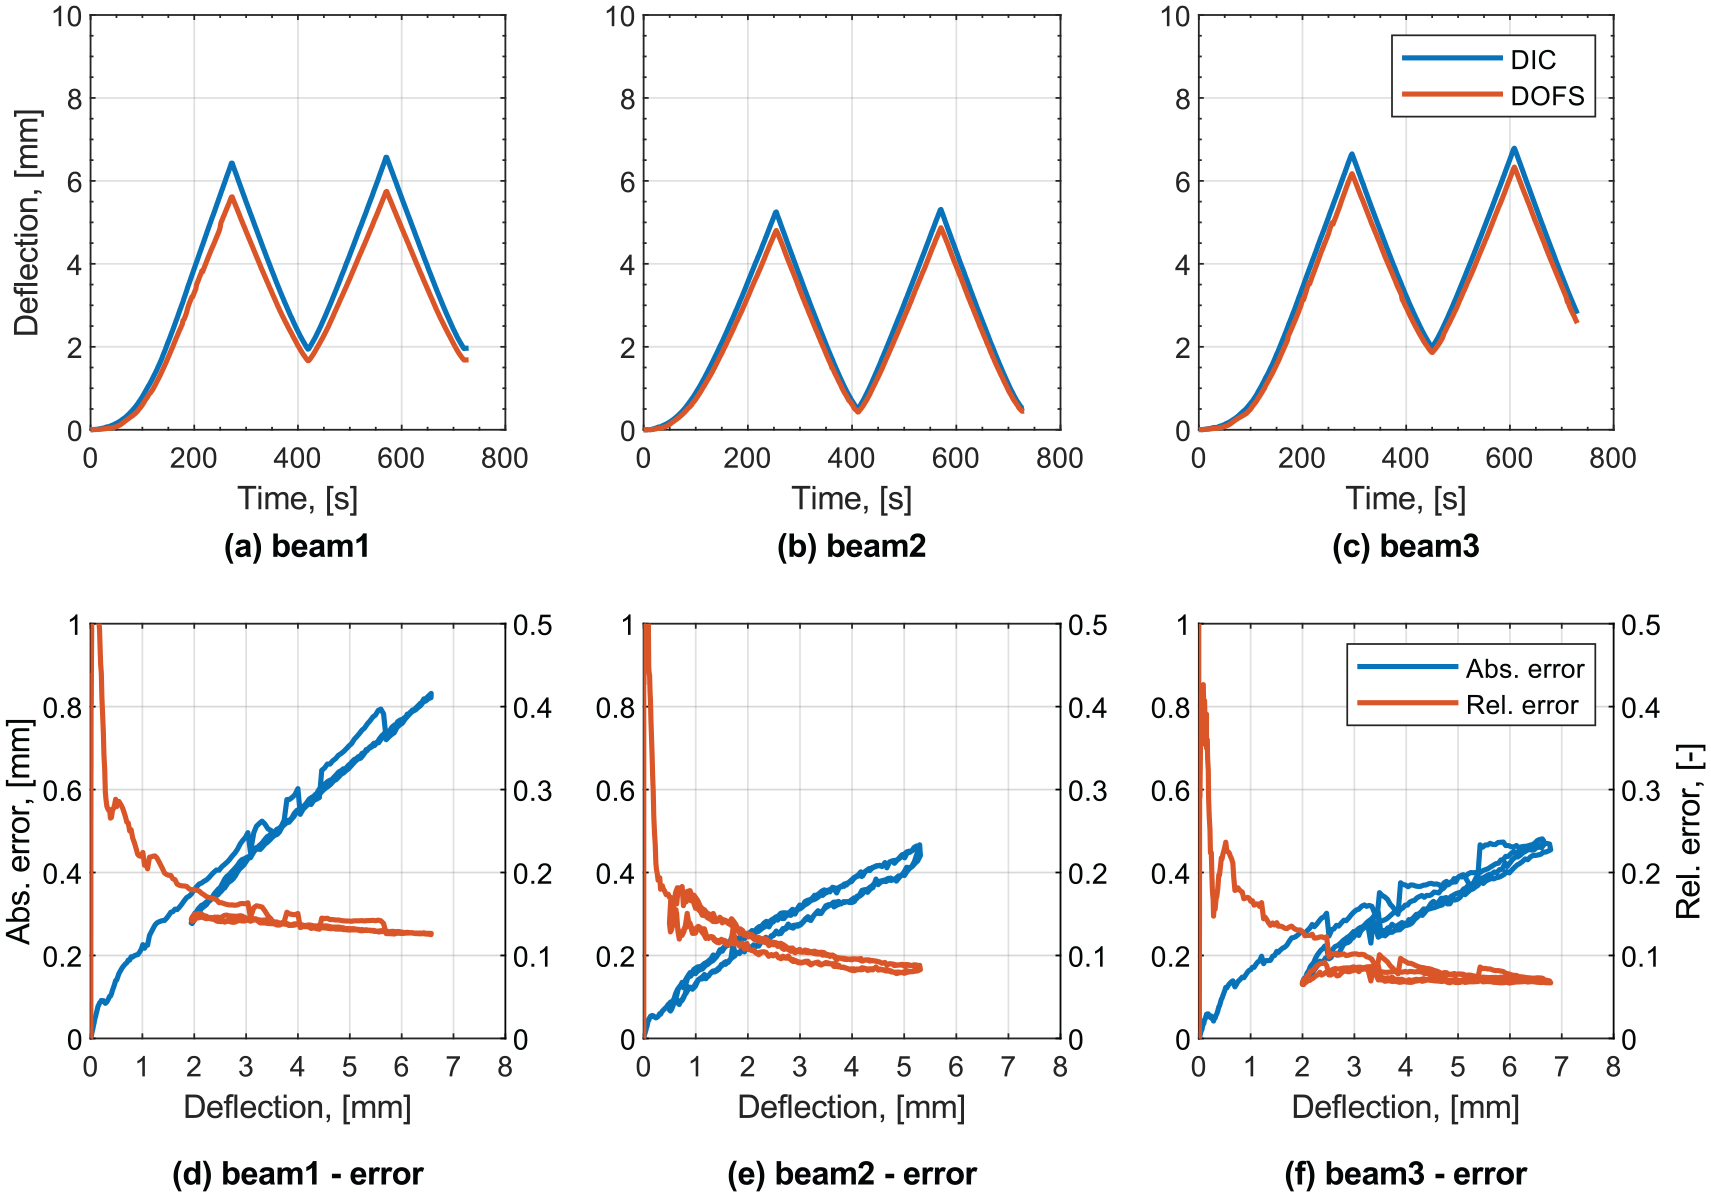
Comparison of deflections computed by DOFS strains and measured by DIC for beams 1, 2 and 3 (a to c) and their corresponding absolute and relative errors (d to f).
Overall, the deflections calculated by the DOFS showed a consistent underestimation compared to the deflections measured by the DIC. The maximum absolute error was found to increase with increasing deflection reaching a maximum of about 0.8 mm for beam 1 and about 0.45 mm for beams 2 and 3, at peak load. In relative terms, however, it can be seen how the error is very large at small deflections, but it decreases rapidly with increasing deflection, reaching relative errors of about 12.5%, 8.3% and 6.8% at maximum deflection for beams 1, 2 and 3, respectively.
The main source of error for the DOFS is most likely attributable to the aforementioned attenuation effect, which may smoothen the curvature profile and lead to an underestimation of the deflection. It must be noted, however, that the deflection values obtained by the DIC include the settlement of the supports, which is not accounted for in the DOFS calculations. Unfortunately, the support settlements were not measured; hence, the DIC could not be corrected. Nonetheless, this implies that the errors, both absolute and relative, between the DOFS and DIC were in fact smaller than the computed values, highlighting the potential of this technique for the assessment of deflections. However, as discussed by Brault and Hoult 28 and later experimentally verified by Poldon et al., 27 this method only accounts for flexural deformations which can cause significant errors when shear behaviour, due to the presence of large shear cracks, becomes dominant.
It is also worth noting that the larger discrepancy between deflections obtained by the DOFS and by the DIC observed for beam 1 is attributable to the poor performance of the DOFS located at the top bar. Indeed, a non-symmetric strain distribution with markedly lower strain values towards one of the supports was observed for that particular DOFS, which was most likely caused by a deficient bond with the concrete. This highlights the importance of ensuring a good bond between the robust DOFS and the concrete as well as the sensitivity of the presented method to the quality of the DOFS measurements.
Assessment of bending cracks
In this section, the ability of robust DOFS to simultaneously identify the position and calculate the width of multiple cracks in RC beams subjected to bending is investigated.
Location of cracks
As previously shown in section ‘DOFS strain profiles in RC beams under four-point bending’, the distributed nature of the strain measurements based on the Rayleigh scattering provides a straightforward way to identify the position of cracks, which appear as well-defined peaks in the strain profile. Moreover, unlike thin DOFS bonded to the reinforcement which often present a noisier signal with numerous SRAs and other minor spikes, robust DOFS do not require complex post-processing algorithms to analyse the strain data thanks to their smoother signal output. Conversely, the crack locations can be unequivocally identified as the local maxima in the strain profiles measured by robust DOFS.
Figure 9 shows the strain profiles of beam 1 measured by the DOFS in bar 3 for three different load levels, namely, 30, 40 and 50 kN, where the locations of the crack candidates, that is, those corresponding to strain peaks, have been identified based on the strain profile of the greatest load. In Figure 9, a picture of the two-dimensional (2D) strain field computed by the DIC at a load of 50 kN has also been added as an overlay to show the actual crack pattern on the concrete surface. In addition, the (re-scaled) surface strains along a horizontal line at the height of the tensile reinforcement, obtained from the DIC, have been drawn in the same plot to facilitate the comparison of the crack locations.
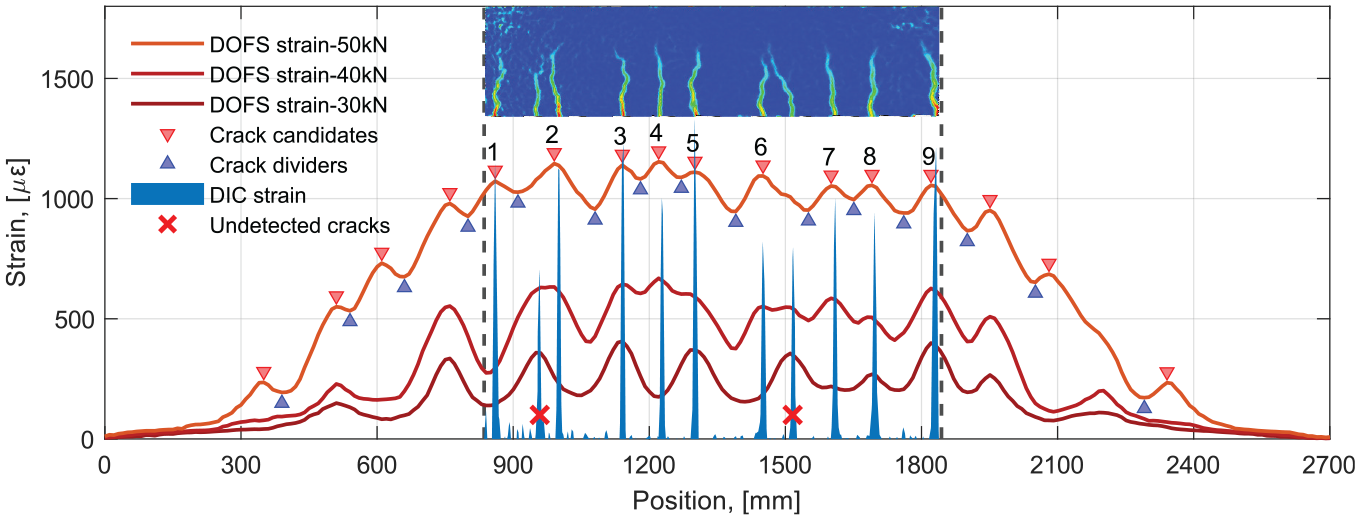
Determination of the location of individual cracks based on DOFS strain profiles and comparison with the crack pattern identified by the strain field measured with DIC. Note that DIC strains are re-scaled and plotted solely to illustrate the location of the cracks.
From Figure 9, it can be observed that 11 distinct cracks were formed on the concrete surface based on the DIC strain field, whereas only nine crack candidates (labelled in Figure 9) could be identified within the DIC measurement region by the DOFS. Out of the nine crack candidates, seven were successfully detected as individual cracks, the location of which was in perfect agreement with the DIC measurements. The remaining two crack candidates, namely, 2 and 6, corresponded, in fact, to two individual cracks each, for which the DOFS strain measurements displayed a convoluted strain peak instead of two distinct peaks. However, it must be noted that the undetected cracks, indicated in Figure 9 by a red cross, were clearly distinguishable in the strain profile corresponding to a load of 30 kN. The gradual merging of the strain peaks is likely due to the progressive deterioration of the steel/concrete bond with increasing load, which tends to redistribute the stresses. This observation indicates that, when using robust DOFS embedded in concrete, it is advisable to perform the crack detection as a recurrent process taking into account the load history in order to identify when the strain rise of a new forming crack merges with the strain peak of an already existing crack, thereby hindering their individual identification. The development of such algorithm is, however, outside the scope of this study.
Measurement of crack widths
Following the identification of the crack positions along the beam, the next challenge is to quantify their individual crack width. As discussed in section ‘Introduction’, several approaches have been proposed to estimate the width of multiple cracks using the DOFS strain measurements. In this study, the performance of an approach previously used by Berrocal et al. 26 for thin DOFS bonded to the reinforcement is investigated.
The mentioned approach is based on the mechanical models included in current structural design codes, for example, Eurocode 2 38 and Model Code 2010. 39 The principle behind those models is that the width of a crack equals the relative displacement between the reinforcement and the surrounding concrete occurring within a certain region at each side of the crack due to imperfect bond between both materials. As such, those models state that the crack width, w, can be calculated according to

where sr is the crack spacing and εsm and εcm are the mean strains at the reinforcement and concrete, respectively, which are commonly determined assuming a certain behaviour for the bond properties. The proposed method uses the same principle, but includes appropriate modifications to leverage all the information provided by the DOFS. Moreover, the following are assumed:
The DOFS strains are equal to the strains in the steel reinforcement.
The position of all cracks is known.
The concrete is stress free at cracked sections.
The moment between two consecutive cracks varies linearly.
The first assumption is in general not true, but, as discussed in section ‘Comparison of DOFS performance and data pre-processing’, for the type of fibre used in this investigation, the strains measured by the DOFS can be considered a good approximation of the reinforcement strains. Likewise, the second assumption is only conditionally true, as some cracks may go undetected using the proposed approach. Nevertheless, the ratio of undetected cracks is generally small, so the method is still applicable for the majority of correctly detected cracks. The third is a common assumption adopted in most situations involving the calculation of steel stresses in cracked sections, which together with the fourth assumption, yields that the non-linear strain variation between consecutive cracks must be caused by the stress transfer between steel and concrete due to bond action. All of the above enables to rewrite equation (3) as follows
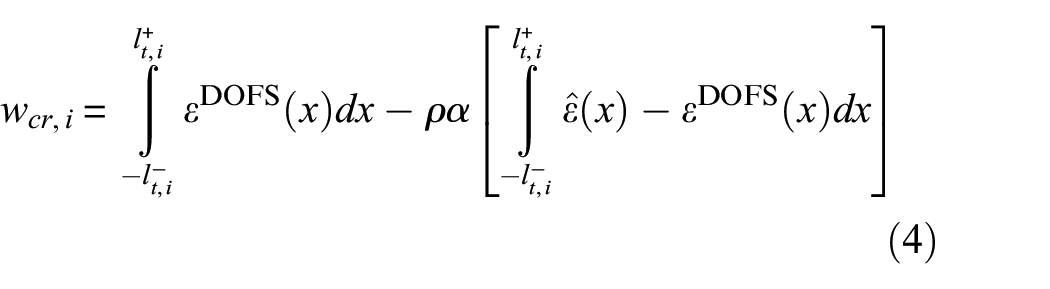
where εDOFS(x) is the strain measured by the DOFS,
Based on the described method, the crack width evolution of each crack identified by the DOFS was calculated. Figure 10 shows a comparison of the calculated crack width and the crack width measurements from the DIC for all the identified cracks in beam 1.
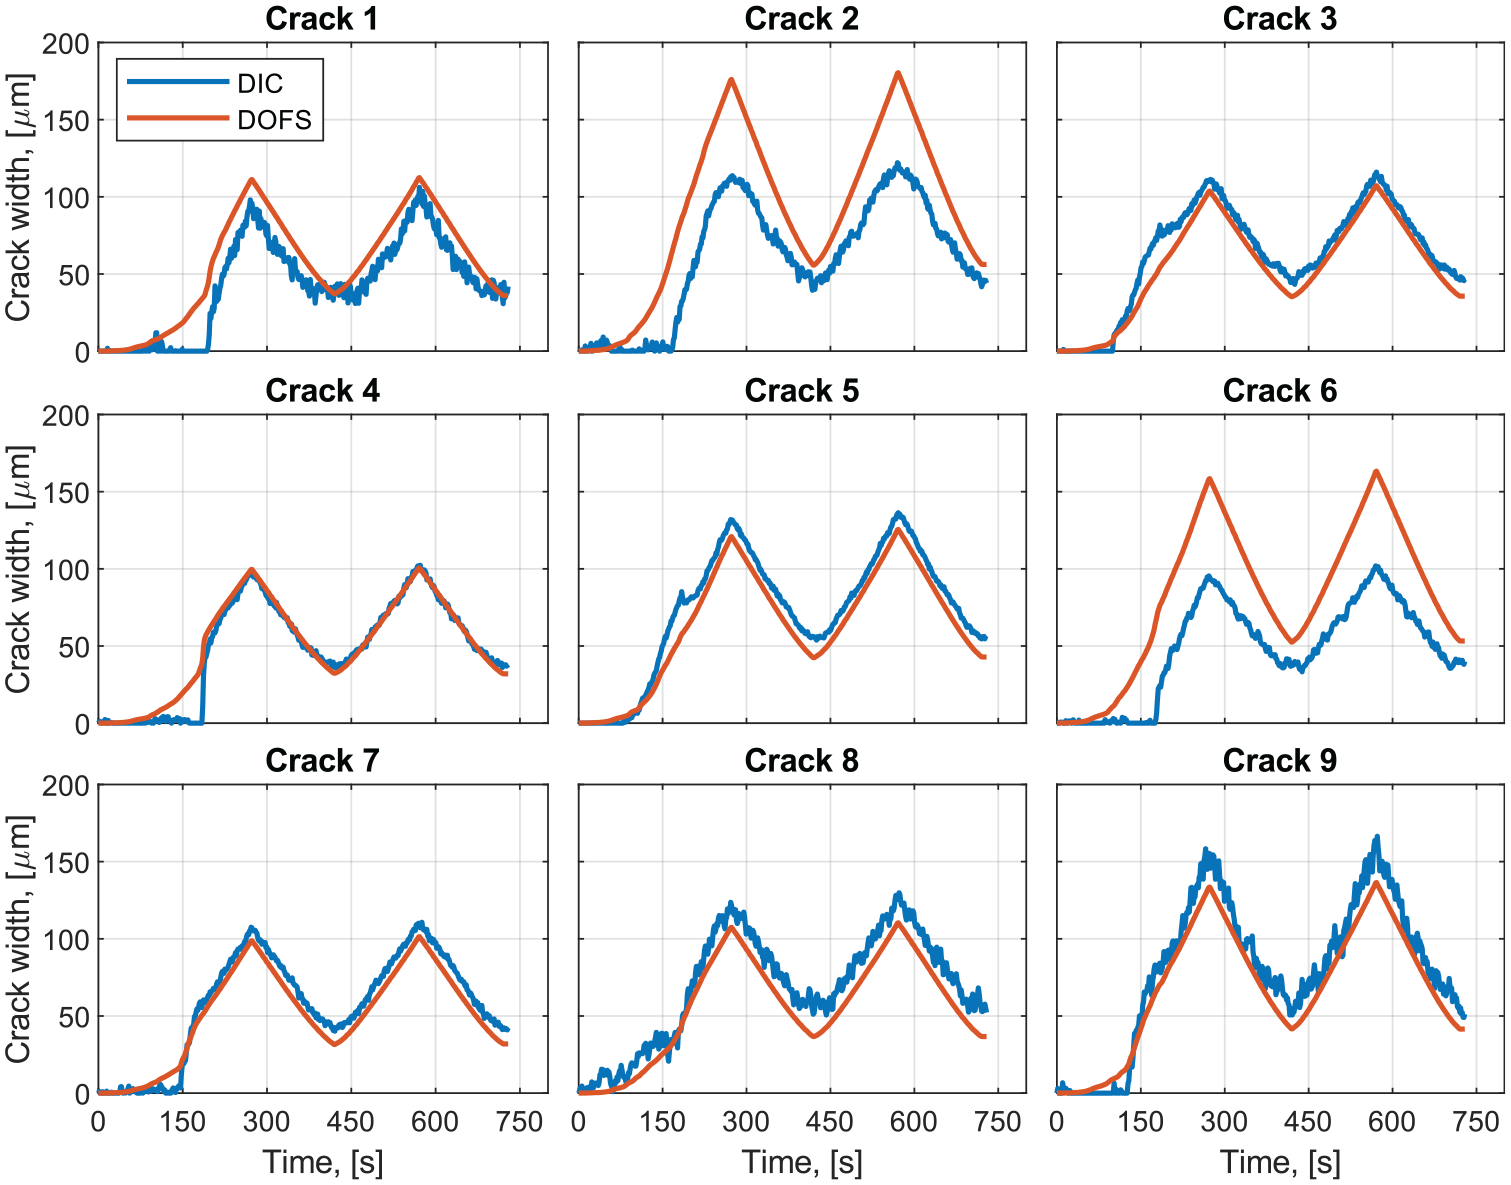
Comparison of crack width computed by DOFS strains and measured by DIC for the cracks identified in beam 1.
As observed, the proposed method can be effectively used to determine the crack width of multiple cracks in a beam with a single robust DOFS deployed in one of the tensile reinforcement bars. However, for the proposed method to provide reliable results, it is required that cracks are correctly identified and isolated, otherwise the resulting crack width corresponds to the summed values of two individual cracks, see crack 2 and crack 6 in Figure 10. Moreover, it is also apparent that in some cases, the proposed method yields a relatively large error in the beginning of the first loading cycle, see crack 1 and crack 4. This occurs when the cracks form at higher loads, causing cracks to open suddenly when a certain stress (and strain) was already built up in the reinforcement. Nevertheless, this effect is limited to the first time that a crack forms and is not visible when cracks reopen in subsequent load cycles. Based on that, the accuracy of the proposed method was tested by looking at the error between the DIC measurements and the DOFS-based calculations for the second load cycle only. The errors calculated as the difference between the DIC and DOFS measurements are presented in Figure 11 for all cracks in the three tested beams in the form of box plots, where the markers denote the median, the boxes are the 25th and 75th percentiles, and the whiskers extend to the most extreme values of the crack width errors.
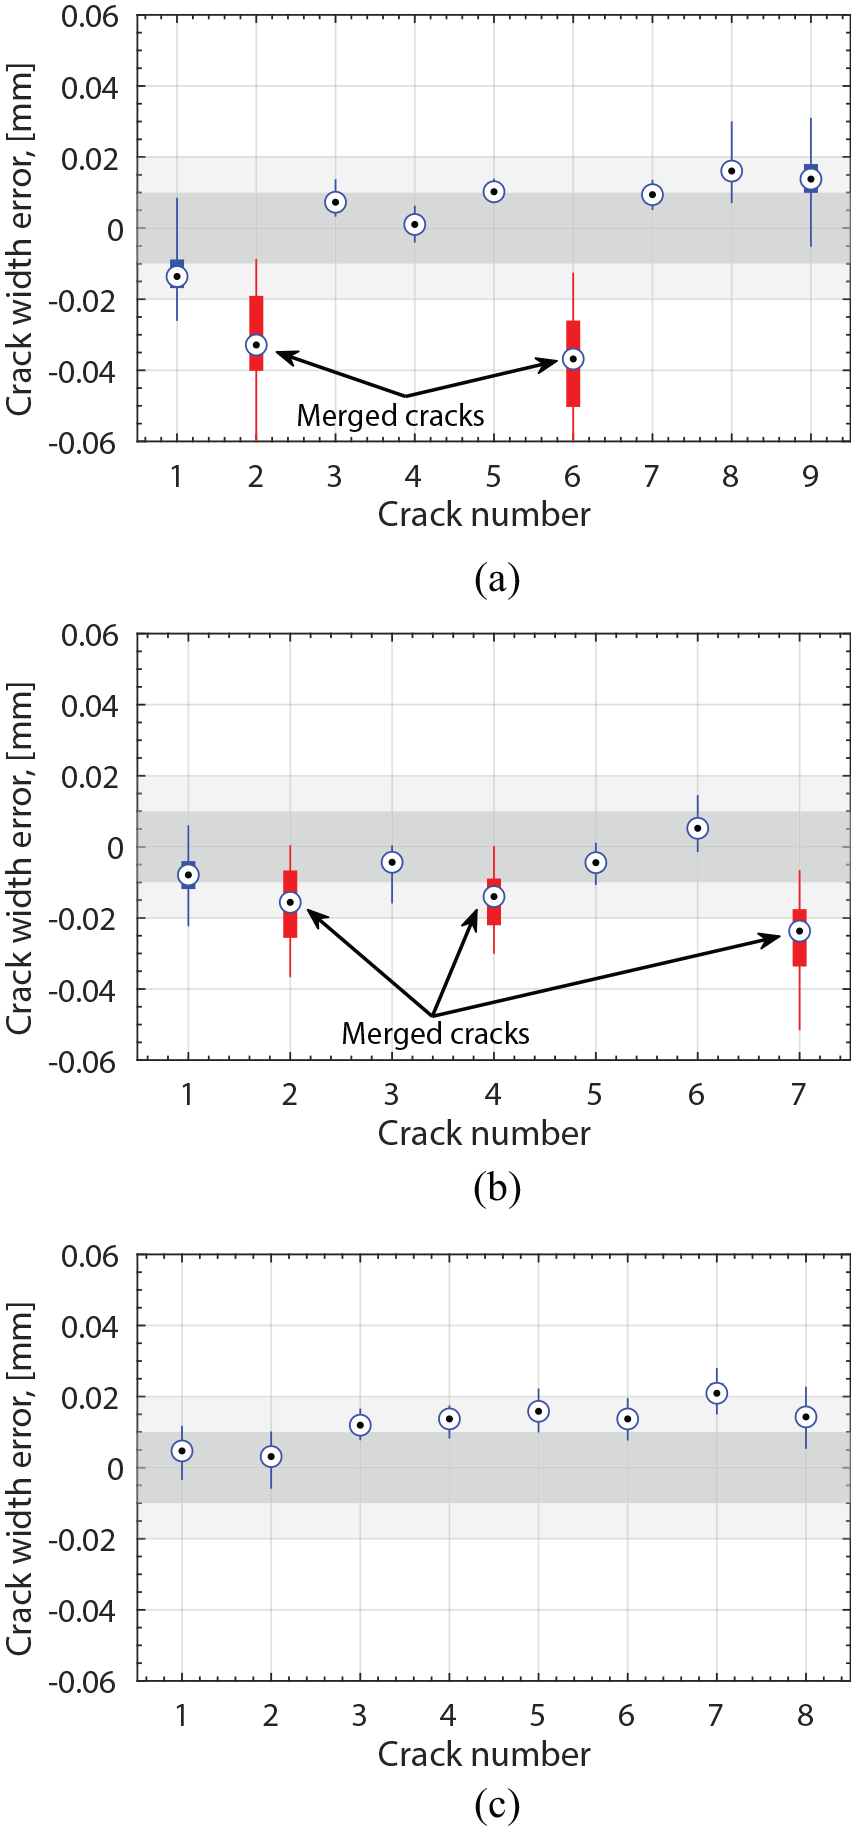
Measured error in the assessment of the crack width for all the individual cracks detected in (a) beam 1, (b) beam 2 and (c) beam 3. The red boxes indicate the cases in which two cracks were identified as a single crack from the DOFS strain profiles.
Two main findings are derived from the results presented in Figure 11: (1) the proposed method yielded crack width estimations with an error of ±0.02 mm with respect to the DIC results and (2) the proposed method exhibited a very low scatter as revealed by the size of the boxes. Moreover, the larger scatter of the extreme errors in Figure 11 is attributable to the noisier signal of the DIC results. It should be noted, however, that the validity of these findings is subjected to the condition that individual cracks are correctly identified. Furthermore, it is worth highlighting that the results presented include only small cracks of up to 0.15 mm, which is relevant for structures with tight crack width limitations as well as for serviceability analysis. Nevertheless, the accuracy of the proposed method for larger crack widths remains to be further investigated.
Post-processing of DOFS strain for visualization of crack patterns
For SHM systems to be of practical use, the analysed data must be conveyed to engineers and decision-makers in a clear and accessible way. In the case of crack monitoring in RC structures, the potentially large number of existing cracks can pose a challenge when delivering critical information. One of the most straightforward and intuitive ways to present such information is through contour plots, similar to those often used in the post-processing of finite element analyses (FEA). Consequently, in this work, the possibility to post-process the DOFS strains in an analogous way as in FEA in order to produce contour plots has been explored.
The procedure developed in this study involves five main steps and departs from the assumption that DOFS measurements are available for, at least, two different heights intersected by cracks. In this case, the bar 1 and middle DOFS of beam 2 will be used as an example. In the first step, new fictitious strain profiles are created at different heights in order to obtain a smoother description of the cracks along their height. This step could be skipped if DOFS measurements were available at additional positions along the height of the beam. However, a trade-off exists between the extra cost of installing additional fibres and the level of detail of the post-processed results.
In this example, two additional strain profiles are created, one at the bottom of the beam and one between the two profiles measured by the DOFS. The intermediate profile is interpolated by simply taking the average between the two measured profiles, whereas the bottom profile is extrapolated based on the assumption that plane sections remain plane, using the curvature calculated from the measured profiles according to
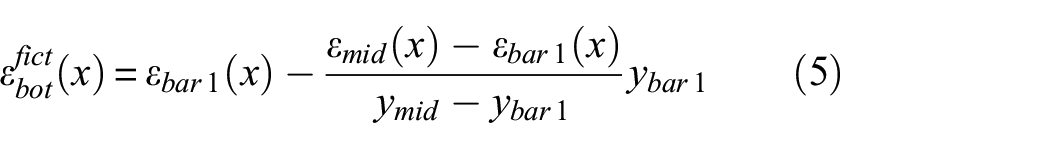
where
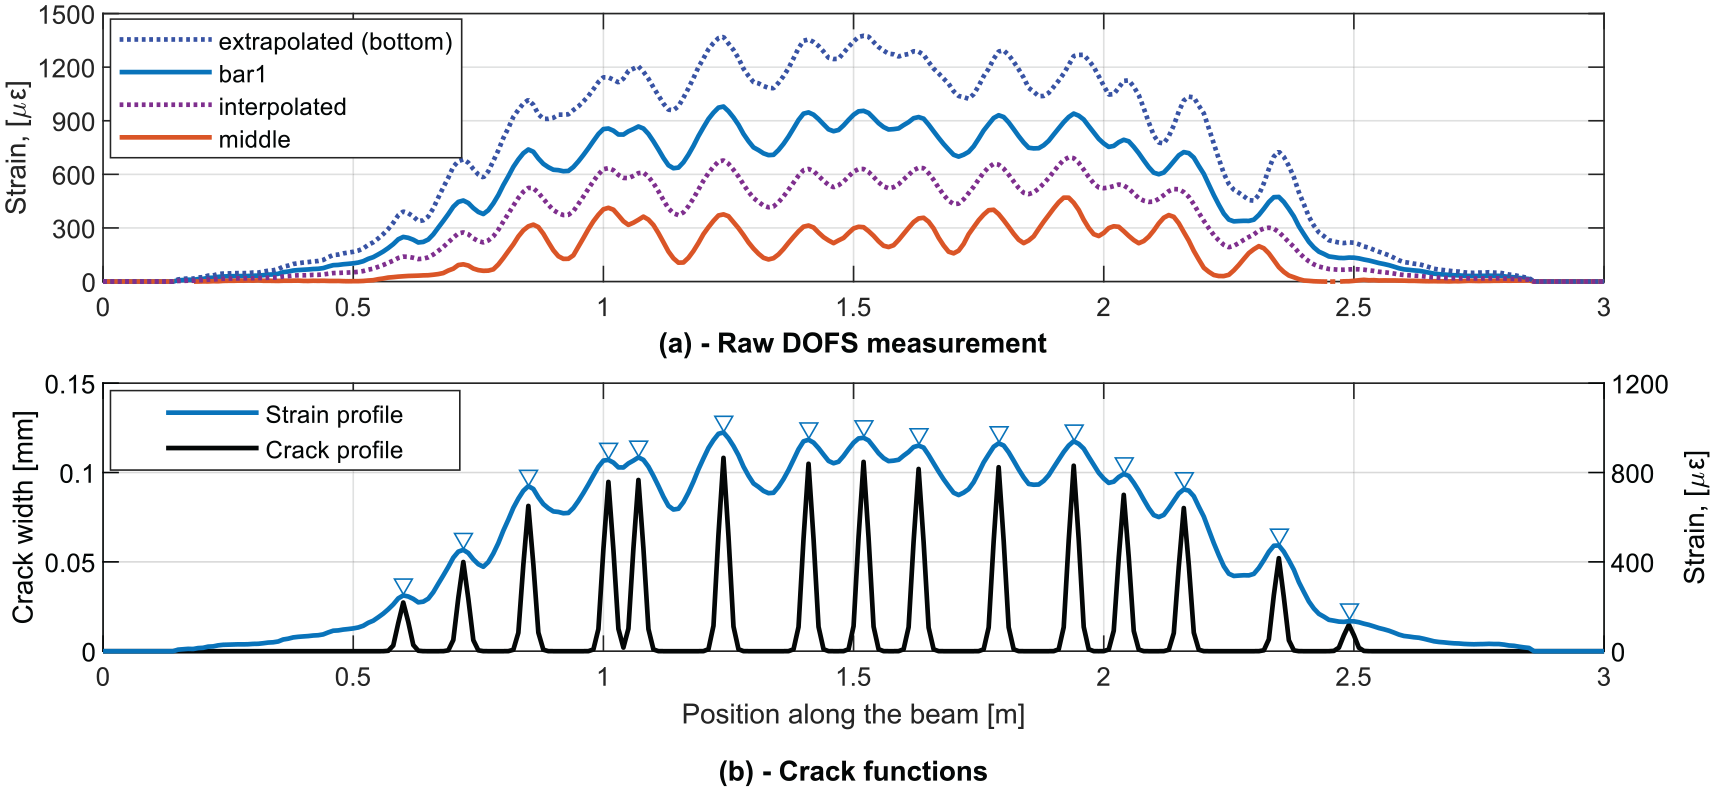
Post-processing steps for obtaining the crack patterns from DOFS profiles: (a) step one: creation of fictitious strain profiles from measured strain profiles and (b) step two: generation of crack functions including information about the location and width of cracks.
Next, the strain profiles need to be converted into crack profiles that hold the relevant information about the cracks, namely, their position and width. This information is obtained as described in sections ‘Location of cracks’ and ‘Measurement of crack widths’, respectively. In order to create a continuous crack profile that contains the information of all the cracks, a spatial function hereafter referred to as ‘crack function’ is generated for each individual crack. The ith crack function is zero everywhere except in the vicinity of the ith crack coordinate, where its peak value equals the width of that crack. In this study, crack functions were generated using a Gaussian curve due to their continuous nature, which facilitates their numerical implementation. However, other functions such as triangular and rectangular piecewise functions would have been equally suitable. By adding the individual crack functions of all the cracks identified in a strain profile, a crack profile as the one illustrated in Figure 12(b) can be obtained.
It should be noted that since the method to obtain the crack widths assumes that the DOFS provide a measurement of the reinforcement strains, its application on strain profiles that do not correspond to a reinforcement bar is not strictly correct. However, since the magnitude of the different strain profiles is almost proportional to distance to the neutral axis, the resulting crack widths will also be proportional. Therefore, this method provides wedge-like cracks, which is considered a good estimate for elements with a dominating bending behaviour.
After creating the crack profiles for all the selected sections, these must be superimposed onto a mesh representing the surface of the beam, each crack function at its corresponding height. The purpose of the mesh is twofold. On one hand, the nodes of the mesh are the query points, where the known data points in the crack functions will be interpolated. On the other hand, the elements of the mesh serve as the canvas, where the interpolated results can be drawn to generate the contour plots. In Figure 13(a), the superposition of the four crack profiles onto a structured mesh grid with 1 cm × 1 cm square elements is illustrated for the central part of the beam. Note that a fifth profile, the value of which is equal to zero in all points, has been added at the position of the compression reinforcement since the negative strains observed during the test indicate that no cracks reached that height; hence, the crack width is zero. It should be also highlighted that a certain interdependency exists between the crack functions and the mesh size. Indeed, in order to visualize cracks in a clear way, each crack function must be non-zero over a few nodes of the mesh. Accordingly, in this example, each crack function was non-zero over five nodes; hence, the crack width is represented across four elements.
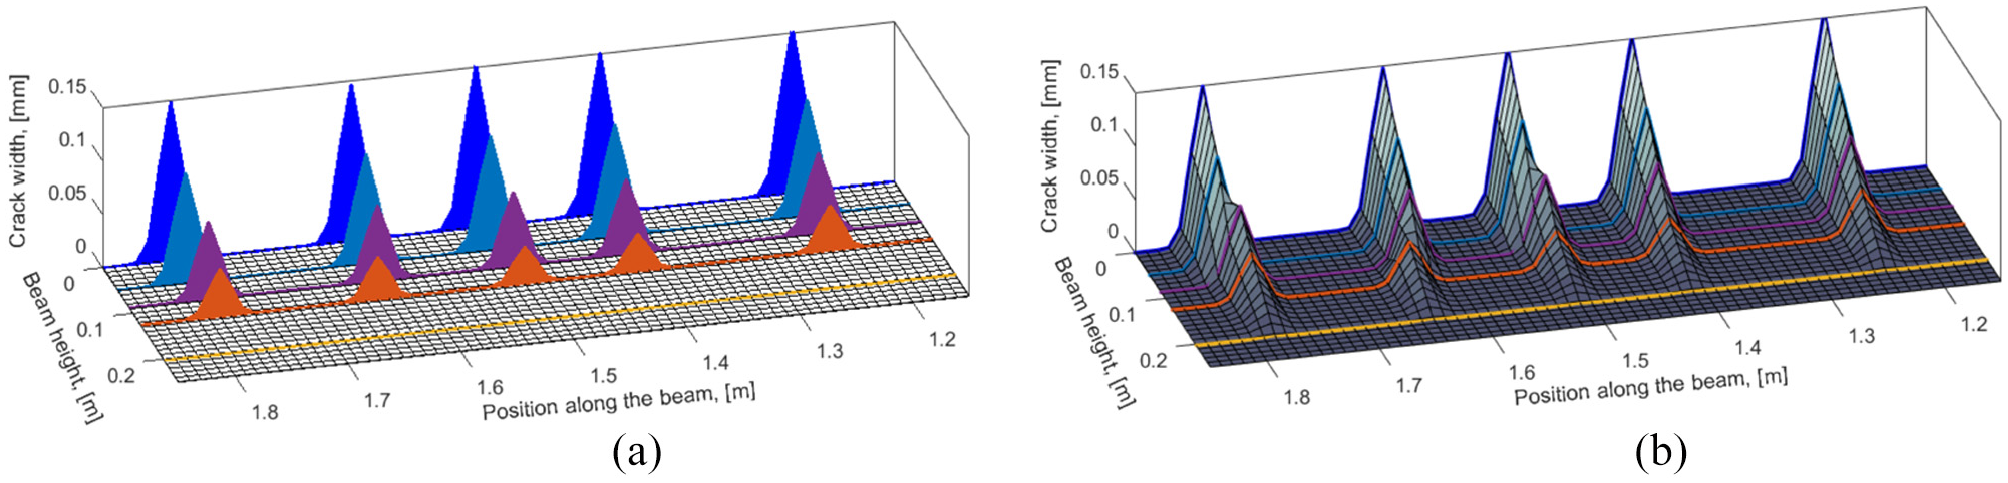
Post-processing steps for obtaining the crack patterns from DOFS profiles: (a) step three: superposition of crack functions on a structured grid mesh representing the beam surface and (b) step four: result of a 2D linear interpolation of the known data points of the crack functions on the query points in the mesh nodes.
Subsequently, a scattered interpolant is used to create a 2D linear interpolation between the known data points (the crack functions) and the query points at the nodes of the mesh. The scalar field resulting from the 2D linear interpolation is shown in Figure 13(b) as a surface plot. Finally, the scalar field obtained through the 2D linear interpolation is used to create a gradient fill of the mesh elements, using the colour scale to indicate the magnitude of the crack width.
The crack contour plot obtained after completing all the steps is shown in Figure 14. As observed, the final result of the described procedure provides a quick and straightforward way to read critical information about the cracking condition of RC elements. Furthermore, this type of data post-processing can be of interest for several applications in many active areas of SHM, such as digital twins and augmented reality inspections. Unfortunately, the validity of the contour plot could not be verified with the results of the DIC measurements since these were taken on the front side of the beam, where only one DOFS providing information about the cracks was available, that is, bar 3. Consequently, additional experiments are required to validate the proposed methodology for different types of cracks, namely, tension, bending and shear cracks, as well as their evolution with increasing load levels.
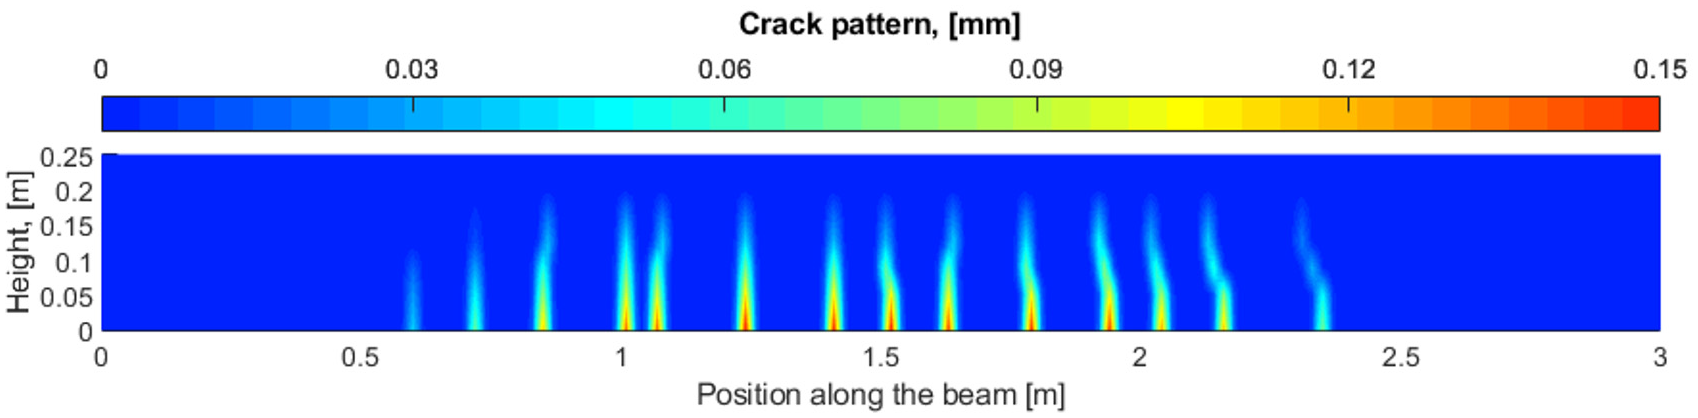
Resulting contour plot describing the crack pattern on the backside of beam 2 at load level of 60 kN.
Conclusion
This article investigates the suitability of DOFS for the assessment of performance requirements, namely, deflections and cracking, in RC structures. The performance of robust fibre optic cables with a protective cladding, well-suited for field applications, was examined through an experimental programme including uniaxial tension tests of bare reinforcement bars and flexural tests of large-scale RC beams. The following conclusions were drawn:
Under uniaxial tension, the robust DOFS exhibit a performance comparable to that of thin DOFS, provided that a good bond with the substrate material is ensured. In the presence of large strain gradients (cracking), however, the protective cladding causes an attenuation effect of the strain peaks both in magnitude and in prominence, resulting in a smoother signal. Nevertheless, the comparison between thin and robust DOFS showed that despite the attenuation of the latter, the robust DOFS still provided accurate measurements.
In addition to protecting the fibre core, the outer sheath of the robust DOFS eliminates to a large extent the appearance of SRAs, which are a well-known issue with thin DOFS when embedded in concrete.
The double integration of sectional curvatures computed from strain measurements of robust DOFS deployed at different beam heights proved to be an effective method to determine the distribution of deflections in RC beams with dominant flexural response and constant bending in a large area. The relative error of DOFS measured against DIC measurements exhibited a decreasing trend with increasing load reaching asymptotic values of between 12.5% and 6.8%.
The strain profiles measured by embedded robust DOFS enable the direct detection and location of cracks in RC beams through the identification of distinct strain peaks as verified by DIC measurements. However, in certain cases, a secondary crack may grow close to an existing one, leading to a convoluted strain peak that prevents the distinction of two cracks. This issue can be avoided by considering the strain history.
A method to calculate crack widths through the integration of reinforcement strains over a certain length adjacent to the crack was shown to yield errors below 0.02 mm for cracks of up to 0.15 mm, despite robust DOFS were not bonded to the reinforcement. However, the method is very sensitive to the correct identification of individual cracks.
A post-processing procedure was devised to show that intuitive contour plots of the beam’s crack pattern can be generated based on the strain measurements of DOFS deployed at different beam heights. This type of plots takes full advantage of the unprecedented capabilities of distributed optic sensing to communicate critical information to relevant stakeholders in a clear and straightforward manner.
Further experimental work needs to be conducted to assess the validity of the methods presented for a wider range of case scenarios including different types of cracks, varying loading conditions, wider crack openings and long-term cyclic loading.
Footnotes
Declaration of conflicting interests
The author(s) declared no potential conflicts of interest with respect to the research, authorship and/or publication of this article.
Funding
The author(s) disclosed receipt of the following financial support for the research, authorship and/or publication of this article: This research was performed as part of the project: ‘Sensor-driven Cloud-based Strategies for Infrastructure Management – SensIT’ funded by the Swedish Transport Administration (Trafikverket) under the grant TRV/BBT 2017-028.