
Abstract
The article proposes a methodology for assessing the development of damage in building structures, subjected to differential settlement and uplift, using the analysis of Interferometry Synthetic Aperture Radar (InSAR) data. The proposed methodology is targeted towards general applicability, capable of providing assessment results for measurements over wide geographic areas and for varying structural typologies. The methodology is not limited to ground movement measurements linked to tunnelling, as is the common case. Instead it extends to the monitoring of arbitrary movement in buildings, for example, due to ground consolidation, water table changes or excavation. The methodology is designed for use alongside patrimonial building databases, from which data on individual building geometry and typology are extracted on a region or country scale. Ground movement monitoring data are used for the calculation of the building deformation, expressed in different types of deformation parameters. The combined use of this data with analytical models for settlement damage classification in building structures enables the assessment in patrimonial building structures, at a country scale. The methodology is elaborated and applied on the patrimonial inventory of Belgium for the evaluation of potential settlement and uplift damage on buildings over a period of nearly three decades. The analysis results are compared to on-site observations.
Keywords
Introduction
State of the art
Ground settlement and uplift can impose severe demands on buildings in terms of applied deformation. It can cause cracking of non-structural and structural elements alike, leading to the loss of structural integrity, loss of aesthetic or cultural value and a reduction of functionality. Both building and infrastructure are subject to these effects. Buildings and installations located in cities are particularly prone to ground movement due to urban densification, development and intensification of land use. Masonry structures, in particular, can be very vulnerable to differential ground movement due to their weight, stiffness and brittleness.1,2 Urban development in the coming decades is expected to extract a heavy toll on existing buildings, with historic masonry construction, both monumental and vernacular, being at high risk. Assessing the potential damage to buildings affected by tunnelling in urban areas can be extremely costly and time-consuming. 3
Ground settlement and uplift are caused by a wide variety of human activities and natural phenomena. These include soil consolidation, heavy surface construction, tunnelling, excavation, mining, water pumping (or its cessation due to deindustrialization) and changes in land use.
The changes in the ground surface due to settlement or uplift can be measured and monitored using both terrestrial means, such as geodetic and levelling surveys, 4 and air- or space-borne methods, such as persistent scatterer interferometric synthetic aperture radar (InSAR for short).5–7 The former can be time-consuming and involve manual effort but are able to provide accurate measurements over relatively large areas. The latter can be acquired automatically but may require significant processing and interpretation effort. Thus its application has been mostly limited to single buildings or areas of limited expanse.7–9
InSAR measurements can be used for the reconstruction of the settlement profile over any desired geographical extent, centred around a single building or over an expansive area. In the absence of surface construction or other impediments influencing its shape, this profile is called the greenfield profile. Following the acquisition of monitoring data, the greenfield profile can be approximated through curve fitting or interpolation.
Certain causes of settlement, such as tunnelling 7 or mining 10 with a known trajectory, depth and cross-section, result in a greenfield curve that can be empirically estimated with good accuracy. In such a case, a relatively small number of measurement points can be sufficient for a reasonable determination of the greenfield profile. However, in the case of other causes, such as water table changes, soil consolidation and surface loads, unpredictable greenfield profiles may be produced. A small number of monitoring points may not be sufficient for the accurate determination of the greenfield profile in such a case.
The determination of the greenfield profile is critical for the calculation of the imposed loads on building structures at the surface due to ground movement. Analytical models for damage classification in buildings subjected to ground settlement rely on the calculation of the settlement function along lines representing the façades of the building or an area representing its plan. An analytical expression for the greenfield curve allows a quick and straightforward application of these damage classification models.
In the case of sparse InSAR measurement points, the reliability of the calculated greenfield curve is reduced due to lack of this data and interpolation errors. Simple polynomial curves may exaggerate or underestimate the actual profile, as well as miss the measured peaks in the vertical ground movement. Radial basis function networks capture the peaks of the profile, which are of high interest, but large distances between points severely reduce the accuracy of the interpolation.
The assessment of strain and damage in structures due to ground movement can be calculated analytically or numerically. Empirical models impose limits to the building strain, tilt, deflection ratio or angular distortion for a set of limit states and are regularly employed in analytical modelling. 11 The superstructure is modelled simply, often as a beam or plate, 12 and its deformation generally follows the greenfield profile, thus disregarding uplift and slip. Other models are used to classify existing damage according to the level of difficulty in their repair. 13 The so-called relative stiffness methods take soil–structure interaction into account, but generally rely on design charts assembled for settlement due to tunnelling.14,15 Simple limits have been adopted for allowable deformations in buildings by design codes. 16 Numerical solutions are complicated, expensive and uncommon in the literature.17,18 Finally analytical approaches, calibrated against a numerical/experimental benchmark, have been proposed 19 and recently expanded for application in different structural typologies. 20
Objectives
This article aims at the development of a method for the determination of damage to buildings due to ground settlement and uplift at the country scale. The greenfield curve around each building of interest is calculated from InSAR monitoring data over a given time period. Patrimonial information databases are used for the determination of the building type. Analytical damage models are used for the evaluation of the ground movement damage.
The method is, in principle, suitable for the analysis of buildings situated in areas of any measurement point density. It is mostly intended, however, for the analysis of areas where only sparse InSAR data are available. The proposed framework is suitable for the assessment of individual structures over geographic extents up to the country scale. Therefore, it aims at being as general and computationally efficient as possible.
First, the data acquisition, processing of model input and modelling approach itself are presented. Second, the results of the developed model are compared to examples from the literature. Third, the models are employed in a sensitivity study using generated structural and loading data. Finally, an outline of the analysis results for Belgium is given, involving thousands of architectural heritage buildings.
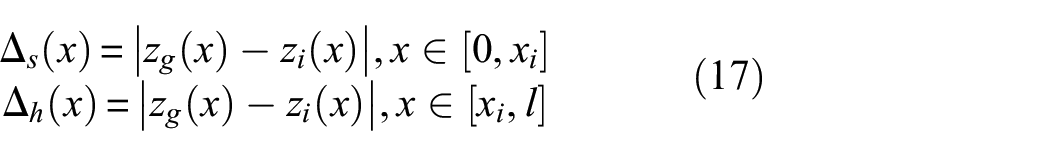
In summary, the calculation process consists of the following steps: (1) acquisition and processing of settlement and uplift data, (2) processing of patrimonial building data, (3) calculation of building deformation due to settlement and uplift and (4) calculation and classification of potential damage in buildings.
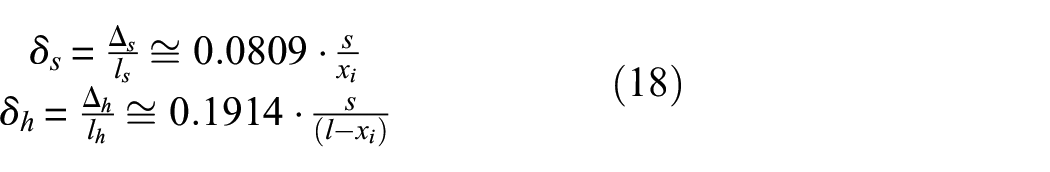
InSAR data analysis
Data acquisition and processing
InSAR encompasses a set of methodologies that combine at least the phase information of two Synthetic Aperture Radar (SAR) images for the calculation of the distance change between the radar antennas and the scattering objects on the ground. This change of distance can be attributed to ground displacement due to subsidence, uplift, earthquake or other causes. However, as the scattering objects are likely to be human constructions due to the high amplitude of the backscattered signal needed, the detected movement can either be attributed to a movement of the construction with the ground or the construction itself.
Thanks to the systematic acquisition of SAR data since the launch of the European remote-sensing satellite (ERS) programme in 1991 and the constant increase in computational power, new algorithms for processing the time series of SAR data have been developed. These techniques are grouped under the name multi-temporal InSAR (MT-InSAR). Ferretti et al.21,22 proposed a method for extracting the phase information of a selection of pixels in a stack of SAR images. Those pixels are first selected using their high amplitude of reflection and further filtered relying either on a model of deformation in time 22 or on their correlation in space. 23 The pixels that correspond to these criteria are called persistent scatterer (PS) and the technique persistent scatterer interferometry (PSI). After processing, a velocity is calculated for each PS from the time series data. Multiplying the velocity with the measurement period yields the vertical displacement of the PS. An additional quality factor called coherence, varying from 0 to 1, is also calculated.
In this study, a processing chain called the Stanford Method for Persistent Scatterers (StaMPS) 24 was used to process the SAR data. In StaMPS, the PS is processed using their correlation in space which has the benefit of extracting more PS in rural areas than the time model. Three datasets of SAR images (ERS 1/2, ENVISAT and Sentinel 1), each covering the entirety of Belgium (geological map shown in Figure 1), were acquired and processed, spanning a total period of 26 years (1992–2018). These datasets are summarized in Table 1. The three radar satellites are operated in C-band (wavelength of 5.6 cm) and scan the earth with a spatial resolution of 8–14 m. Figure 2(a) represents a map of the annual average velocity for the ENVISAT measurement period (2003–2010) over the area of Belgium.
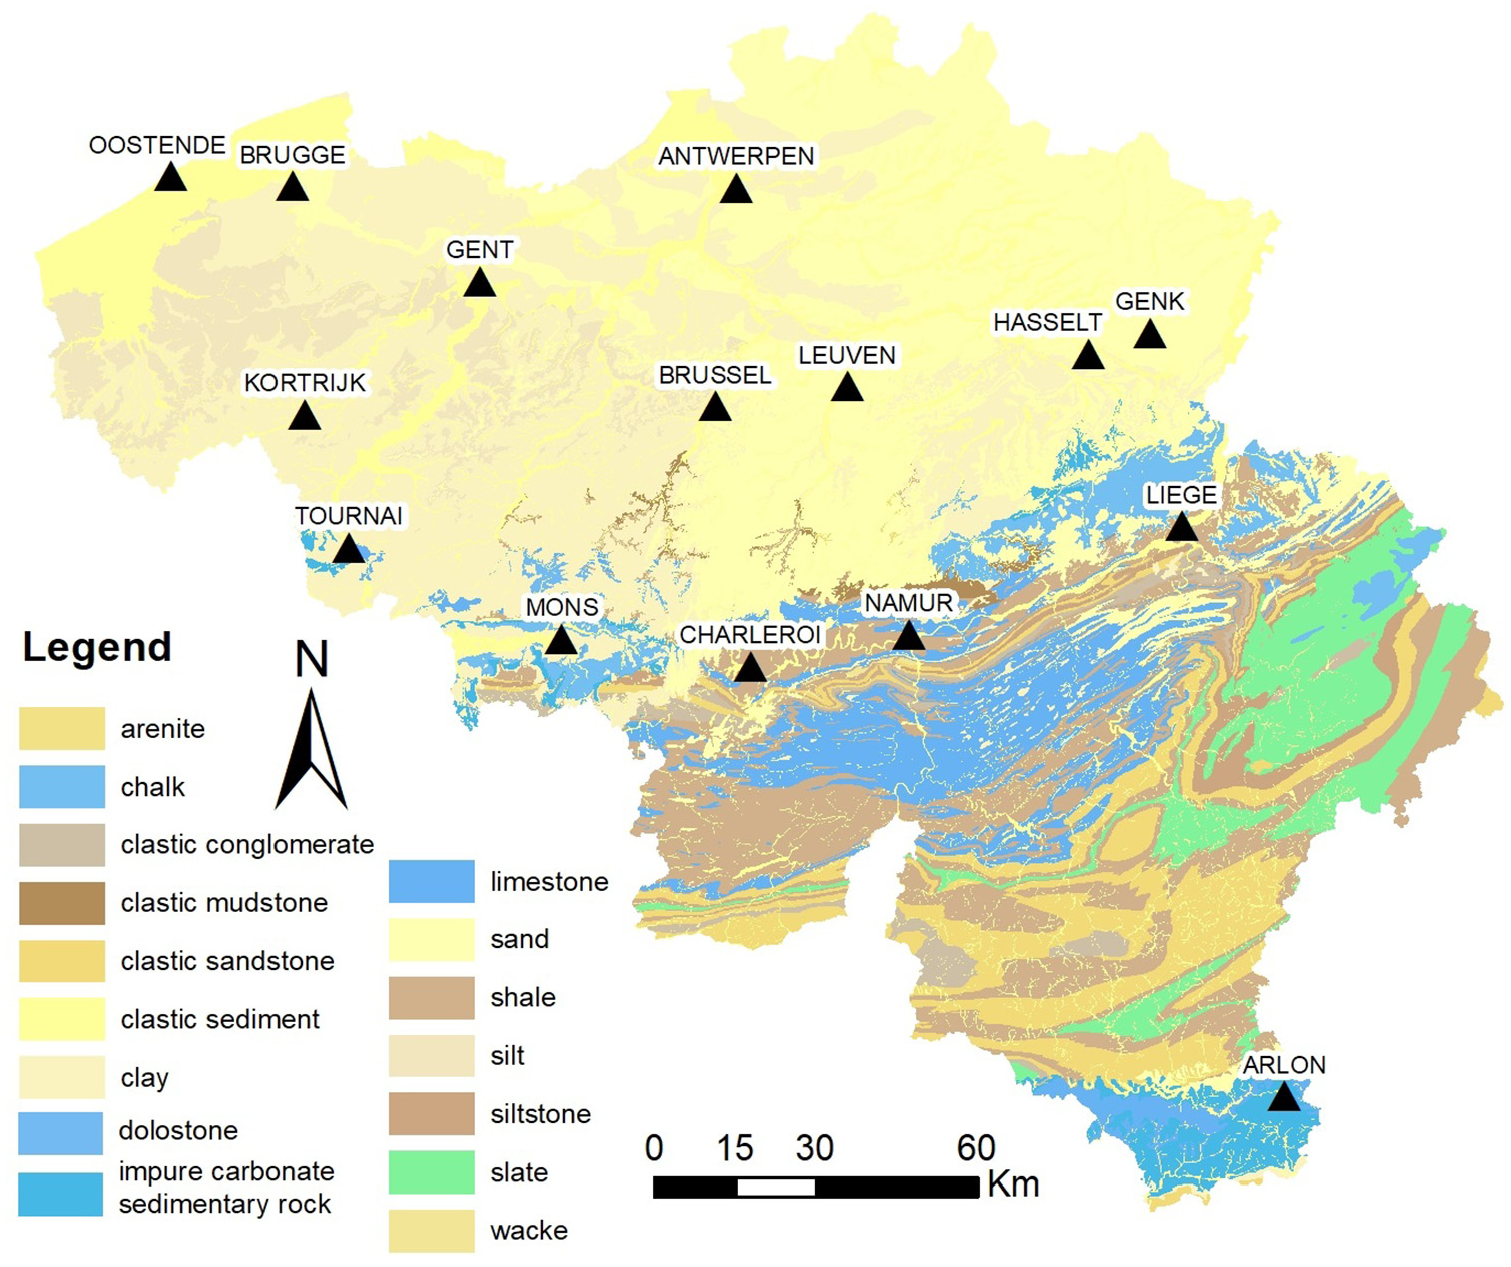
Geological map of Belgium.
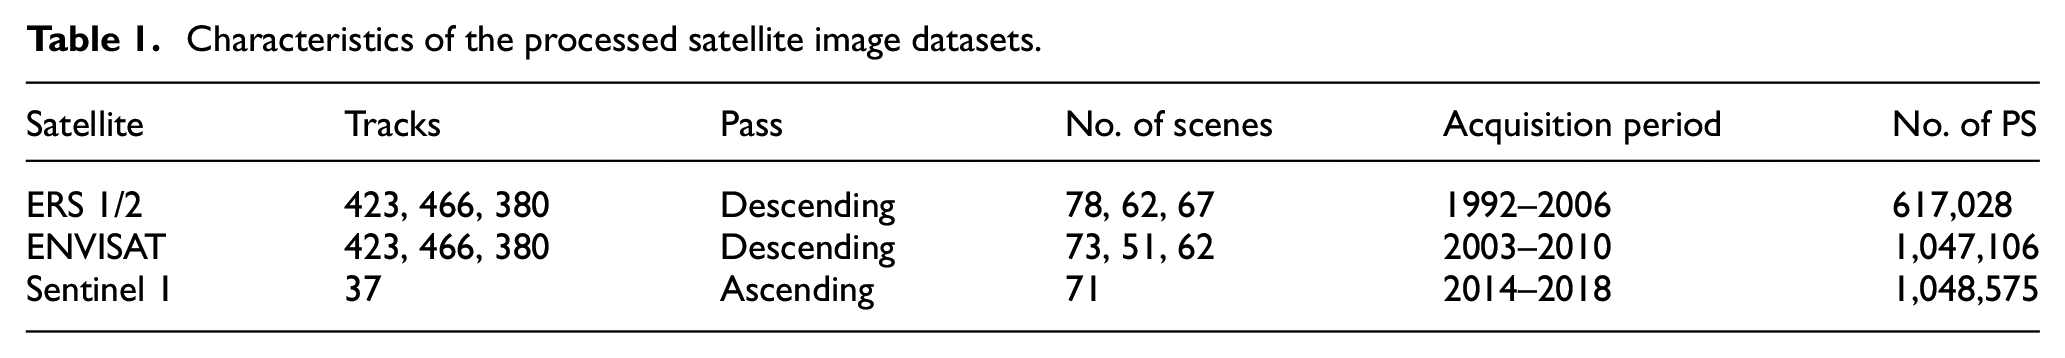
Characteristics of the processed satellite image datasets.
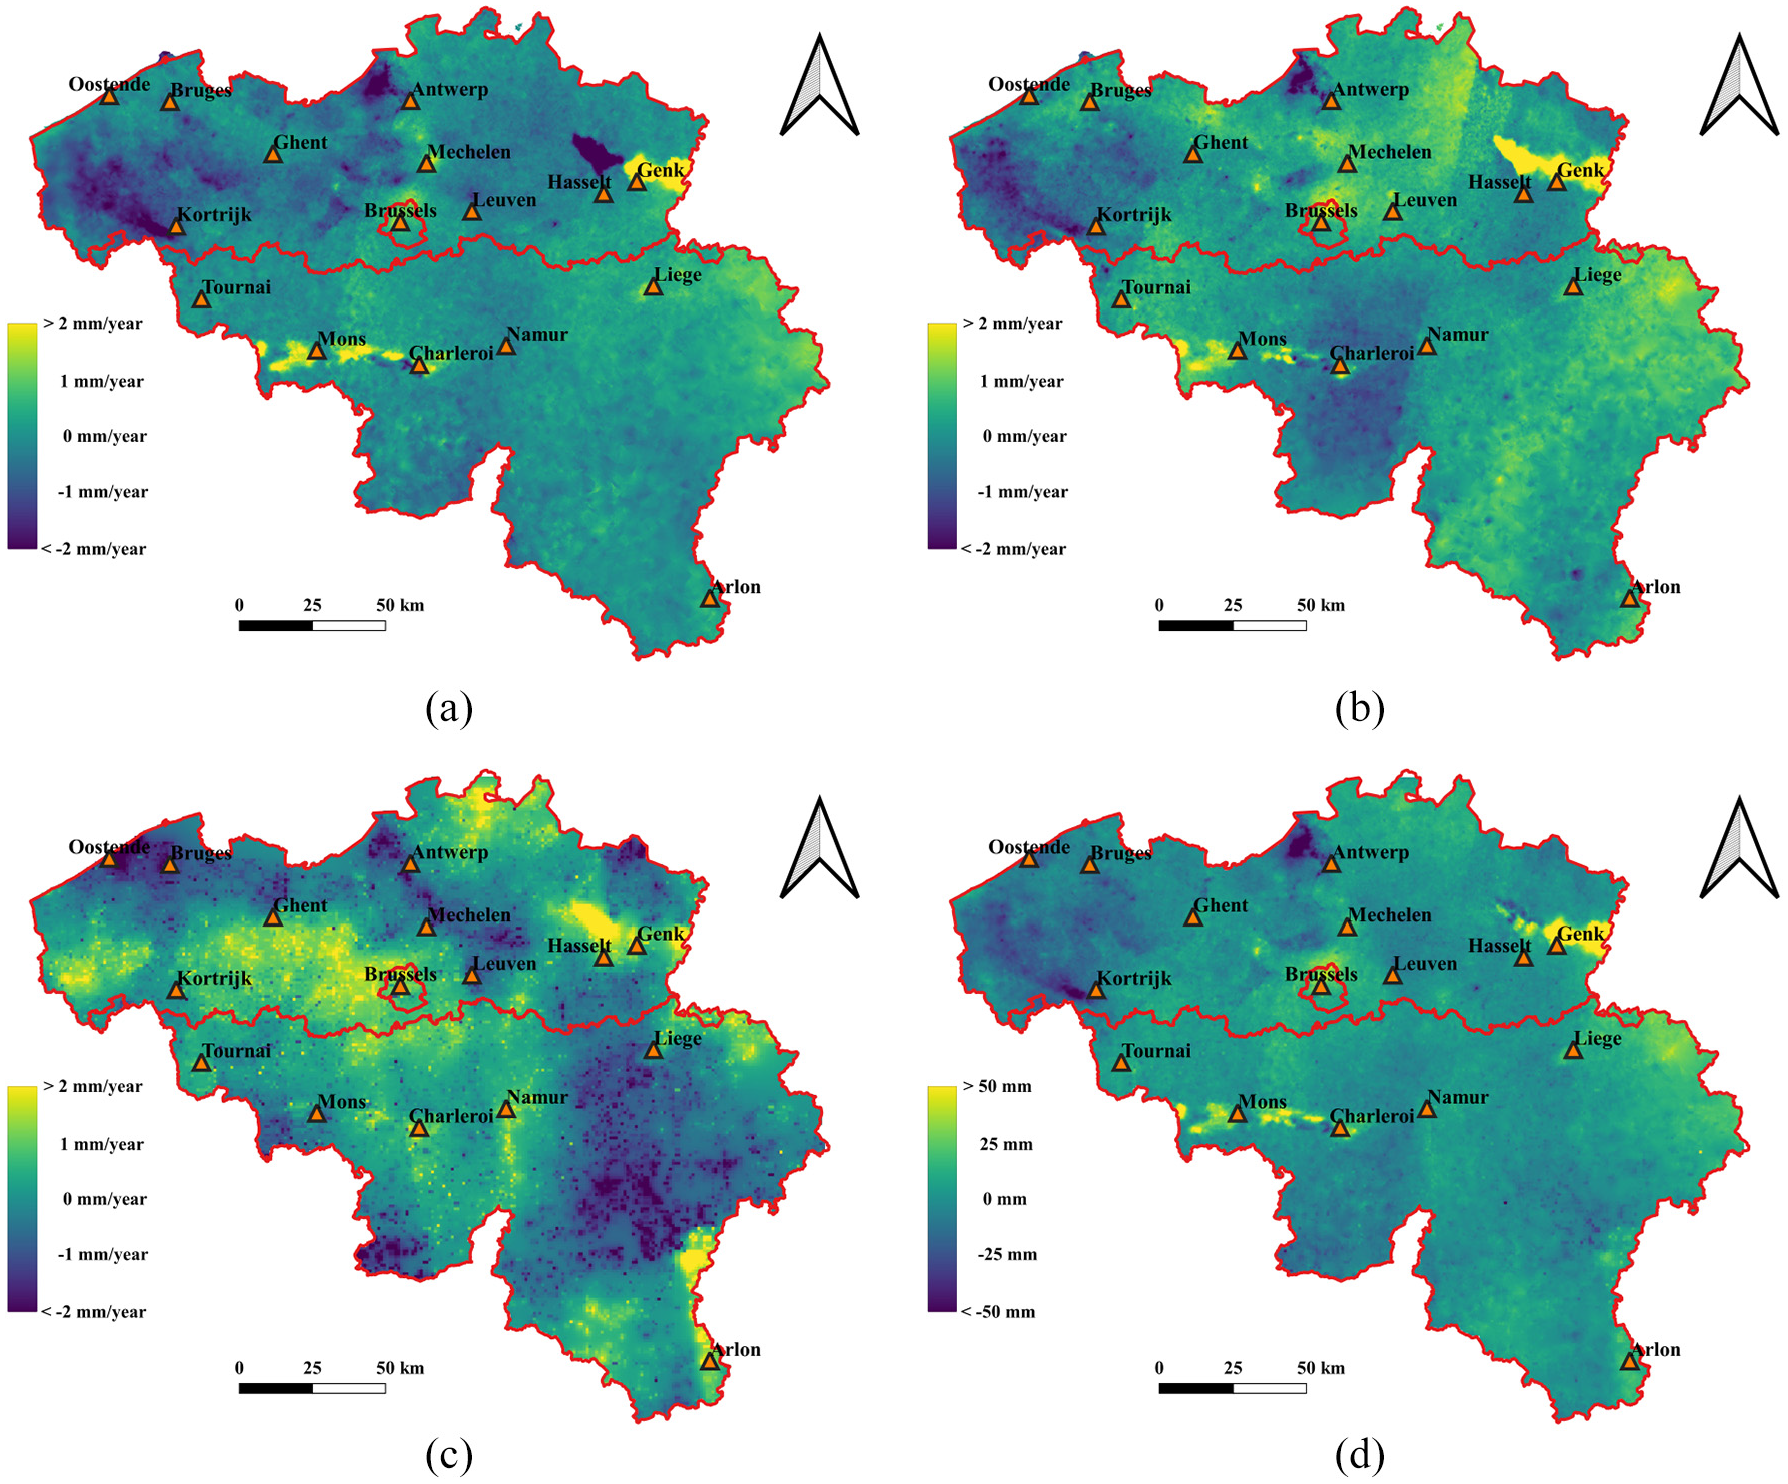
Ground movement monitoring data for Belgium: average annual velocities of PS from (a) ERS data (1992–2006), (b) ENVISAT data (2003–2010), (c) Sentinel 1 data (2014–2018) and (d) total accumulated soil vertical displacement.
Processing results
Based on a minimum coherence of 0.7, the ERS dataset yielded 617,000 PS, the ENVISAT dataset yielded 1,047,106 PS and the Sentinel 1 dataset yielded 1,048,575 PS. The maximum density of PS is observed in cities, Brussels, for example, reaching 800 PS/km2 for the Sentinel 1 dataset. This density means that on average a 1250 m2 urban area (a square with a side length of 35.5 m) will contain a single PS. The density drops to 35 PS/km2 on average over rural areas. The difference of urbanization between the northern part and the southern part of Belgium, especially in the Ardennes region in the area between the cities of Namur, Liege and Arlon, is clearly visible with the reduction of potential targets reflecting the radar signal. For those rural areas, where PS is absent, an inverse distance weighted (IDW) interpolator was used to fill the gaps between the measured values. Velocity grids of 10 m covering the entire country were then calculated by IDW for each measurement period (Figure 2(a) to (c)). The 10-m grid size was selected for maintaining as high as possible a PS resolution in areas with high density data (cities), and, conversely, in areas lacking PS, allowing the clear visualization of the influence of neighbouring PS.
The total soil displacements over the investigated period can be calculated by summing the contributions measured by each sensor. In the cases of temporal overlap, namely between the ERS and ENVISAT data during 2003–2006, the displacements measured by the two sensors are averaged. For the measurement gap period, namely between the ENVISAT and Sentinel 1 data during 2010–2014, the two time series are extended linearly to cover the gap. Through this process, it is possible to construct the ground movement profile in the entire country over the time period 1992–2018 (Figure 2(d)).
Several trends are clearly visible from the PS velocity maps in Belgium (Figure 2). Among them are (a) the settlement registered in the harbour area of Antwerp, 25 (b) the uplift in the de-industrialized northern part of Brussels, 26 (c) the shift from settlement to uplift in the area of Limburg north and east of the city of Hasselt, caused by the shutdown of the collieries in the region27,28 and (d) the uplift zone between the cities of Mons and Charleroi, also linked to the closure of former collieries.25,29
Patrimonial data
Building data
Typically in patrimonial inventory databases, every object is accompanied by data on its age, function, architectural style and typology. These data serve to classify the building in terms of its structural type, as well as to define whether settlement damage models are applicable.
In the case of Belgium, more than 700 typologies were registered in the patrimonial databases of the three federal regions, Brussels, Flanders and Wallonia. The databases include numerous types of non-building patrimonial objects, such as natural artefacts and statues. They further include constructions for which ordinary settlement damage models are not applicable, such as bridges, piers and underground structures.
Having filtered the databases according to the applicability of the models to the set of objects, it is necessary to assign the appropriate model. The age and the architectural style of the building, parameters that are often closely associated, are helpful indicators in this regard. In the cases where more than one date entry is encountered, indicating different construction and intervention phases, the oldest date is considered as the representative of the building. While typically databases will not include readily usable data on the specifics of the structural system and structural materials (such as masonry, structural steel and reinforced concrete), the architectural style helps to distinguish between masonry and infilled frame buildings. Conversely, bare frames are related to a limited number of typologies, such as certain industrial buildings and steel frame gasometers.
Building polygon and offset
The plan of each building is delineated by a simple polygon. For building structures, the edges of the polygon generally correspond to façades or frames in the perimeter of the building. Considering the external bays or façades for the calculations is consistent with the majority of actual construction. The external walls in masonry buildings are normally the stiffest and well-founded structural elements, thus more vulnerable to soil movement. Similarly, the external bays of frame structures bear the heaviest infill walls and are thus the most vulnerable part of the structure as regards to differential settlement. In addition, regardless of structural typology, damage in the façade is highly significant from a preservation perspective. The façade is the most visible part of the structure, making even aesthetic damage on its surface a matter worthy of investigation.
It is known that building structures are influenced by ground movement not only within their perimeter but also within a distance from their perimeter. This is considered in the analysis by expanding the area of influence for each building by an offset extending outwards from the building polygon. PS within the polygon and the offset are equally taken into account in the calculation of damage for the building. The offset serves the additional purpose of increasing the chances of a sufficient number of PS being found per building for analysis. An illustration of the building polygon and its offset are presented in Figure 3. The use of a 10-m offset guarantees that in the absence of PS within the area defined by the offset, at least two interpolated grid values will be captured, thus making the damage calculation always possible.
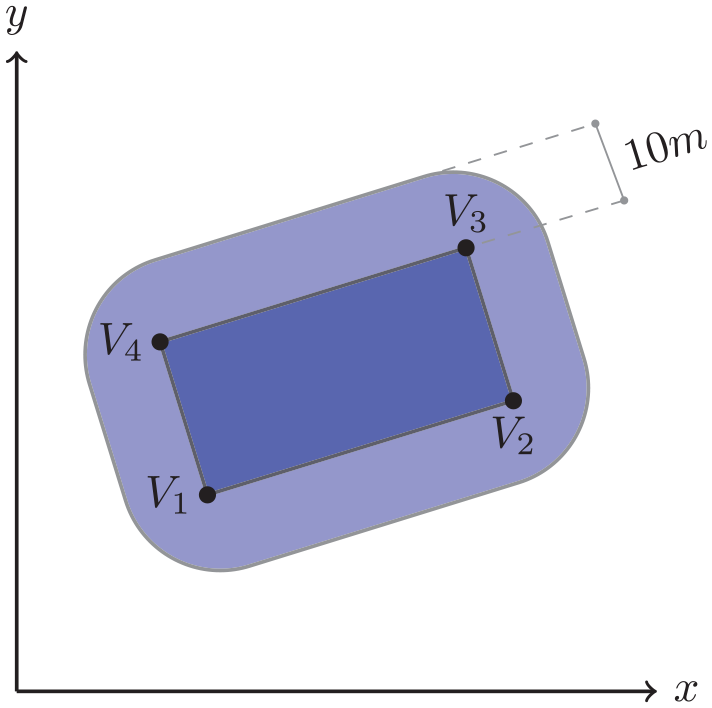
Simplified building polygon and defined offset.
The basic data on the building polygons were extracted from the digital cadastre of each federal region. The height of the buildings was determined through the subtraction of the digital terrain model (DTM) from the LiDAR-derived digital surface model (DSM) of Belgium as acquired in 2014. These measurements afford a spatial accuracy of 0.50 m and an elevation accuracy of 0.25 m.
A simplification of the polygons is performed by calculating a rotated minimum bounding rectangle. This shape is defined as the smallest area rectangle that contains all the vertices of the polygon. Subsequently, this rectangle is offset outwards by 10 m and the edges are connected with quarter circles. The rectangular shape of the simplified polygons reduces the computational cost, which can be prohibitive when handling tens or hundreds of thousands of cases, and precludes the generation of self-intersecting polygons by the offset, thus avoiding spurious load computations for the edges. However, for the analysis of single case or a limited number of buildings, the polygon simplification step can be skipped, provided the offset is manually checked.
The rectangular shape used for analysis is not intended to represent the actual building plan with every detail but is adopted as a necessary simplification. While the majority of building structures, particularly those made of masonry, present a simple rectangular plan, some building typologies may feature architectural characteristics that deviate from this simple layout. This includes, for example, large church structures with crossings and side chapels. Nevertheless, the rectangular simplification is able to accurately represent the actual building plan for the majority of cases, particularly for masonry buildings. In addition, regardless of actual plan, the building polygons registered in the patrimonial database often feature dozens of redundant edges, which increase the number of calculations without contributing to calculation accuracy and in fact being detrimental to the evaluation of the results. These cases also benefit from the rectangular simplification. For the limited number of cases where geometrical plan complexity deviates from the simple rectangular shape, this approach is still capable of pin-pointing the orientation of the most, and least, loaded external walls.
Building data analysis
Overall, the percentage of object typologies in Belgium, registered in the databases, for which settlement damage models are applicable, was roughly 70%. The percentage varies between federal regions due to differences in database structure and object inclusivity. This brings the total number of analysis cases to 269,194 buildings.
The number of PS per building for the three satellite image datasets used in this study is evaluated over the case studies of the Brussels region. The distribution of these numbers is illustrated in Figure 4. For the Sentinel 1 dataset, which featured the highest number of PS overall, the number of PS per building is generally low, with only 9.9% of cases having two points or more, even in urban areas where the PS density is highest.
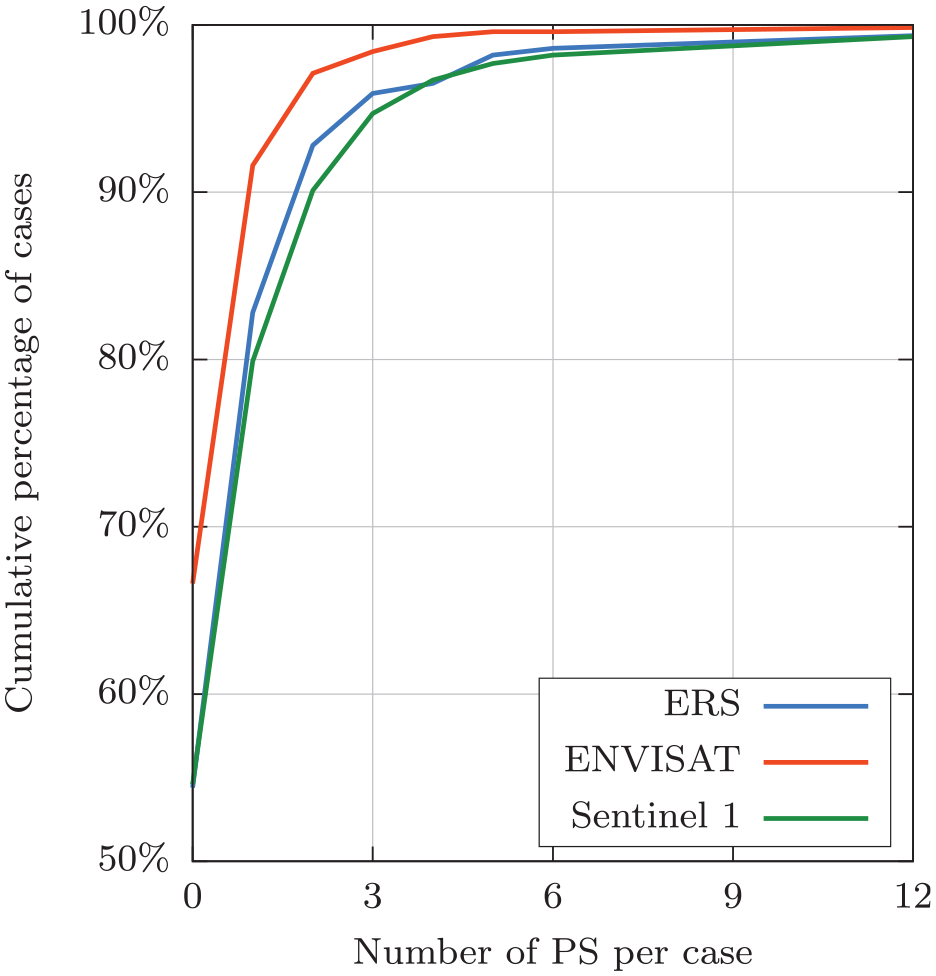
Cumulative frequency graph of the number of PS per building in Brussels.
Definition of ground deformation curve
For the definition of the ground deformation curve
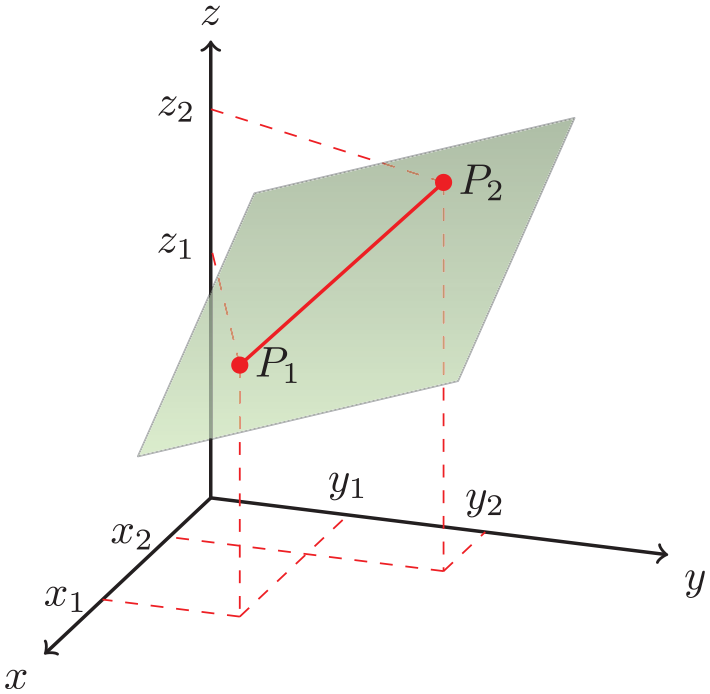
As shown from the PS density in urban areas and in the joint analysis of InSAR and patrimonial data, the number of PS per case study is generally limited. Therefore, for every building, the two PS defining the maximum tilt plane are used for the determination of the ground deformation profile in its area of influence. In the absence of PS, the 10-m interpolated grid data are used instead, treating the value of the grid as a standard PS. In the following expressions involving linear algebra, matrices are shown in bold uppercase, vectors in bold lowercase, matrix elements in lowercase with a double subscript index and vector elements with a single subscript index.
The function of the maximum tilt plane is

Tilt
where
where

with
Each PS has a vertical displacement
where

The tilt matrix containing the absolute value of the tilt between each pair of PS
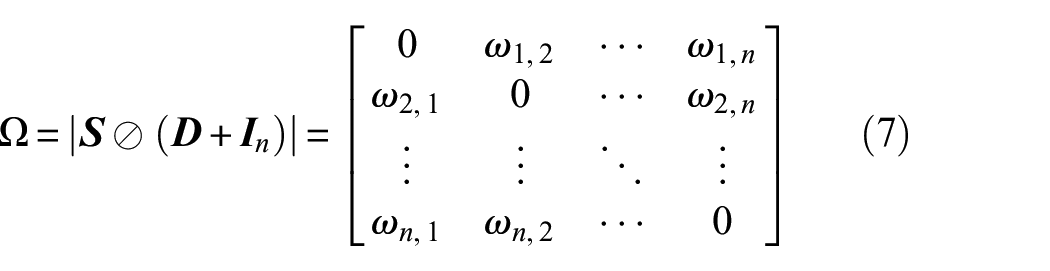
where
and all diagonal elements
The two PS from which the maximum tilt
The numerical parameter
Maximum tilt surface and defining points
The entire area of Belgium cannot be covered by a single InSAR track, necessitating the use of multiple tracks which partially overlap. This overlap can lead to spurious tilt results from PS at a short distance with drastically different velocities which could not be resolved during the automatic processing. In the areas of track overlap, the above calculations are performed for the PS of each track individually. The most conservative result for each measurement period in terms of tilt between tracks is considered for the calculation of the maximum tilt.
Definition of building deformation
Polygon vertex and edge data
Each building polygon consists of a set of

The vector of lengths of the

The tilt
Polygon edge tilt
The calculation of the tilt for each individual edge allows the evaluation of damage at different locations of the structure. Edges parallel to the dip direction of the maximum tilt surface suffer the most damage, whereas edges perpendicular to it do not suffer damage. In the case of piecewise analysis defined by accumulated ground deformation from different measurement periods, this approach allows the evaluation of the damage in different parts of the building over time. Since this is normally the case with InSAR data, the analysis results from different periods constitute the damage history of the building, which can be compared with previous inspection records and patrimonial database information.
The absolute tilt of each edge is accumulated in every subsequent measurement period. Damage from previously registered tilt is considered not reversible. Practically, this means that when opposite sign tilts are registered at different periods, only the sum of their absolute values is considered for the accumulated tilt of the edge. The repeated unloading and reloading of building structures subjected to soil settlement have not been previously investigated experimentally, analytically or numerically. However, empirical damage assessment models are based not only on the magnitude of strain or crack width from monotonic settlement loading but also on parameters, such as crack distribution and extent. 13 Since opposite sign tilt may cause damage to different parts of the structures still retaining their stiffness, the conservative approach of the accumulation of absolute tilt is adopted here.
Definition of load parameters
For a number of settlement damage models for masonry, the accumulated tilt is not a sufficient parameter to determine the loading. Since the maximum tilt surface only provides information on the tilt of an edge, further manipulation is required for the indirect determination of other loading parameters.
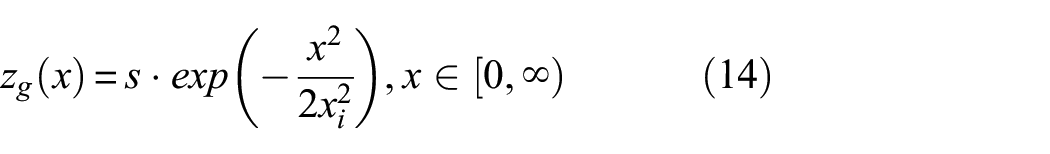
In brief, the loading parameters are the angular distortion
As shown above, the vertices of an edge with a horizontal distance
where
While this approximation is not very accurate, it helps in defining the point beyond which equation (14), which has no root, is very close to zero. The root of equation (15) is
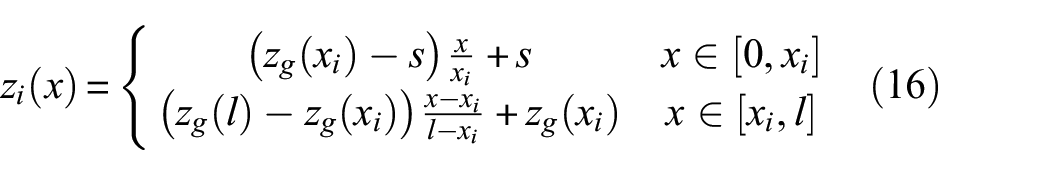
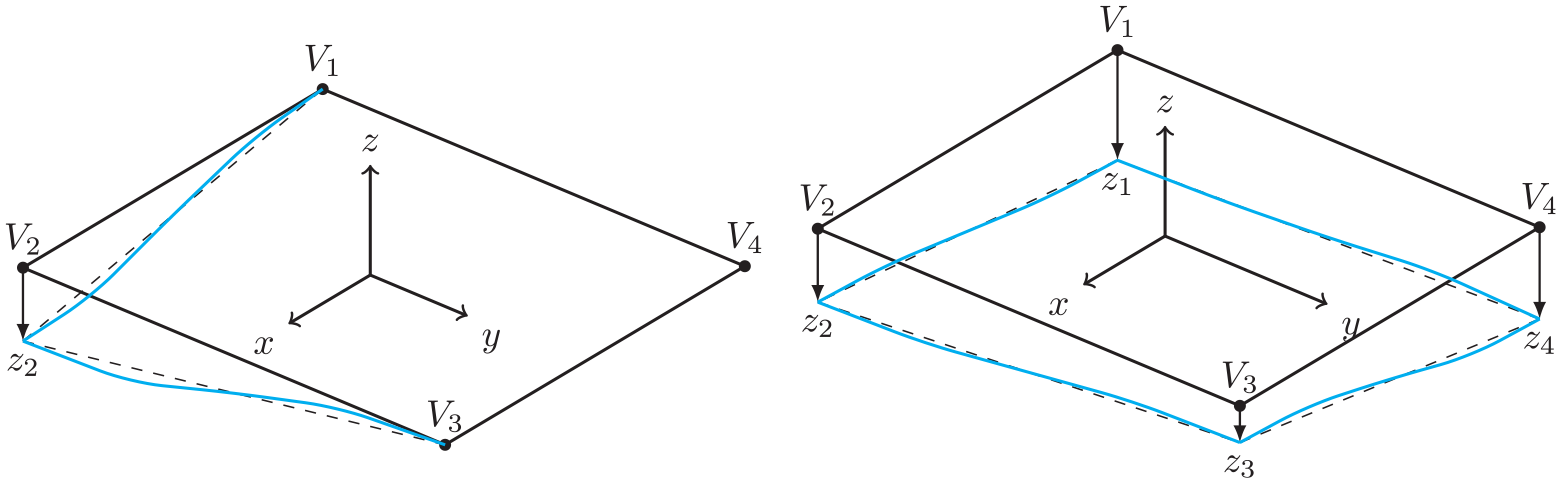
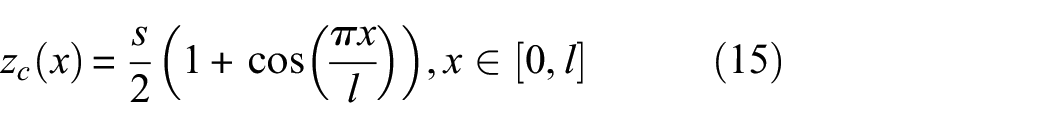
Illustration of building edge deformation profile in blue based on vertex settlements. Single vertex settlement (left) and superposition of multi-edge settlement (right).
The three curves are illustrated in Figure 7. The sagging and hogging deflections are calculated as
and their maximum values are designated as
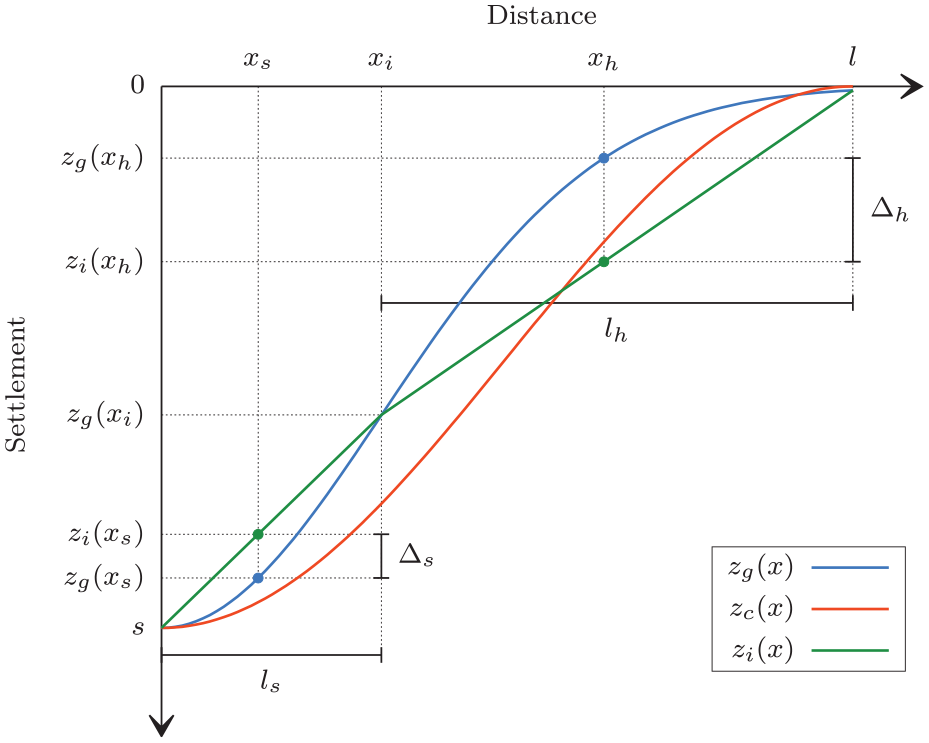
Edge deformation profile and derivation of the deflection ratios. Cosine approximation
The location of maximum sagging is
The angular distortion
and 13
where
with
Damage classification models
Damage models
Damage assessment due to settlement is calculated according to models for three different main structural typologies: masonry, infilled frames and bare frames. In the literature, the majority of work on sensitivity of buildings to soil settlement has been carried out for masonry buildings. This is motivated by their high stiffness, low tensile and shear strength and low deformation ductility. A limited amount of work has been carried out for infilled frames, whose sensitivity against soil movement is mostly due to the masonry infills and not the main load-bearing frame. Bare frames have been studied even less due to their relatively low sensitivity but represent a not insignificant part of industrial building heritage.
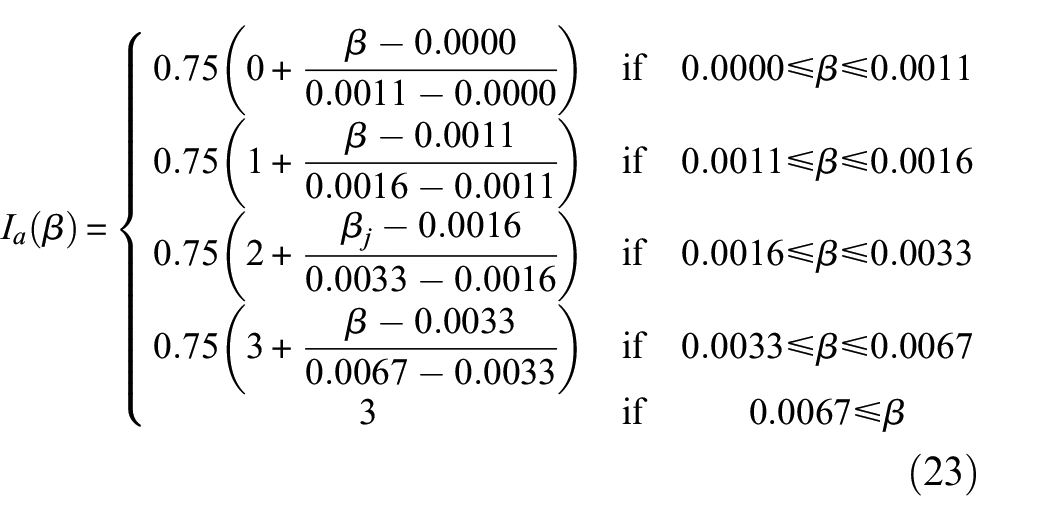
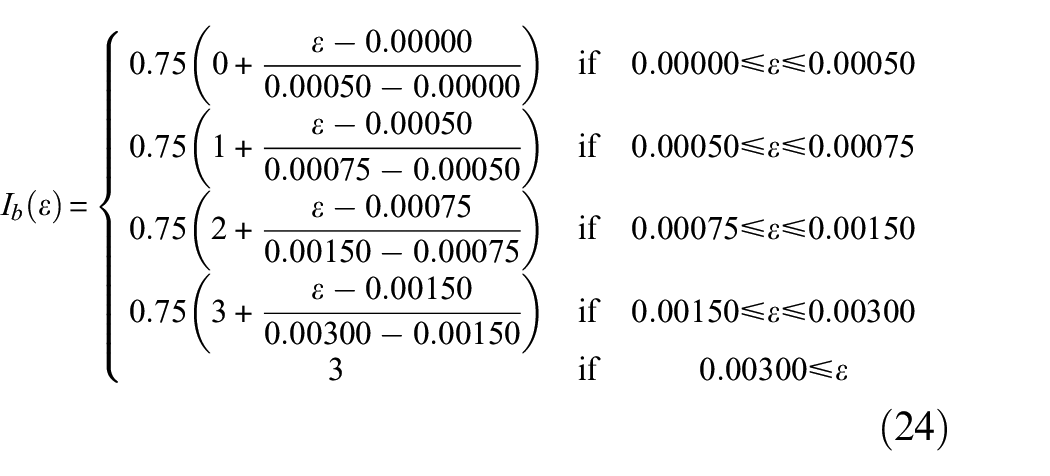
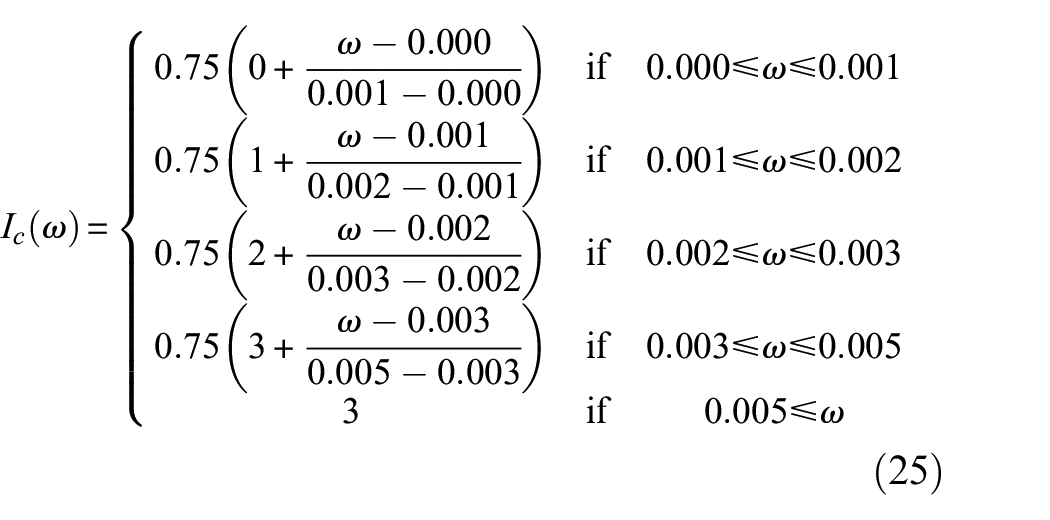
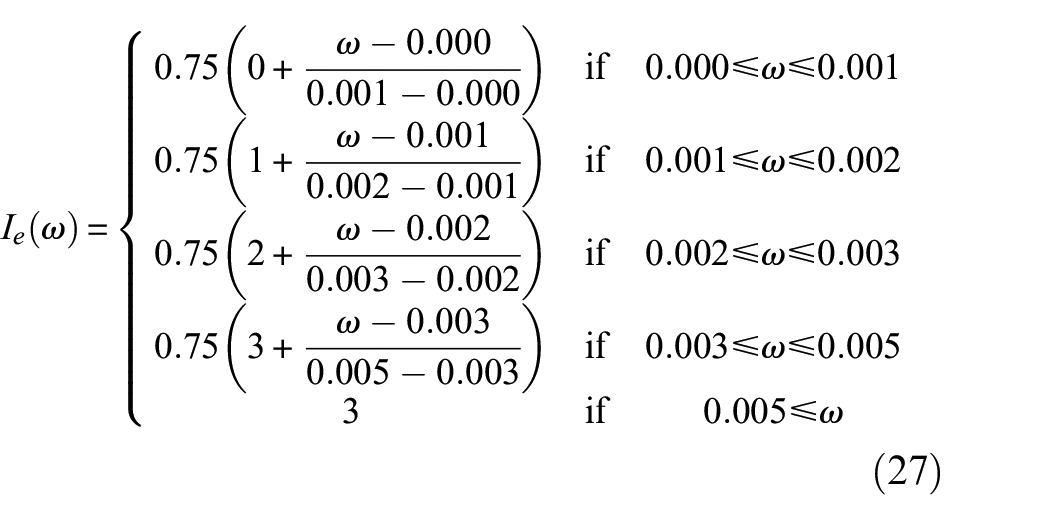
In this study, six different types of analytical damage models (a, b, c, d, e and f) are considered. Each is provided with a qualitative damage level description and a numerical damage index
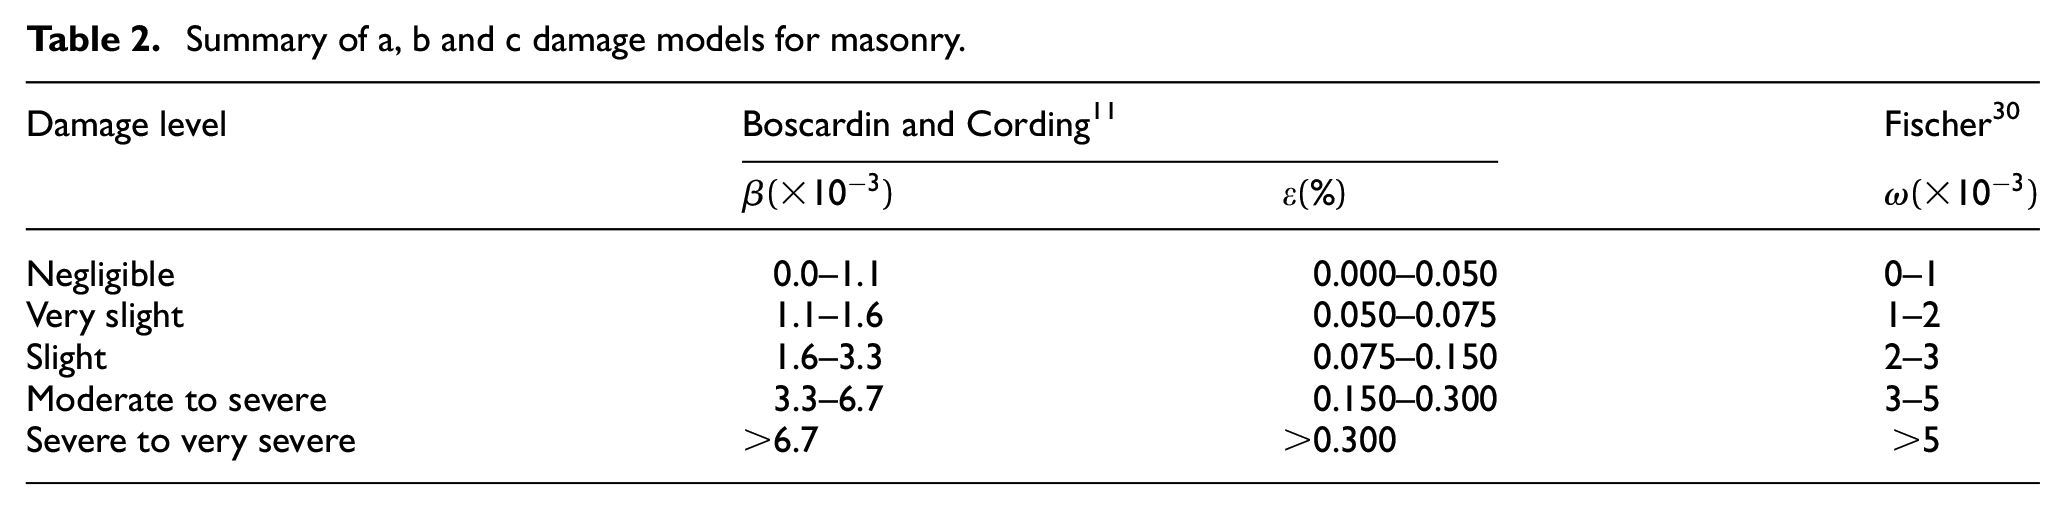
A summary of load limits for the a, b and c masonry models considered is provided in Table 2.
Summary of a, b and c damage models for masonry.
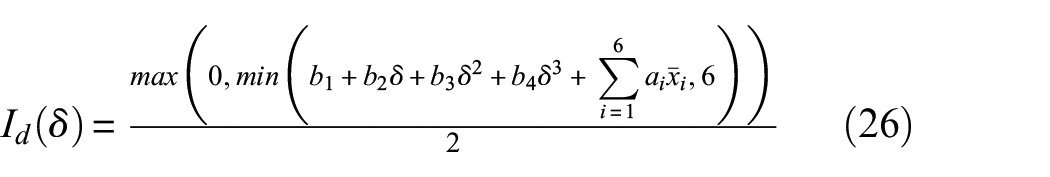
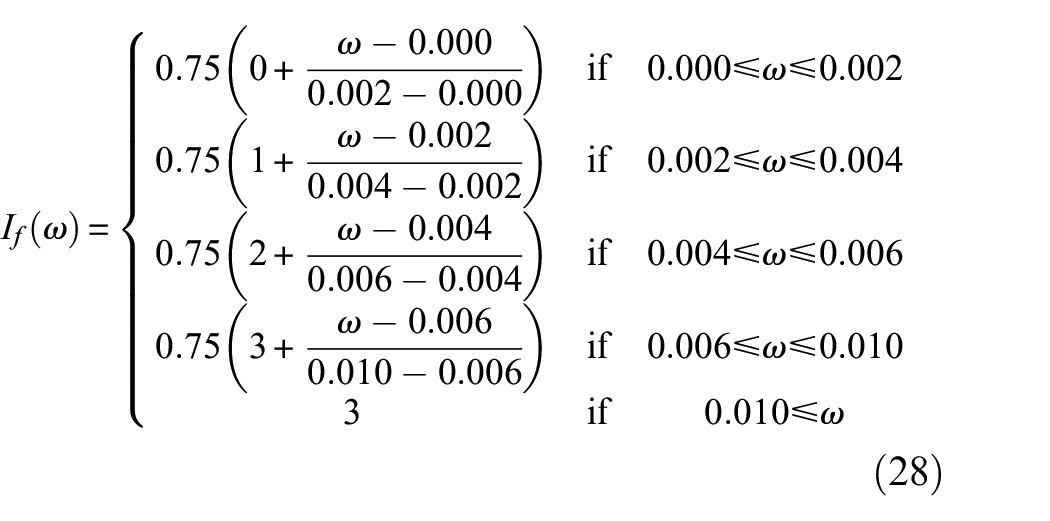
Model d for masonry walls is based on the deflection ratio
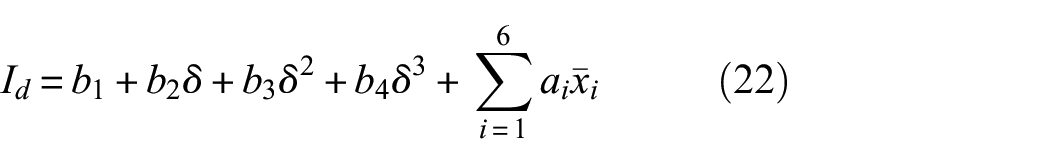
Settlement-induced crack width limits according to Burland et al. (Model d).
The numerical parameters
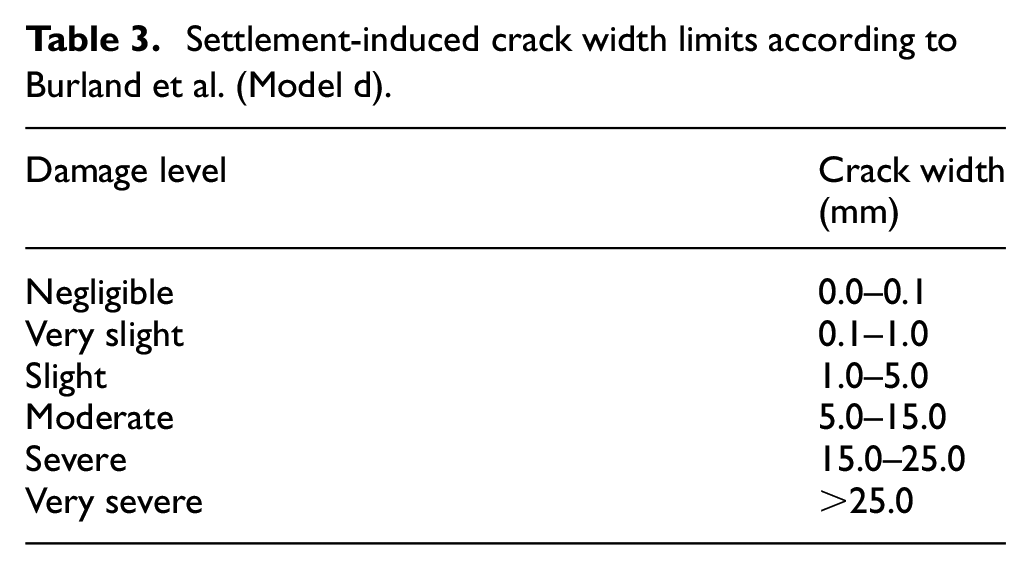
In the case of infilled and bare frames, the limits in tilt for each damage level are acquired according to the relative allowable limits for drift given by ASCE 41. 32 These drift limits represent the capacity of the building for deformation based on its typology. The resulting tilt limits are presented in Table 4. Infilled frames are considered to have the same tilt limits as masonry structures, and bare frames have these tilt limits doubled. In the case of the tilt limits for infilled frames, however, it should be noted that the damage level refers primarily to the infill and not the frame. This infill damage should normally be repairable or the damaged element replaceable.
Damage models for infilled (Model e) and bare frames (Model f).
Load limit normalization
To maintain a uniform output, the predicted building damage from all the above models is expressed on a four-tier damage scale: null/negligible (NN) for
Application examples
Summary of calculation process
The entire process for potential damage calculation according to the developed methodology is illustrated in the flowchart of Figure 8. In summary, the patrimonial building data are processed for the calculation of the building polygons and their 10-m offset. Next, each InSAR data period
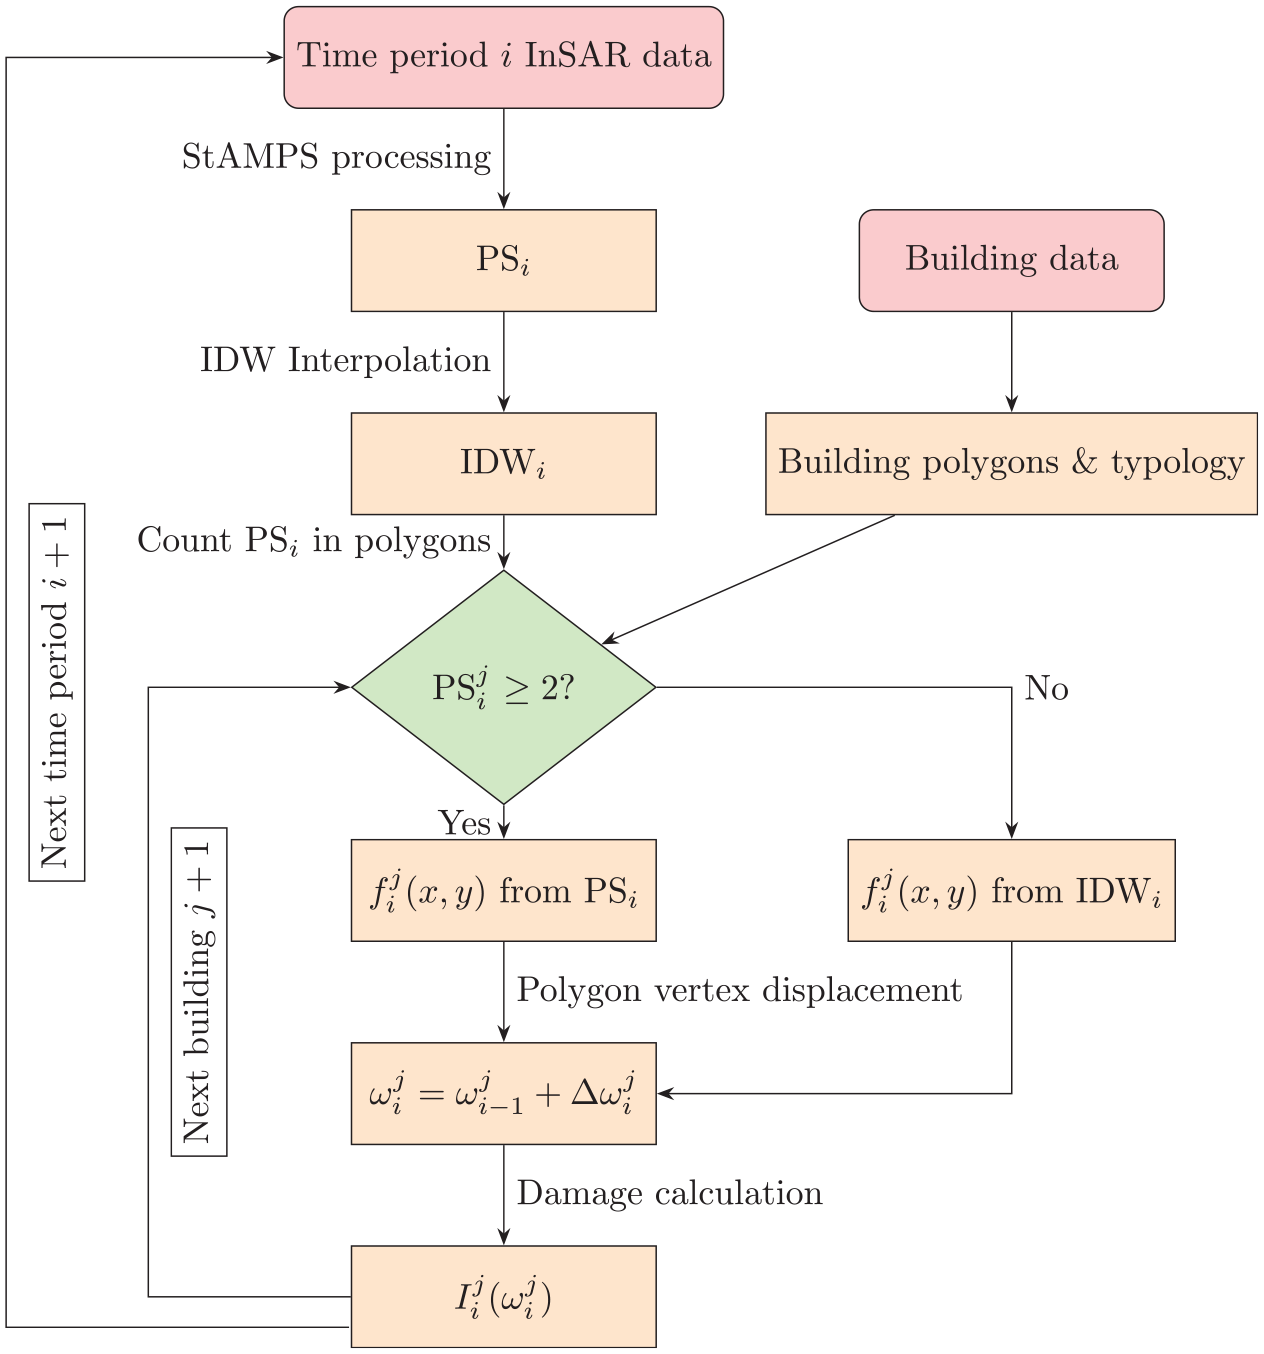
Calculation flowchart for proposed method.
Verification of damage model
The results of the damage model are compared to the related results from the literature on settlement damage to buildings as assembled and summarized by Namazi and Mohamad. 12 Settlement in these cases was induced by a variety of causes, including tunnelling, self-weight and adjacent excavation. The cited sources are used for the determination of the dimensions and type of the building as well as of the deformation loads in terms of the deflection ratio. The Poisson’s ratio for masonry buildings (Cases 1, 2, 4, 6, 7, 11–15) was assumed to be equal to 0.3, as was for a number of RC frame cases with masonry infills (8–10). Other RC frame buildings (Cases 3, 5, 16) were analyzed using a Poisson’s ratio of 5.25, which suggests the substantial shear deformability of a bare frame. The criteria proposed by Burland et al. 31 were used in the cited article for classifying damage to the buildings (Table 3). The results are presented in Table 5. For the RC frame cases, both the infilled and bare frame damage indices are presented.
Building case studies from the literature: comparison of reported with predicted damage.
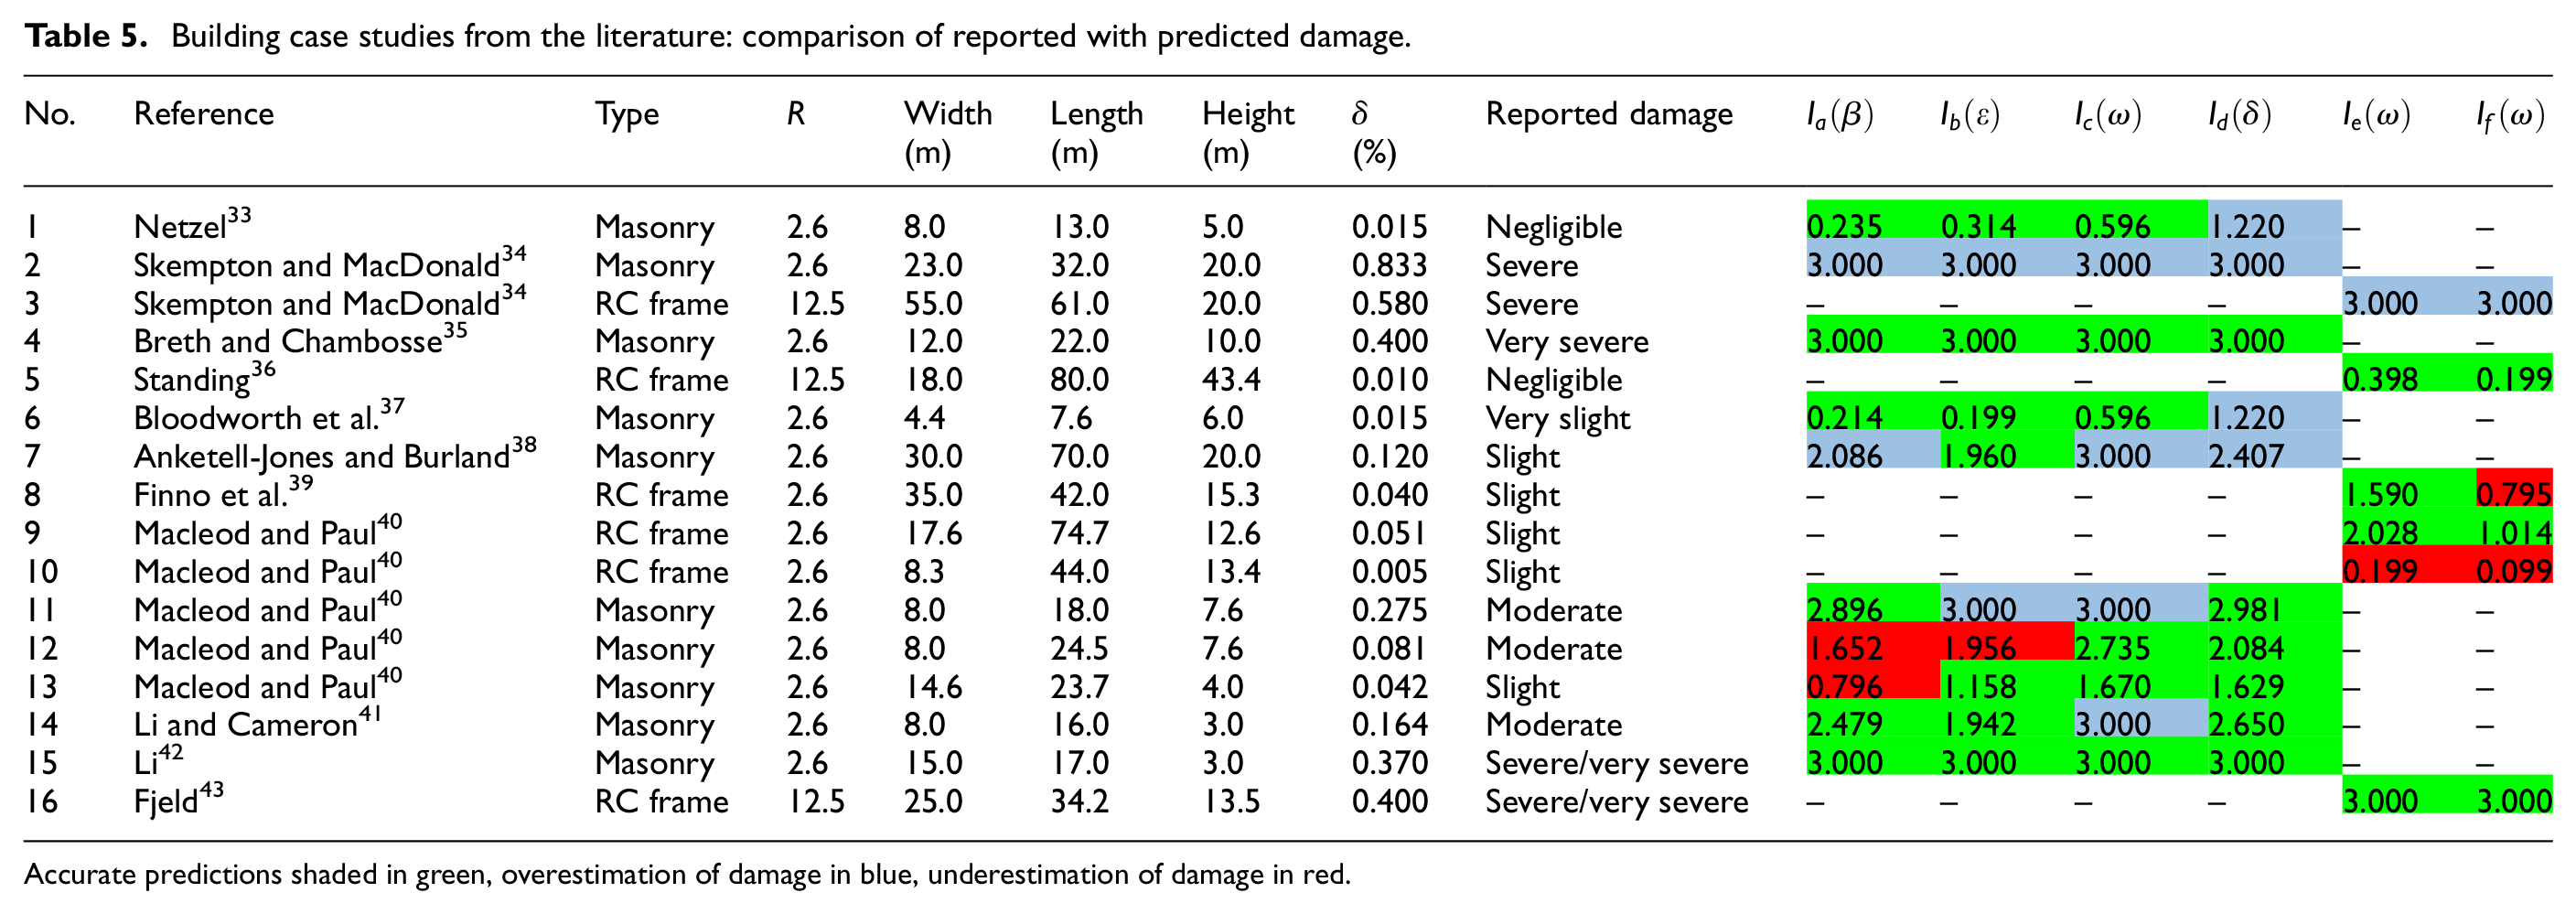
Accurate predictions shaded in green, overestimation of damage in blue, underestimation of damage in red.
Overall, the numerical damage indices from the analysis show good agreement with the reported damage for the majority of the cases and for all structural typologies. The masonry models appear to overestimate the damage in Cases 7 and 11, although the magnitude of the deflection ratio in both cases suggests that the reported damage should normally be higher. The tilt model index
The cases where the potential damage was underestimated are here investigated in greater detail. The underestimation of the potential damage in Case 8 only occurs when considering a bare frame case
An additional verification of the proposed model is made through a comparison of the damage curve described by equation (25), based on tilt, with an extensive field study, conducted by Peduto et al. 9 in the Netherlands on a large number of structures damaged by differential settlement. In the cited source, numerous buildings with shallow and piled foundations were inspected. For each building, the damage levels were observed, as defined by Burland et al., 31 and the rotation angle, which for the small angle values considered is nearly equal to the slope or tilt, was recorded. It was thus possible to establish mean rotation angles for each damage level. The comparison of the resulting damage curve, with damage levels quantified on a numerical scale, with the proposed tilt damage model is shown in Figure 9. No distinction was made between severe and very severe damage levels by Peduto et al., limiting the extent of the curve. Overall, the proposed tilt model is shown to be unconservative compared to the average findings of the field study in the Netherlands. However, the conservative way in which the maximum tilt for each building is defined in the proposed model (equation (9)) can potentially offset this difference.
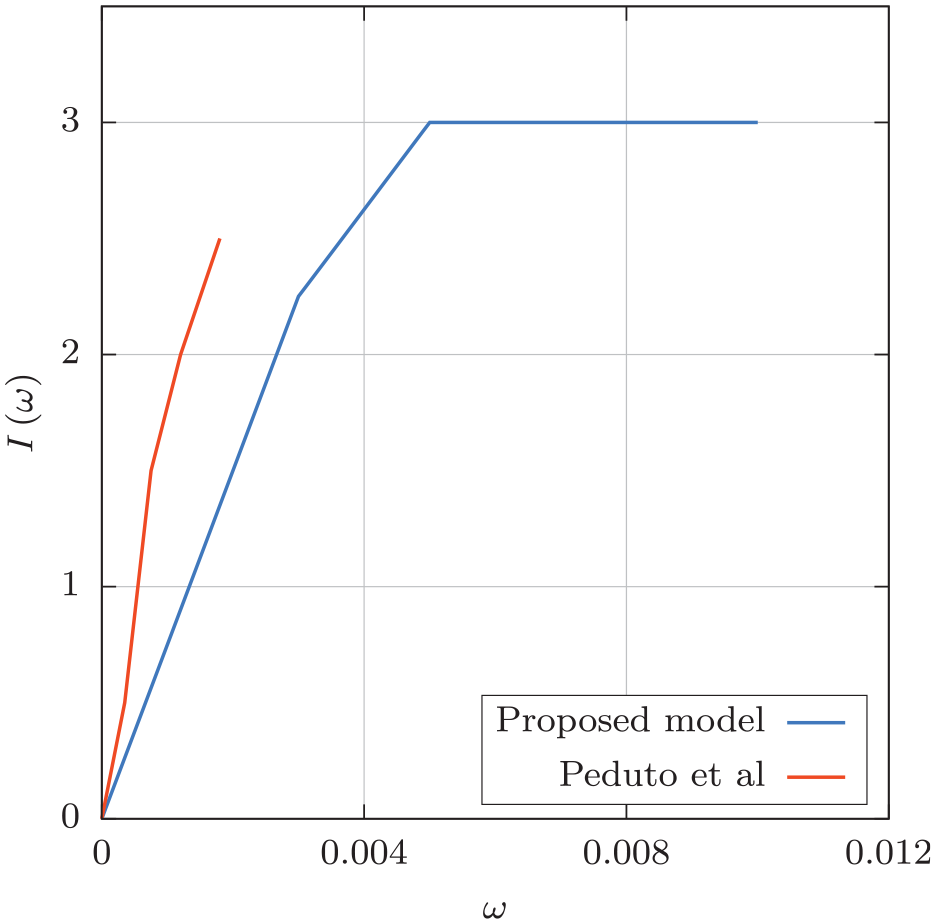
Comparison of tilt damage model with damage curve determined by Peduto et al.
Sensitivity analysis
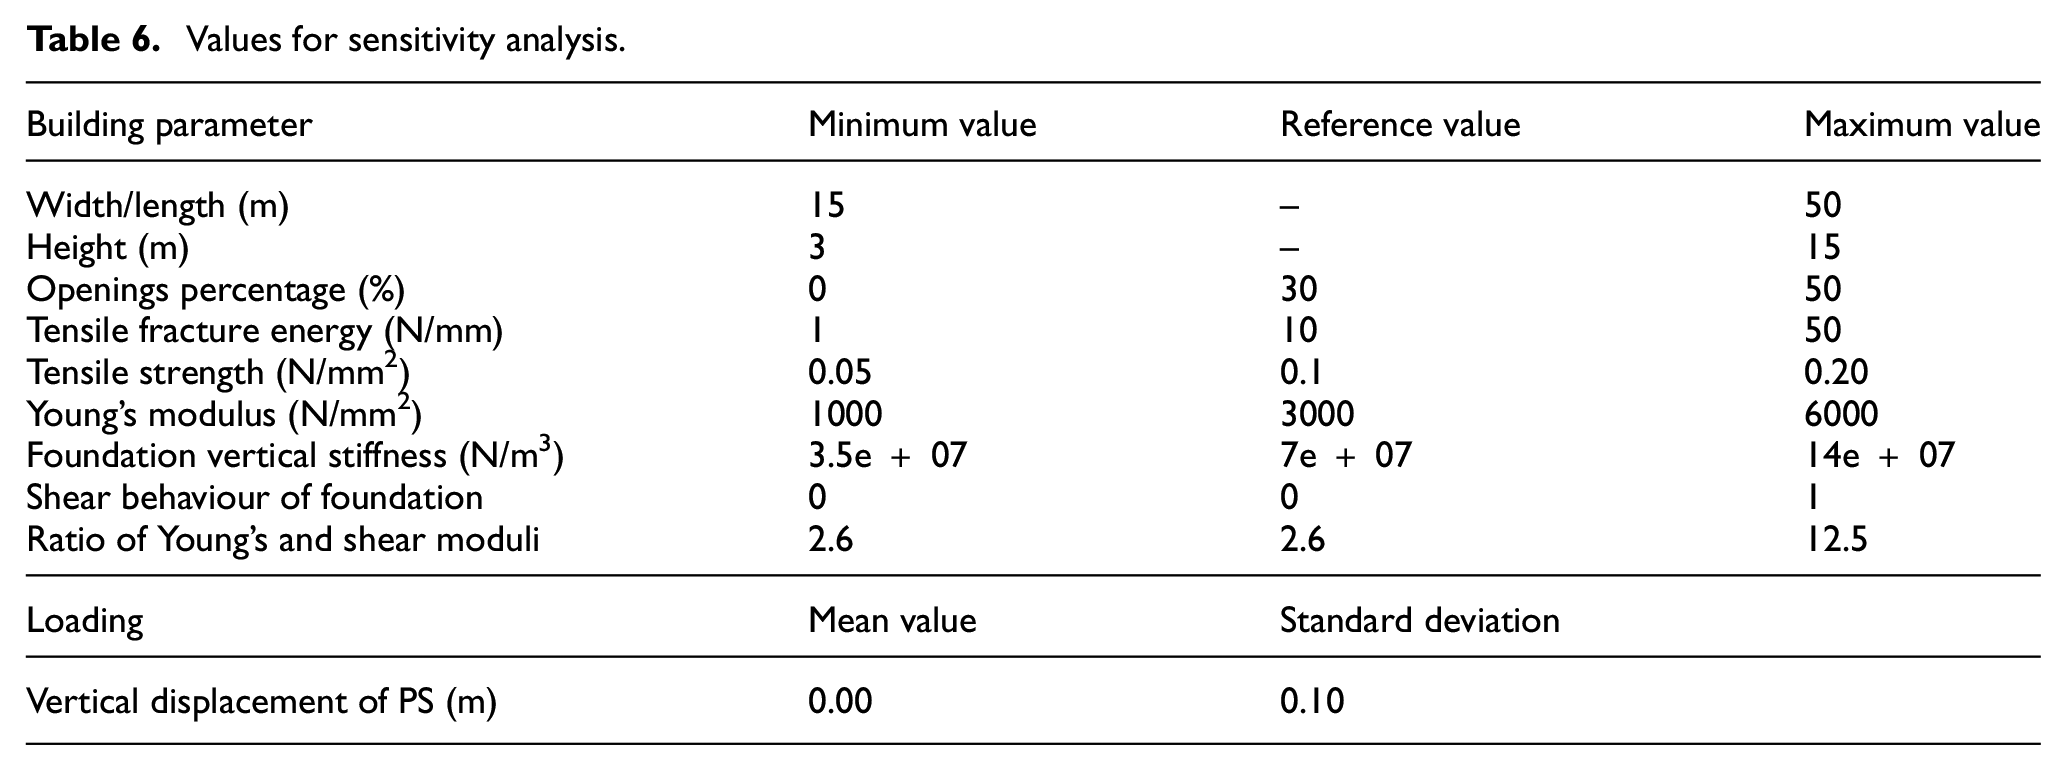
The masonry damage models a, b, c and d are used in a sensitivity study, the main purpose being to quantify the differences in the predicted damage over a variety of cases. Both the loading data, determined by the position and vertical displacement of the PS, and the building dimensions and properties are generated according to specified constraints. The data are used for the calculation of the relevant damage indices. In total, 100,000 cases were generated and analyzed.
The parameters used in the analysis are presented in Table 6. The values for the building parameters are distributed uniformly between the minimum and maximum values provided and are representative of historic masonry buildings. The coordinates of the PS are generated randomly, and the values of the vertical displacement follow a skew normal distribution. The skewness is introduced to reflect the fact that in a given geographic area around a single building, the InSAR points will tend to be mostly uplifting or subsiding as a whole. The shape parameter used for this skewness is equal to 100 times the standard deviation. The values used for the distribution are in part consistent with the data obtained from the actual InSAR data from Belgium but are not intended to be wholly representative of them.
Values for sensitivity analysis.
The results of this analysis are presented as fragility curves in terms of the cumulative percentage of cases for the damage indices of each model, illustrated in Figure 7. The analyses are performed in two sets: first, by assuming the reference values for the foundation stiffness, foundation shear behaviour and the superstructure

resulting in a value for
For the first approach (Figure 10(a)), the tilt model (c) is the most conservative of the models, with 12.0% of the cases having a damage index of more than 2. The deflection ratio model (d) is the least conservative of the four, with 1.6% of buildings having a damage index of 2 or more. The angular distortion (a) and bending strain (b) models are nearly equivalent and lie between the other two models, with 7.0% of cases having a damage index of 2 or more.
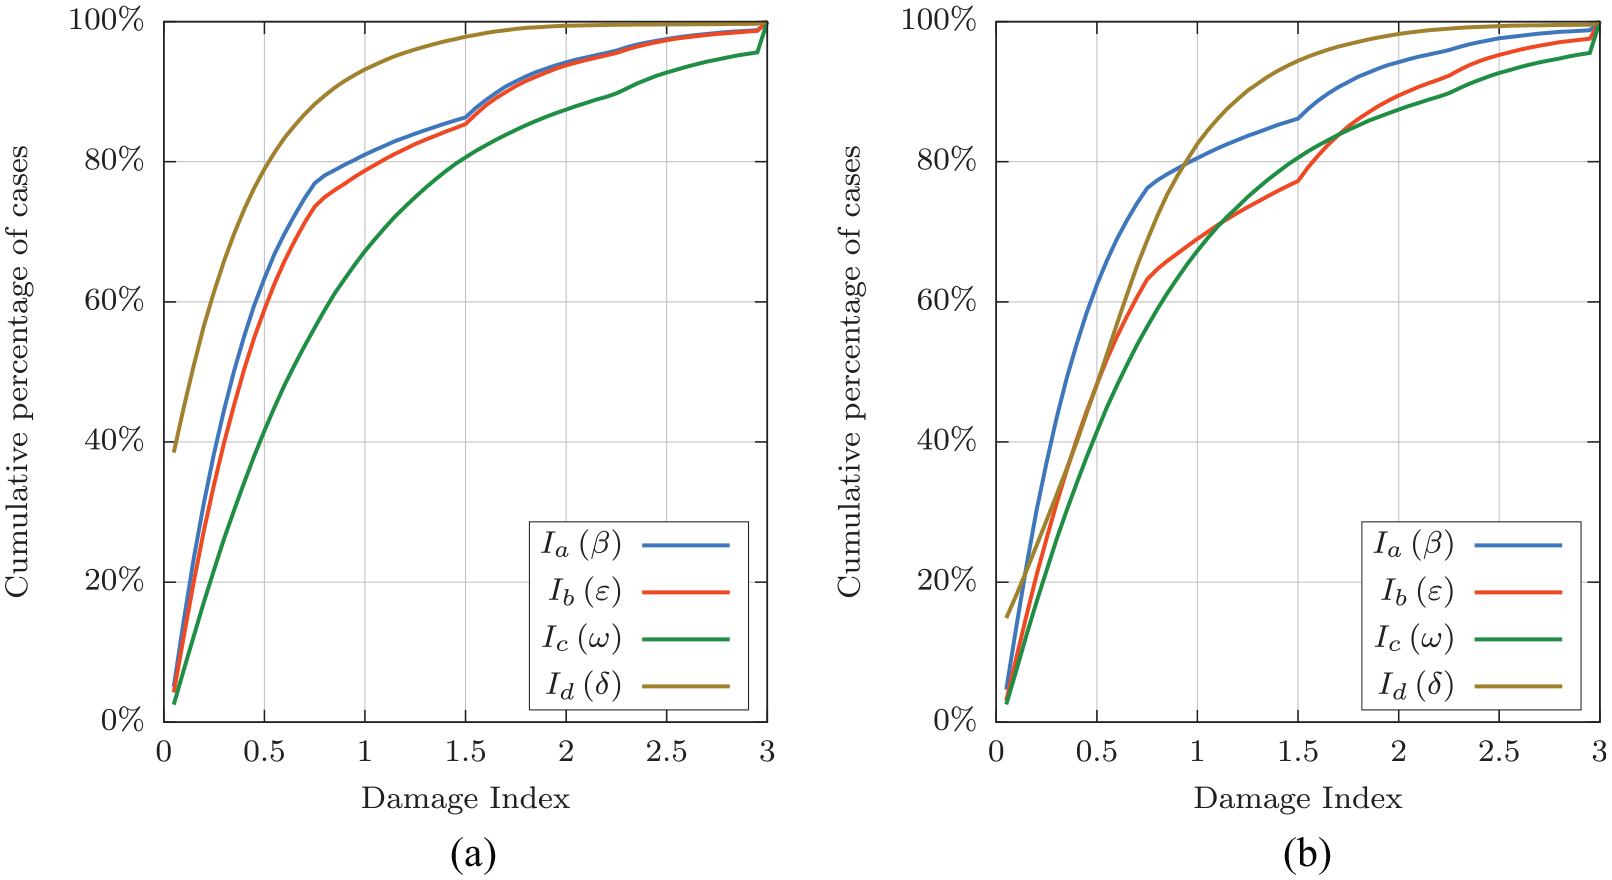
Fragility curves for generated cases according to four masonry models. (a) Using reference values. (b) Using varying properties for foundation and superstructure stiffness.
In the second approach (Figure 10(b)), the tilt model (c) remains the most conservative. However, the bending strain model (b) approximates it for the entire range of results. The deflection ratio model (d) is more conservative than in the first approach throughout the range of results, particularly in the range of lower damage indices. The angular distortion model (a) becomes the most conservative for low-damage indices and roughly at the centre of the envelope of the predicted results generated from all the models for indices above 1. Overall, the four models in the second approach provide a much narrower results envelope of predicted damage compared to the first approach.
The differences between the two approaches reflect the importance of considering soil–structure interaction effects in differential settlement analysis for damage prediction in buildings. However, the superstructure characteristics that influence these effects are generally not found in patrimonial building databases and are thus not practical to implement in a country- or region-scale analysis. Therefore, the tilt model (c), which proved to be the most conservative for the reference value approach, is adopted for the presentation of the country-scale results for Belgium.
Application in Belgium
Damage calculation
The results of the damage analysis are summarized in Table 7. These results indicate a total of 3715 structures potentially having sustained differential settlement damage in the period 1992–2018. The majority of potentially damaged structures are located in the Flanders region, yet the percentages for each category are similar for the three regions.
Summary of potential damage calculation for Belgium in 1992–2018: number of potentially damaged buildings per damage level, summarized per federal region.
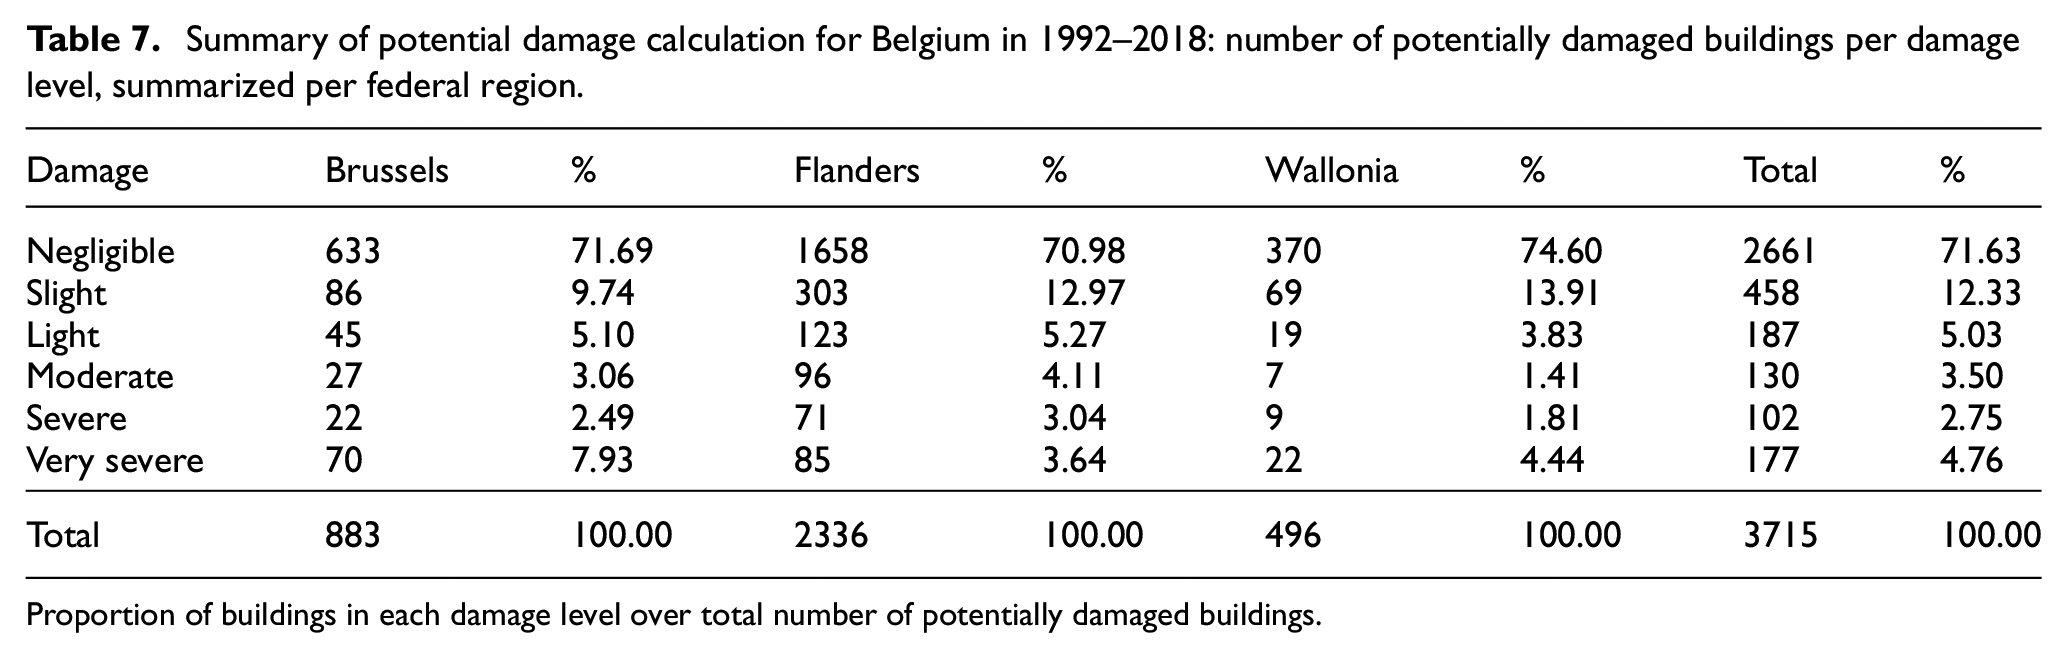
Proportion of buildings in each damage level over total number of potentially damaged buildings.
This potential damage, as a function of the ground movement profile gradient in the area of the building, highlights specific structures in need of further investigation.
Buildings on moving soil per time period
In addition to the quantitative damage assessment of the Belgian patrimonial building stock, a further analysis is carried out on all analyzed buildings. As estimated by Peduto et al., 45 an area subsiding or uplifting at a rate greater than 2 mm/year may be considered to be moving at a noticeable pace. While this criterion cannot be used for damage assessment, as it does not take differential settlements within the building into account, it provides an indication of possible regions with the risk of settlement damage.
The regions exceeding the velocity threshold of 2 mm/year are identified by the velocity values of the interpolation grid. Building polygons and their offset in contact with interpolation cells having a velocity greater than 2 mm/year are considered to be located on moving soil. The results of this analysis are summarized in Table 8. The period 1992–1997 indicates a total of 21,220 buildings on moving soil, corresponding to 7.9% of the patrimonial building stock. The overall number of heritage buildings on moving soil tends to decrease in later periods, with a small increase noted in Flanders and Wallonia for 2005–2010 and an increase in Brussels during 2016–2018.
Number of buildings on moving soil according to the 2 mm/year threshold, summarized per federal region and time period.
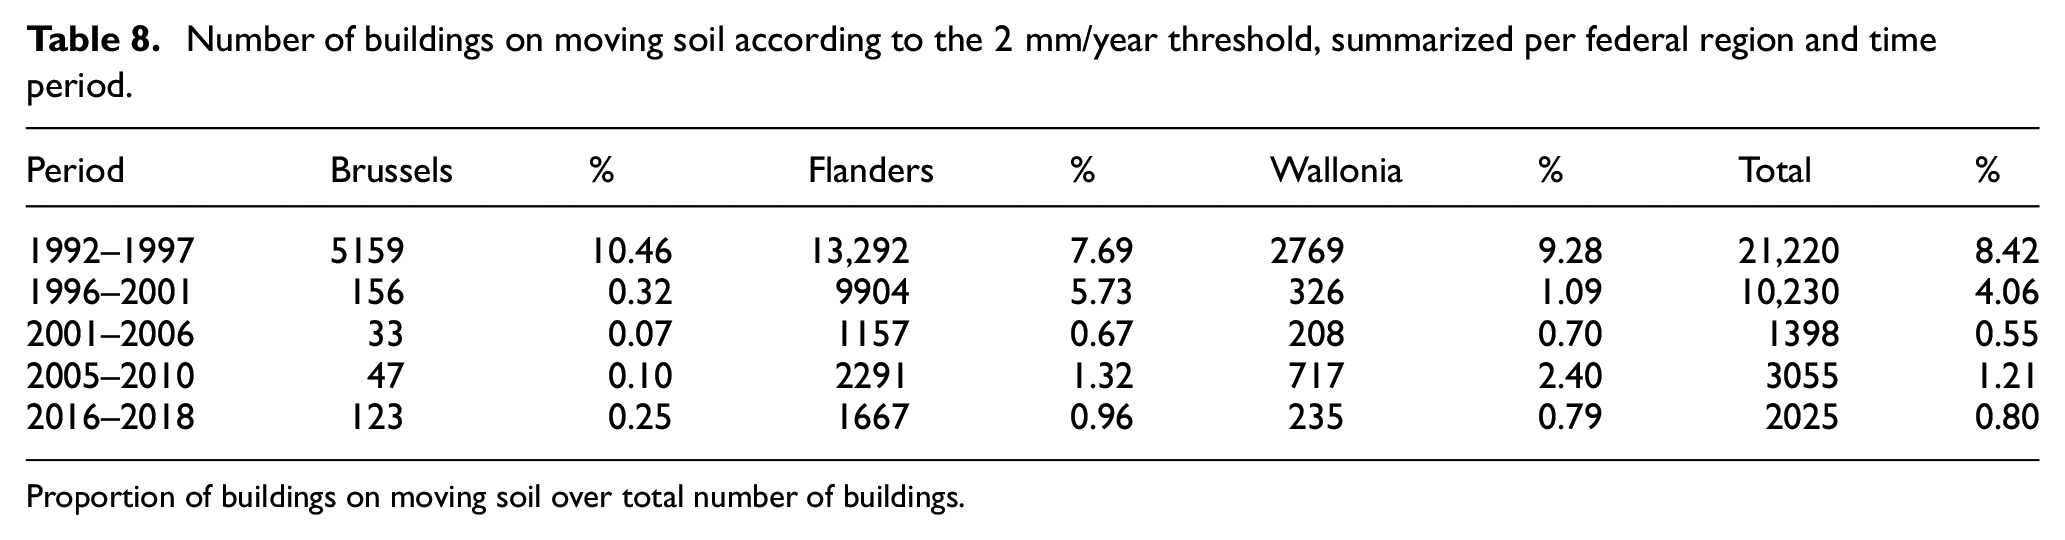
Proportion of buildings on moving soil over total number of buildings.
Results verification and evaluation
The analysis results were compared to site-visit findings from selected case studies. Two methods were employed for the selection of the case studies: (a) selection based on high registered tilt values during the measurement periods and (b) selection according to the analysis result, that is, buildings with high potential damage. Additional attention was paid to factors, such as accessibility. Overall, 18 buildings were investigated, mostly located in the areas around the closed collieries of Limburg and in the city of Leuven. The cases, analysis results and inspection outcomes are summarized in Table 9.
Potential damage calculation in selected cases.
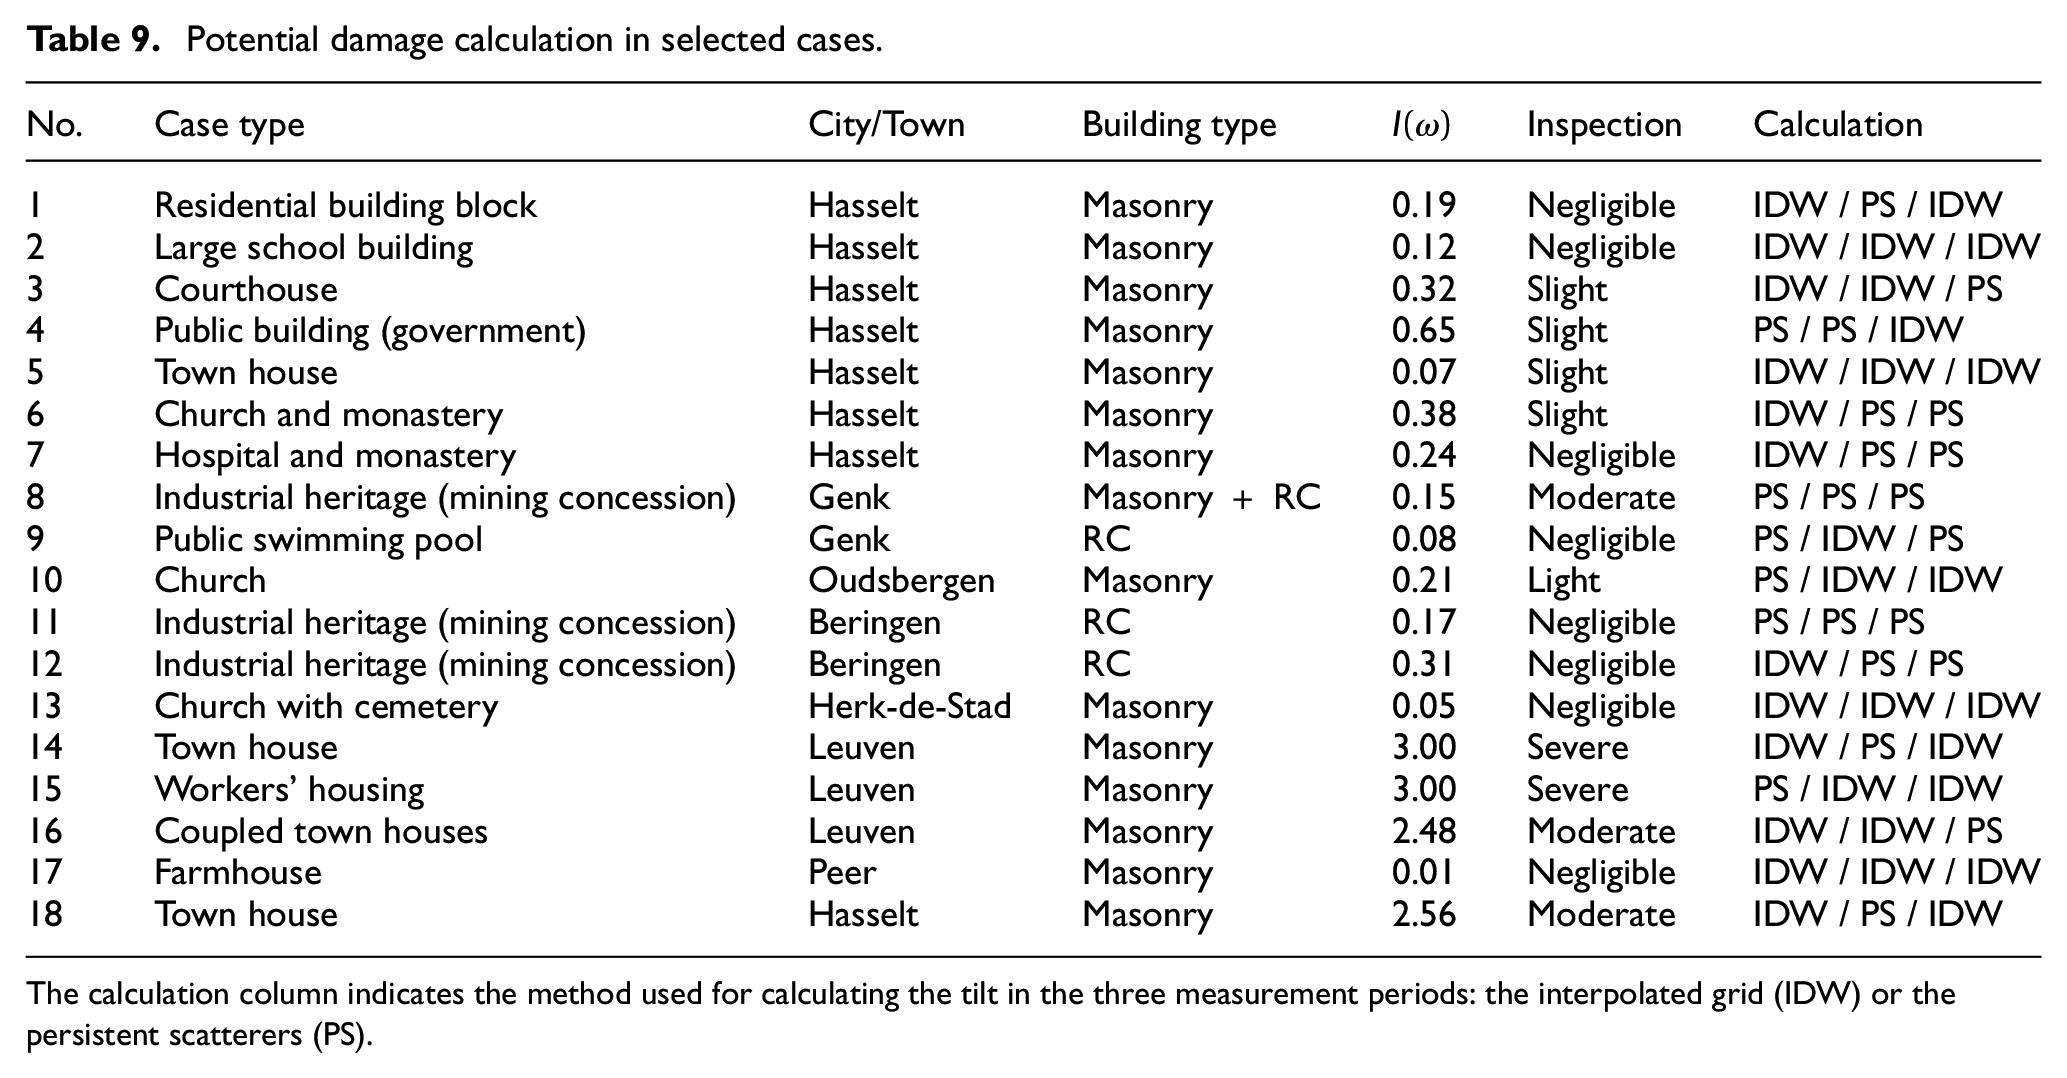
The calculation column indicates the method used for calculating the tilt in the three measurement periods: the interpolated grid (IDW) or the persistent scatterers (PS).
In total, 12 buildings were selected according to Method (a). According to the analysis results, all the buildings suffered negligible damage during the period 1992–2018. For 50% of the cases, on-site investigation did not reveal any differential movement damage and is thus in agreement with the analysis results. The remaining 50% presented damage, ranging from slight to moderate, but with evidence indicating that this damage was induced and repaired before the beginning of the measurement period.
Two buildings were highlighted according to Method (b) in the city of Hasselt, one with light and one with moderate calculated potential damage. Both cases have undergone renovation interventions during the measurement period. It was not possible to determine whether the interventions were related to settlement damage.
Three buildings were identified according to Method (b) in the city of Leuven, one with moderate and two with severe calculated potential damage. The moderately damaged and one of the severely damaged buildings have undergone renovation interventions. The other severely damaged building indeed presents substantial differential movement damage: wall cracks typical of ground settlement, roof parapet collapse and lintel failure.
Overall, distinguishing between movement partially registered due to structural changes, such as alterations in the roof, and movement due to ground settlement and uplift is not straightforward. The effects of the former are smeared out in the 10-m interpolation grid and thus do not affect the velocity threshold criterion. However, they may affect the potential damage calculation in the absence of prominent PS caused by actual ground movement.
It is possible to distinguish between movement in PS on the ground and in PS on buildings simply by evaluation of their coordinates against nearby building polygons. The movement of the former PS can be in most cases assumed to be caused by ground movement, although pavement renovation and topsoil changes cannot be ruled out with certainty. In the latter case, without the use of purpose-built reflectors installed on rigid points in selected buildings, 46 it is impossible to absolutely distinguish between movement caused by ground movement and by structural alterations. Wide-scale assessment is not conducive to this targeted strategy, as it would require a prohibitively large number of reflectors. Therefore, the adoption of more advanced interpolation methods, coupled with InSAR processing methods capable of producing a higher density of PS, presents a more realistic strategy. However, this approach would require piecewise application in geographic regions of sufficiently small dimensions to manage computational costs.
Conclusion
A method for the calculation of settlement-induced damage based on InSAR monitoring data on the country scale is presented in this article. This monitoring data are used in the combination with processed patrimonial and cadastral data for the calculation of imposed settlements on buildings, focusing, but not being limited to, historic masonry structures.
The damage calculation method was tested against a number of case studies from the literature, demonstrating sufficient accuracy in terms of damage classification. The verification against these case studies shows the potential of the calculation method to be in principle applicable at any analysis scale. The different damage indexing methods provide a range of results for common structural typologies.
The analysis results for the entirety of Belgium are presented, in terms of potential damage suffered in the period 1992–2018 and in terms of the amount of buildings on subsiding or uplifting soil. The former criterion, derived from the ground movement gradient in the area of the building, can be used for identifying potential building in need of repairs. The latter criterion, based on the ground movement velocity in the area of the building, can be used for prioritizing large-scale inspection efforts in areas of interest.
While the proposed method shows sufficient flexibility in terms of defining the properties of the building and loading parameters, the matter of soil–structure interaction during the application of arbitrary soil movement profiles remains open. The next step in the refinement of the methodology developed here would be the incorporation of this aspect in a generalized way. The marked influence of the soil type and the shear stiffness of the superstructure on the calculated damage index as highlighted in the sensitivity analysis further motivates this investigation.
Practical limitations currently restrict the use of InSAR data to medium-resolution sets. As a subject of future work, a two-step analysis can be designed, in which a wide-area assessment of ground movement is conducted using medium-resolution data, allowing the identification of areas of high interest. These areas can, in turn, be analyzed locally using high-resolution data, such as those provided by the TerraSAR-X or Cosmo-SkyMed satellites.
Finally, a coupling of damage analysis results with wider site-inspection efforts is necessary and needs to be emphasized in future work. This coupling serves the further validation of this and other similar analysis methods for ground movement damage prediction over large areas and can assist in the establishment of new and the enrichment of existing empirical relations between ground movement measured in the country scale and damage to buildings.
Footnotes
Appendix 1
Declaration of conflicting interests
The author(s) declared no potential conflicts of interest with respect to the research, authorship, and/or publication of this article.
Funding
The author(s) disclosed receipt of the following financial support for the research, authorship, and/or publication of this article: This work was funded by BRAIN.be, BelSPO in support of the ‘GEotechnical and Patrimonial Archives Toolbox for ARchitectural conservation in Belgium’ BR/132/A6/Gepatar (GEPATAR) research project.