
Abstract
This article evaluates the long-term stability of a Lorentz force guided wave electromagnetic acoustic transducer. The specific application of the investigated electromagnetic acoustic transducer is pipeline health monitoring using low-frequency (27 kHz) long-range torsional guided waves. There is a concern that repeated swings in the temperature of the structure can cause irreversible changes in the transduction mechanism and therefore pose a risk to the long-term stability of transducers. In this article we report on guided wave signals acquired on a custom-built transducer while it was exposed to more than 90 heating cycles. The highest temperature that was reached during cycling was 80°C and the measurements were acquired over a 14-month period. At the end of the 1-year period, the transducer phase had changed by 23.32° and its amplitude by 3.7%. However, this change was not gradual and most of the change occurred early on, before the highest temperature was first reached in the temperature cycling process. The observed change after this was 6.08° phase shift and 0.9% amplitude change. The possible sources of output changes were investigated, and it was found that the mechanical properties of the contact layer between the electromagnetic acoustic transducer and the pipe surface was very important. A soft silicone interlayer performed best and was able to reduce temperature-induced phase changes in the monitored signals from a maximum of 80 degrees phase change to about 20 degrees phase change, a fourfold reduction.
Keywords
Introduction and motivation
Non-destructive testing (NDT) of structures is traditionally performed as a standalone inspection, when operators access plants and manually carry out one-off inspections. 1 The manual inspections can be substituted by installing permanently installed transducers and then performing automated measurements. The methodology which uses the permanently installed transducers to collect data from the structure is called structural health monitoring (SHM).2–4 SHM systems offer several benefits: After initial installation of the transducer, measurements are performed without the presence of the operator, saving costs, and improving operator safety as humans are removed from working in hazardous environments. The increase in the measurement frequency results in more detailed knowledge about changes in the structure and increases the chance of defect detection as better knowledge of background variability is available.5,6 Another benefit of permanently installed transducers is that they can deliver more repeatable measurement data, as uncertainties associated with the installation process are more likely to remain constant.
However, monitoring of structures can only be performed reliably when stable transducers are used for the signal acquisitions. Any instability of the transducer can change the signal and that change might be mistaken for a defect in the structure. By deploying transducers which have high stability for long time periods, even small defects can be identified as signal changes caused by small reflections from defects exceed the transducer changes. Transducer stability is therefore a key requirement for SHM applications. Only a few reports that investigate the long-term stability of the sensors are available. Measurements with piezoelectric transducers have shown great performance in the short term, but their performance decreased for long-term applications. 7 Different research has reported that temperature swings alter the performance of bonded piezoelectric transducers.8,9 Electromagnetic acoustic transducers (EMATs) however operate contactlessly and do not need to be bonded to the structure. Because of their contactless operation mechanism, researchers suggested that they are also stable. 10 However, just because EMATs are not bonded, it cannot be directly inferred that they are stable. Therefore, the long-term stability of EMATs is evaluated in this research work.
This article focuses on the stability of EMATs which are used for torsional guided wave monitoring of pipelines. Using torsional guided waves for the measurement, it is possible to quickly screen a large section of the pipe. The reflected echoes are then collected and the acquired signal is analyzed. The excitation frequency of the guided wave EMATs is much lower than the frequency of the bulk wave EMATs (27 kHz for the presented signals), and therefore the excitation and reception mechanisms can be influenced by factors which are unique to low-frequency EMATs.
Possible effects of instabilities in a transducer array
A torsional guided wave transducer for applications on a 3-in NPS pipe with 12 equally distributed excitation locations (patches) around the circumference was designed. 11 Pure torsional waves are generated when each patch is excited by the same force. 12 Ideally, these excitation forces remain the same throughout the monitoring period (long-term life of the installed transducer). However, transducer (force) output stability might be disturbed if the structure is exposed to large temperature variations. The repeated exposure to temperature swings might alter the performance of the excitation mechanism as, for example, encountered in piezoelectric transducer systems. 8 Both transduction and reception mechanisms are important, as the acquired signals are influenced by the reception mechanism as well.
As the excitation waveform for the guided wave inspection is usually a narrow-band signal (Hann windowed tone-burst for our measurement),13,14 the changes on each individual excitation patch can be described as a combination of a change in amplitude and a change in phase. These changes will then alter the acquired ultrasonic signals. Two major categories of transducer changes are distinguished by the authors depending on how the excitation patches change compared to one another. The first is when all excitation patches in the EMAT array change by the same amount (same amplitude and phase), as shown in Figure 1(a). The second (less favorable) case is when the transducer degradation is not uniform on all excitation locations, as shown in Figure 1(b).
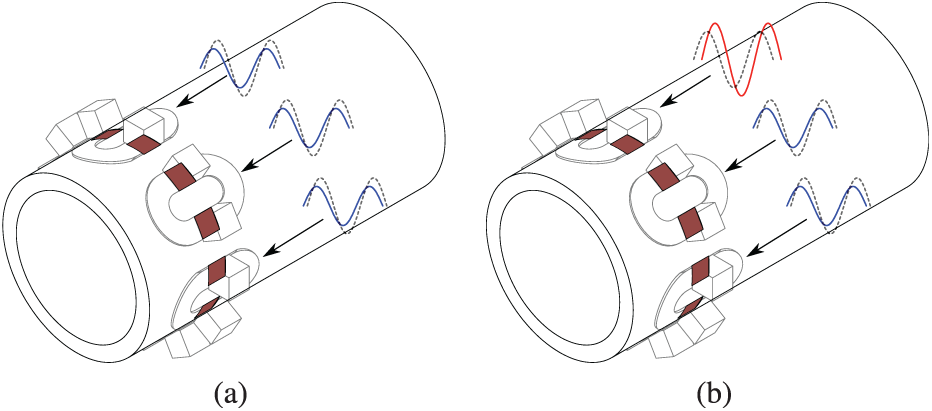
Different cases of transducer array degradation: all excitation patches generate tangential forces to excite torsional wave in the pipe. The excitation force might change in an uniform way (a), or some of the excitation patches are altered by a different amount (b). The original (reference) excitation is shown by dashed line and the changed force signals are shown in blue and red.
The effect caused by transducer degradation is easier to predict on the first (uniform) case when all excitation patches change in the same way. The effect of uniform phase change is significant where wave reflections are present in the ultrasonic signals. The change in the echoes will result in an increased residual signal and therefore limit the damage sensitivity near reflectors. The uniform change in excitation amplitude will result in an ultrasonic signal which is a scaled version of the original signal. This can simply be compensated for by scaling the signal in post-processing. Alternatively, if the phase of the excitation signal changes uniformly, the excited signal will suffer the same phase change. It will then result in a signal where the carrier sine wave is changed, but the envelope of the signal is unaffected. The compensation of this uniform phase change is a bit more challenging, but is possible when a reference wave packet is available in the signal. A compensation method is briefly referred to in section “Discussion—compensation and transducer improvement.”
A more complex situation arises when the excitation signal changes in a different way on each excitation patch. This will result in a non-uniform force distribution around the circumference (or a change in the default distribution) and can lead to the excitation of other unwanted modes (like flexural modes). These modes are usually dispersive and travel at different speeds than the main torsional wave. This will then change the coherent noise of the whole signal and would reduce the damage sensitivity on the whole length of the monitored pipeline. Unless the actual excitation forces can be measured at each location, the uneven transducer degradation is difficult to compensate for.
The key differences between uniform and non-uniform changes are summarized as follows:
Effect on the signal. Uniform changes mainly alter echoes in the time signal, and non-uniform changes also alter the coherent noise of the signal.
Damage detection. Uniform changes limit the damage detection near reflections only, and non-uniform changes affect sensitivity at the whole length of the structure.
Compensation method. Uniform changes (both amplitude and phase) can be compensated for, and non-uniform changes are practically impossible to compensate for using the time signals.
Temperature cycling of the EMAT guided wave transducer
The authors have previously presented the design of a guided wave transducer that can send and received torsional guided waves with signal-to-noise ratio (SNR) in excess of 40 dB. 15 The transducer consists of an array of racetrack coils that have magnets placed over their elongated central sections. Figure 2 shows a drawing of a section of the transducer ring assembly designed for a 3-in NPS pipe. The transducer is equipped with custom-made aluminum ribs which are responsible for the transducer’s longitudinal rigidity. Stainless steel screws and nuts were selected to fasten the aluminum ribs to the flexible printed circuit board (PCB). Neodymium–iron–boron magnets (N42 grade) are used to generate the static magnetic field of the transducer. The transducer fits around the pipe extending the radius by a maximum of 25 mm, and its approximate volume is 1 dm3. These magnets could be substituted by samarium–cobalt (SmCo) magnets for high-temperature applications16–18 (then all of the EMAT constituent parts operate at the temperature of 250°C). Nevertheless, the maximum operating temperature of the neodymium magnets is 80°C, and therefore the transducer was not exposed to temperatures above this temperature.
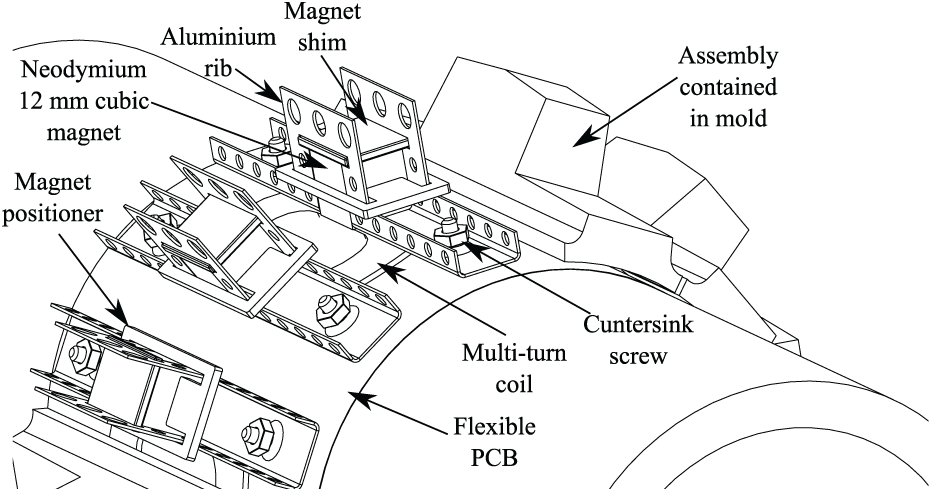
Mechanical design of the custom-built guided wave EMAT. The assembly consists of a flexible PCB, neodymium–iron–boron magnets, metal positioners, and silicone casing for rigidity. The transducer is designed so that it can easily be modified for high-temperature (~250°C) applications by replacing the neodymium magnets by high-temperature-resistant samarium–cobalt magnets.
Transmitting and receiving transducers are placed onto a 5-m-long 3-in NPS 3 SCH 40 carbon steel pipe as shown in Figure 3. The structure was exposed to repeated temperature swings to imitate the environmental changes and to accelerate any long-term transducer changes. A 5-m-long electrical heater (custom-made finned air heater; Clarian UK Ltd) was placed inside the pipe along its axis. The transmitter and receiver transducers are separated by 40 cm, so that the incident (direct) wave is partially separated from the cross-talk. The reception of the incident wave is made possible by a special cross-talk reduction design, so that the cross-talk signal does not mask the incident wave. 19 Example signals that were acquired on the pipe are shown in Figure 4.
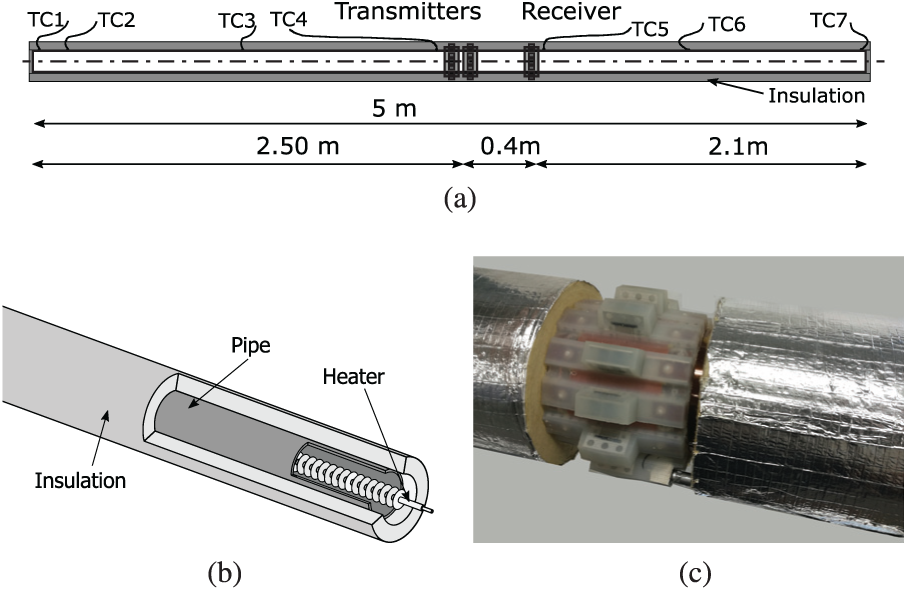
Measurement setup for evaluating the log-term stability of EMATs: transmitter and receiver transducers are placed onto a 5-m-long 3-in NPS 3 SCH 40 carbon steel pipe. The temperature of the pipe is monitored at seven locations (a). An electric heater placed at the core of the pipe is used for heating (b). The outside of the pipe is insulated for more uniform temperature distribution (during the tests insulation was placed over the transducer as well) (c).
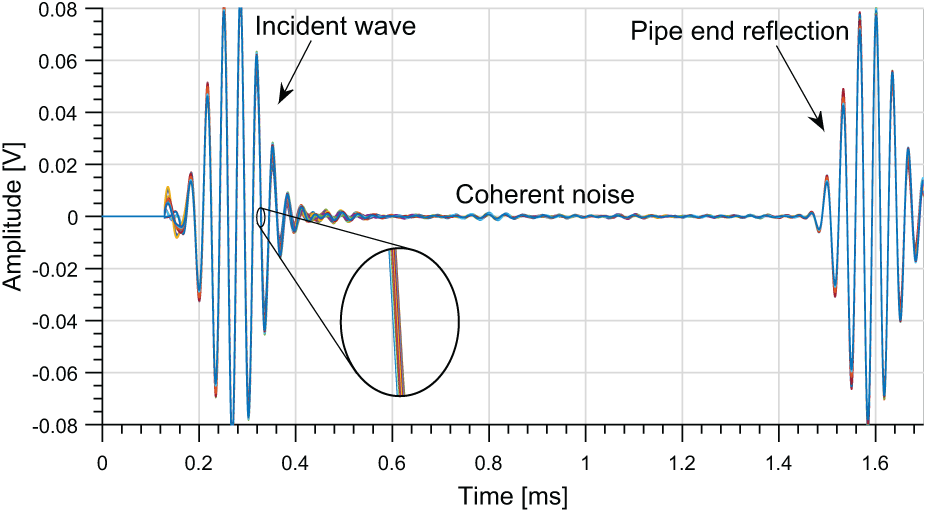
Experimentally acquired right traveling torsional guided wave signals. A total of 57 randomly selected signals are shown which were acquired on a room-temperature pipe (22.6°C–23°C) over the 14-month monitoring period. Signal stretch was applied onto the signals to reduce the effect of propagation speed changes.
The EMAT array transducer was installed onto the pipe in December 2016, and regular measurements were recorded for a period of over 1 year. After initial measurements were acquired at room temperature for ∼6 weeks, the pipe was heated by the 5-m-long electrical heater element, and the power was controlled by a feedback temperature controller (on/off temperature controller; RS Components Ltd.). The heater was placed inside the pipe along its axis before starting the long-term measurements so that the ultrasonic signals are not affected upon installation. The pipe was then exposed to numerous (94) heating cycles as shown in Figure 5. In each heating cycle, the pipe was heated to a selected temperature, this temperature was then maintained until a steady temperature was reached along the pipe, and signals were acquired during the cooling stage. The temperature was recorded with eight thermocouples distributed along the pipe (TC-08; Pico Technology) as shown in Figure 3. In total, 8032 directionally controlled20,21 signals were collected between the beginning of December 2016 and the end of January 2018. The temperature of the pipe at the receiver transducer location for each measurement is shown in Figure 5. The repetition rate of the measurements was set so that signals were recorded roughly at every degree Celsius during cooling off. Close to room temperature, the measurements were initiated every 2–3 h. Note that the x-axis in Figure 5 shows the measurement number and its scale is not representative of the actual elapsed time of the monitoring experiment.
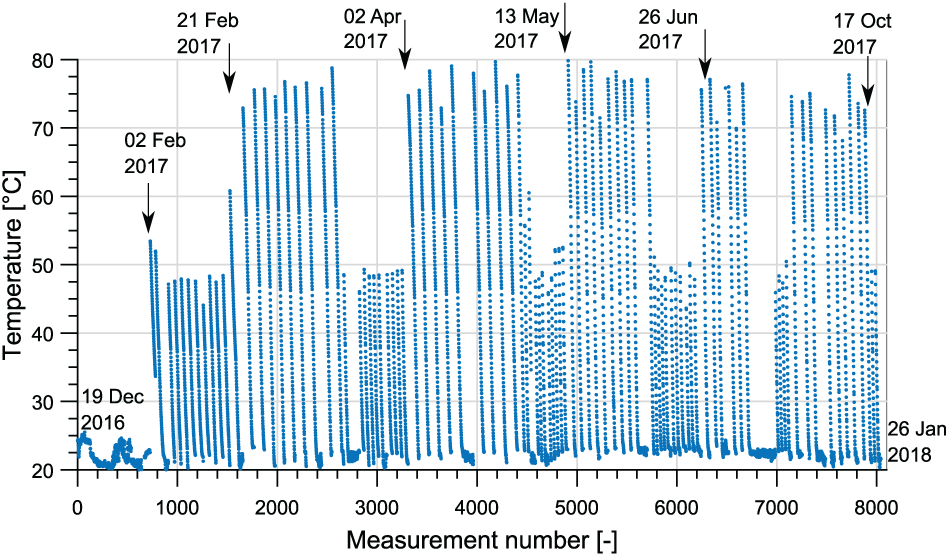
Temperature reading of thermocouple 5 (installed at the receiving transducer) for each measurement during the long-term temperature cycling of the EMAT.
Long-term stability of the guided wave EMAT array
During the 14 months of long-term measurements, a large number of guided wave signals were collected on the 3-in pipe. A few randomly selected room-temperature signals (traveling to the right direction of the pipe) are shown in Figure 4. The two large wave packets in the time signal are the incident wave (0.2–0.35 ms) and the pipe right end reflection (1.5–1.7 ms). Between the two echos the coherent noise can be observed.
The signals shown in the plots have been compensated for change in the torsional wave’s propagation speed by the baseline signal stretch22–24 method. An optimal stretch factor is estimated on the pipe end reflection, and the whole signal is stretched accordingly. The temperature compensation is performed before the stability evaluation so that the investigated parameters are less affected by temperature.
The stability of the torsional guided wave EMAT is then mainly evaluated on the incident wave (0.2–0.35 ms) as this part of the signal has propagated only for a short time, and any change is quite likely to be originating from changes in the transducer. The Hilbert envelope 25 was calculated for the signals, and the peak signal amplitude is recorded for each measurement. Furthermore, the phase of the incident wave packet is evaluated after applying a Tukey window. The frequency spectrum is calculated from the windowed time signals, and the phase value at the center frequency (27 kHz) is recorded for each measurement. The recorded amplitude and phase values are shown in Figure 6 for each measurement.
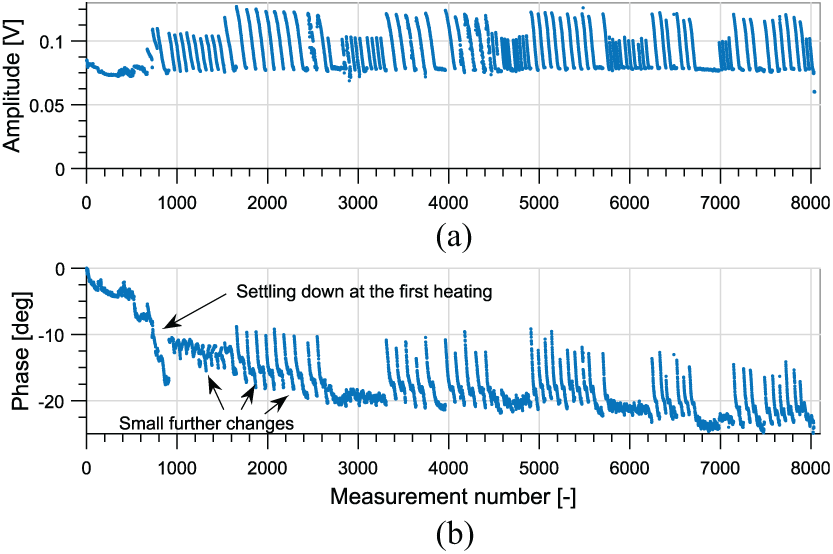
Evaluated amplitude (a) and phase (b) values of the incident wave packet of the acquired ultrasonic signal. The values were evaluated for every measurement during the long-term temperature cycling of the EMAT measurement system. A temperature-dependent behavior can be seen for both the amplitude and the phase, but the long-term trend is obvious only for the phase values.
The regular spikes seen on both amplitude and phase charts is caused by the temperature-dependent behavior of the transducer. When observing the long-term effects, it can be concluded that the amplitude remained stable (within 3.7% of the original value) for the whole measurement, and no obvious irreversible trend is observed. However, long-term changes can be observed on the phase of the wave packet. The majority of the phase change (17.24°) happened before the highest temperature exposure. An additional phase change is observed on the following 82 heating cycles, but this change is much smaller (additional 6.08°). The change in the phase values of the incident wave highlights the transducer changes which are the result of uniform change on all excitation patches.
As mentioned above, the non-uniform changes in the excitation patches will generate (or change) the unwanted modes, which will change the coherent noise of the signal. The signal part from 0.73 to 1.44 ms was selected to evaluate the coherent noise over the long-term evaluation period. The maximum value of the residual signal (difference between the baseline and the reading signal) for the given time period was collected for each measurement. Figure 7 shows the evaluated maximum residual values for each room-temperature measurement relative to the incident wave amplitude. On examination of the residuals, it was noticed that the residual level varied for some measurements, but no long-term trend can be observed during these random variations. When observing the corresponding signals, it was noticed that variations in Figure 7 are the result of changes in the SNR of the measurements. By the end of the 14 months, the change in the coherent noise level was 0.8%. This means that defects with small reflection coefficient (e.g. 1.5%) would be picked up with high confidence, and the damage detection capability is not compromized. Furthermore, as the change in coherent noise level was evaluated as the maximum value of the residual signal over the whole range of the time period (0.73–1.44 ms), this estimation is very conservative.
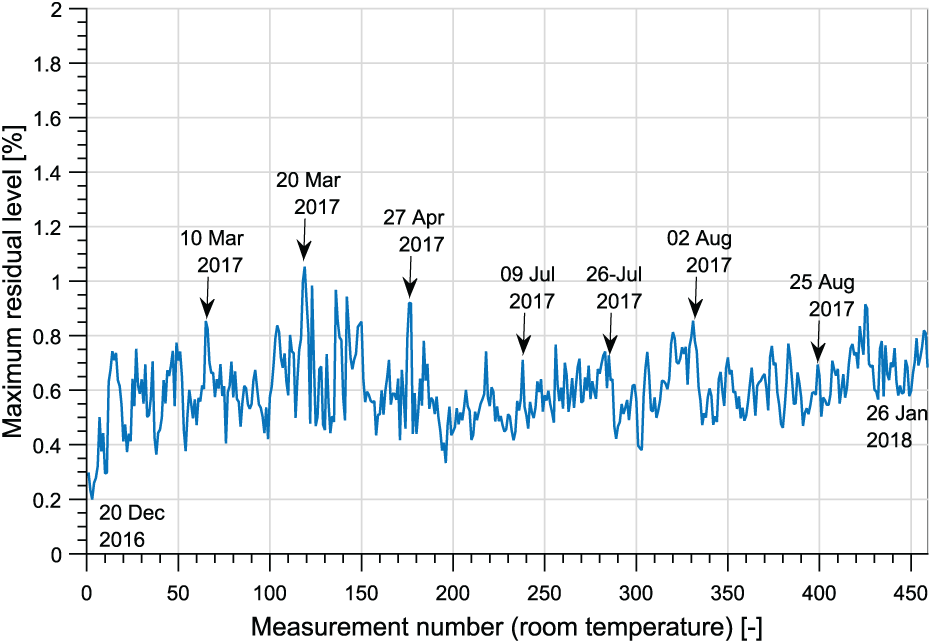
Maximum residual value (relative to the incident wave amplitude) in the area of the signal where only coherent noise is expected (0.73 and 1.44 ms) for each room-temperature measurement during the long-term monitoring.
Investigation of instability sources
The long-term monitoring (measurement described above) was left undisturbed, and a new test setup was built in order to investigate the source of instabilities. The torsional guided wave EMAT system is complex, and the cause of the small, but obvious, observed long-term change is unknown. Therefore, subsystems in the EMAT system were tested to assess their stability individually. The following investigations were performed:
It was ruled out that the electrical transmission and reception instrumentation of the EMAT system could have given rise to the changes by regularly connecting the instrumentation to a signal attenuator (rather than the EMAT) and tracking the response across it. The results did not show any sign that the instrumentation could be the cause of any changes in the signal. Furthermore, as the instrumentation itself is placed outside the insulation of the pipe, no accelerated change is expected in its performance when the pipe is heated for the first time.
Another long-term measurement was started where the input current of the transmitting transducer was measured in addition to the signal itself. The pipe was exposed to 35 heating cycles, with the temperature of the pipe reaching 80°C. The measured current waveforms show reversible changes as a function of the temperature (as presented in Herdovics and Cegla 26 ), but no long-term change or degradation was noticed. Figure 8 shows the input current for a few current measurements when the pipe and the transducer were at room temperature. The legend displays the highest temperature the transducer was exposed to. The maximum change in the current waveform between the first and the last measurement was 0.39% and 0.24°. This level of change is insignificant compared to the phase changes in Figure 6.
In addition, during the repeated measurements, the impedance of the transmitter and receiver transducers was recorded as well when the pipe and the transducers reached room temperature. Figure 9 shows the acquired impedances (real and imaginary parts) of the transmitting transducer. The change in the measured values varies by around 0.32% in amplitude and 0.09° in phase. Since both the coil input current and the impedance have been measured, and both are stable, it can be implied that the induced eddy current is stable as well. The change in the eddy current could either be picked up from the impedance change or from the input current change.
The EMAT array is designed so that the six coils (and 12 magnets) are evenly distributed along the circumference of the pipe. If for any reason the position of the coils or the magnets changes, the excited ultrasound will change as well. The reported measurements were done on carbon steel pipes. Therefore, the magnets of the transducer will hold the transducer segments in place, preventing the displacement of the segments of the EMAT array. For measurements performed on non-ferromagnetic structures, the EMAT should be clamped to the surface so that it is not possible to be moved.
The EMAT operates contactlessly and does not require any adhesive in order to work. Nevertheless, the EMAT coils are pushed to the pipe surface by the permanent magnets. The Lorentz force of the EMAT is concentrated on the structure’s surface, which is in contact with the transducer. Measurements show that the generated ultrasound is then influenced by the materials contacting the surface. More importantly, if the contact behavior changes, then the excited ultrasonic signal will change as well. The authors have performed several tests and measurements, and believe that the contact material influences the performance and the stability of the low-frequency guided wave EMATs. These measurements will be detailed in the next section.
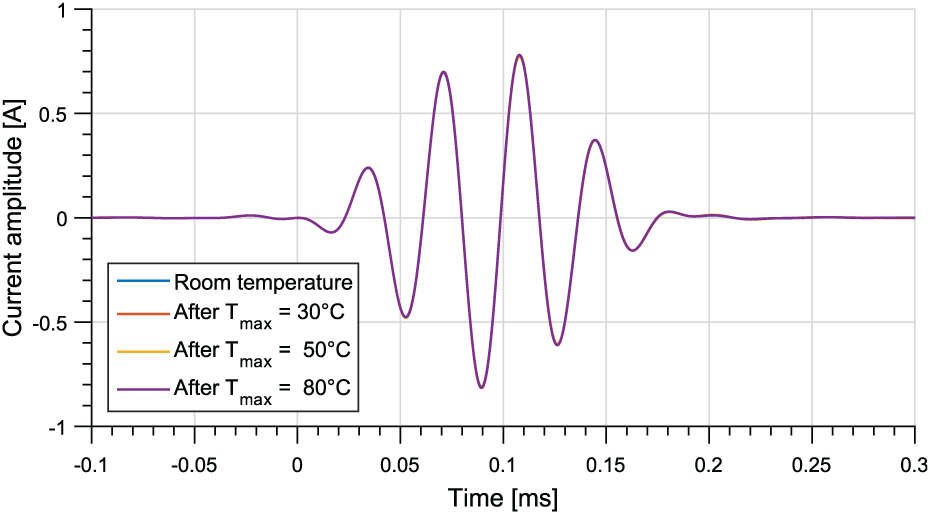
Measured excitation waveforms of the EMAT at room temperature. Legend shows the highest temperature the transducer and the structure have been exposed to.
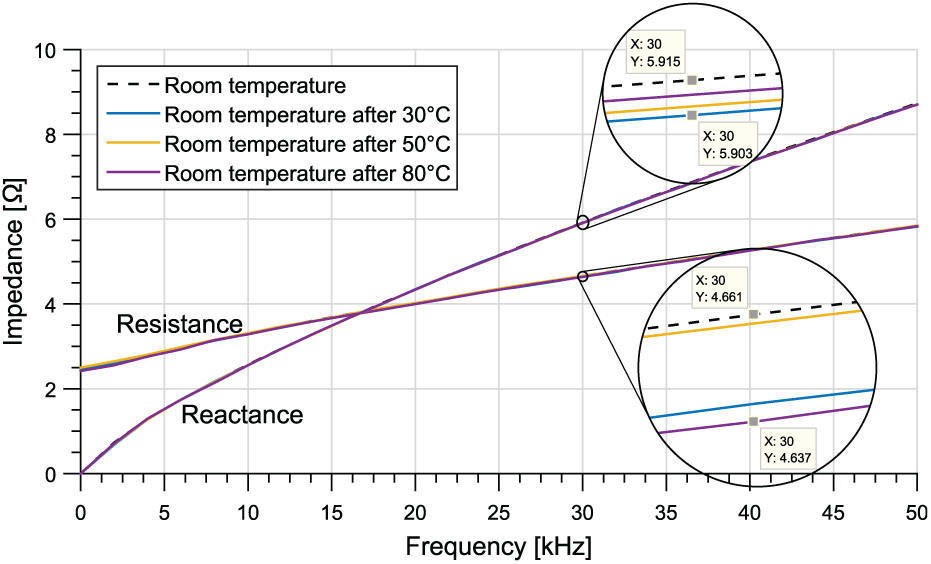
Measured impedance of the transmitting transducer for the frequency range of 0–50 kHz. All measurements were performed at room temperature; the legend shows the highest temperature the transducer and the structure have been exposed to.
Investigation/influence of contact material
It was observed that the material between the coil wiring and the pipe surface influences the ultrasound that is excited by the EMATs. Originally, a thin Kapton sheet was used to electrically insulate the coils from the conductive specimen. Several different insulation materials were tested and it was concluded that the (otherwise repeatable) performance is dependent on the sheet material. Experiments were performed to support and verify the conjecture that the contact material influences the excited ultrasound:
Ultrasonic signals were recorded with different transducer lift-off values. For these measurements, different numbers of plastic sheets were placed in between the transducer and the pipe surface to measure signals with different lift-off values. Decreases in both the eddy current and the static magnetic field are expected with increased lift-off distances. In contrast to that, it was observed that the signal amplitude increases (by 28% at 1 mm lift-off) when spacers were inserted underneath the transducer. The increase in the signal amplitude is believed to be caused by a reduction in the mechanical shear coupling between then transducer and the pipe at the contact patch.
EMATs were tested when different contact materials were placed between the transducer and the pipe surface, and signals were collected over a wide frequency range (20–70 kHz). It has been observed that the signal amplitude is influenced by the contact material, as the peak gain of the transfer function was measured to be at different frequencies (between 38 and 48 kHz). Figure 10 shows the normalized signal amplitudes for different contact materials. The shift in the peak amplitude (resonant frequency) is the result of different coupling material between the transducer and the pipe.
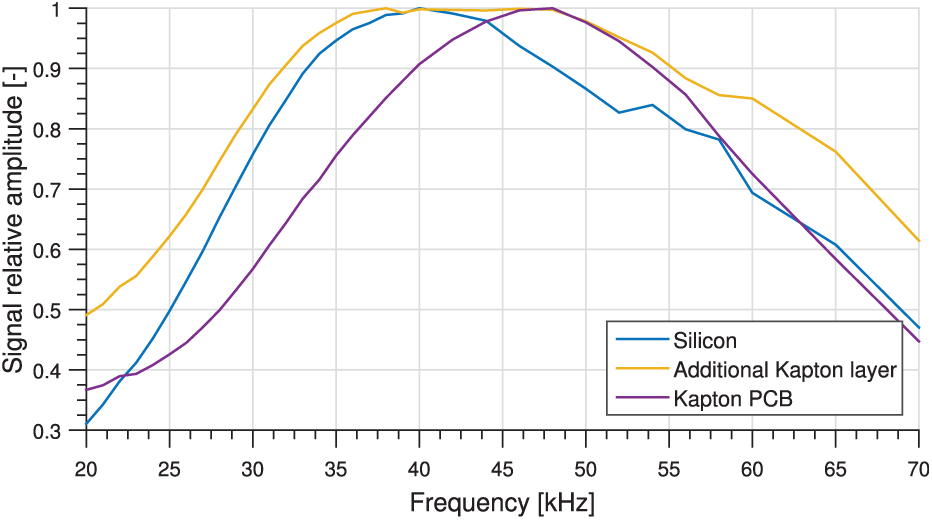
Normalized amplitude of the measured torsional guided wave signal at different frequencies for different contact materials. For all measurements, the excitation voltage was set to the same value.
The EMAT presented in this document is designed so that it excites the ultrasonic wave via the Lorentz force mechanism. The excitation is often said to be contactless as the Lorentz force is generated on the eddy current inside the pipe; however, an opposite force is also generated on the transducer due to the coil current. Then, as the permanent magnets push the EMAT coils onto the specimen surface, the vibration of the coil influences the displacement of the pipe/specimen surface as shown in Figure 11. For different materials, the coupling between the transducer and the pipe is different, and hence the transfer function is different. It then means that the contactless operation of the EMAT is somewhat altered by the contact material performance.
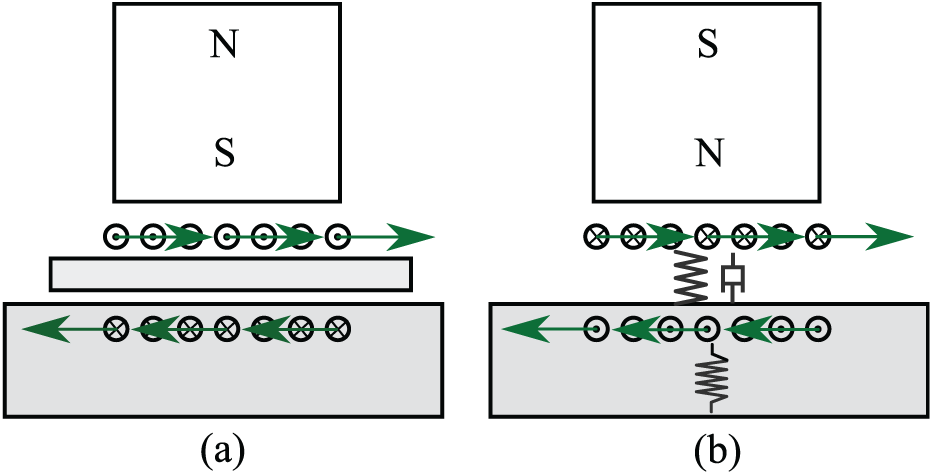
Excitation mechanism of the EMAT: the Lorentz force acts on both the eddy current and the coil current, but with a different direction (a). The material which is in contact between the coil wiring and structure influences the excitation (b).
As each material has different behavior, the vibration of the EMAT coils can couple to the pipe surface, potentially affecting the wave generation. Ideally, a contact material should be chosen which can isolate the vibration of the coils.
Discussion—compensation and transducer improvement
The result of uniform changes on all excitation patches can be compensated for. Since the excitation changes, all echoes in the ultrasonic signal are affected the same way, and this can be compensated for. The authors have previously presented a method which compensates the signal for amplitude and excitation phase changes (caused by temperature variations) in addition to the propagation speed changes. 26 Using the same algorithm, long-term transducer changes (uniform) can be compensated as well and residuals at the echo are reduced. Results show that by compensating for the phase response changes of the transducer, a significant improvement can be reached in the residual level at the echo locations, as the residual at the pipe right end reflection is decreased from 6% to ∼3.5%.
However, instead of using signal compensation methods, it is more favorable to design the transducer so that the highest stability is guaranteed. The overall goal is to design a transducer which is stable for long time periods. The previous sections have shown that the material that is in contact with the transducer and the pipe surface influences the excitation. It was found that different materials affect the EMAT performance in different ways. A silicone interlayer was installed between the transducer and the pipe which can decouple the transducer from the pipe surface better, and the EMAT is less sensitive to temperature swings.
To confirm this, new temperature cycled stability tests were started and different transducers were tested. Transducers were exposed (in separate measurements) to four temperature cycles with a maximum temperature of 30°C, 50°C, 80°C, and 80°C. Figure 12 shows the evaluated phase values of the incident wave (blue) and the temperature exposure of the pipe (gray). The previous EMAT prototype which is equiped with an air gap was placed onto the pipe (Figure 12(a)), whereas Figure 12(b) shows the results when a silicone layer was placed in between the transducer and the pipe surface. The results indicate that in the case when a silicone layer was used as a contact material the signals were less sensitive to temperature changes. In addition, the estimated phase values showed much larger stability, as no trend can be observed for the transducer with silicone contact material.
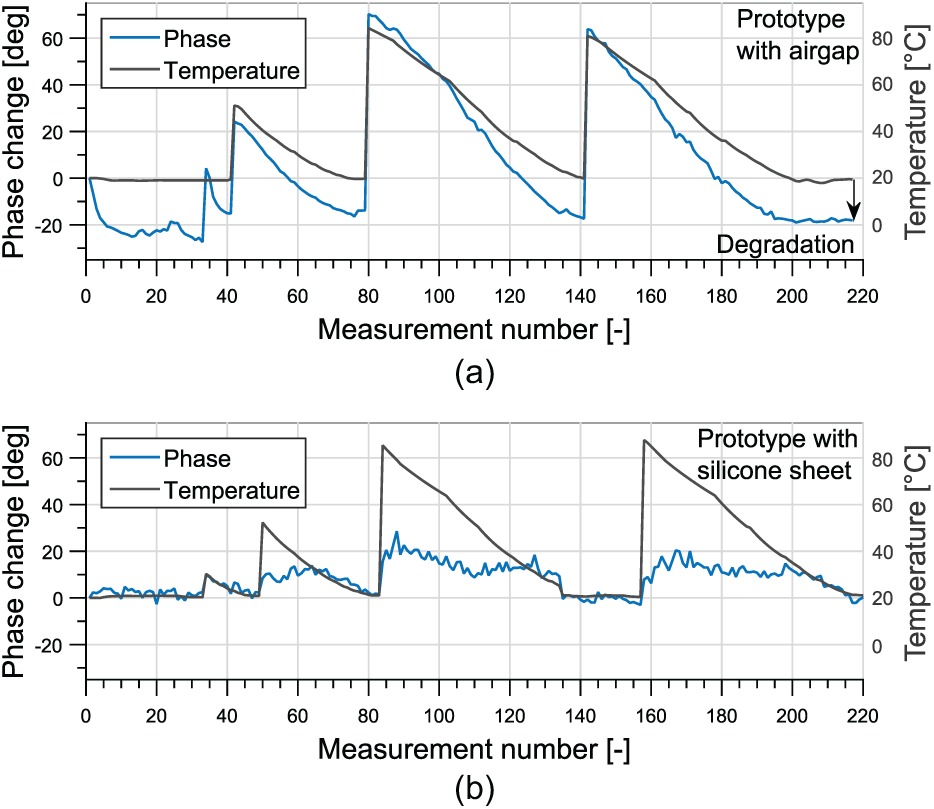
Evaluated phase change of the ultrasonic signals acquired when (a) previous EMAT design was used with an air gap between the PCB and the pipe wall and (b) when silicone sheet was separating the EMAT coils from the pipe surface. The transducers were exposed to 30°C, 50°C, 80°C, and 80°C heating cycles.
Conclusion
This article presents quantitative evaluation of the long-term stability of a torsional guided wave Lorentz force EMAT. Long-term measurement results for 94 temperature cycles with the highest temperature reaching 80°C are presented. The signals were acquired between December 2016 and February 2018. The evaluated data show that the signals can be measured with high robustness, as the amplitude of the signal remained stable (within 4% of original value). However, the phase of the acquired signal (evaluated at the incident wave which has directly traveled from the transmitting transducers to the receiving transducer) changed considerably (17.24°) during the early stage of the evaluation until the highest temperature exposure was reached. The change in the signal’s phase is much less (additional 6.08°) in the following 83 temperature cycles. Changes at the coherent noise of the signal ( 0.73–1.44 ms) were minimal, as the residual signal (difference between baseline and reading) is less, than 1%, which is comparable with the random noise level.
Parts of the EMAT system were tested further individually to find explanations for the observed behavior. In a repeated test, the input current of the transducer was monitored, which showed only 0.39% amplitude and 0.24° phase change between room-temperature measurements. The electrical impedance of the transducer was also measured at room temperatures, and it showed the maximum difference of 0.32% in amplitude and 0.09° in phase.
It was recognized that the Lorentz force is not only generated on the eddy current, but also on the coil current, causing a vibration in the transducer. Then, as the permanent magnets push the transducer to the pipe surface, the transducer vibration can affect the wave generation depending on the contact material properties. The results show that the stability of the excitation mechanism of the EMAT that is often said to be contactless seems to be very sensitive to the interlayer, and therefore the contact between EMAT and pipe is more important than previously believed. Different contact materials have been tested, and it was shown that a silicone interlayer can decrease phase variations (caused by temperature) significantly and further increase the stability.
Footnotes
Acknowledgements
The authors would like to thank Professor Peter Nagy from University of Cincinnati for discussion about the effect of contact on the EMAT performance.
Declaration of conflicting interests
The author(s) declared the following potential conflicts of interest with respect to the research, authorship, and/or publication of this article: Some features of the particular guided wave EMAT that was tested have been patent protected (patent publication no. WO2017158318).
Funding
The author(s) disclosed receipt of the following financial support for the research, authorship, and/or publication of this article: Both authors would like to thank the EPSRC for funding under the Grant No. EP/K033565/1.