
Abstract
In this study, we present the newly developed Misconceptions about Multimedia Learning Questionnaire (MMLQ), we evaluate its psychometric properties (item difficulties, scale reliabilities, and internal structure), and we use it to examine the prevalence of four different misconceptions about multimedia learning in student teachers and teachers. A total of 311 participants (176 teachers and 135 student teachers) responded to the items of the MMLQ. The results revealed moderate reliabilities of the MMLQ scales. Moreover, an a priori assumed four-factor structure of misconceptions about multimedia learning was most compatible with teachers’ and student teachers’ answers to the MMLQ items. These four factors were learning styles (multimedia instruction needs to be adapted to students’ learning styles [visual or auditory]), hemispheric isolation (multimedia instruction enables hemispheric communication), naïve summation (multimedia instruction is more effective the more sensory channels are used), and motivation primacy (multimedia instruction is mainly effective because it is motivating). The majority of teachers and student teachers endorsed three of the four misconceptions about multimedia learning (i.e., learning styles [78.1%], hemispheric isolation [58.8%], and naïve summation [81.4%]) as assessed by the MMLQ. This finding may provide valuable information for teacher education and training regarding this specific issue.
An integral part of teaching is to prepare instructional materials that consist of texts and different forms of pictures (e.g., diagrams, photographs) so that students can effectively learn with them (e.g., McElvany et al., 2010). Instructional materials that consist of text and pictures qualify as “multimedia” instructional materials (Weidenmann, 2009). A well-informed use of multimedia for teaching has been shown to be beneficial for learning and worth the effort. Many studies from educational psychology showed that students who learned with multimedia outperformed students who learned with text alone (i.e., multimedia effect; Butcher, 2014; Carney & Levin, 2002; Levie & Lentz, 1982). Such a multimedia effect, however, manifests itself only with a good instructional design, for example, a design that facilitates the integration of information from both text and pictures (Ainsworth, 2006; Mayer, 2014; Schnotz, 2014). When pictures do not illustrate main ideas but, instead, show rather unimportant details from the text, they may even be detrimental to learning and should be avoided (Harp & Mayer, 1998; Rey, 2012). It is thus crucial for teachers to know these facts. If teachers or instructors hold the misconception that text and pictures support learning just because they provide a richer sensory experience and thus believe that the use of text and pictures directly translates to better learning (e.g., Looß, 2001), they might add pictures regardless of their relation to the text. Such a design decision would pose a risk rather than having a benefit for students’ learning.
Because misconceptions are robust to change and may hamper knowledge acquisition (Vosniadou, 1994), teacher education and training programs are likely to be more successful when they address misconceptions effectively. However, before misconceptions can be addressed, it must first be established whether and, if so, which misconceptions about multimedia learning exist, and whether they can be assessed in a differential manner; this is the focus of the present research. In particular, we will present the newly constructed Misconceptions about Multimedia Learning Questionnaire (MMLQ), evaluate its psychometric properties (item difficulties, scale reliabilities, and internal structure), and use it to assess the prevalence of misconceptions about multimedia learning in student teachers and teachers.
Misconceptions About Multimedia Learning
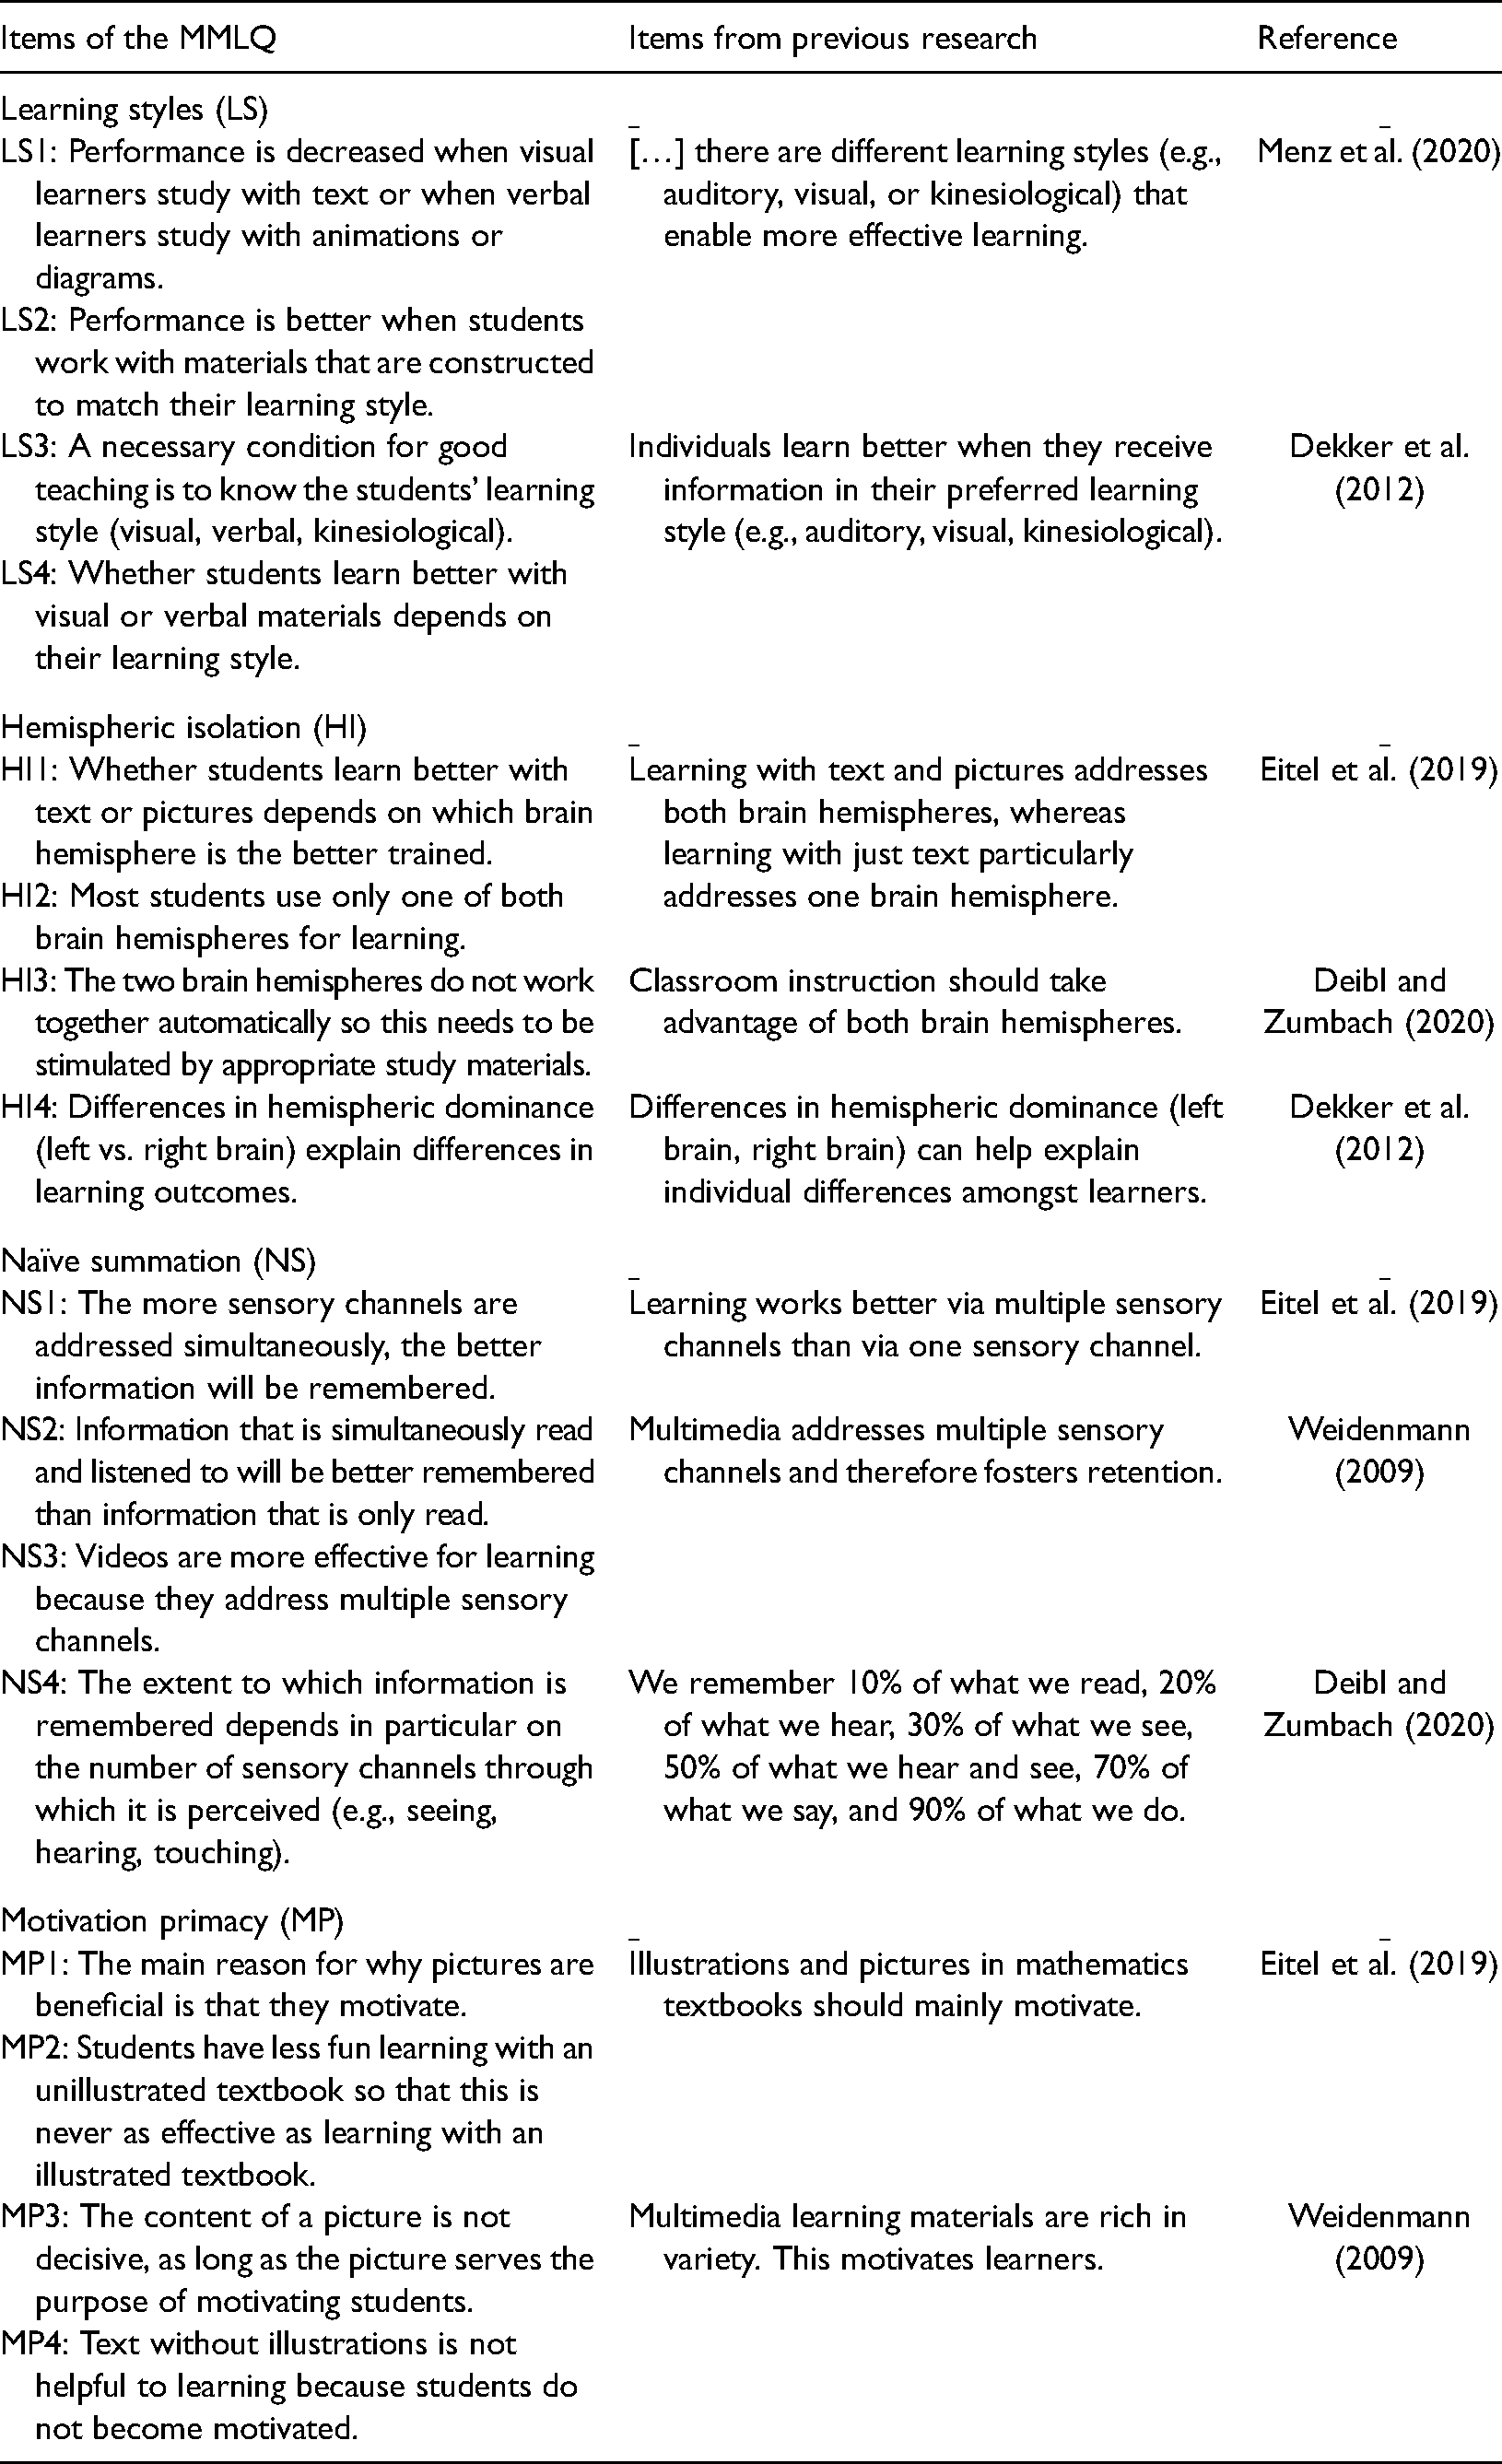
We define misconceptions as beliefs that are incongruent with empirical findings and scientific explanations (Tippett, 2010). Misconceptions may arise when incorrect information (in the popular media or even from instruction) is encountered, or they may reflect naïve or commonsense theories that, however, lack explanatory power and coherence to explain the general pattern of results obtained from research (Hughes et al., 2013; Vosniadou & Skopeliti, 2017). For instance, it may be commonsense that enriching texts with sounds, attractive pictures, or even real objects provide a richer sensory experience that translates into better learning (e.g., Treichler, 1967). However, the simple idea of “the more the better” in terms of addressing sensory channels for learning is incongruent with empirical evidence showing that the use of attractive pictures and texts that do not display task-relevant information hinders rather than helps learning (e.g., Sundararajan & Adesope, 2020). Moreover, “the more the better” in terms of addressing sensory channels is incongruent with the scientific explanation that presenting irrelevant or redundant information increases the risk of overburdening the limited cognitive resources required to consciously process information (Mayer, 2014; Sweller, 2020). It thus counts as a misconception (naïve summation [NS] misconception; Weidenmann, 2002). More specifically, it counts as a misconception about multimedia learning because it refers to the psychological definition of multimedia learning (Weidenmann, 2009) as learning with multiple codes (text and picture) and/or multiple sensory modes (e.g., auditory and visual; see the Discussion section for definitions from other perspectives). In line with this psychological perspective, three more common misconceptions about multimedia learning can be derived from previous research, namely, learning styles (LS), hemispheric isolation (HI), and motivation primacy (MP). The items used in previous research to assess beliefs about multimedia learning (see Table 1) can be clustered into four postulated misconceptions that address four different issues related to multimedia learning (individual differences, neuronal functioning, sensory impression, and motivating potential). These four misconceptions are the hypothesized scales of the MMLQ and are described in the following.
Items of the Misconceptions about Multimedia Learning Questionnaire (MMLQ) and Their Relation to Items Used in Previous Research.
The LS Misconception
The LS misconception comprises the belief that students learn better when they receive information in accordance with their learning style (e.g., visual vs. auditory; Vester, 1998). This belief probably goes back to neurophysiological evidence that visual information and auditory information is processed in different brain regions (Dekker et al., 2012; Howard-Jones, 2014). Based on this evidence, it has been concluded that people prefer to process information and are especially competent in processing information either in the visual brain region (visualizers) or in the auditory brain region (verbalizers; see also visualizer–verbalizer distinction; Kirschner, 2017). Empirical research suggests that students indeed categorize themselves either as visualizers, because they prefer learning with self-generated and provided pictures, or as verbalizers, because they prefer learning with spoken and written words (Mayer & Massa, 2003). However, empirical research does not support the idea that visualizers actually learn better with pictures only and that verbalizers actually learn better with text only (see An & Carr, 2017; Pashler et al., 2008; Rohrer & Pashler, 2012, for reviews).
The visualizer–verbalizer distinction is one example of the breadth of LS taxonomies (see Coffield et al., 2004). Considering the lack of empirical evidence, the idea that effective teaching should be adapted in accordance with students’ LS—for example, with pictures provided for “visualizers” and texts provided for “verbalizers”—qualifies as a misconception. Holding this LS misconception as a teacher may be counter-productive for effective teaching because the (limited) time that is available to prepare courses might be wasted on trying to diagnose students’ LS and adapting instruction accordingly.
Previous research indicates that student teachers and teachers endorse the LS misconception. For instance, Tardif et al. (2015) showed that 96% of teachers in their sample fully agreed or somewhat agreed that some individuals are visualizers while others are verbalizers, and around 95% of the teachers surveyed by Dekker et al. (2012) and 94% of those surveyed by Papadatou-Pastou et al. (2017) believed that individuals learn better when they receive information adapted to their preferred learning style (see also Menz et al., 2020, 2021 for similar findings). Although agreement scores were somewhat lower (82%) in another study by Krammer et al. (2019) with student teachers in their first term, empirical research suggests that the LS misconception is present in educational contexts.
The HI Misconception
Findings from early brain research show that the brain hemispheres are differently involved in language and picture or spatial processing (Levy, 1974). It was concluded from such findings that teachers or educators should present both text and pictures (i.e., multimedia) to students to activate both brain hemispheres. This is based on the assumption that, when both brain hemispheres are activated, retention is better. But the conclusion is unjustified, for instance, because processing text often activates spontaneous mental imagery (Begg & Paivio, 1969), which leads to a neurological activation pattern that is similar to the pattern that occurs when processing text and pictures (Ganis et al., 2004). This unjustified conclusion was termed the HI (or specialization) misconception in previous research (Eitel et al., 2019; Weidenmann, 2002). It not only misapplies knowledge from brain research to educational practice (miscategorization; Chi, 2005); it also includes the false belief that the two hemispheres work independently of each other (e.g., Tardif et al., 2015).
Nonetheless, previous research shows that teachers endorse the HI misconception to a moderate degree: 51% of in-service teachers (Tardif et al., 2015) and 67% of student teachers (Eitel et al., 2019) agreed with a statement that endorsed the misconception. Moreover, the HI misconception comprises the assumption that differences in the hemispheric dominance explain differences in learning outcomes; this assumption was endorsed by 71%–91% of teachers in several countries (Ferrero et al., 2016; Howard-Jones, 2014; Krammer et al., 2019). Thus, the HI misconception is potentially present in a larger number of both teachers and student teachers.
The NS Misconception
The third misconception, NS, might also be related to an ineffective use of multimedia material (e.g., “Any picture is better than no pictures at all”). It entails “the more the better” thinking in terms of using media and addressing modalities by providing a richer sensory experience (e.g., Green & Green, 2005; Treichler, 1967; Zitzlsperger, 1995). This misconception presumably stems from a misinterpretation of the cone of experience theory (Dale, 1969), which uses a visual analogy to show the progression of learning experiences from direct, firsthand participation (learning by doing) to pictorial representation (e.g., TV, picture) to purely abstract, symbolic expression (e.g., text). Based on his theory, Dale (1969) argued that “[…] the more numerous and varied the media we employ, the richer and more secure will be the concepts we develop” (p. 133), which might be overinterpreted in the direction of a NS. In fact, some authors inadequately applied the argumentation of Dale (1969) to postulate “exact” differences in retention performance depending on which media are used to convey information (e.g., Treichler, 1967): Learning by doing (90% retention) versus learning by watching and listening (50%) versus learning by just watching (30%) versus learning by just listening (20%) versus learning by just reading (10%). These expected retention rates are not just naïve per se; they are even naïvely added up: watching (30%) plus listening (20%) equals watching and listening (50%). Therefore, this misconception is termed NS (Weidenmann, 2002). It qualifies as a misconception because it is theoretically implausible and empirically disconfirmed. Retention performance depends on the degree of active processing and successful integration with prior knowledge rather than on the mere number of media used to present information (Craik & Tulving, 1975; Mayer, 2014; Salomon, 1984).
Although many researchers criticize NS arguments (e.g., Subramony et al., 2014; Weidenmann, 2002), the literature indirectly points toward the endorsement of this misconception by teachers and educators. NS is also known as the pyramid model (Letrud & Hernes, 2018). Letrud (2020) found that versions of the pyramid model appeared in 524 peer-reviewed articles and 14 encyclopedia articles published between 1990 and 2019, which suggests quite a high diffusion of the pyramid model both within and outside academia. It thus appears likely that teachers are confronted with the pyramid model (NS) at some point during their studies or career. Accordingly, the study of Eitel et al. (2019) showed that student teachers agreed at a level above chance with the true–false item “one always learns better from text and pictures than from text.” Furthermore, Deibl and Zumbach (2020) found that most of the student teachers (90.4%) they surveyed agreed with a statement directly referring to the pyramid model. This indicates that the misconception of NS is present in student teachers.
The MP Misconception
The fourth misconception refers to the idea that multimedia is helpful mainly because pictures increase student motivation. This misconception is most likely based on the observation that students (especially at a younger age) prefer text with attractive pictures to text alone. In turn, students are assumed to be more motivated to engage with multimedia than with text-only materials, and it is assumed that multimedia material fosters their learning (Eitel et al., 2019; Weidenmann, 2002). This assumed causal link between pictures and motivation has, however, not been empirically validated. Visually attractive pictures that are only loosely related to the text content can actually distract students from processing the main information from the text and can even have detrimental effects on student performance (seductive details effect; Harp & Mayer, 1998; Rey, 2012). The evidence-based recommendation is therefore not to present pictures that just look “motivational” but, rather, to use pictures that illustrate main ideas from the text (Carney & Levin, 2002; Levie & Lentz, 1982). Representational pictures that illustrate relevant text content and therefore help students to do better in tests (Lindner et al., 2017) were shown to be more motivating than pictures that instructors consider visually appealing. Representational pictures were therefore shown to have a motivational function (Lindner, 2020).
Concerning the MP misconception, teachers in a study by Dreher and Kuntze (2015) judged motivation and interest to be strong reasons to include multiple representations (multimedia) in their instruction. However, these findings do not provide direct evidence for the MP misconception, that is, the belief that pictures are beneficial mainly because they seem to have a motivating function. Recent findings from Eitel et al. (2019) suggest that student teachers do not endorse the motivation primary misconception to a strong degree because this group did not agree at a level above chance with the statement that “illustrations in math textbooks should be mainly employed to motivate students.”
The Need for a New Questionnaire to Assess Misconceptions About Multimedia Learning
Findings from previous research suggest the presence of four misconceptions related to multimedia learning. However, the question of whether student teachers and teachers actually endorse the described misconceptions (and if so, to which degree) or whether they just have missing conceptions about multimedia learning remains open. People with missing conceptions are aware of the fact that they lack knowledge about or experience with a topic (Chen et al., 2012). Misconceptions comprise intuitive assumptions that are subjectively correct and highly plausible (Bensley & Lilienfeld, 2015; Chi, 2005; Hughes et al., 2013) and, thus, must be dealt with differently than missing conceptions in teacher education (e.g., refutation instruction; Menz et al., 2020, 2021). Most of the previous studies assessed misconceptions via answer correctness (Dreher & Kuntze, 2015; Eitel et al., 2019), sometimes with the additional option of “I don’t know” (Krammer et al., 2019). However, both misconceptions and missing conceptions would yield incorrect answers on these scales. Nevertheless, only misconceptions would yield incorrect answers with a high subjective certainty. Misconceptions are thus best assessed by examining both answer correctness and students’ subjective certainty of the correctness of their given response. This is what we did with the MMLQ. Unlike previous research that used this type of assessment (e.g., Brandriet & Bretz 2014; Taylor & Kowalski, 2004), the MMLQ combines answer correctness and response certainty into one misconception score per person by means of a distinct multiplication rule. We examined three research questions related to this novel assessment of misconceptions about multimedia learning within the MMLQ.
Research Questions
Reliabilities of the MMLQ Scales
Our first research question was concerned about the degree to which the MMLQ items form psychometrically acceptable misconception scales. The psychometric properties of misconception scales have rarely been in the focus of research so far. A notable exception is the study by Dreher and Kuntze (2015), who found acceptable reliabilities for scales that resemble LS and MP. We aimed to determine whether the four hypothesized misconceptions in our specific assessment had acceptable scale reliabilities.
Internal Structure of the MMLQ
Our second research question examined whether the MMLQ assesses one common misconception or four distinct misconceptions about multimedia learning. All four of the previously described misconceptions share the common ground that they are related to multimedia learning. Nevertheless, these misconceptions are based on different (theoretical) explanations and address different issues related to multimedia learning, namely, individual differences (LS), neuronal functioning (HI), sensory impression (NS), and motivational potential (MP). Krammer et al. (2019) found that there was not one common factor of misconceptions about the brain (hemispheres) and learning, whereas Dreher and Kuntze (2015) found a four-factor structure of teachers’ misconceptions about learning with multiple representations; two of these factors were LS and motivation. Based on this background, we expected the questionnaire data to best fit a four-factor structure of misconceptions about multimedia learning (four misconceptions hypothesis), both with and without a second-order factor capturing covariance between the four misconceptions in a confirmatory factor analysis. The data were not expected, however, to fit a general-factor structure that reflected a homogeneous misconception construct.
Prevalence of Misconceptions
Our third research question examined whether this specific type of misconception assessment would reveal that the group of student teachers and teachers held misconceptions about multimedia learning. Previous research provides indications that the majority of student teachers and in-service teachers hold all four of the expected misconceptions (e.g., Dreher & Kuntze, 2015; Eitel et al., 2019; Krammer et al., 2019). However, those studies assessed misconceptions about multimedia learning in absolute terms (e.g., correct/incorrect). The goal of this study was to assess the prevalence of misconceptions when answer correctness is combined with response certainty.
Method
Participants and Recruiting
A total of N = 312 teachers and student teachers completed our online survey study. We excluded the data from one participant because the data were implausible. Thus, we analyzed the data of n = 311 participants (253 females, 57 males, one diverse). These data sets were complete (no missing data). The sample comprises 176 in-service teachers (138 females, 38 males) with a mean age of 44.80 years (SD = 10.52; range: 27–70 years) and 135 student teachers (115 females, 19 males, one diverse) with a mean age of 23.73 years (SD = 3.22; range: 18–38 years) and an average of six semesters. Most participants indicated that they either planned to or already taught at secondary school (n = 91) or elementary school (n = 82), followed by diverse other school types (e.g., comprehensive school, special education school, vocational education). The student teachers’ and teachers’ school subjects were mostly German (n = 148) and mathematics (n = 111), followed by other common school subjects (e.g., biology, English, religious education/ethics, physical education, social sciences, history, geography, art, music, chemistry, physics). Participants from diverse areas in Germany took part in the study; most of them from the southwestern part of Germany.
The communicated topic of the study was “Learning with multimedia: Which media use is beneficial or detrimental to learning?” The online survey completion was possible between April and May 2019. In total, 608 people clicked on the survey link, of which 39.1% (238 people) quit before the survey started. Of the remaining 370 people, a total of 15.7% (58 people) dropped out before completing the survey. Thus, complete data sets from 312 participants were included in our analyses.
Development of the Study Instrument
The self-developed MMLQ (see Supplemental Appendix A for the complete questionnaire in German) served as our study instrument. The MMLQ consisted of 32 items. These items comprised statements that first needed to be answered with “I agree” or “I disagree” (i.e., verification). Moreover, each statement comprised a 5-point Likert scale to indicate the participant’s certainty of having correctly responded to the current statement. The answer options were very certain, certain, somewhat certain, uncertain, and very uncertain (i.e., certainty rating). Certainty ratings were vertically aligned and presented below the corresponding verification part (see Figure 1, for an example item).
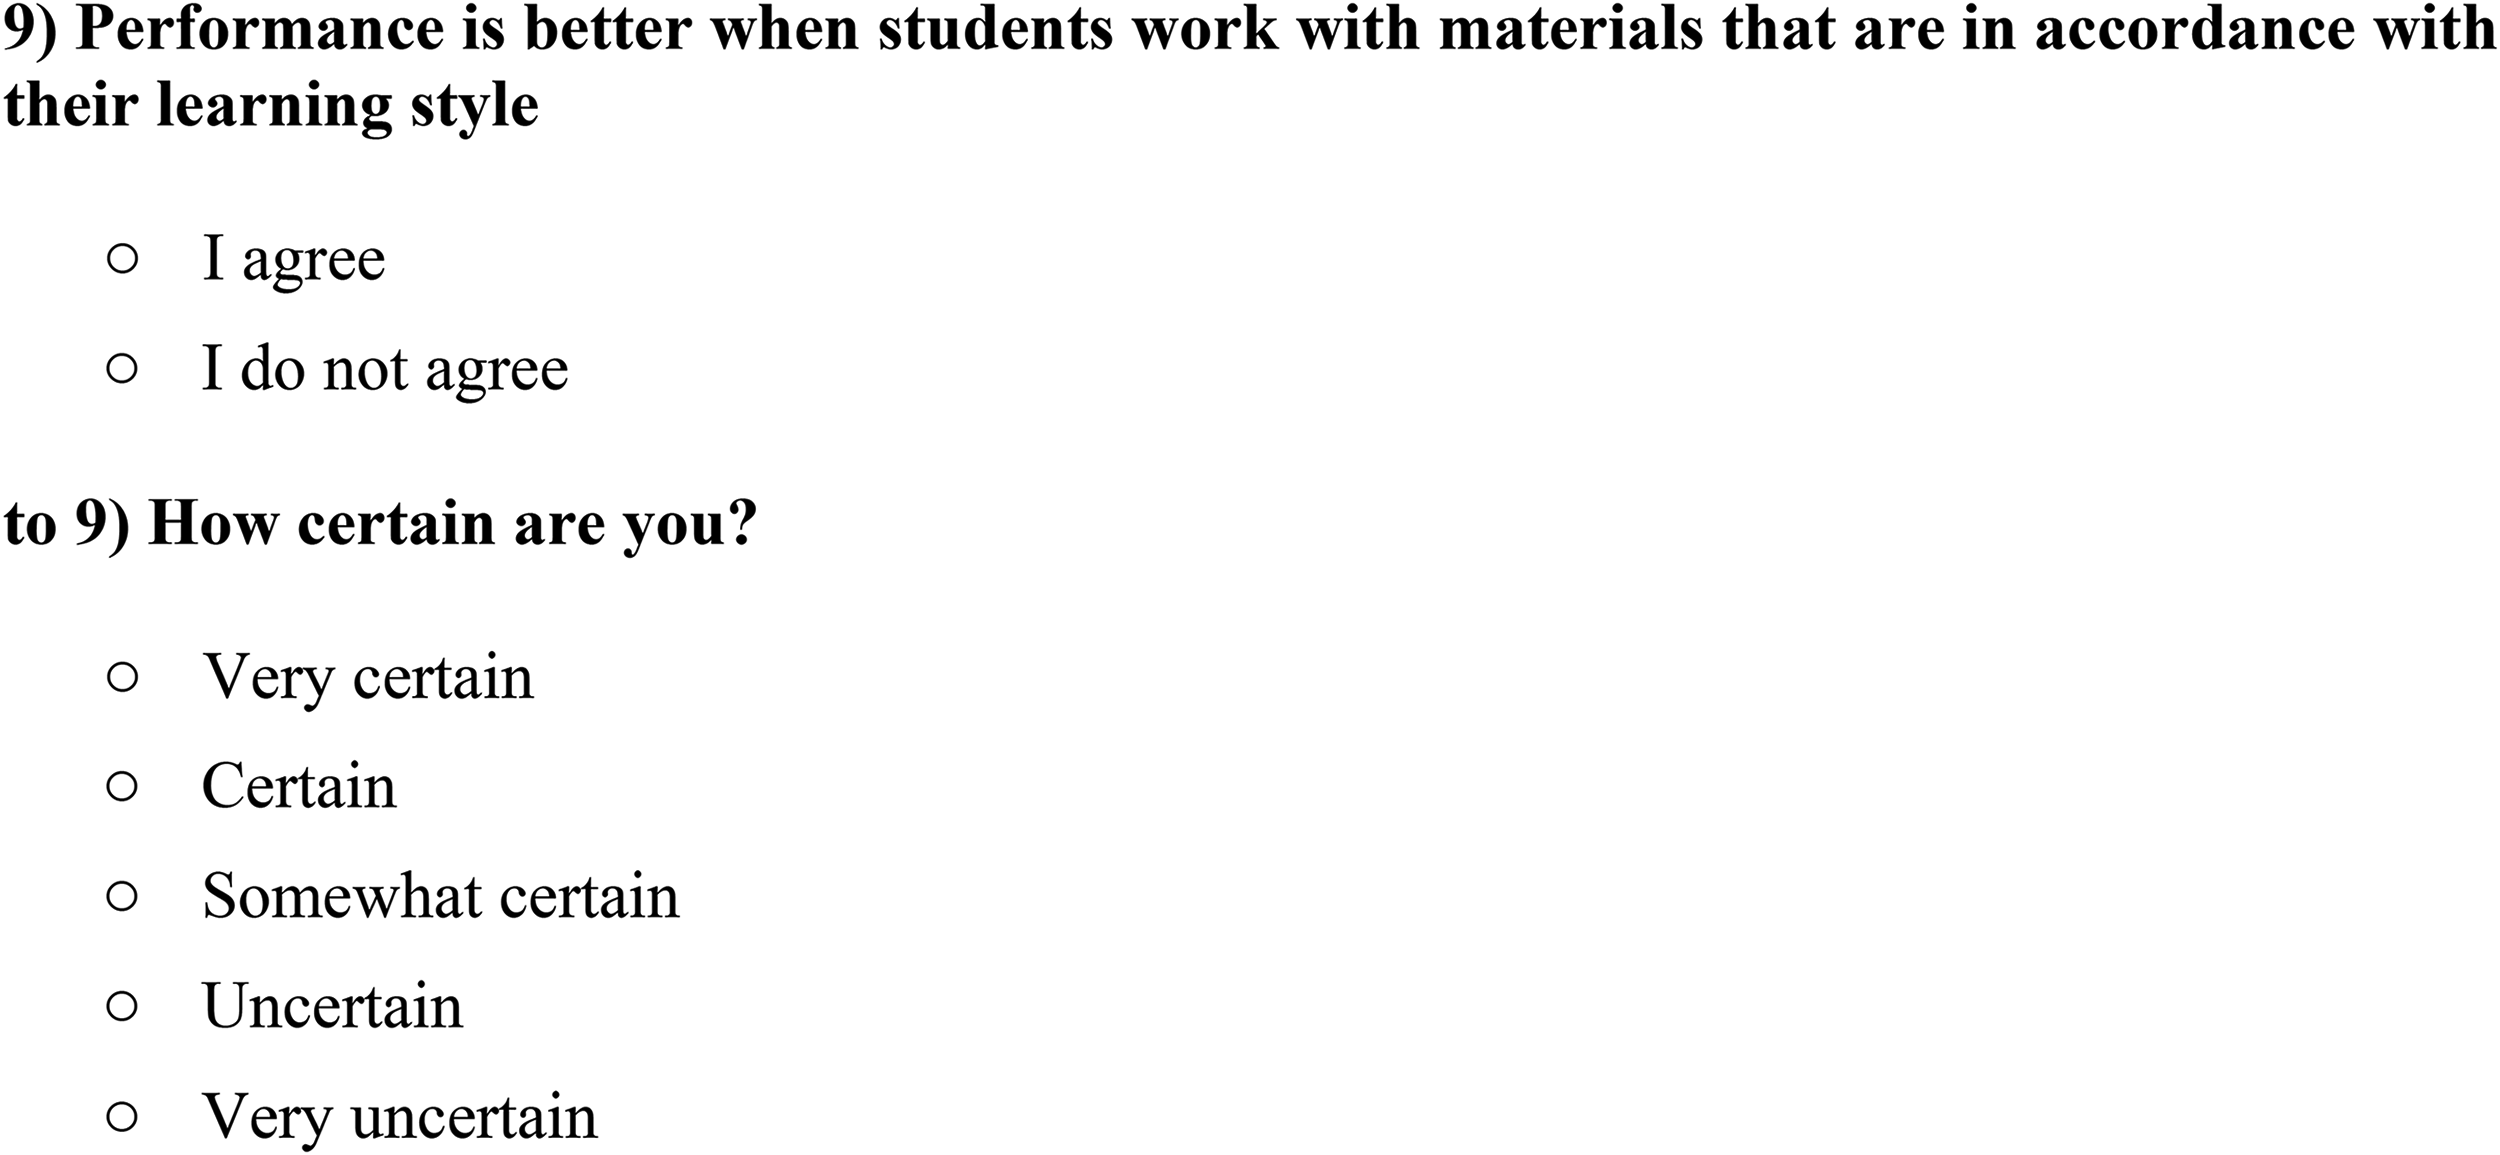
Example of the item presentation with the true–false statement, followed by the certainty rating.
Of the 32 items in the MMLQ, eight items referred to each of the four hypothesized misconceptions (LS, HI, NS, and MP). Among the eight items per misconception, four items targeted the respective misconception and are thus termed “misconception items” (see Table 2). For example, one of the four misconception items regarding LS was “Whether students learn better with visual or verbal materials depends on their learning style.” [I agree/I disagree]. We intentionally formulated the misconception items as false statements to gain direct information as to whether this misconception was endorsed by the student teachers and teachers, as opposed to another misconception. For example, to obtain information about whether a person thinks that “the earth is flat,” that person must agree with that specific statement. It is not sufficient to know that the person disagrees with the statement “the earth is a sphere” because then this person could still have a different idea (e.g., a semisphere, a cone, or a rounded flat) from that of a flat earth. There were thus no reverse-coded misconception items.
Descriptive Values for Misconception Items (M, SD) and Scale Reliabilities of the Misconceptions about Multimedia Learning Questionnaire (MMLQ).
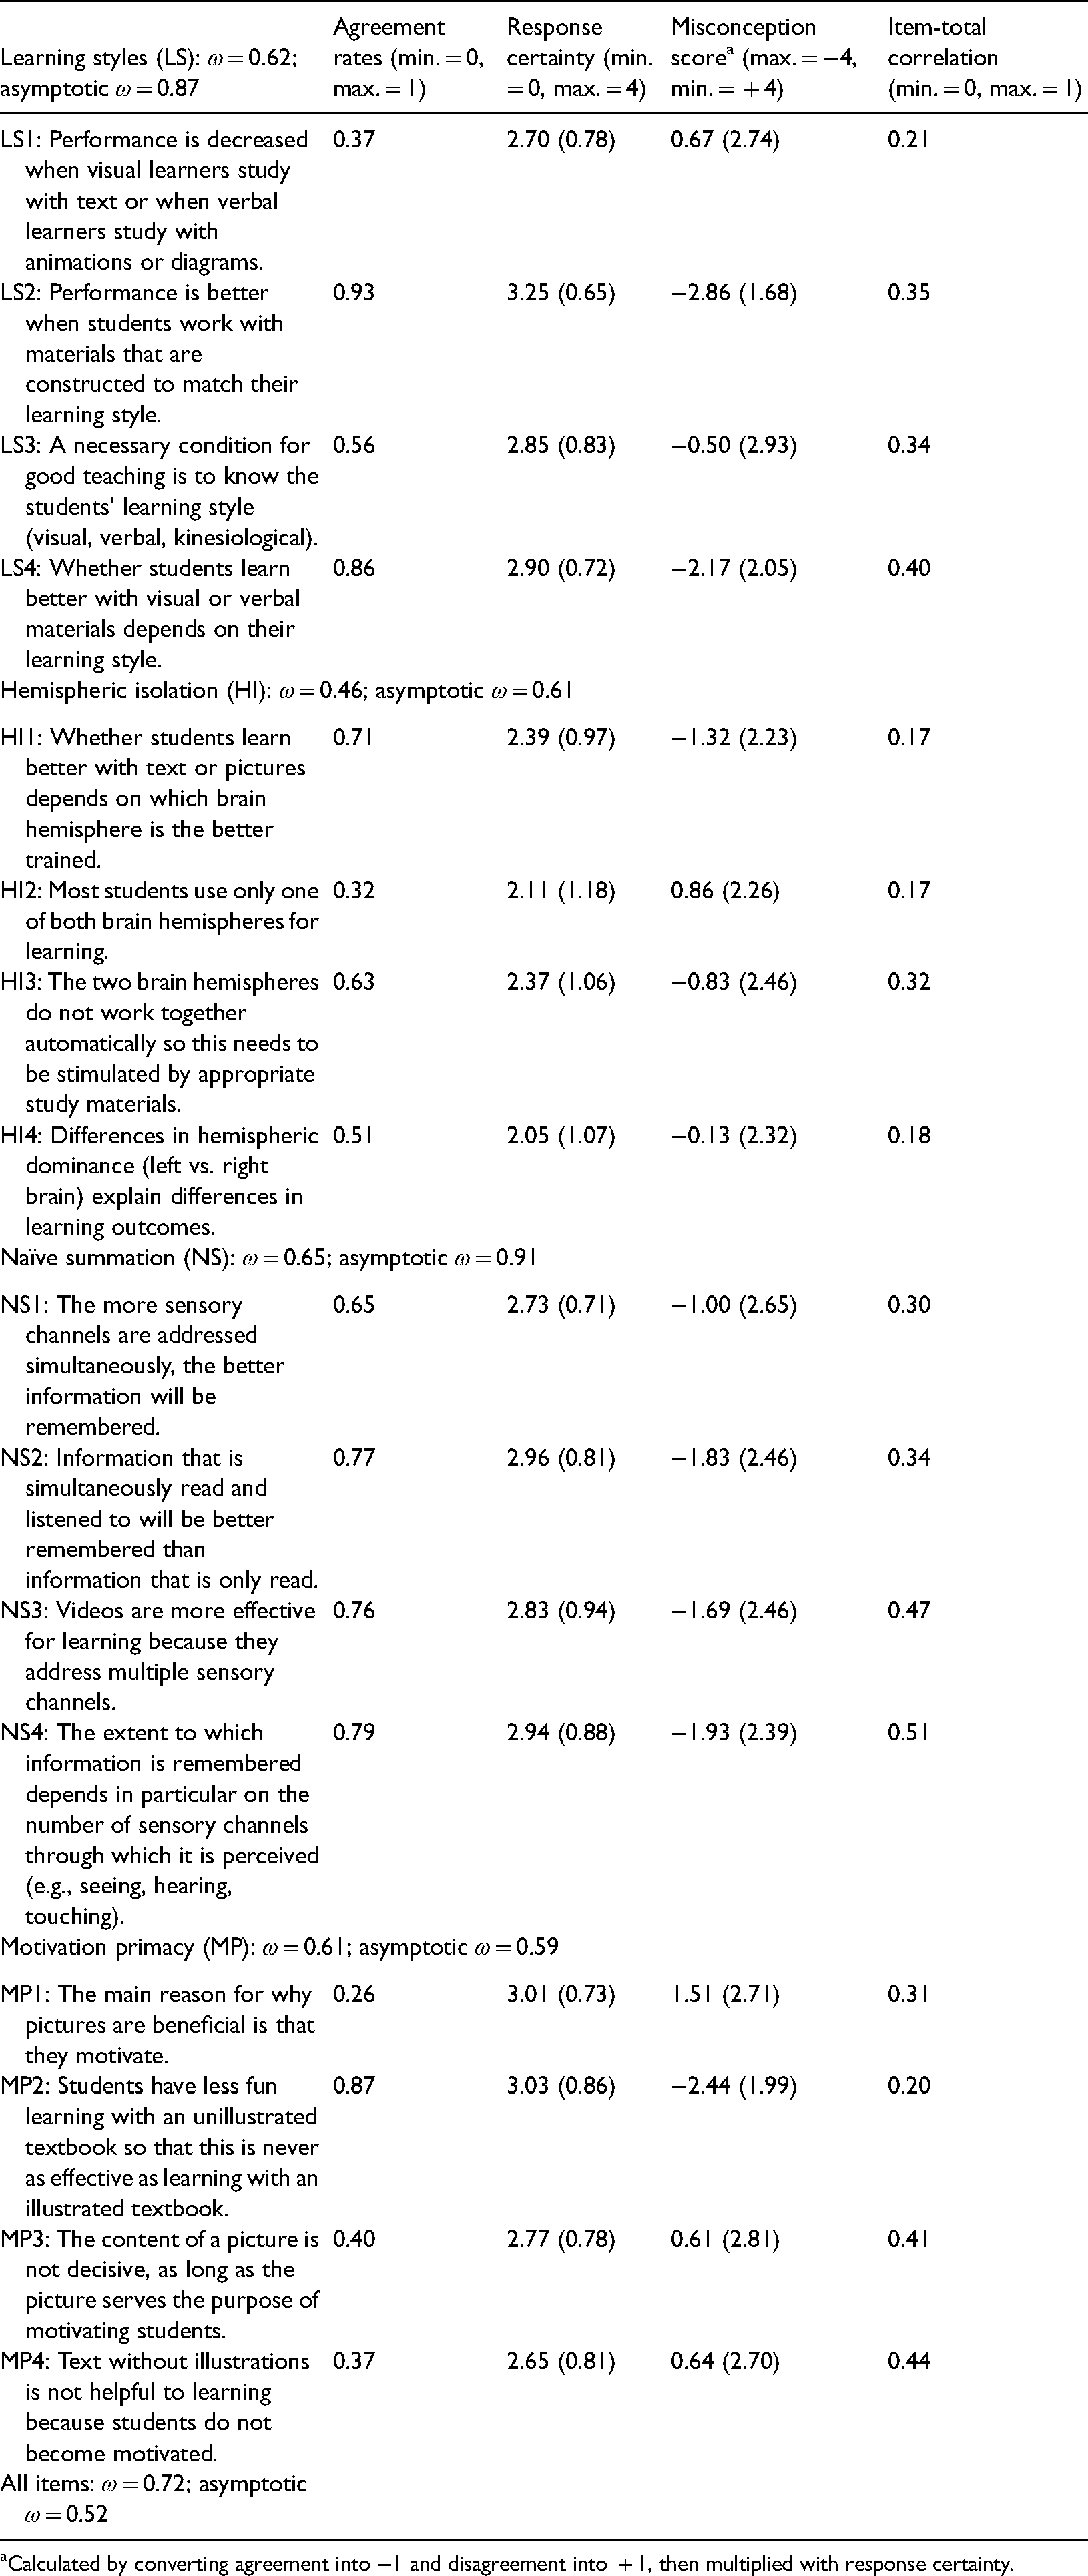
Calculated by converting agreement into −1 and disagreement into + 1, then multiplied with response certainty.
Besides the 16 misconception items (four per misconception scale; see Table 2), there were four additional “filler items” per misconception scale (16 filler items overall). The filler items described true facts that are related to the misconception but are not misconceptions, for example, for LS: “The comprehensibility of study materials is more important than their alignment with a learning style” (I agree/I disagree). These statements were included in order to have misconception scales with an equal number of correct and incorrect statements to (a) reduce the risk that participants form new misconceptions when confronted with incorrect information only, (b) minimize the effects of individual response tendencies towards endorsement and rejection (e.g., degree of acquiescence; Moosbrugger & Kelava, 2012), and (c) reduce bias in estimating the misconception prevalence, because participants could think that “some statements must be true” and answer accordingly.
With regard to content, the MMLQ items were deliberately created to address all of the characterizing aspects of each hypothesized misconception about multimedia learning. Therefore, we first referred to previous research and existing items, and we then gathered additional data from academic and nonacademic resources (mainly websites) to get a more comprehensive idea of the misconceptions to be addressed. Prior to inclusion in the questionnaire, all items were discussed and refined by an expert panel with eight members: one professor, four postdoctoral researchers, and three PhD students from the areas of educational science and educational psychology.
For the LS misconception, items were constructed to address the two characterizing beliefs, namely (a) that students have either a visualizer or a verbalizer learning style and (b) that effective instruction must be tailored to students’ LS. Thus, items were, on the one hand, similar and partially even identical to those used in previous research. For instance, the LS2 item “Performance is better when students work with materials that are constructed to match their learning style” had already been employed in previous research (see Krammer et al., 2019, for an overview). We used two more items (LS1 and LS4, see Table 2) that addressed this aspect more specifically (e.g., LS4: “Whether students learn better with visual or verbal materials depends on their learning style”). On the other hand, one item of the LS scale went one step further by asking whether student teachers and teachers think that knowing about students’ LS is a necessary precondition for successful teaching (LS3, see Table 2).
For the HI misconception, items were developed to assess both the belief that (a) the brain hemispheres typically do not work together (and thus need to be separately stimulated by multimedia material) and the associated belief that (b) effective learning is contingent upon which of the brain hemispheres is the dominant one (“left-brainers” vs. “right-brainers”). The items we used were similar to items that have been used to address hemispheric dominance in previous research, such as the item: “Differences in hemispheric dominance (left vs. right brain) explain differences in learning outcomes” (see HI4; e.g., Dekker et al., 2012; Krammer et al., 2019). Moreover, two items made the relation to multimedia instructional materials more explicit (e.g., “The two brain hemispheres do not automatically work together so they need to be stimulated by appropriate study materials”; HI3).
The NS misconception items were developed to assess the prevalence of the “more the better” belief in terms of adding up media or sensory channels for learning. The items focused on the visual and verbal channels in particular because they are the most important ones in the context of multimedia learning (e.g., Mayer, 2014). For instance, we assessed whether a person holds the general belief that “Information that is simultaneously read and listened to will be better remembered than information that is only read.” (NS2). Another item went one step further, claiming that it is particularly important to address as many sensory channels as possible (“The extent to which information is remembered depends in particular on the number of sensory channels through which it is perceived [e.g., seeing, hearing, touching]”; NS4).
The items that were constructed to assess the MP misconception aimed to capture the belief that multimedia material is mainly beneficial because it motivates students to engage in learning processes. Thus, the misconception is based on neglecting the cognitive benefits of combining text and pictures. More specifically, the two characterizing aspects of this misconception are (a) that presenting text and pictures (i.e., multimedia) is better than presenting text alone mainly because pictures motivate students (e.g., “The main reason for why pictures are beneficial is that they motivate”) and (b) that pictures that serve a merely decorative function should be added to learning materials in order to enhance motivation (e.g., “The content of a picture is not decisive, as long as the picture serves the purpose of motivating students”; MP3).
Procedure
When clicking on the web link, participants were initially informed about the voluntary nature of their participation, that they could end the study whenever they wanted to without having to face any disadvantages, and that all data would be captured and stored for at least 10 years in a completely anonymous way for the purpose of research only. Participants needed to indicate their informed consent for the study. Participants then were asked to provide some basic demographic information (i.e., age, gender, career status [student teacher or in-service teacher], study progress, study or teaching subjects, country of birth, mother tongue, and school type). Afterwards, participants worked through the questionnaire. They were instructed to consider the correctness of each statement in light of their expertise and their profession as teachers or prospective teachers. The 32 items were provided in a randomized order and were thus not in the order of the expected factor structure. All participants received the same randomized item order. After responding to the statements, participants were thanked for their participation. More specifically, the participants were told about the purpose of this study in a brief text (∼190 words) and were invited to write an email to receive further information about the study, if they were interested. Upon receiving an email, we sent out current literature on multimedia learning and misconceptions about multimedia learning. Response times were not restricted by the system. Participants needed, on average, 8:59 min to complete the survey (SD = 2.59; Min. = 4.15 min; Max. = 16.48 min).
Scoring
First, we dummy coded the verification part of each of the 16 misconception items (“I agree” = 1, “I do not agree” = 0) to inspect the overall agreement rates that reflected item difficulties. The higher the agreement rate, the higher the item difficulty, because fewer participants correctly rejected the respective misconception statement (see Table 2, left column, for descriptive values).
Second, we calculated misconception scores by combining agreement and response certainty because the nature of misconceptions is that they (a) rely on incorrect knowledge and (b) are subjectively highly plausible. More specifically, the more plausible an incorrect statement appears to a person, the more strongly this person is expected to endorse the statement, reflecting a higher certainty about their perception of the truth. This is expected to be reflected in higher misconception scores. We therefore coded agreement with a misconception item with −1, and disagreement with + 1. These values were multiplied by the certainty rating (coded from 0 = very uncertain to 4 = very certain) for the respective misconception item (see Table 2, for descriptive values). When this calculation was applied, being very uncertain about an answer (coded with 0), regardless of whether it was correct or not (±1), resulted in a score of 0 (i.e., ± 1 × 0 = 0) because (dis-)agreement was likely to be the product of guessing and not of an underlying misconception. The more certain participants were in their agreement with false statements (e.g., scores of 4 vs. 2 in the certainty rating), the stronger their belief in the misconception was. Accordingly, a stronger misconception was indicated by a more negative score (i.e., −4 vs. −2). Using this calculation, the range of possible values per item was extended from −4 to +4, making it possible to approximate the level of interval-scaled data.
Data Analysis
We used IBM SPSS statistics® for data preprocessing, item statistics, and tests against the chance-level using the observed data of the teachers and the student teachers (t-tests with bootstrapped confidence intervals). We used R for statistical computing (R Core Team, 2017; version 3.6.23) with the psych package for reliability analyses (Revelle, 2019). Specifically, we calculated McDonald’s omega (ω) instead of Cronbach’s alpha for reliability estimation. Cronbach’s alpha yields a consistent estimate only when all items of a scale are similarly correlated to the scale (tau-equivalence; e.g., Deng & Chan, 2017). This assumption, however, is usually not met for educational and psychological scales, which is also the case here. McDonald’s omega is the model-based analog of Cronbach’s alpha and provides appropriate values even when item–scale correlations vary in their magnitude. McDonald’s omega is a negatively biased estimate of reliability because it includes item-specific variance as an error term (Rodriguez et al., 2016). We further calculated the asymptotic omega, which simulates the theoretical omega that would be obtained for a test of infinite length with a structure similar to the observed test. The asymptotic omega is an estimate of the upper boundary of scale reliability and was especially informative for our hypothesized misconception subscales because it corrects for the small number of only four items that we implemented per scale. Values of McDonald’s omega can be interpreted similarly to Cronbach’s alpha. This means that modest reliability is reflected by values of around 0.70 (Nunnally, 1978). However, this convention should be considered with some caution as satisfactory values depend on the measurement purpose (e.g., group statistics or individual assessment) and on the nature of the scale. If broad or heterogeneous constructs are assessed, even relatively low coefficients of criterion reliability (e.g., 0.50) do not seriously attenuate validity coefficients (Schmitt, 1996). However, for individual item–scale correlations, values should not be lower than 0.30 (Cristobal et al., 2007).
We used the lavaan package for confirmatory factor analysis (Rosseel, 2012) to inspect the internal structure of the MMLQ by estimating its construct validity (external validity was not assessed here). We used robust maximum likelihood estimation to best handle our interval data with moderate deviations from the normal distribution (Li, 2016). We considered the global model fit to be sufficiently good if all of the following criteria were met: a nonsignificant χ2-statistic (Greiff & Heene, 2017) with a χ2/df ratio smaller than 1.3, a comparative fit index value equal to or higher than 0.95, a root mean square error of approximation smaller than 0.06 (Hu & Bentler, 1998), and an standardized root mean square residual smaller than or equal to 0.07 (Yu, 2002). We considered the local model fit to be acceptable if values for the fully standardized factor loadings were statistically significant (p < .05) and ranged between 0.30 and 0.70 (Nunnally, 1978). We used these model fit criteria to compare three structural models with each other by adapting the procedure of Hodapp and Benson (1997). Therefore, we compared the general-factor model with a unitary misconception construct (Model I) to the components model with four latent misconception factors (Model II). These two models were then compared to the hierarchical model (Model III), which extended Model II by including a second-order factor that represented misconceptions about multimedia learning in a nested structure.
Results
Item Statistics
As Table 2 shows, we first inspected the item difficulties by analyzing the agreement rates of the 16 misconception items, whereby higher agreement rates reflected higher item difficulties. Items ranged from very difficult (only 7% correctly rejected: Item LS2) to rather easy (74% correctly rejected: Item MP1). On average, participants correctly rejected 6.24 of the 16 misconception items (39%). At the same time, certainty ratings were above the scale mean of 2 (scale 0–4) for all misconception items (ranging from 2.06 to 3.25; see Table 2). On average, participants were rather certain about their answers to the misconception items (M = 2.72, SD = 0.48). At the same time, the misconception scores were below zero for 11 out of 16 items (69%), indicating the presence of misconceptions about multimedia learning. The misconception scores ranged from −2.86 (Item LS2) to + 1.51 (Item MP1). Overall, there was substantial variance in the misconception scores (mean SD per item = 2.42; see Table 2).
Research Question 1: Reliabilities of the MMLQ Scales
We inspected item–scale correlations and McDonald’s omega (ω) as well as the asymptotic omega to estimate reliabilities for the four proposed misconception scales, as presented in the following and in Table 2. First, the LS scale appeared to be reliable with an observed omega that was satisfactory (ωMcDonald = 0.62) and an even better asymptotic omega (ωasymptotic = 0.87). Three out of the four item–scale correlations were in a solid range between r = .35 and r = .40. One of the four items (LS1, see Table 2), however, seemed to fit less into the overall scale, as expressed in a low item–scale correlation (r = .21). This item was also the one with which participants disagreed most on this scale (see Table 2). We suspect that the item wording was too complex (e.g., two times “or” in the statement), which may have contributed to a misunderstanding of the item content. Alternatively, the reason could be that this was the only item of the scale that was negatively formulated (“performance is decreased”). This item should be revised in future research.
Second, there were some issues with the HI scale, which had a rather low observed omega (ωMcDonald = 0.46) but a higher asymptotic omega (ωasymptotic = 0.61). Furthermore, three of the four item–scale correlations were low and ranged between r = .17 and r = .18. There was, however, only one item that more student teachers and teachers disagreed with than agreed with (Item HI2; see Table 2). We suspect that this item was phrased too generally, so that it did not cover the core idea of HI with a focus on multimedia learning. This item is another candidate for revision in future research.
Third, the NS scale showed good reliability, with a satisfactory observed omega (ωMcDonald = 0.65) and an excellent asymptotic omega (ωasymptotic = 0.91). All item–scale correlations were in an acceptable to good range between r = .30 and r = .51. Fourth, the MP scale yielded a satisfactory observed omega (ωMcDonald = 0.61) but the asymptotic omega (ωasymptotic 0.59) was even lower than the observed omega. Upon further inspection, one of the four items (MP2) did not seem to fit the scale as indicated by a low item–scale correlation (.20) and a very high rate of participant agreement. This item is another candidate for revision. The other three items of this scale had acceptable item-total correlations (r = .31 to r = .44).
The reliability of the full questionnaire, including all 16 items, was in an acceptable range, with an observed omega of ωMcDonald = 0.72.
Research Question 2: Internal Structure of the MMLQ
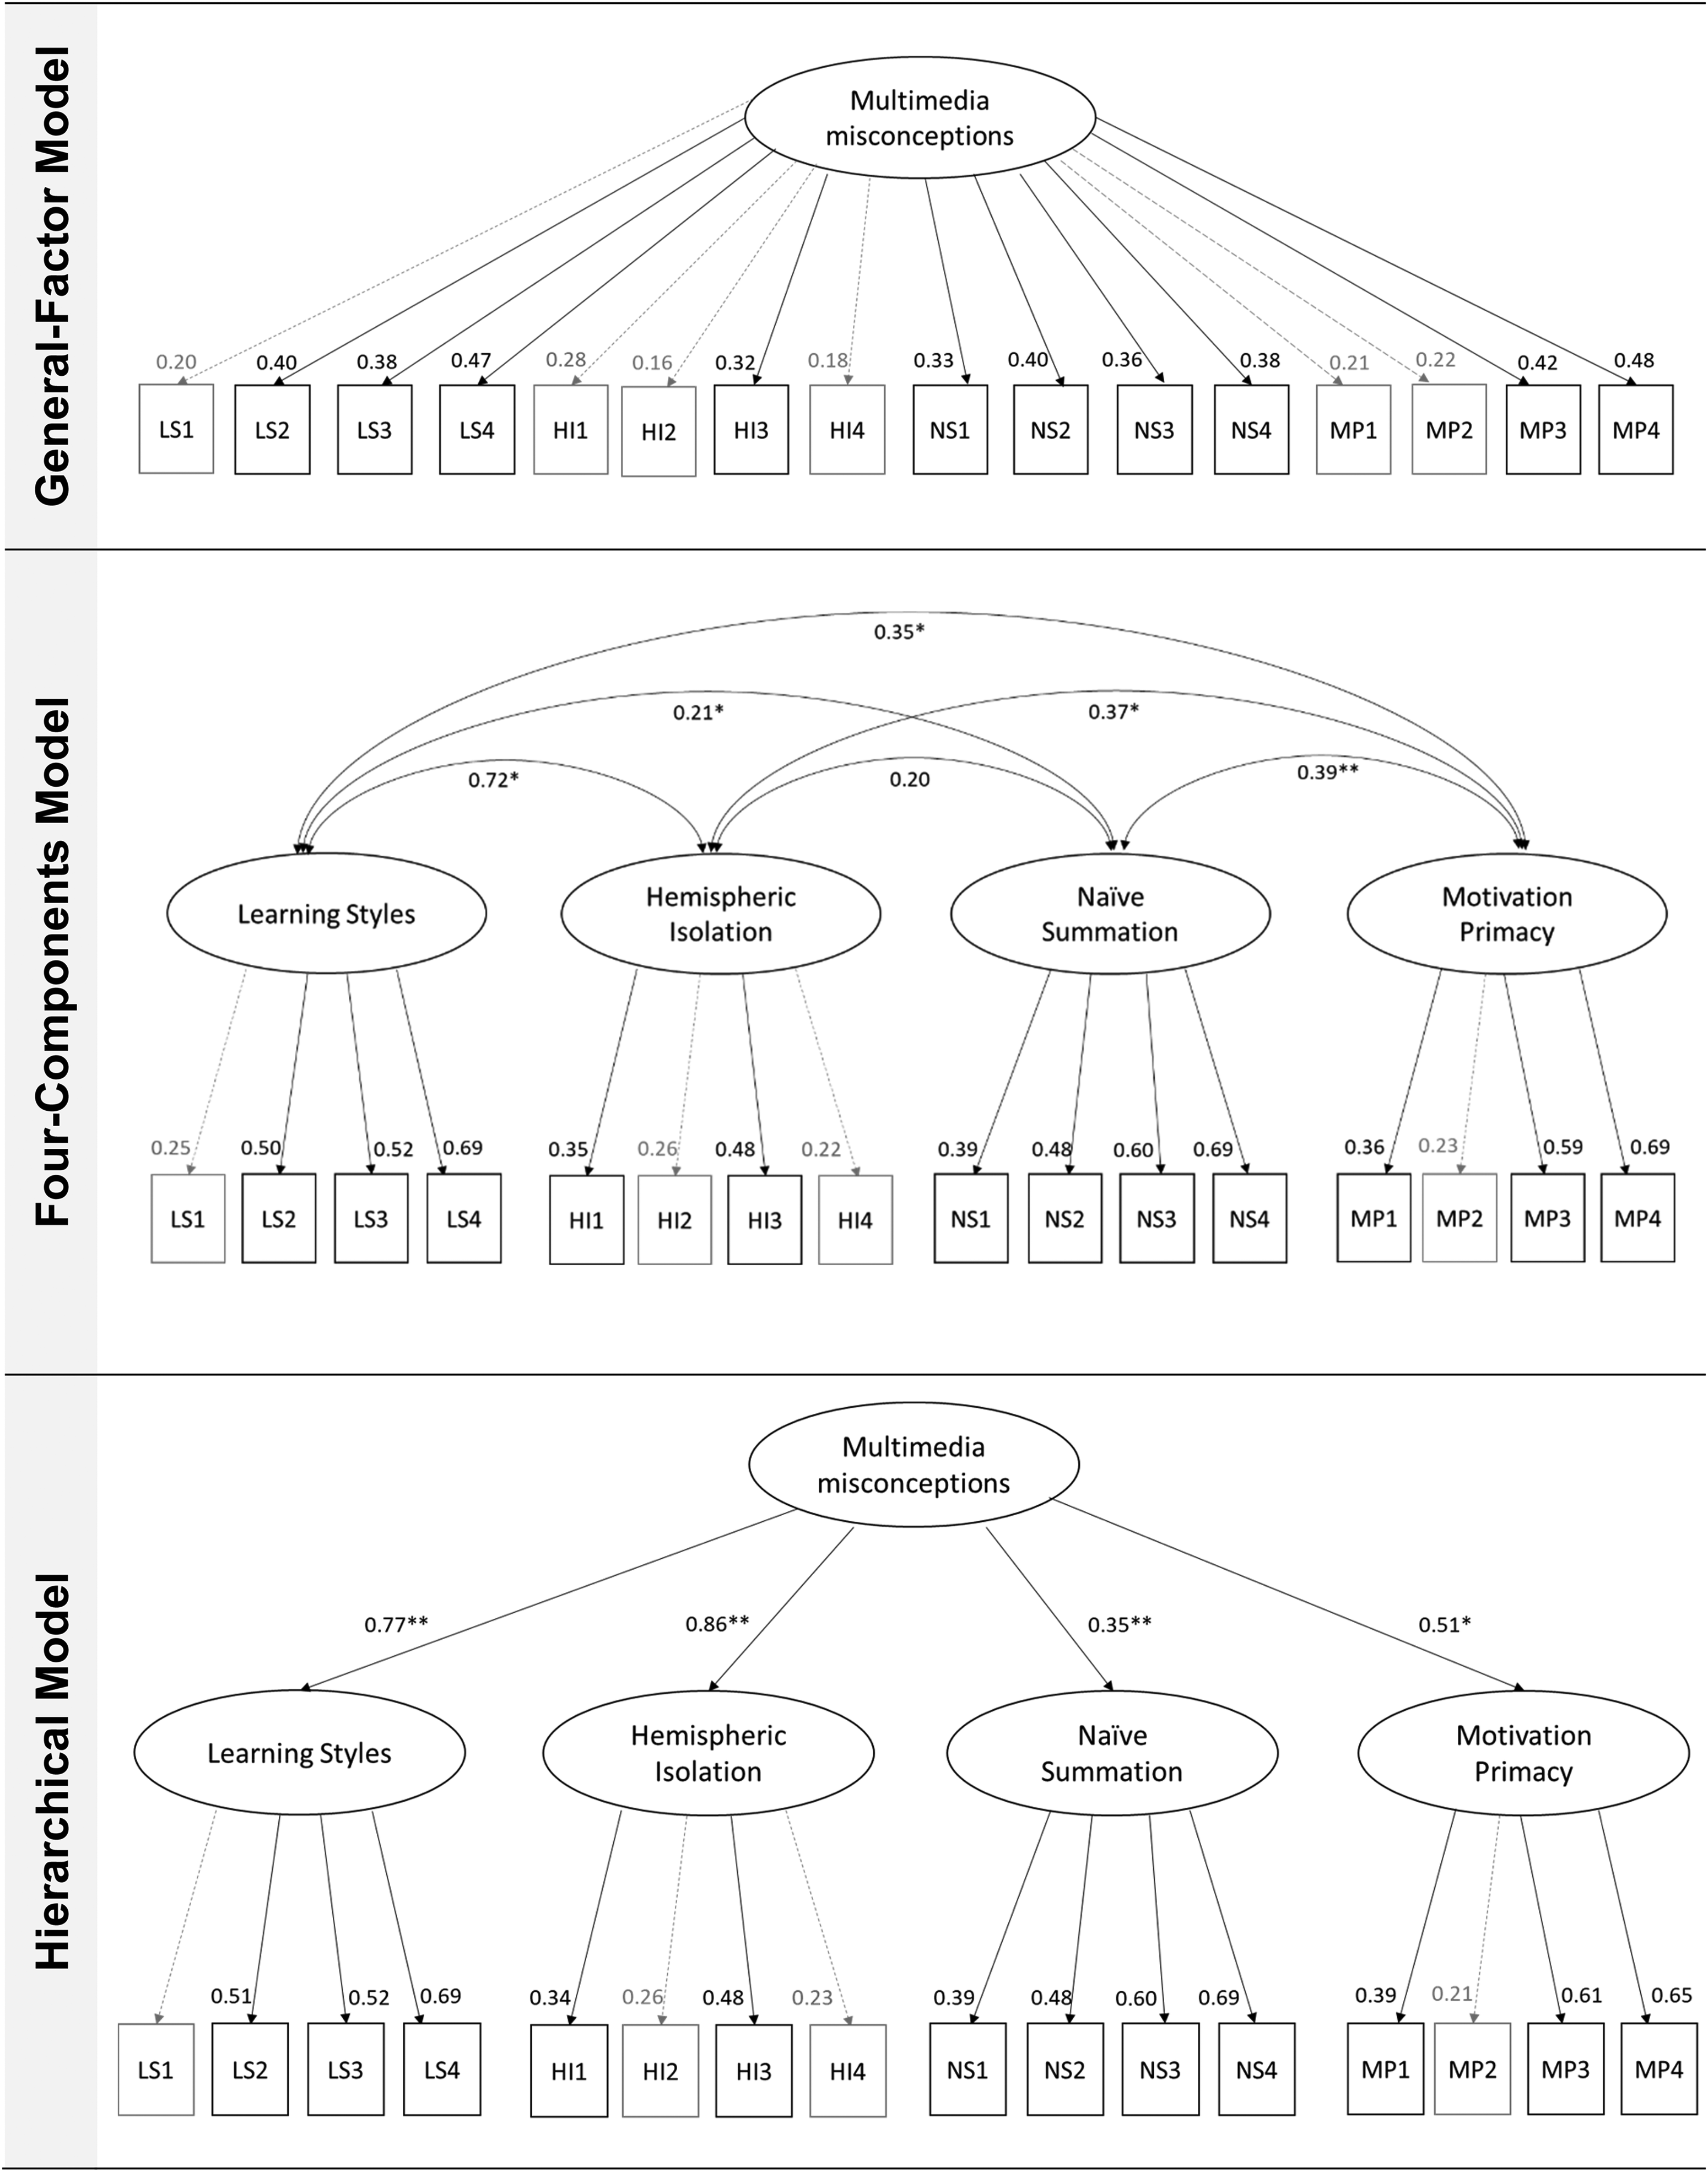
We performed confirmatory factor analyses to test our four misconceptions hypothesis. Therefore, we competitively tested the fit measures of three plausible models against each other (see Figure 2). We first compared the fit measures from the general-factor model, which had just one latent misconception factor (Model I), with the components model, which had four latent misconception factors (Model II), and with the hierarchical model, which had an additional second-order factor (Model III). Model I showed an unacceptable model fit, Model II showed a good model fit, and Model III showed an acceptable model fit (see Table 3). As expected from the four misconceptions hypothesis, the model fit of Model I was worse than the fit of Model II, χ2(6) = 248.23, p < .001, and of Model III, χ2(6) = 240.74, p < .001. The fit of Model II was better than the fit of Model III, χ2(2) = 13.66, p = .001.
Results of the confirmatory factor analyses (CFA) regarding multimedia misconceptions.
Model Fit Indices of the Three Structural Models.
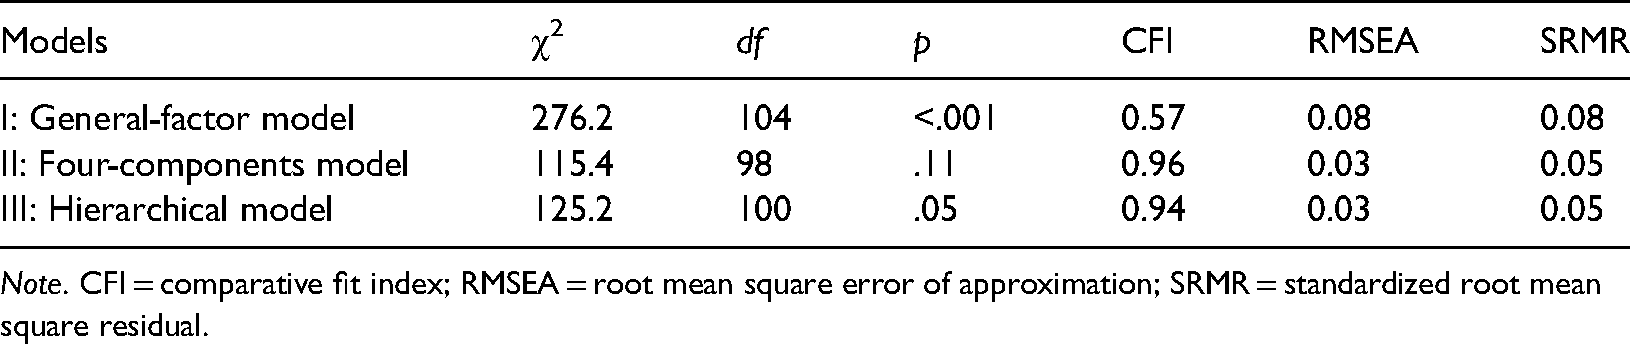
Note. CFI = comparative fit index; RMSEA = root mean square error of approximation; SRMR = standardized root mean square residual.
The standardized factor loadings for Model I, the general-factor model, ranged between 0.16 and 0.48 with a mean of M = 0.32 (SD = 0.10). Five of 16 factor loadings missed significance in Model I. The standardized factor loadings for Model II, the four-factor model, ranged between 0.22 and 0.69 with a mean of M = 0.46 (SD = 0.16). All of these factor loadings were significant (all ps < .05), suggesting the appropriate fit of Model II. The standardized factor loadings for Model III, the hierarchical model, ranged between 0.23 and 0.86 with a mean of M = 0.49 (SD = 0.18). All of the factor loadings for Model III were significant except two (ps < .05). The mean factor loadings were significantly lower for Model I than for Model II (p = .01) and for Model III (p = .002). There was no significant difference in the mean factor loadings between Models II and III (p = .58).
Research Question 3: Prevalence of Misconceptions
To analyze the average degree to which misconceptions about multimedia learning that were not just a product of chance or guessing behavior were present in our student teacher and teacher sample, we first tested the mean misconception scores against the chance level of zero. Only scores that were significantly below zero indicated the presence of actual misconceptions. The descriptive values are shown in Table 4. Because the mean misconception scores were slightly biased from the normal distribution, we conducted a one-sample t-test with bootstrap confidence intervals (Boot CI 95; 5000 resamples). As expected, the results revealed that the mean misconception scores, when aggregated across all four scales, were significantly below the chance level, t(310) = −13.54, p < .001, Boot CI 95 [−0.88; −0.66]. More specifically, the mean misconception scores were significantly below the chance level for the individual scales of LS, t(310) = −12.21, p < .001, Boot CI 95 [−0.41; −0.30]; HI, t(310) = −2.61, p = .01, Boot CI 95 [−0.15; −0.02]; and NS, t(310) = −14.74, p < .001, Boot CI 95 [−0.54; −0.42]. Overall 78.1% of our (student) teacher sample had scores below zero for the LS misconception scale (58.8% for HI, and 81.4% for NS). About half of the student teachers and teachers had scores below zero for the three scales: LS, HI, and NS (42.1%). Almost every teacher and student teacher in our sample had scores below zero for at least one of the three misconception scales (96.5%). The responses to the MP items were not significantly different from the chance level of zero, t(310) = 1.74, p = .08, Boot CI 95 [−0.01; 0.12]. Only 41.8% of our (student) teacher sample had a misconception score below zero on the MP scale. In total, 21.5% of our teachers and student teachers had scores below zero on all four misconception scales.
Descriptive Values (M, SD, Range) for Misconceptions Scores per Scale.
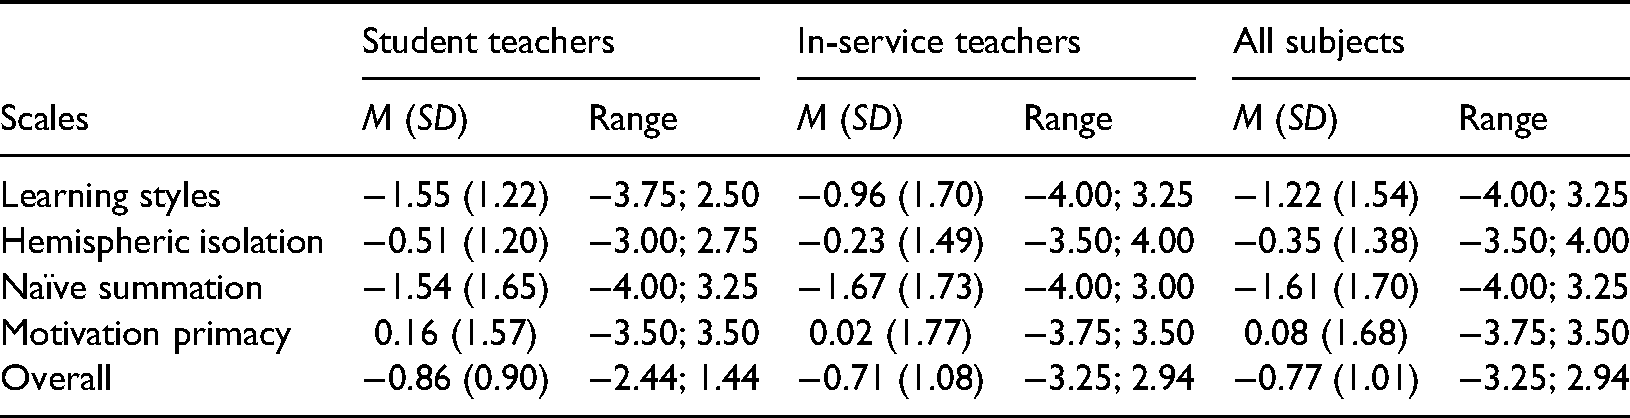
The results were comparable for both subsamples of teachers and student teachers when considered separately. This can be seen in the descriptive values in Table 4.
Discussion
The first goal of this study was to analyze the psychometric properties (e.g., scale reliabilities, internal structure) of the MMLQ. The second goal was to use the MMLQ to assess the prevalence of misconceptions about multimedia learning in student teachers and teachers to potentially inform teacher education and training on this specific topic.
Scale Reliabilities and Internal Structure of the MMLQ
Our first research question aimed to examine whether the MMLQ scales were reliable. The results revealed that three of the four hypothesized MMLQ scales showed reliabilities that were in an acceptable range, albeit at a rather lower margin even for more heterogeneous constructs (about 0.60; Schmitt, 1996). One of the main reasons for the lower reliability scores is the shortness of the scales, which is reflected in the much larger values of the asymptotic omegas compared to the observed omegas for the LS and the NS scales (see Table 2). Although these results seem promising, more research is needed to further improve the questionnaire scales. Such research should add further items to each scale.
Our second research question aimed to examine the internal structure of misconceptions about multimedia learning as assessed by the MMLQ. Based on our four misconceptions hypothesis, we expected false statements about multimedia learning to be related to four distinct misconception factors rather than to one global factor. The results of the confirmatory factor analyses showed that the four-factor model of misconceptions about multimedia learning provided a better global and local model fit than the general-factor model, in which all items were directly linked to one unitary misconception construct. Thus, our data support the assumption of the existence of four empirically separable misconceptions about multimedia learning (LS, HI, NS, and MP; see Figure 2 for illustrations). Also, it is important to note that the intercorrelations between the four misconceptions were all positive and in a medium range, with a mean correlation of r = .37 (see Figure 2). This means that, while there seemed to be four distinct misconception factors, the factors shared variance, which is probably related to the fact that they are all related to multimedia learning. Accordingly, we found that the model with four misconception factors and a second-order factor (hierarchical model) also showed an acceptable model fit, even though the hierarchical model fitted worse than the four-factor model (see Table 3). This result nevertheless implies that the four misconception factors could legitimately be grouped under the umbrella of one construct of misconceptions about multimedia learning.
Multimedia learning was defined in psychological terms for the present study; in this context, it refers to learning with text (spoken or written) and pictures (Weidenmann, 2002). Multimedia learning can also be defined in technical terms, in which case it refers to learning with different forms of presentations that are supported by digital technology (Weidenmann, 2009). These two definitions are not mutually exclusive. Nevertheless, if the technical definition is applied, other misconception items and factors are conceivable, such as “the use of multimedia fosters multitasking” or “the use of multimedia in kindergarten creates software engineers and computer experts.” Further research should investigate the relationships between misconceptions about multimedia learning from a psychological stance (as done here) and a technical stance. A further estimation of the construct validity of the present misconception assessment would also be valuable.
Notwithstanding the above, the present results could be used to design refutation instruction concerning misconceptions about multimedia learning in teacher education and training. First, they tentatively indicate that a refutation instruction that specifically addresses each one of the four misconceptions might be more successful than a general refutation instruction on misconceptions about multimedia learning. Such a refutation instruction usually starts with the description of the misconception (e.g., “Many people believe that images support learning just because they increase learners’ motivation and interest”), is followed by a second sentence explicitly stating that this is incorrect (e.g., “However, this assumption is incorrect”), and is then followed by several sentences comprising the scientifically correct information. Second, the present results indicate that refutation instructions could be tailored to the individual structure of the misconceptions (e.g., to NS and LS but not to other misconceptions) that a student teacher or teacher may hold. Regarding this individual aspect, the current scale’s reliability may, however, be too low even though the reliability scores were in an acceptable range for three out of the four scales for research purposes (ω > 0.60). Future research could use an extended and updated version of the present questionnaire (MMLQ) and could attempt to optimize reliability scores, which would allow for more tailored instruction at an individual level.
Identifying the Prevalence of Misconceptions About Multimedia Learning
Our third research question aimed to examine whether the group of student teachers and teachers held misconceptions about multimedia learning. Therefore, the present questionnaire was deliberately constructed to identify misconceptions, and not just missing conceptions, by asking participants to judge their response certainty along with each true/false answer. A misconception was indicated only if the student teachers and teachers provided both incorrect answers to several items of a misconception scale and indicated that they were quite certain about their (incorrect) answers, in which case the obtained scores were lower than zero, indicating a real misconception. This reflects the idea that misconceptions comprise not just missing knowledge but also incorrect beliefs that are subjectively highly plausible (Chi, 2005; Vosniadou, 1994). In the present study, the mean values were negative and significantly differed from zero for three of the four misconception scales: LS, HI, and NS. This indicates that the respective misconceptions, and not just missing conceptions, were present in the (student) teacher samples. This is in line with previous research that has used different rating scales (Eitel et al., 2019; Krammer et al., 2019; Menz et al., 2020).
More specifically, the present results replicate findings that teachers and student teachers endorsed the LS misconception to a strong degree (e.g., Krammer et al., 2019). With the exception of one item (LS1), all items of the LS scale revealed negative scores, which consistently indicated the presence of this misconception (see Table 2). There were especially high agreement rates (93%) for the item that received similarly high agreement in prior research (i.e., “Performance is better when students work with materials that are in accordance with their learning style”; e.g., Krammer et al., 2019). This confirms the general idea that the LS misconception is particularly prevalent in education (Mayer & Massa, 2003). In addition, the NS misconception seemed to be endorsed to a strong degree as well. All four items of this scale showed negative values in the misconception scores (see Table 2). This is also in line with previous research (Eitel et al., 2019) and can perhaps be attributed both to the high subjective plausibility and to a high distribution of the pyramid model in (teacher) education (see also Letrud, 2020).
Finally, the present results suggest that the MP misconception seems to be less common among student teachers and in-service teachers. Many student teachers and teachers did not endorse the misconception that pictures support learning from text just because of their motivational function. This is also in line with previous research (Eitel et al., 2019). Three out of four items were answered consistently (MP1, MP3, and MP4; see Table 2), which means that the answers to the three items were more often correct than incorrect (i.e., rejecting the misconception). Only one item (MP2) showed high agreement rates and, thus, a low correlation with the total scale (.20). However, this might be related to the rather complex wording of the item, which might have led to participants having problems in understanding it properly.
Limitations and Further Research
First, the absolute interpretation of the misconception values in the present study requires further attention. For instance, further research that assesses the degree to which misconceptions are found in a nonteacher sample is important to support an adequate interpretation of the absolute misconception scores. Previous research revealed that neuroscience misconceptions were even stronger for the general population than for teachers (Macdonald et al., 2017); this can alter the absolute interpretation of the findings.
Second, some of the misconception statements in our questionnaire were too unspecific so that there could be situations in which the statements are not necessarily incorrect (e.g., NS2: “Information that is simultaneously read and listened to will be better remembered than information that is only read”). However, the example statement is certainly incorrect when thinking of a typical situation in which a student either just reads a textbook page on their own or reads the same textbook page printed on a PowerPoint slide while a speaker talks about the content and reads it out loud. According to the redundancy principle and vast empirical evidence (Kalyuga & Sweller, 2014), the latter is worse for learning than the former. Nevertheless, a problem with (short) questionnaire items is the small amount of contextual information they provide. This may lead participants to agree with incorrect statements that they might not have agreed with if the statements had been contextualized in a scenario such as the one just described (representing the redundancy principle).
Third, the question about the degree to which the present items assess misconceptions about multimedia learning in particular or misconceptions about learning more generally remains open. Most of the present items particularly refer to multimedia learning in the sense of learning with multiple codes or multiple sensory modalities (Weidenmann, 2009). However, as multimedia learning is a very common learning scenario, the present items may be closely related to more general misconceptions about learning (e.g., “We only use 10% of our brain” or “There are critical periods in childhood after which certain things can no longer be learned”; Dekker et al., 2012). Further studies should add items on more general misconceptions to the present assessment of misconceptions about multimedia learning to investigate how closely they are related and to provide an even broader picture of teacher misconceptions.
Conclusion
The results of the present study suggest that there are four empirically separable facets of multimedia misconceptions rather than one unitary construct. Moreover, three of the four hypothesized misconceptions about multimedia learning were endorsed by the majority of student teachers and in-service teachers. Because misconceptions about (multimedia) learning can negatively affect teaching and students’ learning outcomes (Lawson et al., 2019), they require special attention in teacher education. More specifically, teachers play an important role in transmitting knowledge about multimedia learning and learning strategies to their students (Dignath-van Ewijk & van der Werf, 2012). If teachers themselves have misconceptions about self-regulated learning with multimedia, this may prevent their students from acquiring effective self-regulated learning skills, especially when the students need to deal with multimedia material (see Kubik et al., this issue). Teachers’ misconceptions about multimedia learning should be addressed (and ideally refuted) in teacher education and training programs to also foster students’ (self-regulated) learning with multimedia.
Supplemental Material
sj-docx-1-plj-10.1177_14757257211028723 - Supplemental material for The Misconceptions About Multimedia Learning Questionnaire: An Empirical Evaluation Study With Teachers and Student Teachers
Supplemental material, sj-docx-1-plj-10.1177_14757257211028723 for The Misconceptions About Multimedia Learning Questionnaire: An Empirical Evaluation Study With Teachers and Student Teachers by Alexander Eitel, Anja Prinz, Julia Kollmer, Lea Niessen, Jessica Russow, Marvin Ludäscher, Alexander Renkl and Marlit Annalena Lindner in Psychology Learning & Teaching
Footnotes
Declaration of Conflicting Interests
The authors declared no potential conflicts of interest with respect to the research, authorship, and/or publication of this article.
Funding
The authors received no financial support for the research, authorship, and/or publication of this article.
Supplemental Material
Supplemental material for this article is available online.
Author Biographies
References
Supplementary Material
Please find the following supplemental material available below.
For Open Access articles published under a Creative Commons License, all supplemental material carries the same license as the article it is associated with.
For non-Open Access articles published, all supplemental material carries a non-exclusive license, and permission requests for re-use of supplemental material or any part of supplemental material shall be sent directly to the copyright owner as specified in the copyright notice associated with the article.