
Abstract
When people interpret the outcome of a research study, do they consider other relevant information such as prior research? In the current study, 251 college graduates read a single brief fictitious news article. The article summarized the findings of a study that found positive results for a new drug. Three versions of the article varied the amount and type of previous research: (a) two prior studies that found the drug did not work, (b) no prior studies of the drug, or (c) two prior studies that found the drug had a positive effect. After reading the article, participants estimated the probability the drug is effective. Average estimates were similar for the three articles, even for participants who reported more statistics experience. Overall, just 4% of participants appeared to use prior research to make probability estimates—most seemed to focus on the latest study, while ignoring or discounting prior studies. Implications for statistics education and reporting are discussed.
Introduction
Suppose one morning you read a news article about a study that found a positive effect for a new antidepressant medication. The study, which just appeared in a respected journal, was the first clinical test of the new drug. In total 120 depressed adults were treated with either the new drug or a placebo, and those who received the drug had significantly fewer symptoms. Later that day you tell a friend about the article. Your friend, who has struggled with depression, asks you how likely it is the new drug works. How would you answer?
Now consider a different scenario. Suppose the news article said the study was not the first test of the new drug—two earlier studies also found it reduced depressive symptoms. For this second scenario, we think most readers will say it is more likely the drug works. Three studies provide more evidence than one. However, in our experience, statistics students and other consumers of research information often seem to ignore this basic idea. The present study was conducted to test the accuracy of our observations. If there is a tendency to ignore or discount previous studies, then educators and authors of research articles should attempt to correct the problem to improve the interpretation of research findings.
Based on our classroom observations, we suggest that when students evaluate the outcome of a new study, they tend to pay little attention to other relevant information. Specifically, our students appear to place excessive weight on the outcome of the most recent study in a series of studies, while discounting or ignoring evidence from earlier studies. If our students are doing this, it could be interpreted as an example of base rate neglect. Previous research shows that, in some situations, people ignore the base rate when estimating probabilities (e.g., Kahneman & Tversky, 1973; Pennycook, Trippas, Handley, & Thompson, 2014). For example, one study (Manrai, Bhatia, Strymish, Kohane, & Jain, 2014) showed that many physicians misjudge the probability of a false positive when interpreting medical tests (also see Gluck, 2008). In general, if a person tests positive for a fairly common disease, they are likely to have it, but they are unlikely to have the disease if it is rare, despite the positive test. Thus, a positive test is more likely to be a false alarm when the disease is rare, but physicians tend to ignore or misapply information about disease prevalence.
The present study focuses on a related idea, that many people, including students, may not appreciate the importance of considering the context provided by the results of previous research. Consequently, they tend to interpret a study’s results in isolation. To test this possibility, we asked participants in the present study to read one of the fictitious news articles in Figure 1. The articles differ in the type and amount of evidence they contain. However, from the perspective of one who ignores prior studies, all three articles present the same information. Wasserstein and Lazar (2016) specifically warn against this: “Researchers should bring many contextual factors into play to derive scientific inferences, including the design of a study, the quality of the measurements, the external evidence for the phenomenon under study, and the validity of assumptions that underlie the data analysis” (p. 131, emphasis added). Cumming (2014) expresses a similar view in describing meta-analytic thinking: “Any one study is most likely contributing rather than determining; it needs to be considered alongside any comparable past studies and with the assumption that future studies will build on its contribution” (p. 23).
The three fictitious news articles used in the current study: (a) two negative outcomes prior to the Niagara study, (b) no research prior to the positive Niagara study, (c) two positive outcomes prior to the Niagara study.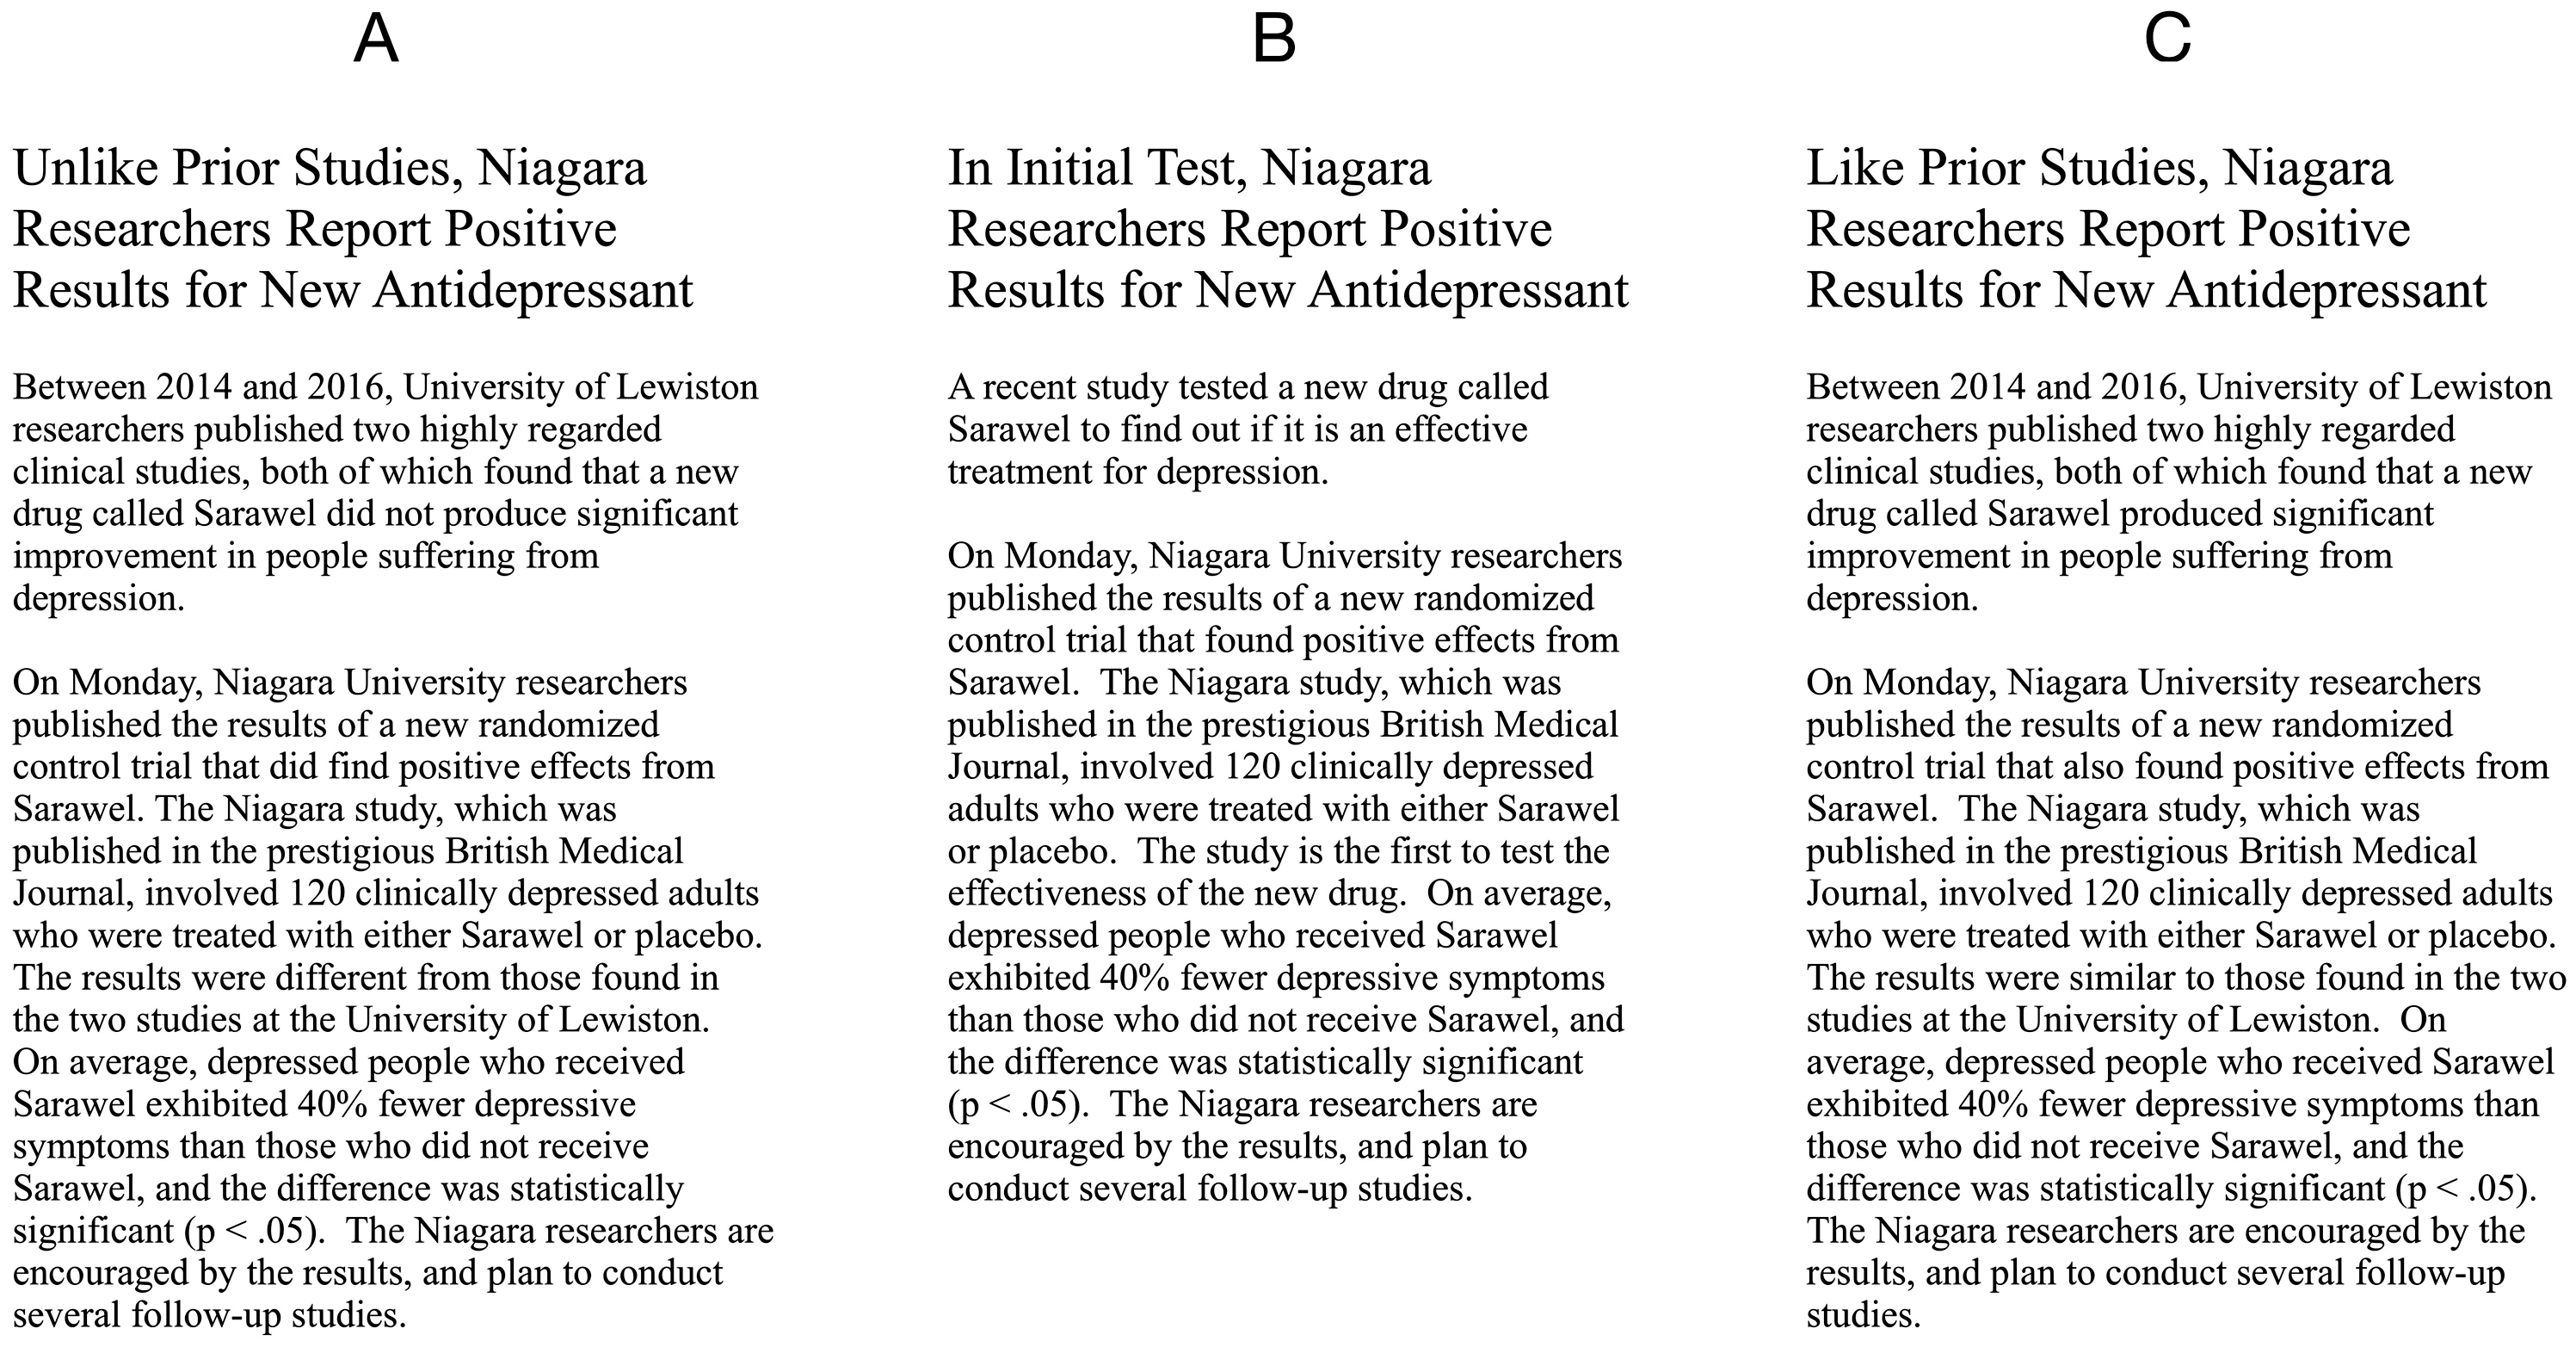
In the present study, we asked participants to consider all of the evidence in the article and estimate the probability the new treatment is effective. Each participant read only one of the articles. All three articles briefly describe the “Niagara study,” which found “statistically significant” evidence supporting the efficacy of a new antidepressant drug called Sarawel. The articles varied the base rate—the prior probability that the new drug works—by specifying that there had been (a) two similar prior studies of the drug with negative results, (b) no prior studies, or (c) two similar prior studies with positive results.
For participants’ average probability estimates, what general pattern might we expect? If participants ignore or drastically discount evidence from earlier studies, then the average estimate should be similar for all three articles. Compared to one positive study, the perceived chance that the drug works should be about the same whether there were two prior positive studies or two prior negative studies.
In contrast, participants may indeed take prior results into account. In that case, the positive evidence of the Niagara study would be considered in the context of two prior studies that supplied evidence for, or evidence against, the efficacy of the new drug. Two negative studies suggest a lower base rate, whereas two positive studies suggest a higher base rate. The positive evidence of the Niagara study should increase confidence that the drug works, but the final probability estimate depends on whether the base rate was lower or higher. In short, if participants read about two negative outcomes followed by a positive outcome, confidence in the drug should be fairly low. If they read about two positive outcomes followed by a third positive outcome, they should be much more confident that the drug works. But exactly how confident should they be?
Estimating the Probability That the New Drug Works
We can specify the probabilities involved by looking at the problem from a Bayesian perspective. Our approach relies on a quantity often called the Bayes factor (Dienes, 2016; Jeffreys, 1961; Kass & Raftery, 1995; Ly, Verhagen, & Wagenmakers, 2016; Phillips, 1973; Schmitt, 1969). 1 Bayes factors are used in a variety of fields as a measure of the weight of the evidence when two competing hypotheses (e.g., H1 and H0) are under consideration (e.g., Aitken, Taroni, & Biedermann, 2013; Grobbee & Hoes, 2015; McCarthy, 2006; Wells, Yang, & Smalarz, 2015). A Bayes factor is the ratio of two conditional probabilities: (a) the probability the data would be obtained, given that H1 is true, and (b) the probability the data would be obtained if H0 is true.
For the current problem, Bayes’ theorem allows us to calculate the probability the new drug has an effect, given certain assumptions. The odds form of Bayes’ theorem (after Ly, Etz, Marsman, & Wagenmakers, 2018) is:
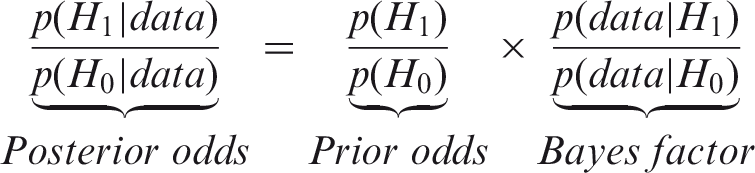
This equation shows that the posterior odds in favor of H1, given the data, can be obtained by multiplying the prior odds by the Bayes factor. The posterior odds can then be expressed as a probability. The abbreviation BF10 is sometimes used to indicate that the numerator is p(data | H1) and the denominator is p(data | H0). BF01 indicates the inverse. In the present article, the term Bayes factor always means BF10.
The Bayes factor “quantifies the change in beliefs about the relative plausibility of the competing hypotheses brought about by the observed data” (Ly et al., 2018, p. 2). A Bayes factor of 1 favors neither hypothesis, because the data are just as likely to occur when H1 is true as when H0 is true. A Bayes factor above 1 means the evidence favors H1, whereas a Bayes factor below 1 favors H0. To illustrate, suppose the prior odds are 2 to 1 in favor of H1, and evidence from a new study gives a Bayes factor of 2—the data are twice as likely under H1 than H0. In this case, the posterior odds become 4 to 1 in favor of H1. In terms of probability, the base rate or prior probability was 2/3 or 67%, and the posterior probability is 4/5 or 80%. Bayes factors can be interpreted directly based on their size, but some authors have provided guidelines. For example, Jeffreys (1961, p. 432) suggests that Bayes factors from 1 to 3 indicate evidence that is “hardly worth mentioning in support of a new discovery.” Kass and Raftery (1995, p. 777) propose that Bayes factors above 20 provide “strong” evidence, whereas those above 150 constitute “very strong” evidence.
Unlike traditional statistical tests that yield a p value, Bayes factors allow probabilities to be attached to hypotheses. 2 Most important for the present study, Bayes factors provide the means to calculate the probability that the new drug works, given the evidence from the studies described in the news articles—we need only specify the prior odds that the drug works and the Bayes factor representing the weight of the evidence for each study.
Recursive application of Bayes’ Rule to Compute the Posterior probability the new drug reduces depressive symptoms, Assuming 1 to 4 Initial Prior Odds and Weak Positive (Bayes factor = 2) or Weak Negative (Bayes factor = 0.5) Evidence.
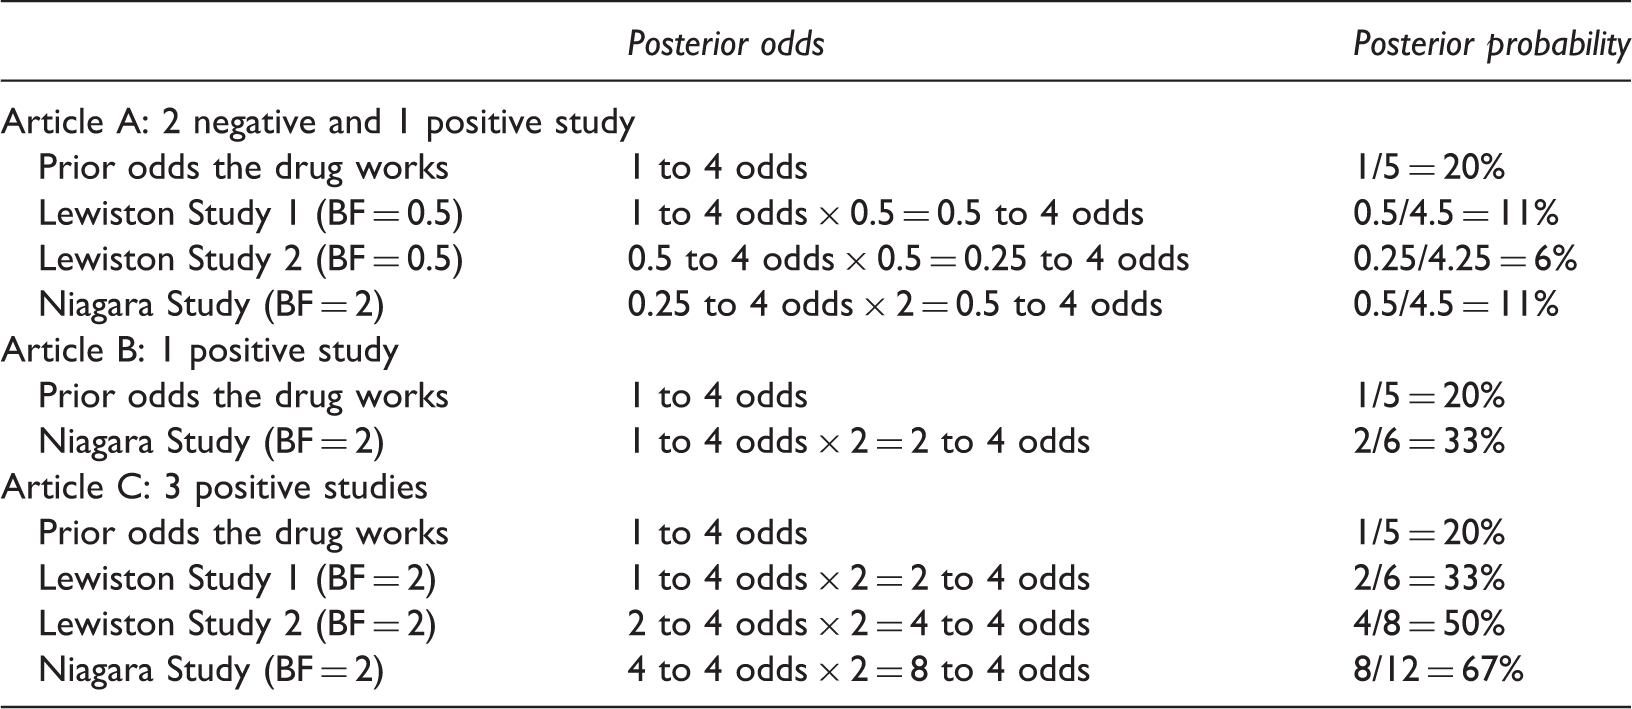
These computations produce probabilities that can be considered correct or prescriptive, given the assumptions on which they are based. 4 Article B describes a single positive outcome. If the Bayes factor is 2 for this result, it increases the probability that the drug works from the base rate of 20% to 33%. The combination of two negative outcomes and one positive outcome yields a relatively low probability the drug works (article A, 11%), whereas the probability is much higher for three positive findings (article C, 67%). If participants do take prior research into account, their general pattern of estimates should be similar to Table 1, even if their assumptions about prior odds or the weight of the evidence are somewhat different than ours.
The Current Study
The current study was designed to answer two main questions. First, to what extent is the interpretation of a research result affected by prior research? Second, if interpretations are relatively unaffected by prior research, is this less likely to occur for people with more statistics experience? If so, we would have some evidence that statistics instructors do help students learn to attend to the context in which results occur. To answer these questions, we asked study participants to read one of the three news articles in Figure 1. The articles all described the same study that found a positive outcome for the new treatment, but the articles vary in their description of the number and outcome of prior studies. Participants estimated the probability that the treatment is effective and answered questions about their statistics experience. The probability estimates were compared to the pattern in our Bayesian analysis.
Method
Participants
The participants were 362 members of the online research platform Prolific (www.prolific.ac) who had a college degree and were at least 21 years old. Their ages ranged from 21 to 67 years (M = 32.9, SD = 9.48), and 47.5% reported their sex as female. Participants were paid $1.00 for completing the study. This sample size was determined by the funds available for the study, and our desire to have approximately 100 participants read each of the three articles, after excluding those who could not answer all of the comprehension questions correctly.
Materials and Procedure
On the Prolific website, the study was titled “News Article Comprehension and Interpretation,” and participants were told “the general purpose of the study is to learn more about how people interpret news articles.” After giving consent, participants were randomly assigned to read one of the articles shown in Figure 1. Each participant read only one article.
After reading the article, participants answered the 22 questions shown in the Appendix. The article and questions were all on one webpage, allowing participants to refer back to the article if desired to answer questions. Questions 1–6 were used to verify that participants understood the key facts contained in the articles. Questions 7–10 addressed understanding of p values, based on Goodman (2008) and Haller and Krauss (2002). Each answer was assigned a score of 0 to 4 (0 if they strongly disagreed with a correct answer, 4 if they strongly agreed). These p value knowledge scores could range from 0 to 16.
The answer to question 11 was our primary dependent measure—it asked participants to estimate how likely it is that the new drug works (i.e., “reduces the symptoms of depression”). Questions 12–17 assessed statistical experience. Each response was converted into a score from 0 to 4, with higher scores indicating more experience. Scores were summed to obtain a total statistics experience score, which could range from 0 to 24. Finally, questions 18–22 assessed self-reported interest in and understanding of the article.
Results
Data and analysis scripts are available at the Open Science Framework (https://osf.io/n7xzc/). The main analysis was restricted to 251 participants who met our a priori criterion of correctly answering all six comprehension questions. The number of participants who read articles A, B, and C was 74, 97, and 80, respectively. R (R Core Team, 2018) and JASP (JASP Team, 2018) were used for data analysis. Although the literature on base rate neglect is extensive, we found no previous studies that asked participants to make probability estimates after varying prior research outcomes. For this reason, the results we report below are not directly informed by similar prior studies and are instead based solely on the information collected in the current experiment. Prior studies only provide us with general evidence that base-rate neglect occurs for some probability estimation problems.
Probability Estimates for Each Article
Did participants take base rate information into account as prescribed by Bayes’ rule? If so, then compared to a single positive result we should find (a) two prior positive results markedly increase estimates that the drug works, and (b) two prior negative results markedly reduce estimates. The probability estimates for each news article are summarized in the left panel of Figure 2. For articles A, B, and C, the mean estimates were 47.7%, 54.9%, and 57.1%, respectively.
5
The error bars represent Bayesian 99% credible intervals. The intervals were calculated in JASP (JASP Team, 2018) assuming a uniform prior distribution. A Bayesian analysis of variance comparing the three means (computed in JASP using the default settings) yielded an equivocal Bayes factor of BF10 = 0.96, which indicates the data provide approximately equal support for the null and alternative hypotheses. The most important feature of these results is that the pattern of obtained means does not resemble the Bayesian prescription. The median estimate was 40% for all three articles. For one positive study (article B) and three positive studies (article C), the mean estimates differed by only 2%. Two prior negative studies (article A) did reduce the mean estimate by about 8%, but much less than in our Bayesian model.
In the left panel, the bars show the mean probability estimate for each article and the error bars represent the 99% Bayesian credible interval. The values show the number of participants who selected each probability estimate. The median estimate for each article was 40%. The middle panel shows posterior probabilities if studies provide weak evidence, as detailed in Table 1. The right panel shows posterior probabilities assuming the studies provide moderate evidence (Bayes factor = 0.2 or 5). The dotted line shows the initial prior probability of 20% for the Bayesian calculations.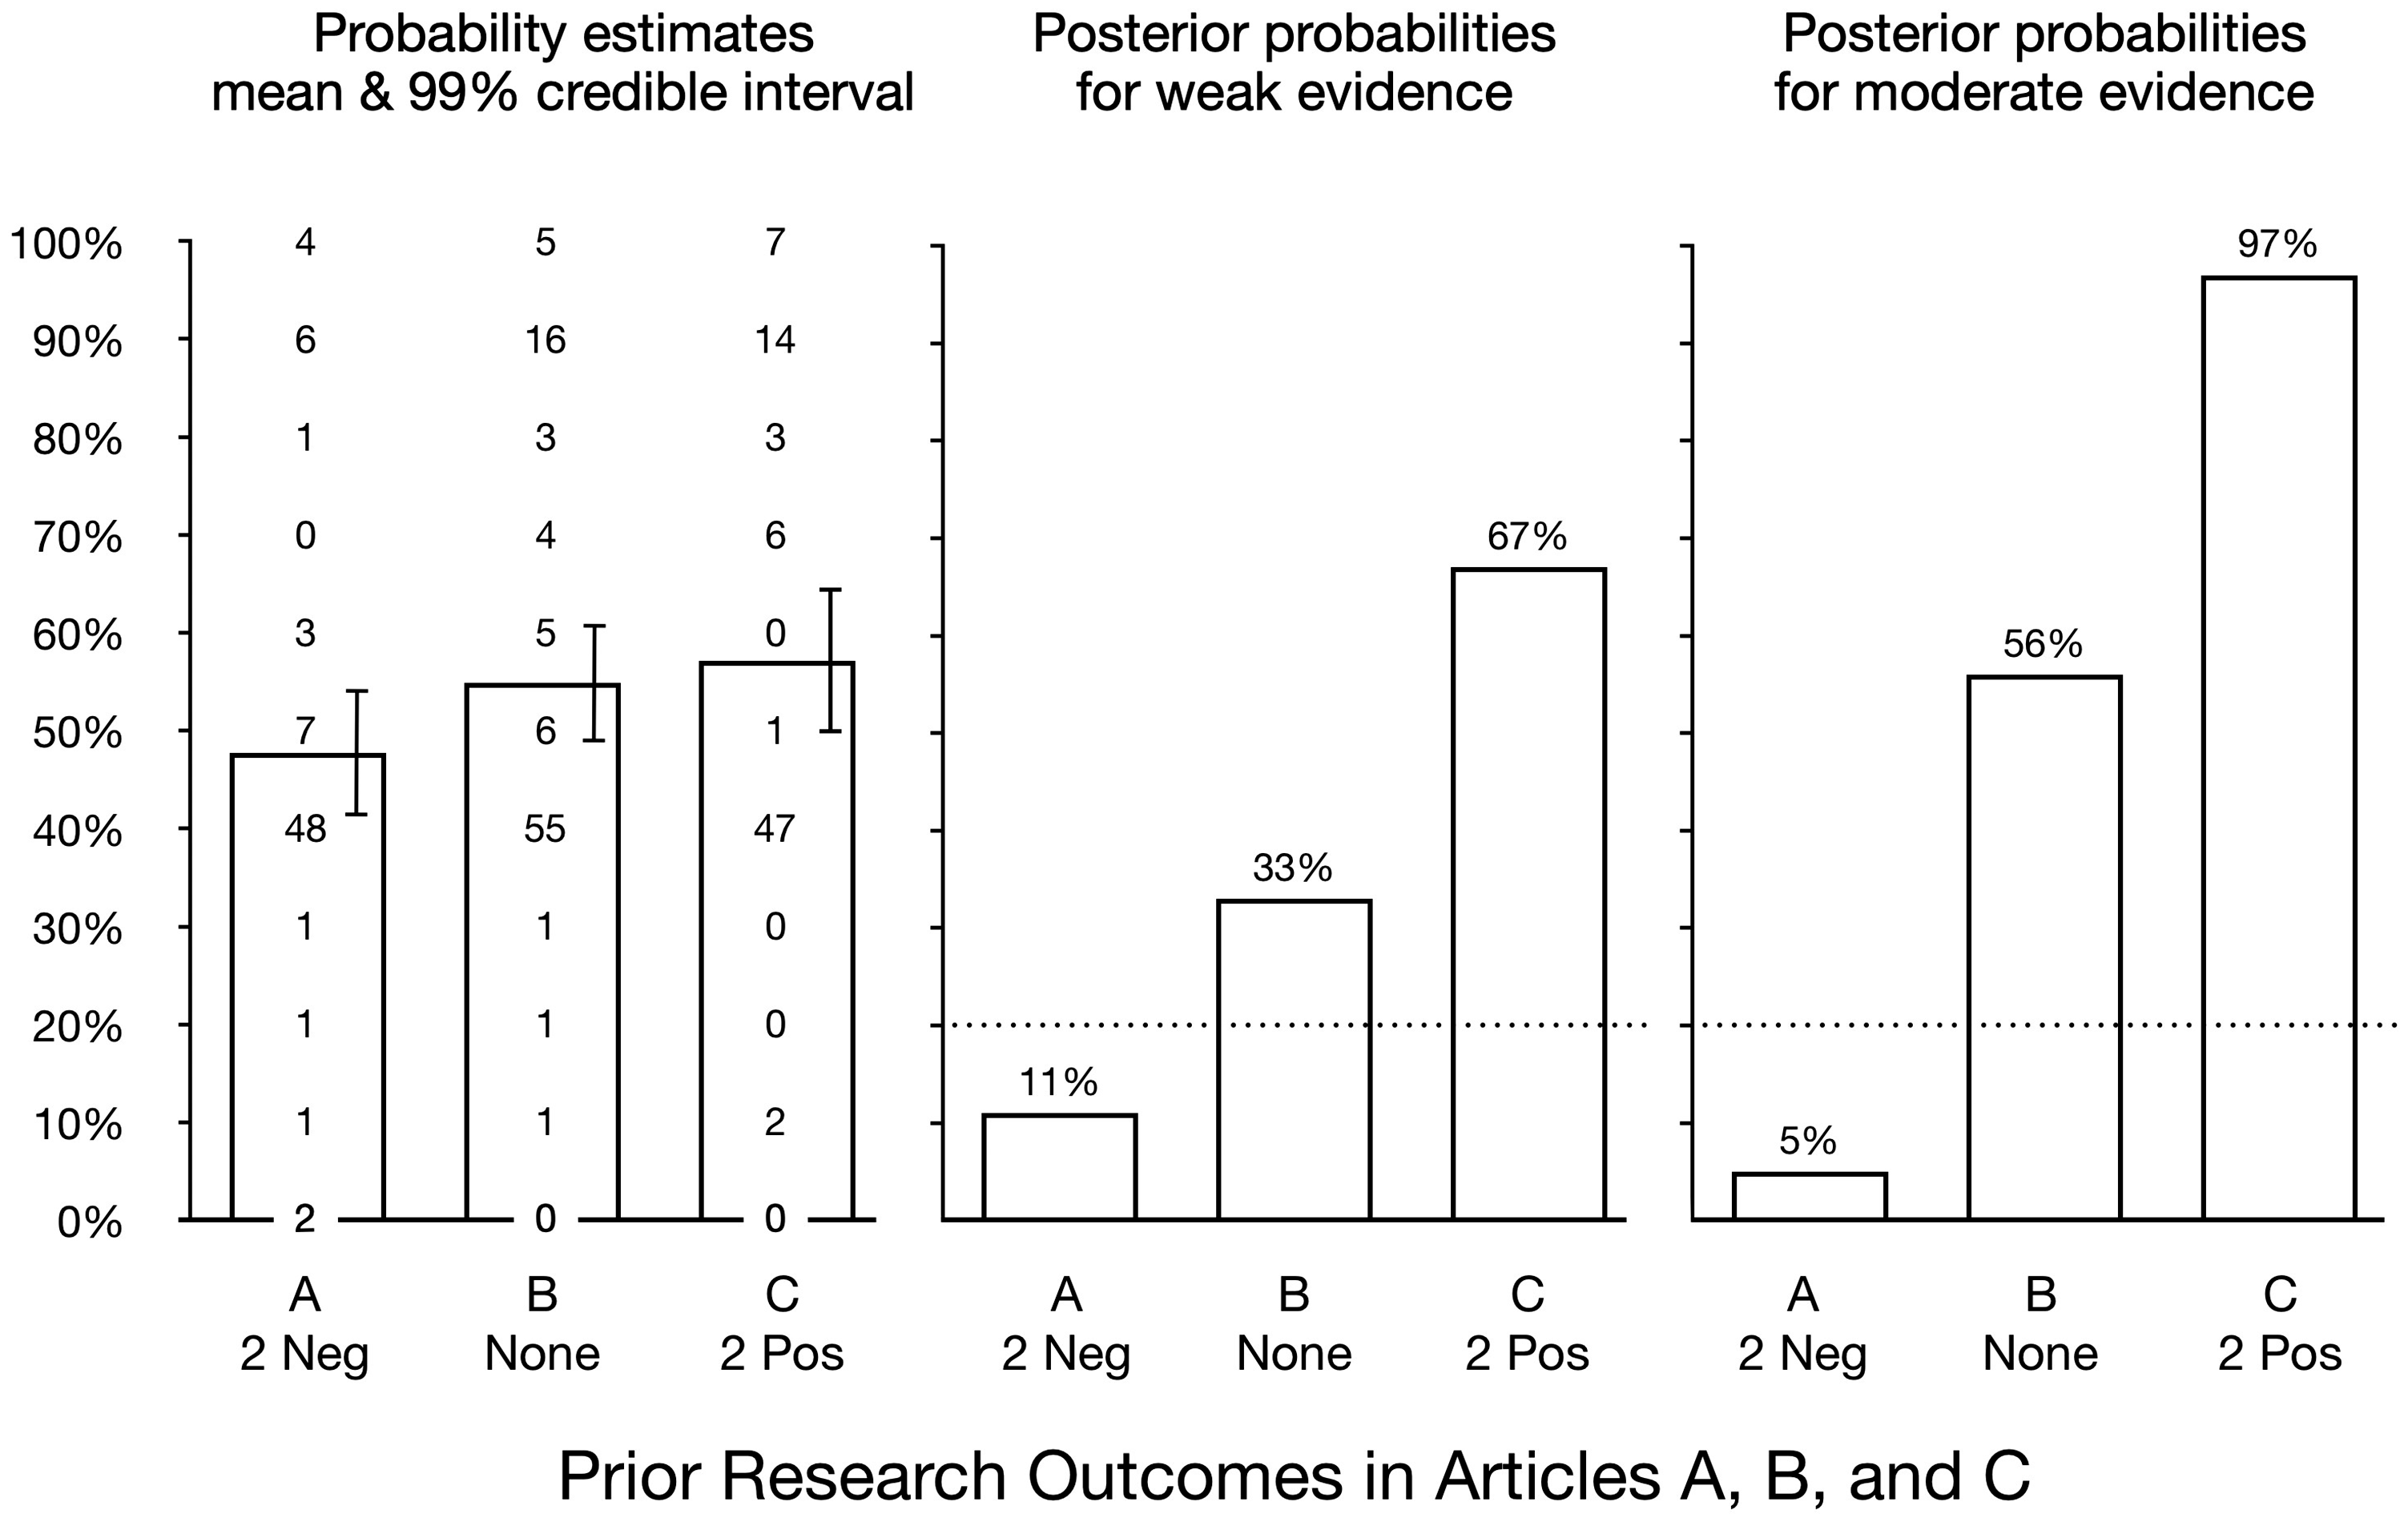
As shown in the middle panel of Figure 2, when the outcome of a single study provides only minimal evidence for or against a treatment effect, the cumulative evidence is still quite strong. Data from three studies that individually provide only weak positive evidence (Bayes factor = 2) combine to increase the probability of an effect from 20% to 67%, as detailed in Table 1. The right panel in Figure 2 shows that moderate positive evidence (Bayes factor = 5) from three studies results in a posterior probability of 97% for a treatment effect. 6 In contrast, two weak negative outcomes reduce the probability of an effect to 6%. Then, when a third study produces a weak positive result, it increases the probability of a treatment effect to just 11%.
What percentage of college graduates gave probability estimates that were consistent with taking prior results into account in this manner? One way to address this question is to look at the percentage of participants, relative to the control condition (article B), who gave a probability estimate that was near the correct answer. For article A, the drug’s Bayesian probability of efficacy was 11%, assuming weak evidence. In this case, we classified estimates of 20% or lower as correct. For article A, 5% of participants (four of 74) gave a correct estimate. However, for article B (no prior research), 2% also gave an estimate of 20% or lower. This means only an additional 3% of participants gave correct (i.e., low) estimates when they read about two prior negative findings in article A. For article C (two prior positive results), the drug’s Bayesian probability of efficacy was 67%, assuming weak evidence. For this article, estimates of 60% and above were considered correct, and 30 of the 80 participants (38%) who read this article gave such ratings. But 33 of 97 (34%) participants who read article B, which contained no prior research, also gave estimates of 60% or higher. Thus, only an additional 4% gave high estimates after reading the article with two prior positive results.
The preceding analysis shows that, relative to the control condition, only an additional 3% to 4% of participants gave probability estimates similar to those prescribed by Bayes’ theorem. It is important to note that we do not know how participants made their estimates, so cannot say if they took prior information into account or used a different process. For example, it is possible some participants who read article C ignored the prior studies, yet gave a high probability estimate because they hold the misconception that “p < .05” means there is a 95% chance the treatment works. If this is the case, then our 4% figure for college graduates who considered prior information in that condition may be an overestimate.
Does Statistics Experience Matter?
Overall, participants acted as if they undervalued or ignored evidence from prior studies. But are the results different for people who reported having more experience in statistics? To address this question, we used the statistics experience scores, which as described above represent participants’ combined answers to questions 12–17. The statistics experience scores ranged from 0 to 24, and were positively skewed (Mdn = 6, M = 7.2, SD = 4.72,). We performed a multiple regression on participant probability estimates of drug effectiveness with predictors of article type and statistics experience, as well as their interaction, using a forced-entry method. Because article is a categorical variable with three levels (previous information about the drug was positive, negative or none), it was recoded into two new variables (none vs positive and none vs negative), which were entered in the model. Thus, none served as the baseline. This model revealed no evidence that information from previous research was taken into account by participants when estimating drug effectiveness or that this interacted with statistics experience, Multiple R2 = .032, F(5, 245) = 1.63, p = .152, BF10 = 0.30. Figure 3 summarizes this analysis graphically. For each article, there is little or no relationship between statistics experience scores and probability estimates. For a detailed summary of the regression analysis, refer to Table S1 in the Supplemental Materials.
For each article, the relationship between statistics experience scores and probability estimates that the drug is effective. For all three articles, there was little or no linear relationship between statistics experience and probability estimates. Note that a small amount of random noise (jitter) was added to each value to make overlapping points visible.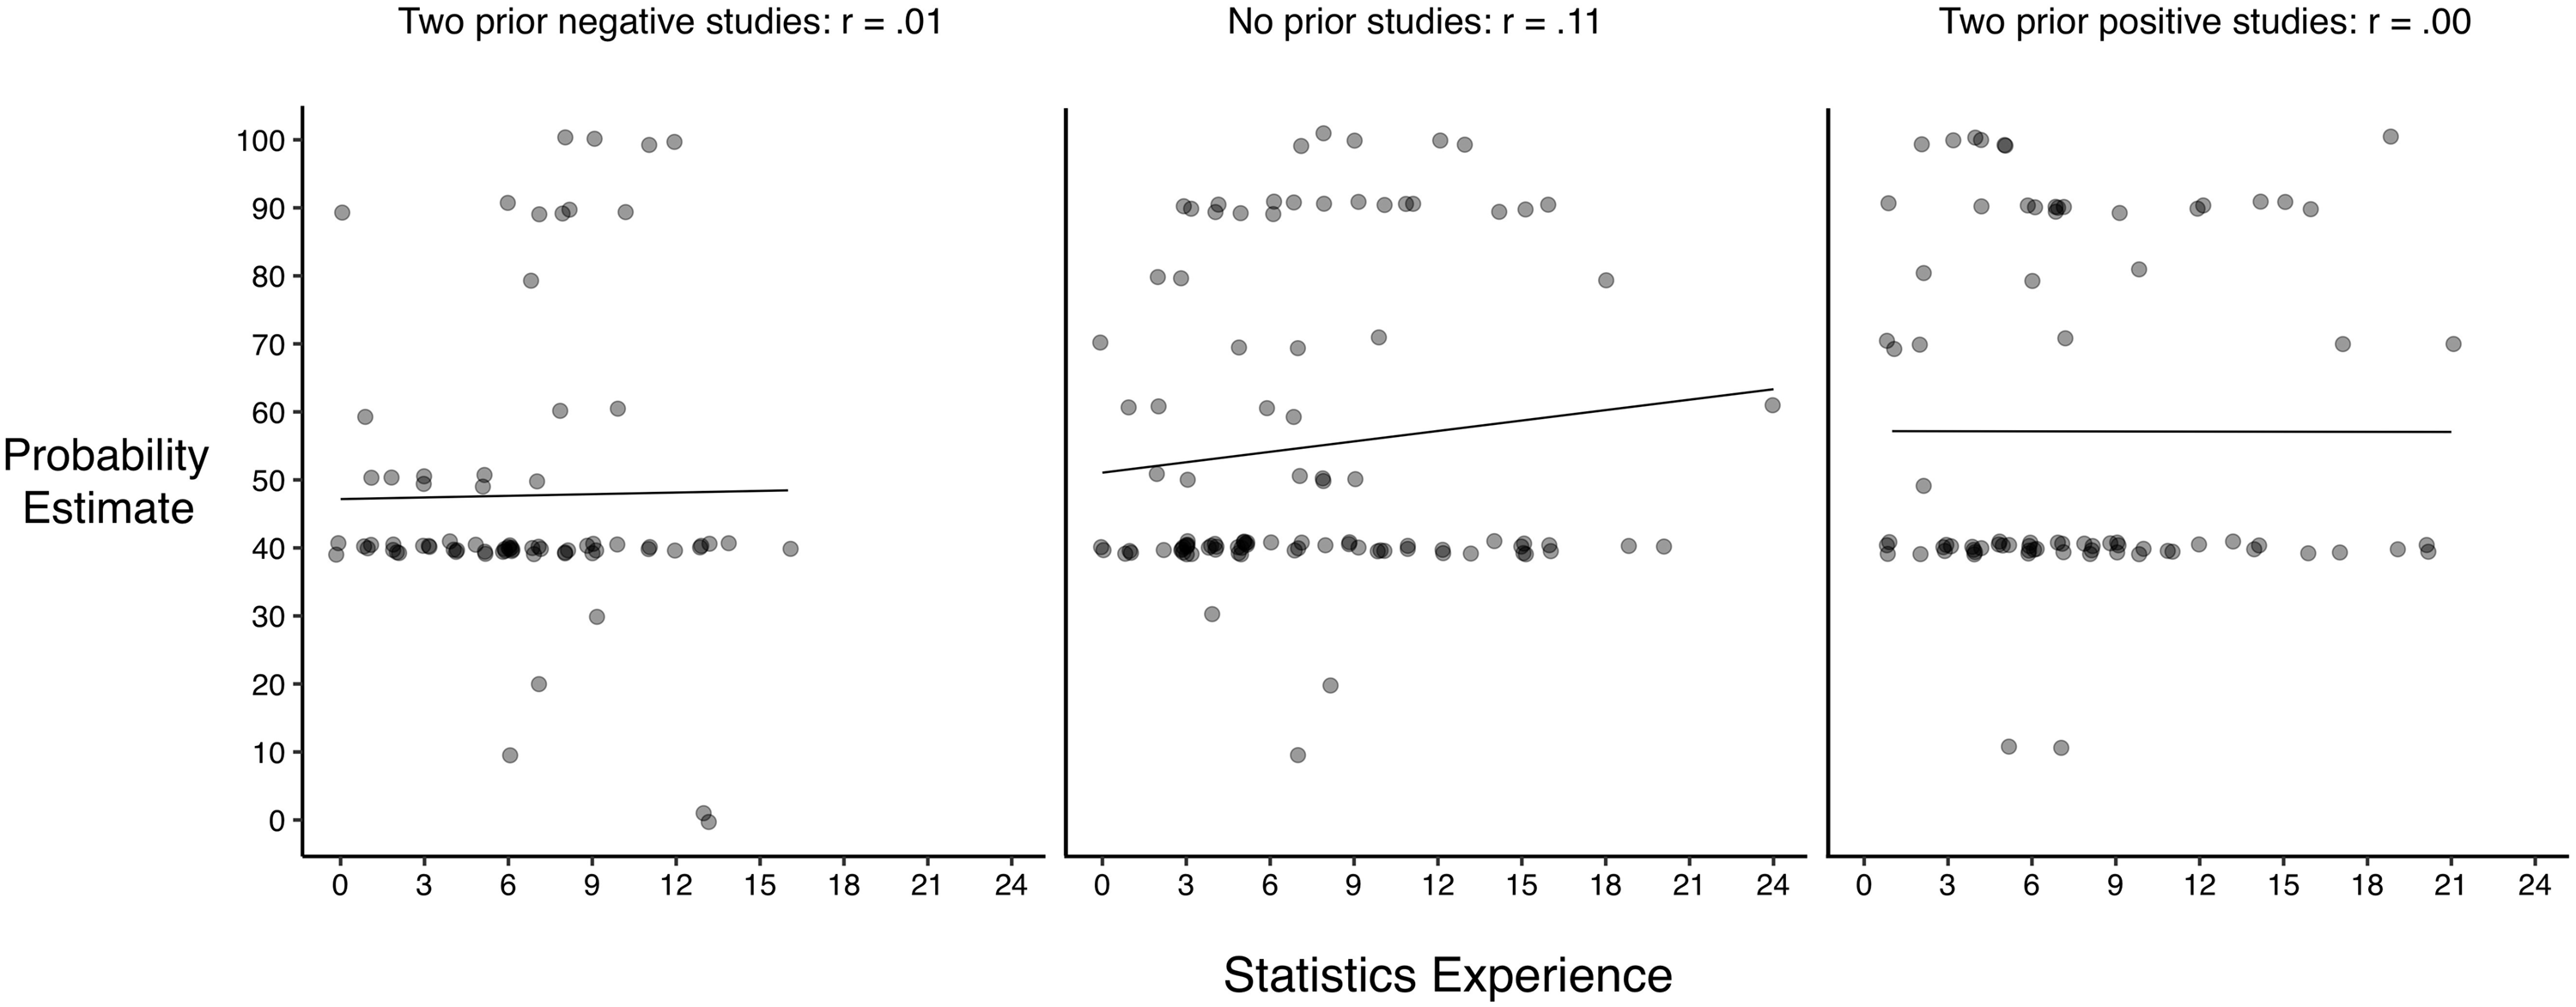
As with the overall results, these results are very different from the relatively large adjustment in the posterior probability prescribed by Bayes’ theorem when there is even weak positive evidence. Overall, these data show that the extent to which information about prior studies is neglected is similar among participants who report lower and higher amounts of statistics experience.
Discussion
In the present study, college graduates as a whole appeared relatively insensitive to prior research—and thus the base rate—presented in the articles. Perhaps the most striking evidence for this conclusion is that most of the participants who read each article gave the same probability estimate for the drug’s effectiveness, 40%. Insensitivity to prior information was displayed by those who had little or no training in statistics, and by those who had taken statistics courses. Although two negative results (article A) did reduce the mean confidence in the drug’s efficacy somewhat, the effect was small in relation to the reduction prescribed by our Bayesian analysis. These data are consistent with prior research showing that people sometimes fail to account for base rates when making probability estimates (e.g., Kahneman & Tversky, 1972; Manrai et al., 2014; McDowell & Jacobs, 2017; Pennycook et al., 2014; Sedlmeier & Gigerenzer, 2001).
The present data suggest that participants had a strong tendency to either (a) ignore prior evidence or (b) treat each study as if it provided almost no evidence at all. We suspect the first explanation is more likely, because nearly all of the probability estimates for the Niagara study alone (article B) were 40% or higher. If participants thought the study provided little evidence about the drug’s efficacy, then many of them would have given lower probability estimates (assuming their prior belief in the drug's efficacy was relatively low). Another possibility is that most participants actually did take a Bayesian approach to the study task with approximately a 50% prior belief that the drug is effective. This would help explain why the average probability estimates were near 50%, but would also require participants to give very little weight to both negative and positive study outcomes. Additionally, it may be that participants had difficulty understanding or answering our probability estimation question (Appendix, question 11). Future studies might include several different questions to obtain probability estimates, perhaps emphasizing that the estimate should be based on all of the available evidence, including the results of any previous studies that were described.
It is also possible that the present findings are due to the way information about research studies was summarized in the fictitious articles. Ebersole, Axt, and Nosek (2016) found that United States adults rate a research finding as more likely to be true if it is subsequently replicated by another researcher, and less likely to be true if not replicated. Unlike the articles used in the currently study, Ebersole et al. presented research findings in very brief and general terms (e.g., “Researcher X did a study and found an interesting result and published it. Researcher Y tried to replicate the result and succeeded.”). Our inclusion of study details and statistical terminology such as “statistically significant” and “p < .05” may have encouraged participants to focus on one study at the expense of any prior studies mentioned in the article. This is a concerning possibility, given how research results are typically presented, and would be an interesting question to pursue in future studies.
As Figure 2 shows, more than half of the participants who read each article gave a probability estimate of 40%. Because all three articles stated the new drug reduced depressive symptoms by 40%, it seems likely that at least some of those participants used this effect size as their estimate. If some participants equated the effect size with the probability the drug is effective, it would mean they ignored any prior research and based their estimate entirely on the results of the Niagara study.
Another possible explanation for our findings is that participants knew they should take prior research into account, but did not know how. To investigate this possibility, future research might ask participants to explain the reasons for their probability estimates. It may also be informative to vary the stated effect size or the number of prior studies. In the present study, articles A and C mentioned two prior studies. Perhaps 5 or 10 previous studies are needed before people feel confident in their conclusions. Such manipulations might provide a way to measure how much weight participants subjectively give to different study outcomes.
Improving Interpretation of Statistical Results
Based on the present data, it seems many participants followed a simple rule for drawing conclusions from research: “Focus on the results at hand, and pay little or no attention to previous studies.” Presumably few instructors actually recommend this strategy, yet it appears to be what many college students are learning—or perhaps failing to unlearn—in their statistics and methodology classes. We offer four suggestions for improving the interpretation of research results. Note that the pedagogical efficacy of these recommendations was not tested in the present study. Those are questions that might be addressed in further research.
First, we recommend instructors assign and discuss supplemental readings that explain why and how to combine prior and current findings. This same information could be added to textbooks, with accompanying exercises. Based on our inspection of several recent methodology and statistics textbooks, few discuss the topic, but when they do it is in the context of meta-analysis. For supplemental readings, we recommend articles such as Goodman (1999b), Wasserstein and Lazar (2016), and Ly et al. (2018).
In many statistics courses, little or no time is devoted to Bayesian concepts (e.g., Ord, Ripley, Hook, & Erspamer, 2016). Nevertheless, students can learn the importance of taking prior probability into account without an extensive discussion of Bayesian statistics (e.g., Ruscio, 2003; Sedlmeier & Gigerenzer, 2001; Thompson, 2019). Also, Bayes factors, as used in the present study, can be taught as a fairly straightforward way to combine evidence from multiple studies (Goodman, 1999b; Wagenmakers, Morey, & Lee, 2016). Ruberg et al. (2019) offer recommendations from a Bayesian perspective for combining results from multiple drug trials. Instruction in the basic ideas underlying meta-analysis can also help sensitize students to the importance of previous research, and provide a method for combining studies (see Goh, Hall, & Rosenthal, 2016, for advice on combining evidence from a small number of studies). Like traditional significance tests, standard meta-analysis does not allow probabilities to be attached to hypotheses. However, because p values well below .05 for combined effect sizes do indicate data are inconsistent with the null hypothesis, the approach is not without merit as an instructional strategy.
Second, instructors might have students carry out a learning activity similar to the task used in the present study. Students could interpret realistic summaries of research that describe different types and amounts of prior research. The summaries might vary (a) whether prior studies support the hypothesis being tested, (b) the strength of the evidence from each study, and (c) the number of prior studies. This kind of activity may be more effective if it is repeated several times during the course.
Our third suggestion to help students learn to account for prior research is for instructors and textbook authors to dispel misconceptions about p-values. It is now widely recognized that students (and researchers) often believe that “p < .05” means there is less than a 5% chance that the null hypothesis is true (e.g., Goodman, 1999a; Haller & Krauss, 2002). If students hold this misconception, then they may understandably feel justified in concluding that a statistically significant result means an effect likely exists, with no need to consider other evidence. Falk and Greenbaum (1995, p. 94) made this point concisely: “Significance tests fail to give us the information we need but they induce the illusion that we have it.” Some writers have suggested using confidence intervals instead of p values, but traditional confidence intervals are also widely misunderstood (Hoekstra, Morey, Rouder, & Wagenmakers, 2014).
In line with previous findings, many participants in the present study seemed to misunderstand p values. For example, there were 49 participants with statistics experience scores above the median score of 6 who read article B, which described only the Niagara study (i.e., p < .05, no prior research). All but three of these participants had taken one or more statistics courses, yet 28 of them (57%) agreed or strongly agreed with the false statement “The Niagara researchers found there is about a 5% chance that the treatment is not effective.” 7
One likely reason students hold p value misconceptions is their explicit presentation in textbooks (Haller & Krauss, 2002). For example, the authors of one methodology text state “when a researcher rejects the null hypothesis at exactly the .05 level (i.e., p = .05), there are 5 chances in 100 that the null hypothesis is correct” (Patten & Newhart, 2017, p. 250). Another example is the definition of a p value in the American Psychological Association Publication Manual (APA, 2010, p. 34): “the probability of obtaining a value as extreme or more extreme than the one obtained.” This definition is incorrect because it omits the essential qualifier “assuming the null hypothesis is true.” Because misconceptions appear in books, they are surely being presented by some instructors to their classes.
In considering how to improve teaching and learning of p values, we think it is important to heed the warning of Sellke, Bayarri, and Berger (2001, p. 71): “The standard approach in teaching—of stressing the formal definition of a p value while warning against its misinterpretation—has simply been an abysmal failure.” Wasserstein, Schirm, and Lazar (2019, p. 1) share this view, saying “Don’t is not enough”—instructors also need to provide “dos.” Yes, students should to be told “Don’t equate alpha with the probability the null hypothesis is true.” But then they can learn how to estimate the probability that the null hypothesis is true (see Thompson, 2019, for one example; also see Kowalski & Taylor, 2009, for general advice about correcting misconceptions). To make success more likely, we recommend the repeated use of realistic, discipline-specific, teaching activities designed to help students distinguish between the alpha level, p value, and false alarm rate. Additionally, instructors may want to examine how these concepts are taught in introductory statistics courses across their department or college. This assessment may help identify specific ways in which instruction can improve (Maurer, Hudiburgh, Werwinski, & Bailer, 2019).
Our final recommendation for improving interpretation of results is directed at authors of research articles: translate statistical results into clear descriptions of the findings. This recommendation is also relevant for educators who help students learn how to write research papers. As Goodman (2018, p. 7) points out, “[scientific claims] are often communicated so obliquely that it is hard to know what to make of them … This fuzziness makes clear communication difficult between scientists, and all but impossible with others, from journalists to doctors, policymakers and the public.” The APA Publication Manual instructs authors to “Assume that your reader has a professional knowledge of statistical methods” (p. 33). However, this advice is at odds with the goal of making research findings accessible to a wide audience. And, as we have seen, even many professionals misinterpret statistical results (Haller & Krauss, 2002; Hoekstra et al., 2014). Therefore, we suggest authors do all they can to accurately communicate the meaning of their findings. To do this, authors should consider providing explicit probability information, when appropriate, that replaces or supplements traditional results. This view is also supported by research showing that effect sizes expressed as a percentage are rated as more informative than indices such as partial eta squared or Cohen’s d (Hanel & Mehler, 2019). To make sense of a research paper, readers should not have to consult a statistical Rosetta Stone such as Goodman’s (2008) “dirty dozen” paper on p value misconceptions. This recommendation echoes recent arguments for “new statistics,” particularly those based on Bayesian methods (e.g., Kruschke & Liddell, 2018; Marsman & Wagenmakers, 2017; Wagenmakers et al., 2016).
As an example, instead of assuming readers can accurately estimate the probability that a treatment works—something we know many cannot do—authors themselves can provide it. Goodman (2018) makes a similar suggestion: “Let’s require that any researcher making a claim in a study accompany it with their estimate of the chance that the claim is true” (p. 7). Morey, Hoekstra, Rouder, Lee, & Wagenmakers (2016) express a similar view about confidence intervals: “Authors choosing to report [confidence intervals] have a responsibility to keep their readers from invalid inferences, because it is almost certain that without a warning readers will misinterpret them” (p. 119). To illustrate, a researcher might summarize the evidence in article C this way: “Combining the evidence from the two prior studies with the results of the current study, we estimate there is a 67% chance that Sarawel reduces the symptoms of depression” (see Marsman & Wagenmakers, 2017, for other examples). A Bayesian credible interval (but not a traditional confidence interval) allows a statement such as, “From the combined evidence of the three studies to date, we estimate there is a 95% probability that Sarawel reduces symptoms by 34 to 46 percent, relative to a placebo treatment” (see Morey et al. for advice on explaining and reporting intervals).
In summary, few studies are so conclusive that they can be interpreted on their own. Most research results must be considered within a broader context that includes the outcome of prior studies. Wrinch and Jeffreys (1921) made a similar point a century ago: “No probability is ever determined from experience alone. It is always influenced to some extent by the knowledge we had before the experience” (p. 381). Unfortunately, based on the present data, we estimate that most college graduates—even those with statistics experience—ignore or discount available knowledge from prior studies. To improve interpretation of research findings, we recommend that instructors and textbook authors help students learn (a) the importance of attending to prior research, (b) methods to account for prior research when interpreting new findings, and (c) how to describe findings in terms that are clear, direct, and easily understood by readers with a wide range statistical knowledge.
Supplemental Material
PLJ877590 Supplemental Material - Supplemental material for Is One Study as Good as Three? College Graduates Seem to Think So, Even if They Took Statistics Classes
Supplemental material, PLJ877590 Supplemental Material for Is One Study as Good as Three? College Graduates Seem to Think So, Even if They Took Statistics Classes by W Burt Thompson, Amanda Garry, John Taylor and Milen L. Radell in Psychology Learning & Teaching
Footnotes
Acknowledgements
We thank Donna Fisher-Thompson, Sue Mason, and Marlo Brown for helpful comments on various aspects of this research.
Declaration of Conflicting Interests
The author(s) declared no potential conflicts of interest with respect to the research, authorship, and/or publication of this article.
Funding
The author(s) received no specific grant from any funding agency in the public, commercial, or not-for-profit sectors.
Supplemental Material
Supplemental material for this article is available online.
Notes
References
Supplementary Material
Please find the following supplemental material available below.
For Open Access articles published under a Creative Commons License, all supplemental material carries the same license as the article it is associated with.
For non-Open Access articles published, all supplemental material carries a non-exclusive license, and permission requests for re-use of supplemental material or any part of supplemental material shall be sent directly to the copyright owner as specified in the copyright notice associated with the article.