
Abstract
Graduate training in psychology emphasizes a student's ability to understand research design and methodology, as well as to generate research that contributes to the profession. The Attitudes Toward Research (ATR) scale was developed in 2005 to measure attitudes among student populations. Past research suggests the scale contains five factors: usefulness of research, research anxiety, positive feelings about research, relevancy of research to the students' daily lives, and difficulty of research. The current study utilized data collected from first year graduate students (N = 128) to examine the psychometric properties of the ATR. While the internal consistency and the construct validity of the scale were adequate, the scale did not appear to be a predictor of student grades in this sample. Exploratory factor analyses revealed a three-, four-, and seven-factor solution. Confirmatory factor analyses suggested that the five-factor model was a poor fit for the ATR. While the ATR assesses an important construct, the inferences made from this measure may be less useful when studying graduate students' attitudes and how they may impact learning and training.
Undergraduate and graduate students in the social sciences are often required to take classes in research methodology and statistics. In the field of psychology, research is recognized as a key competency (Rodolfa et al., 2005). In addition, advanced statistics and research methods courses are considered two of the more challenging courses that students in the social sciences are required to take (Murtonen & Lehtinen, 2003). Further, it has been suggested that the coursework is only one of nine components of the research training environment (RTE) that affects student involvement in research. Gelso (1993) defined the RTE as “all of those forces in graduate training programs (and more broadly, the departments and universities within which the programs are situated) that reflect attitudes toward research and science” (p. 470).
Two other components of the RTE include faculty modeling of positive behavior and attitudes, and early student involvement in research in an effort to decrease anxiety. Scores on a measure of the RTE have been shown to be correlated with both attitudes toward research and self-efficacy in research. (Gelso, Mallinckrodt, & Judge, 1996). Thus, reliable and valid tools to measure student attitudes toward research are needed to allow for testing of various interventions and methods to improve attitudes and the broader RTE. While past research has been conducted to develop and evaluate scales to measure attitudes toward statistics (Schau, Stevens, Dauphinee, & Vecchino, 1995; Wise, 1985), a very limited amount of research has focused on scales to measure attitudes toward research methods, particularly in graduate student populations. While statistics is often rated as more challenging than research methods (Murtonen & Lehtinen, 2003), research methods are a foundation of the field and consist of concepts necessary to use and interpret statistics. The factor structure and psychometric properties of one scale in particular, the Attitudes Toward Research Scale (ATR; Papanastasiou, 2005), have been explored in a few studies. Initially, Papanastasiou (2005) found that the scale demonstrated strong validity and reliability with undergraduate education students and that the scale consists of five subscales. Later, Papanastasiou and Schumacker (2014) applied the Rasch Rating Scale to the ATR scale and found that a 30-item version of the scale demonstrated the strongest validity and reliability, again in a sample of undergraduate education students. However, the factor structure and psychometric properties of this scale have not been thoroughly examined using other populations in which research is valued, such as psychology students enrolled in Masters and Doctoral-level graduate programs.
Rodolfa et al. (2005) developed a conceptual framework identifying key aspects of competency in psychology training. The authors divide areas of competency into three domains: foundational competency, functional competency, and stages of professional development. Functional competencies describe the skills and knowledge required to practice as a psychologist. Among functional competencies is that of “research – evaluation,” which is described as the use of research in one's professional life. Foundational competencies are those skills that are typically learned in graduate training. Included within foundational competencies, the authors identified “scientific knowledge – methods,” which captures the “ability to understand research, research methodology and a respect for scientifically derived knowledge, techniques of data collection and analysis” (Rodolfa et al., 2005, p. 351). Both of these elements suggest the importance of research in general as a key competency in the field of psychology.
However, while is it expected that students will develop into competent researchers, psychologists tend to see their field as less scientific and empirically grounded when compared with other fields, such as physics (Howell, Collisson, & King, 2014). Howell et al. (2014) conducted a study exploring what they refer to as “physics envy” among psychologists. They describe physics envy as a feeling of insecurity and defensiveness about the scientific rigor of the field. To evaluate physics envy, psychologists and physicists were asked to complete a questionnaire that measured their perceptions of empiricism in their separate fields. Items on the measure included statements about education standards in each field, the overall scientific rigor of the field, as well as other similar topics. Participants were asked to rate on a Likert scale the degree to which they agreed or disagreed with each statement.
The results of this study suggest that compared with physicists, psychologists rated their field as generally less scientific. In addition, psychologists rated their field as having less agreement when it came to core principles compared with physicists. This trend indicates that psychologists believe students across different institutions are not being taught the same set of core principles. This disparity between the role psychologists want empiricism to have in the field, and the role psychologists believe it has, is interesting and raises questions about how research and research concepts are implemented in psychologists' training programs.
Several studies have been undertaken to develop an understanding of factors that impact research training outcomes in students. Gelso (1993) theorized that upon entry into a graduate program, most students are ambivalent toward research because they do not have the experience to fully know if they have an interest in research. Gelso proposed an original 10 “ingredients” of RTEs (Gelso, 1979), but later revised these based on their empirical support, resulting in six ingredients. He argued that if present in a graduate training program, these six factors positively affect research attitudes and research participation. These ingredients include: (a) how faculty model research behaviors and attitudes; (b) how scientific activity is reinforced in the program; (c) opportunities for student involvement in research; (d) the idea that all research is flawed and limited; (e) the variety of methodologies and approaches students are exposed to; and (f) demonstration that science and applied practice can be used together. Ultimately, Gelso suggests that these ingredients impact student attitudes toward research, which in turn impacts their willingness to conduct and be involved in research.
Gelso et al. (1996) evaluated the Research Training Environment Scale (RTES) in attempt to revise and improve the scale. To do this, the authors had 173 doctoral psychology students take a 72-item version of the RTES. In addition, students completed measures of attitudes toward research and research self-efficacy which were later used to assess convergent validity of the RTES. Findings of the study suggest that the RTES was positively correlated with both research attitudes and research self-efficacy. Further, the authors identified several programs as having a high impact of training based on self-reported measures of change throughout the program. These high-impact programs had higher RTES scores than other programs, lending support to the proposed relationship between the RTE ingredients, improved attitudes, and increased interest in research.
In addition to exploring the institutional factors that contribute to research attitudes, several studies have focused on individual factors. In other social science fields, such as sociology and education, research has examined students' experiences of research methodology courses. Murtonen and Lehtinen (2003) explored the difficulties education and sociology students experience in quantitative methods courses. Student participants were asked to complete three tasks; the first was to place several academic subjects on a coordinate system that evaluated the difficulty or ease of learning the subject and the perceived concreteness or abstractness of the subject. Subjects included ideas from research methodology, the student's major (either education or sociology), and foreign languages. The second and third tasks were open-ended and recorded by students throughout their course in diary format. Students were asked to record concepts from the course that they found difficult and to record ideas about what makes research methodology difficult.
Results revealed that statistical and quantitative concepts were rated as both the most difficult and the most abstract concepts, while foreign language concepts were rated as both the easiest and most concrete concepts. Research methodology concepts, in general, were considered more difficult than foreign language concepts and concepts from the student's major, but less difficult than statistics in general. Answers to the open-ended questions revealed that students struggled with research methodology concepts for five primary reasons. One of these reasons was identified as negative attitudes toward the subject. Further, students reported that they felt research methodology was not interesting to them, and that because they did not excel in mathematics they could not excel in research methods. Students also suggested that research methods were not extremely important to their field of study, and therefore they had negative attitudes when it came to taking the course. Based on this, the authors suggest that further research pertaining to anxiety and negative attitudes toward research methods courses is vital in improving student comfort and performance in the course.
Papanastasiou and Zembylas (2008) administered two questionnaires to 472 undergraduate education students. The first questionnaire measured attitudes toward research and contained a research anxiety subscale, and the second was a measure of general anxiety. The authors were interested in measuring each of these variables separately but also looking at the relationship between the two. Results of this study revealed that when students viewed the course as less difficult, they also had lower levels of anxiety about the course.
To better understand the factors associated with research attitudes, Papanastasiou (2005) developed the ATR scale. To develop the scale, Papanastasiou administered a 56-item version of the scale to 226 undergraduate students who had completed an introductory research course at the University of Cyprus. The measure includes statements such as “research makes me anxious,” and asks participants to record the degree to which they agree or disagree with the statement where one represents “strongly disagree” and seven represents “strongly agree.” The course, “Methodology of Educational Research” was designed to prepare education students to conduct and consume educational research. After administration, the scale was subjected to a reliability analysis to assess the internal consistency, during which items that decreased overall reliability were removed, resulting in a 41-item version of the scale. The author then conducted a principal factor analysis on the 41-item version of the scale, which resulted in an 11-factor scale that accounted for 66.4% of variance. After excluding items with low loadings, factors with only a few items, factors with eigenvalues less than 1.1 or with poor interpretability, the scale contained 32 items with 5 factors that accounted for 66.25% of variance.
The first factor, research usefulness, contained nine items, including “research is useful for my career” and “research training should be indispensable in my professional training.” This factor accounted for 18.92% of the overall variance. The second factor, research anxiety, contained eight items, including “research makes me nervous” and “research is stressful;” it accounted for 17.94% of total variance. The third factor, positive attitudes toward research, consisted of eight items, such as “I love research” and accounted for 15.42% of total variance. The fourth factor, relevance to daily life, comprised four factors, including items such as “I use research in my daily life,” and this factor accounted for 8.30% of total variance. The fifth and final factor, research difficulty, contained three items, accounted for 5.67% of total variance, and included items such as “I have trouble with arithmetic.”
Papanastasiou and Schumacker (2014) later evaluated the ATR scale using the Rasch Rating Scale (Wright & Masters, 1982). Similar to the initial study, the sample for this study consisted of 541 undergraduate education students enrolled in a compulsory research methodology course. The authors applied the Rasch Rating Scale model to participants' raw ATR scale scores. Findings of the analysis suggested that removing two items from the scale would increase the quality of the scale's overall psychometric properties. The two items removed seemed more closely related to statistics attitudes than research methods attitudes. The resulting 30-item version of the scale demonstrated high reliability and validity with this sample.
In 2014, Papanastasiou reevaluated the psychometric properties of the ATR and consequently developed a revised scale (R-ATR). Using a sample similar to the previous two studies, 317 undergraduate students enrolled in an educational research methodology course took the 32-item ATR. This study used confirmatory factor analysis in an attempt to validate the factor structure of the scale. The results of the confirmatory factor analysis suggested poor fit of the five-factor model. To improve fit, the author removed any items with large amounts of error variance. At the conclusion of this analysis, the R-ATR consists of 13 items and three factors, whereas the original scale consists of 32 items and five factors. The three remaining factors were research usefulness, research anxiety, and positive research predisposition. A second factor analysis was conducted with the revised scale, which showed improved fit and suggested the three-factor model had an overall adequate fit. Finally, internal consistency estimates for each of the three subscales were evaluated, and Cronbach's alpha coefficients ranged between 0.86 and 0.92, suggesting high reliability.
Since its development, the ATR scale has been used in several studies, providing opportunities to evaluate the scale's psychometric properties. Results of these studies have been mixed. Shaukat, Siddiquah, Abiodullah, and Arkbar (2014) used the ATR to assess attitudes toward research in postgraduate education students. In using the original 32-item scale, the authors found that the scale overall had high internal consistency reliability with their population (α = .84). However, the subscale reliability estimates ranged between .38 (research difficulty subscale) and .87 (relevance to life subscale). They noted that the three subscales with the lowest reliabilities contained fewer than five items and suggested this could be a possible cause of their low reliability.
Morgenshtern, Freymond, Agyapong, and Greeson (2011) used the ATR scale to evaluate attitudes toward research in graduate social work students. This study also used the original 32-item scale and internal consistency reliability was high (α = .94). Reliability scores for the subscales were also high, ranging from 0.78 (relevance to life subscale) to .92 (positive attitudes subscale). In addition, they found that the five factors accounted for 65.7% of total variance in their sample. The previously mentioned study by Papanastasiou and Zembylas (2008) also found high internal consistency reliability when using the scale. Overall, the reliability estimate of the scale was .94 and reliability of the five subscales ranged from .70 (research difficulty subscale) to .93 (research anxiety subscale).
The developer of the ATR indicated that student attitudes toward a research methods course have important practical implications in undergraduate populations (Papanastasiou, 2005). Specifically, Papanastasiou (2005) suggested that by administering the ATR, research methods instructors may be able to identify domains where students could use amelioration and this could lead to improvements in “attitudes, skills, and behaviors that would facilitate both the learning of research methods, as well as nurture a deeper appreciation of research” (p.23). Further, the author posited that the ATR “might also have potential for identifying distinctive attitude profiles of students who find research problematic” (p. 23).
These implications also apply to graduate student populations and affect graduate instructors, research mentors, and the overall RTE of graduate programs; however, the way in which graduate students view research may be different than undergraduate students. It is important to determine if the domains, as operationally defined by the ATR, would be conceptualized similarly in graduate student populations, especially given that during graduate training students are required to take research methods courses, conduct research autonomously, and expected to be engaged in research activities upon graduation. Only two studies to date have investigated the properties of the ATR in post-baccalaureate programs, and neither was in the field of psychology.
Method
The data utilized for this study were archival in nature and collected in the course of two different research studies that included, in addition to other measures, the ATR scale. Both were samples of convenience and consisted of students enrolled in graduate programs in clinical psychology. The focus of this prior work was to assess the impact of an intervention that attempted to decrease statistics anxiety; however, subscales of the ATR were used to see if there would be a concomitant decrease in anxiety related to research, and perhaps an increase in positive attitudes toward research. While there may be some similarities in the attitudes between statistics courses and research methods courses, the ATR is the only tool known to specifically address attitudes toward research. Being able to assess graduate students' anxiety and attitudes toward research in a valid manner is vital for research pertaining to the RTE.
Participants
Subjects were 128 graduate students attending masters or doctoral programs in clinical psychology, and enrolled in either statistics and/or research methods courses. All participants resided in the Pacific Northwest and the demographic characteristics across all samples were as follows. The majority of participants were female (61%) and identified as Caucasian (75%), while the ages ranged from 21 to 59, with the average being 27.72 (SD = 6.42).
Measures
As was described in the introduction and literature above, the ATR, developed by Papanastasiou (2005), was the key measure for this research. During the iterative process of developing the ATR over the course of three studies the author revised the original version, removing 17 items that related to the relevance to life and research difficulty subscales, creating a final version consisting of 13 items and three subscales (research usefulness, research anxiety, and positive research predisposition; Papanastasiou, 2014). One goal of this research was to evaluate the reliability, factor structure, and validity of both versions of this measure to determine if one was more psychometrically sound than the other. The construct (convergent) and criterion-related (concurrent) validity of the ATR was assessed by correlating total and subscale scores with several other measurement tools described below.
Self-efficacy in research
The Self-Efficacy in Research Measure (SERM) was developed by Phillips and Russell (1994). The scale contains 33 items and four subscales; research design skills, practical research skills, quantitative computer skills, and writing skills. Items on the scale ask participants to rate how confident they are in either completing a certain task or having a certain skill. Responses are captured using a Likert scale ranging from 0 (no confidence) to 9 (total confidence). Phillips and Russell (1994) found that the internal consistency of the overall scale was satisfactory (α = .96). In addition, reliability for the four subscales was satisfactory with alphas ranging between .83 and .94.
Statistics self-efficacy
The Current Statistics Self-efficacy (CSSE) measure was developed by Finney & Schraw (2003), who defined statistics self-efficacy as “confidence in one's abilities to solve specific tasks related to statistics.” The CSSE contains 14 items where subjects respond using a 6-point Likert-type scale ranging from no confidence at all to complete confidence. Finney and Schraw (2003) reported an adequate internal consistency estimate (α = .91) for the CSSE and item-total correlations above .53. Further, regarding the criterion-related validity of the CSSE, the authors found the CSSE predicted course performance (e.g. achievement).
Statistics anxiety and attitudes toward statistics
The Statistical Anxiety Rating Scale (STARS) developed by Cruise, Cash, and Bolton (1985) is one of the most widely used measures for assessing statistics anxiety. STARS contains a total of 51 items and measures six components of statistics anxiety; specifically, worth of statistics, interpretation anxiety, test and class anxiety, computational self-concept, fear of asking for help, and fear of statistics teachers. For the first 23 items on the STARS measure, respondents are presented with different situations and asked to indicate, using a five-point Likert-type scale, how much anxiety they would experience in that situation (i.e., no anxiety, low anxiety, moderate anxiety, high anxiety, extreme anxiety). The remaining 28 items measure various attitudes toward statistics. Respondents again use a five-point Likert-type scale; however, they are asked to indicate their level of agreement with each item (i.e., strongly disagree, disagree, neither agree nor disagree, agree, strongly agree). Cruise and colleagues (1985) reported adequate test–retest reliability estimates, between .67 and .83, for the STARS subscales. Further, the authors established the concurrent validity of the STARS via strong positive correlations with a mathematics anxiety scale. Chew and Dillon (2014) reviewed the existing literature on statistics anxiety and made recommendations for future research in order to refine the statistics anxiety construct. Specifically, it has been suggested that the first three subscales of the STARS (Interpretation Anxiety, Test and Class Anxiety, and Fear of Asking for Help subscales) assess statistics anxiety, whereas the last three subscales (Worth of Statistics, Computation Self-Concept, and Fear of Statistics Teachers subscales) assess attitudes toward statistics (2014, p. 198).
Achievement and knowledge
Some participants allowed grades on course assignments and exams to be accessed. For the current study, two homework assignments relating to research methodology were utilized. One assignment required students to identify plausible threats to validity, including internal, external, construct validity of the experiment, and statistical conclusion validity. The other assignment required students to read two empirical articles and respond to questions regarding methodological components and design. For example, students had to indicate whether the design used in the article would be considered a true experiment and provide a rationale as to how the article's design related to the three key characteristics of a true experiment. Another question asked students to identify if the researchers utilized any blind ratings, and if so why they chose this approach. This required students to identify that blind ratings were made to reduce error stemming from experimenter expectancies. Finally, students' midterm examination grades were also utilized as an outcome. Students were given 1 hour and 20 minutes to complete a 40-item multiple choice exam with seven short-answer open-ended questions.
Results
Data collected from multiple samples as described above were analyzed with the Statistical Package for the Social Sciences (SPSS, version 24). Appropriate item transformations (e.g. reverse coding) were performed. To examine the psychometric properties of the ATR, multiple analyses were conducted utilizing data from the combined samples. Reliability analyses were conducted to assess the internal consistency of the ATR and the subscales. Validity coefficients between the ATR scales and other measures were computed. In addition, exploratory factor analyses were conducted to examine the structure of the ATR.
Internal Consistency Analyses
Internal Consistency Estimates, Means, and Standard Deviations for Measures and Subscales.
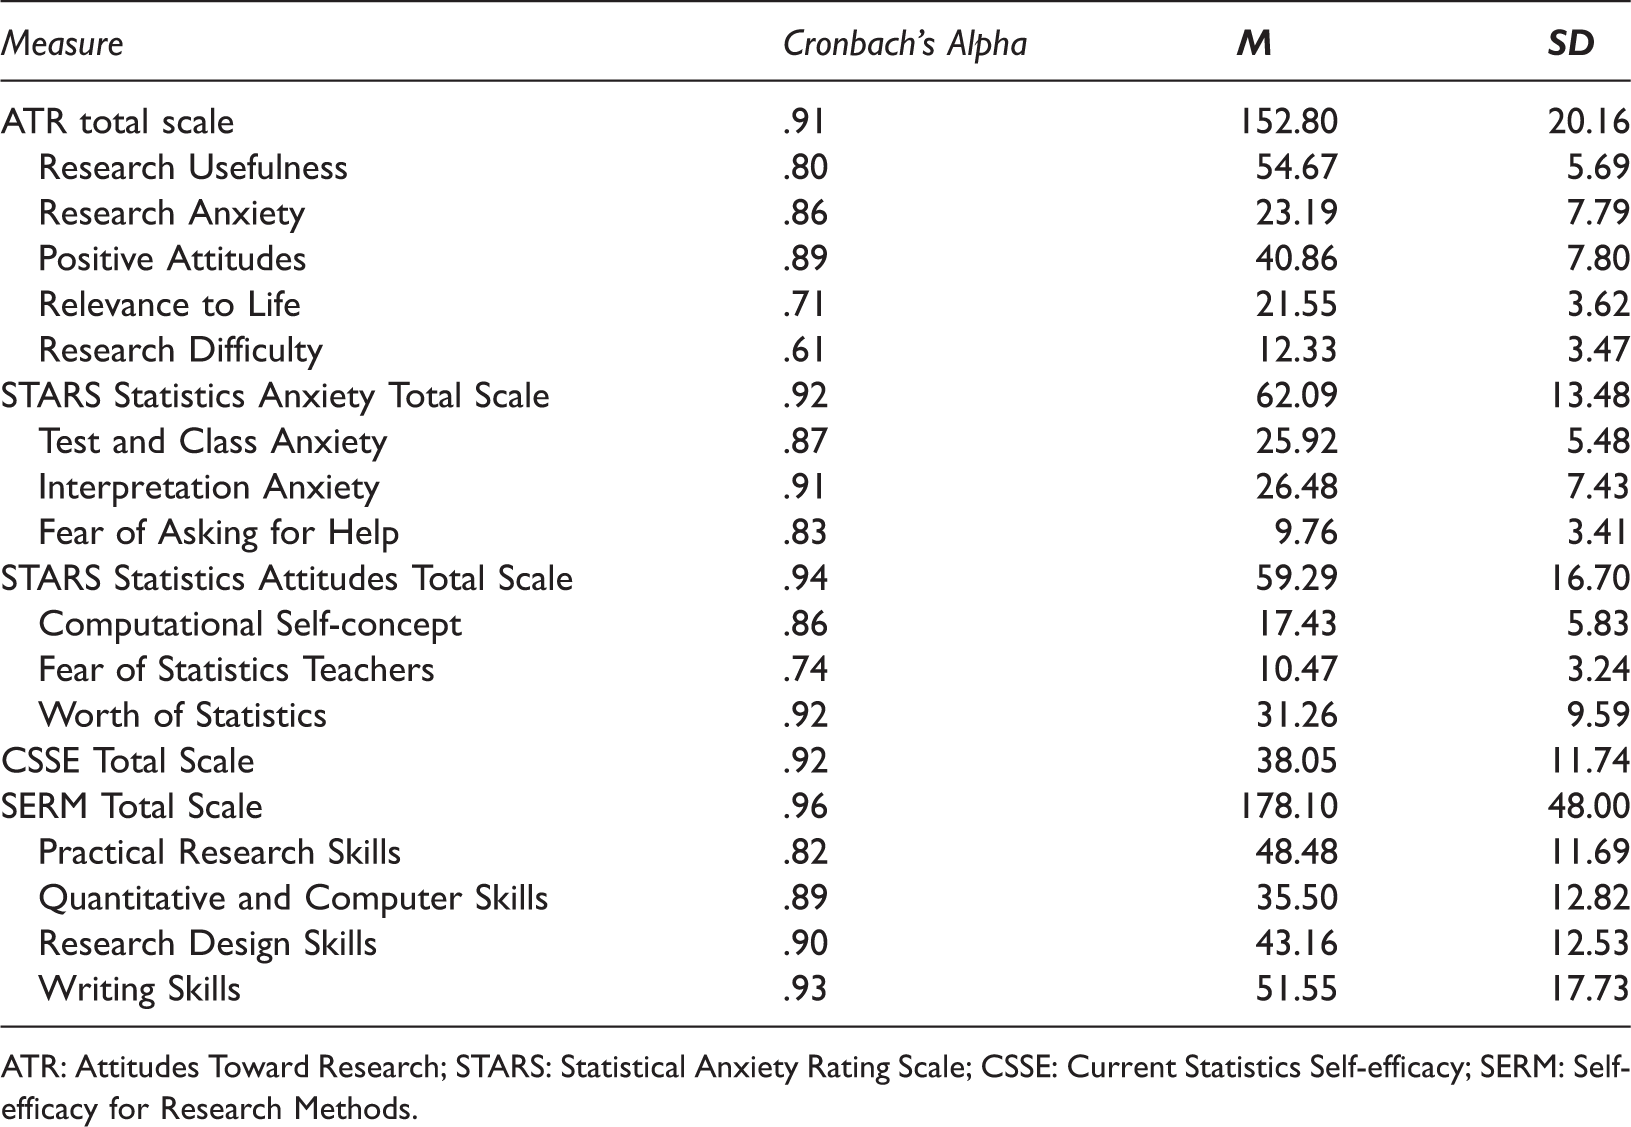
ATR: Attitudes Toward Research; STARS: Statistical Anxiety Rating Scale; CSSE: Current Statistics Self-efficacy; SERM: Self-efficacy for Research Methods.
Validity Analyses
Construct validity
Construct Validity Coefficients.
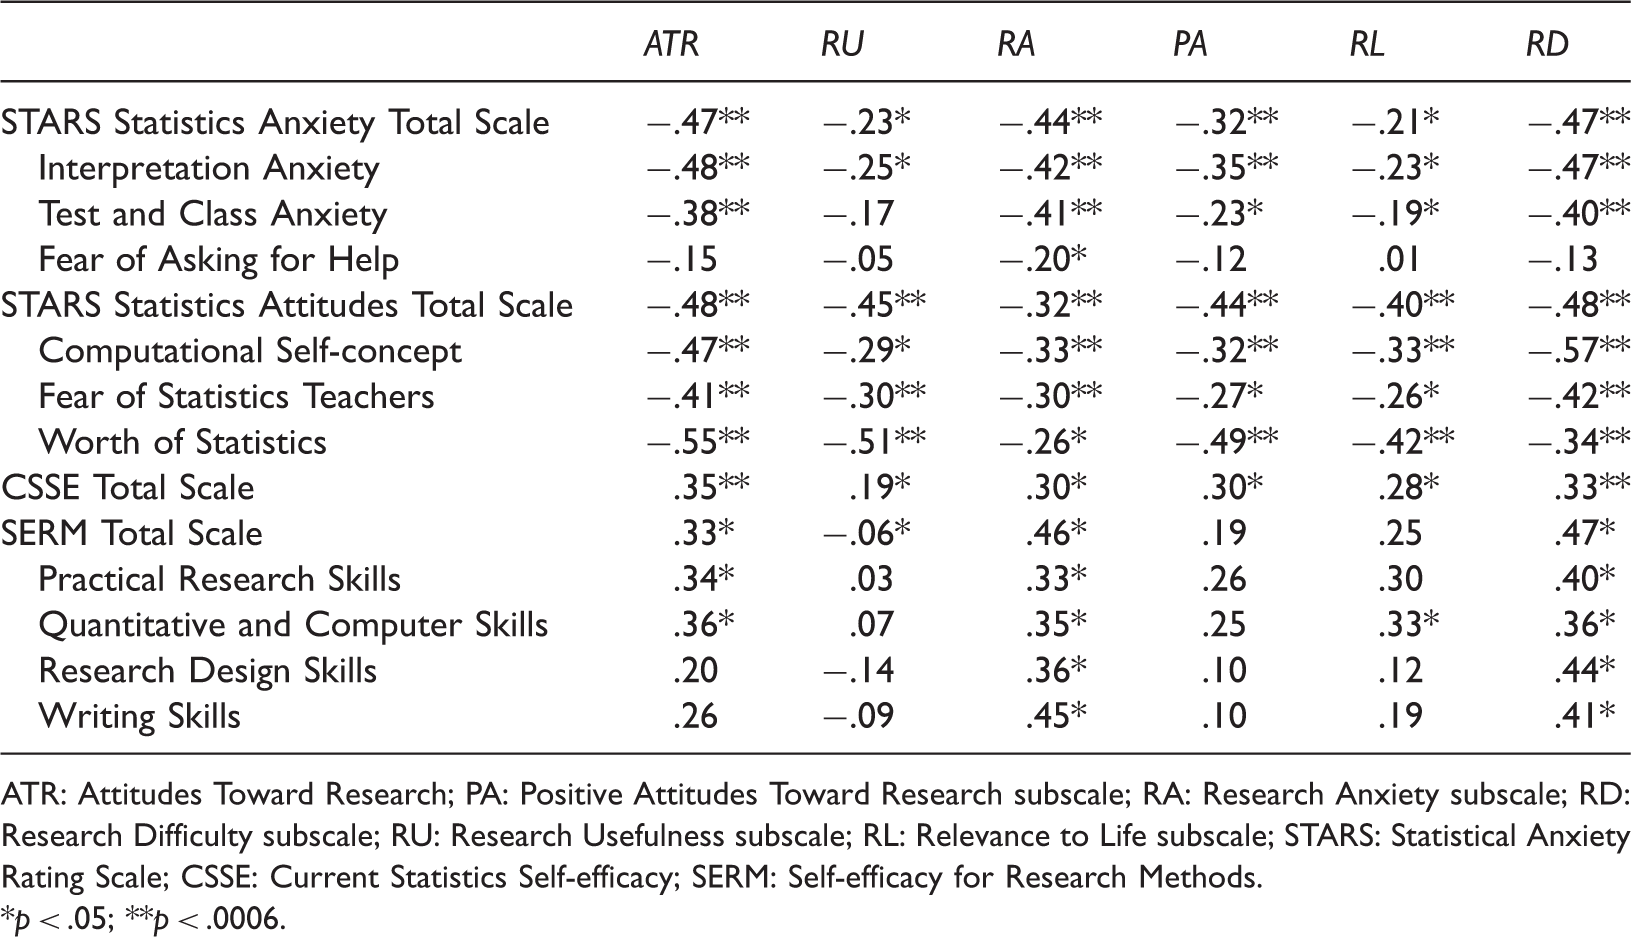
ATR: Attitudes Toward Research; PA: Positive Attitudes Toward Research subscale; RA: Research Anxiety subscale; RD: Research Difficulty subscale; RU: Research Usefulness subscale; RL: Relevance to Life subscale; STARS: Statistical Anxiety Rating Scale; CSSE: Current Statistics Self-efficacy; SERM: Self-efficacy for Research Methods.
*p < .05; **p < .0006.
The correlation coefficients indicated that between individuals in this sample the statistics anxiety total score was moderately, negatively correlated with the ATR total scores, indicating that students with more statistics anxiety showed less positive attitudes toward research. Of the statistics anxiety subscales, both the interpretation anxiety subscale and the test and class anxiety subscale had a moderate, negative correlation with the ATR total score. The third statistics anxiety subscale, the fear of asking for help subscale, was not significantly correlated with the ATR total score. When the ATR subscales were examined three were found to be moderately, negatively correlated with statistics anxiety; specifically, research anxiety, positive attitudes toward research, and research difficulty. The significance, magnitude, and direction of the correlations demonstrate some support for the construct validity of the ATR.
The statistics attitude total score was also moderately, negatively correlated with the total ATR score, indicating that students with more negative attitudes toward statistics show less positive attitudes toward research. All three of the statistics attitudes subscales (i.e. the worth of statistics subscale, the computational self-concept subscale, and the fear of statistics teachers subscale) had a moderate, negative correlation with the ATR total score. Further, when the ATR subscales were examined all five were found to be moderately, negatively correlated with attitudes toward statistics. Again, the significance, magnitude, and direction of the correlations lend support for the construct validity of the ATR.
The CSSE total score had a moderate, positive correlation with total ATR scores, such that students with more statistics self-efficacy showed more positive attitudes toward research. However, when the subscales of the ATR were examined, only one, research difficulty, had a significant positive relationship with statistics self-efficacy. While not significant, the other four scales were positively related to the CSSE, indicating that students with more statistics self-efficacy showed more positive attitudes toward research, in particular toward the difficulty of research, exhibiting some support for the construct validity of the ATR.
The ATR total score was not significantly correlated with students' self-efficacy with respect to doing research, nor with the four subscales of the SERM. While the magnitude of the correlations does not support the construct validity of the ATR, the relationships were in the expected direction. That is, there were positive correlations between the ATR and the SERM total score, as well as with the SERM subscales, suggesting that some students with more self-efficacy in doing research do show more positive attitudes toward research. Further, the ATR subscales were not found to be significantly related to the SERM and its subscales. However, the strongest correlations were found to be associated with the research anxiety and research difficulty subscales of the ATR, while the weakest were inter-individual associations with the research usefulness subscale.
Criterion-related validity
To assess criterion-related validity, simple and multiple regression analyses were conducted using the ATR total scale and the five subscales as predictors of grades on two different research methods homework assignments (described in the measures section) and the midterm exam, which covered research design and methodology content. The Bonferroni correction was utilized to control for the inflation of Type I error when determining statistical significance across the six analyses, and thus models were considered significant if the p-value was less than the adjusted p-value of .008.
Results suggested that the ATR total score did not predict scores on the assignment pertaining to threats to validity; R2 = .02, b = –0.07, SE = 0.08, p = .33, 95% CI [–0.22, 0.08]. In addition, a multiple regression was conducted using the five subscales as predictors and the assignment grade as the outcome variable. Results of this analysis indicated that when controlling for the other subscales, the research usefulness subscale (b = –0.51, SE = 0.35, p = .15, 95% CI [–1.21, 0.20]), the research anxiety subscale (b = –0.25, SE = 0.22, p = .26, 95% CI [–0.68, 0.19]), the positive attitudes subscale (b = –0.14, SE = 0.26, p = .59, 95% CI [–0.68, 0.39]), and the relevance to life subscale (b = 0.48, SE = 0.57, p = .35, 95% CI [–0.54, 1.50]) were not significant predictors of assignment grades; R2 = .17, F(5,40) = 1.65, p = .17. However, the research difficulty subscale was a significant predictor of assignment grades, b = .97, SE = .47, p = .046, 95% CI [0.20, 1.93].
In addition, results suggested that the total ATR score did not predict grades on the homework assignment that pertained to research design, R2 = .002, b = –0.02, SE = 0.06, p = .79, 95% CI [–0.13, 0.10]. Multiple regression results revealed that the research usefulness scale (b = –0.32, SE = 0.27, p = .25, 95% CI [–0.87, 0.23]), the research anxiety scale (b = –0.17, SE = 0.17, p = .33, 95% CI [–0.51, 0.17]), the positive attitudes subscale (b = 0.10, SE = 0.21, p = .63, 95% CI [–0.32, 0.52]), the relevance to life subscale (b = –0.01, SE = 0.40, p = .98, CI [–0.81, 0.79]) and the research difficulty subscale (b = 0.58, SE = 0.37, p = .13, CI[–0.17, 1.33]) were not significant predictors of assignment grades; R2 = .08, F(5,40) = 0.71, p = .62.
The final criterion variable analyzed was students' grades on the midterm exam. Simple regression results using the total ATR score revealed that the total score was not a significant predictor of midterm grades; R2 = .01, b = –0.07, SE = 0.09, p = .44, 95% CI [–0.25, 0.11]. Multiple regression results revealed that the research usefulness scale (b = 0.13, SE = 0.44, p = .76, 95% CI [–0.75, 1.02]), the research anxiety scale (b = –0.31, SE = 0.27, p = .26, 95% CI [–0.86, 0.24]), the positive attitudes subscale (b = –0.03, SE = 0.33, p = .92, 95% CI [–0.71, 0.64]), the relevance to life subscale (b = 0.35, SE = 0.64, p = .59, 95% CI [–0.94, 1.63]) and the research difficulty subscale (b = –0.22, SE = 0.60, p = .72, 95% CI [–1.42, 0.99]) were not significant predictors of exam grades; R2 = .07, F(5,40) = 0.63, p = .68.
Factor Analyses
Exploratory Factor Analyses (EFA)
First, the data were assessed for suitability for factor analysis. Specifically, the correlation matrix was found to be suitable for factor analysis based on the following: the data from the ATR passed the Bartlett's test of sphericity, p < .001; the Kaiser–Meyer–Olkin (KMO) measure of sampling adequacy was above criterion levels (KMO = .85); the determinant was found to be greater than zero (.06); and when the anti-image covariance matrix was examined, only 3% of the off-diagonal elements values were greater than ±.10.
Factor Loadings for the Seven-Factor Exploratory Factor Analysis Solution.
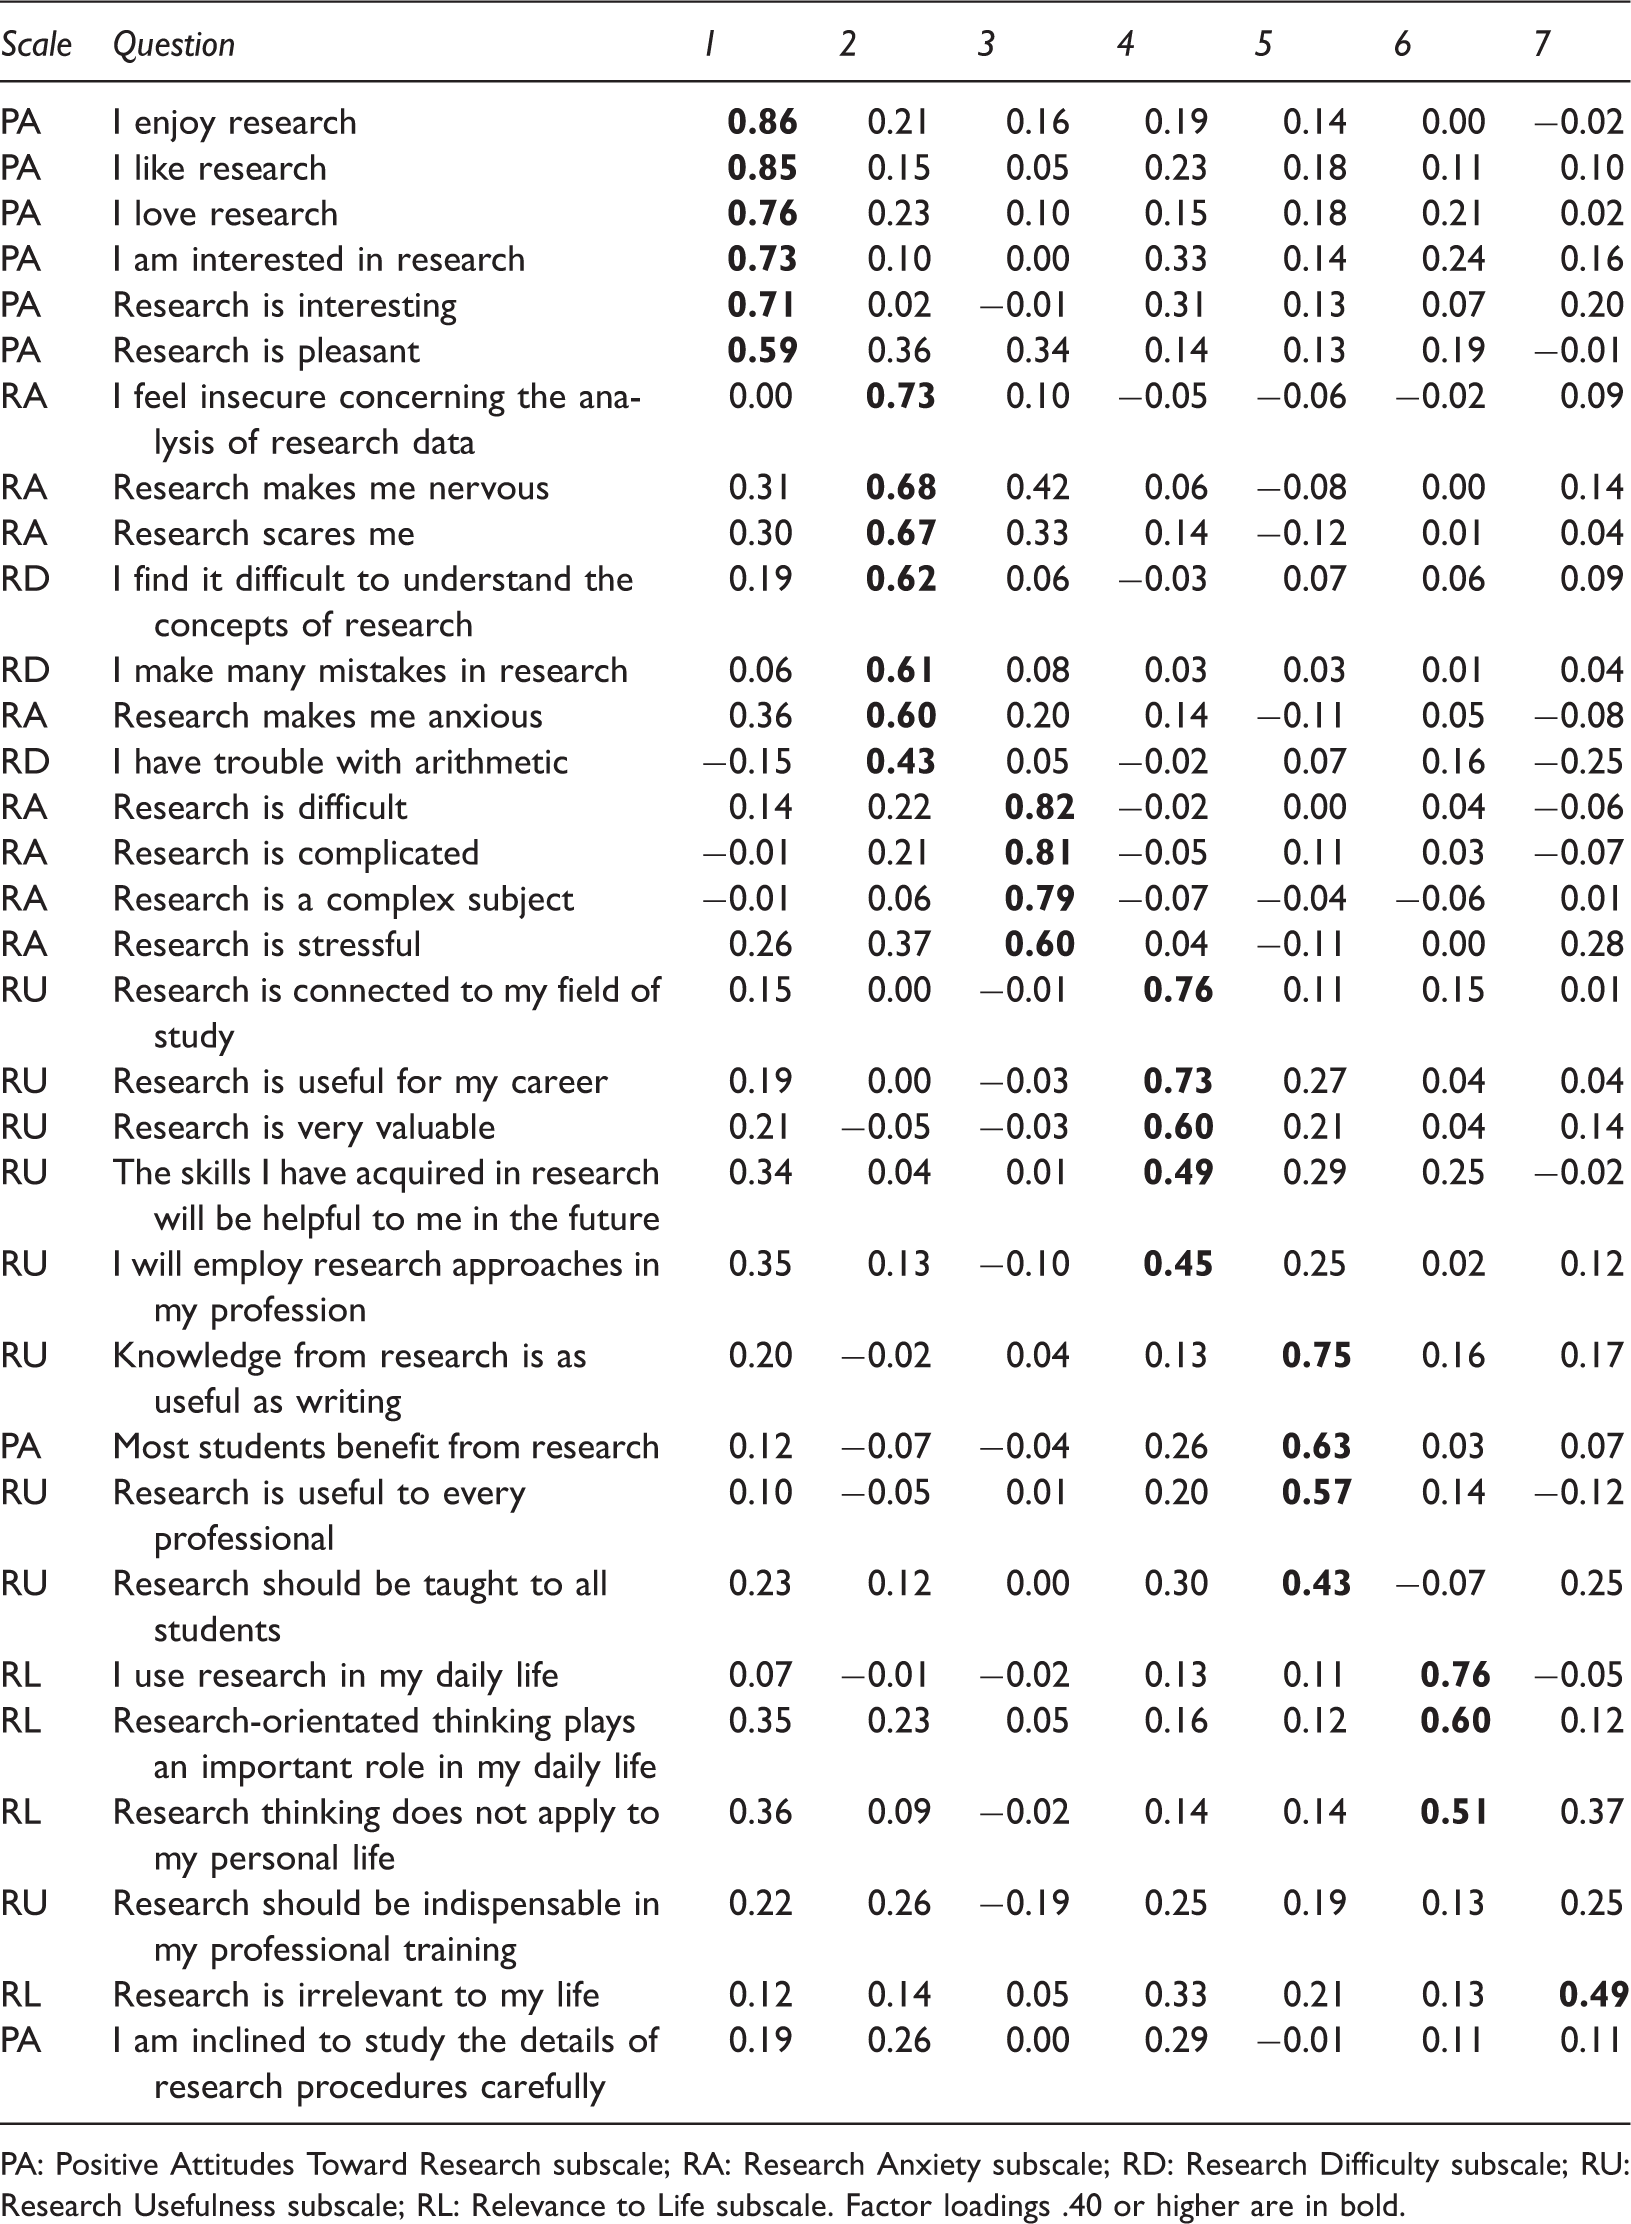
PA: Positive Attitudes Toward Research subscale; RA: Research Anxiety subscale; RD: Research Difficulty subscale; RU: Research Usefulness subscale; RL: Relevance to Life subscale. Factor loadings .40 or higher are in bold.
Confirmatory Factor Analyses
The factor structure of the ATR was assessed by conducting a confirmatory factor analysis on both the five-Factor and three-Factor models proposed by Papanastasiou and colleagues (2005; 2014). Results from the initial five-factor model evaluation yielded a wide range of regression coefficients relating from the factor ranging from –.72 to .92. Fit indexes for the original model revealed a statistically significant chi-square test with a value of 833.92 (62, N = 190), p < .001. The goodness of fit index (GFI, .73), incremental fit index (IFI, .82), adjusted goodness of fit index (AGFI, .68), comparative fit index (CFI, .82), and normed fit index (NFI, .67) showed values that suggest the model was not of adequate fit. The root mean square error of approximation (RMSEA, .08), the parsimonious normed fit index (PNFI, .62), and the parsimonious goodness-of-fit index (PGFI, .62), however, produced values suggesting borderline adequate fit. Overall the fit indices did not support the model. The model was respecified so that error terms were correlated among items on some subscales.
In the respecified model, the fit did improve slightly. The regression coefficients ranged from –.75 to .90. The chi-square test remained significant, 627.15 (60, N = 190), p < .001. The GFI (.79), AGFI (.75), and NFI (.76) still showed values that suggest the model was not of adequate fit. The PGFI (.65), and PNFI (.661) suggest borderline or moderate fit while the RMSEA (.06) and the CFI (.91) suggest adequate fit. While fit may have improved slightly in the respecified model, overall there does not appear to be support for the model's fit. These results suggest that the proposed five-factor structure of the ATR was not supported using the data from this independent sample.
Results from the initial three-factor model evaluation yielded regression coefficients relating from the factor ranging from .42 to .92. Fit indexes for the original model revealed a statistically significant chi-square test with a value of 137.24 (62, N = 91), p < .001. The GFI (.87), AGFI (.81), and NFI (.86) showed values that suggest the model was not of adequate fit. The RMSEA (.10), IFI (.92), and the CFI (.92) suggested marginal or acceptable fit while the PNFI (.68), and the PGFI (.59) produced values suggesting adequate fit. The model was respecified so that error terms were correlated among items on some subscales.
In the respecified model, the fit did improve slightly. The regression coefficients ranged from .42 to .89. The chi-square test remained significant, 116.82 (60, N = 91), p < .001, suggesting poor fit. The GFI (.89), AGFI (.83), and NFI (.88) still showed values that suggest the model was not of adequate fit. The RMSEA (.08), the CFI (.94), and the IFI (.94) suggest marginal to acceptable fit, while the PGFI (.57) and PNFI (.68) suggest adequate fit.
Discussion
This study aimed to evaluate the reliability, validity, and the factor structure of the ATR (Papanastasiou, 2005) in a graduate student sample. Prior to this study, few studies had utilized and evaluated the ATR's validity and those studies provided mixed results (Morgenshtern et al., 2011; Papanastasiou & Zembylas, 2008; Shaukat et al. 2014). Past literature suggested that the ATR scale contained five factors and the revised version of the scale (ATR-R) contained three factors (Papanastasiou, 2005; Papanastasiou, 2014).
To assess construct validity, inter-individual relationships were evaluated between the ATR and the STARS, the CSSE scale, the SERM scale, and all the subscales of these measures. The ATR was expected to share a negative relationship with STARS's anxiety scale. Results from the current study were consistent with this expectation; students with more statistics anxiety showed less positive attitudes toward research. This finding demonstrates convergent validity for the ATR scale. In addition, the ATR scale was negatively correlated with the attitudes about statistics, indicating that students with less negative attitudes related to statistics exhibit more positive attitudes toward research methods, a result which further demonstrates the scale's convergent validity.
Of the STARS subscales, all had moderate, negative relationships with the ATR total scale except for the “fear of asking for help” subscale of the anxiety measure. This subscale was not significantly correlated with the ATR total score (r = –.15); one possible reason for this may be that seeking help is inherently different than the other statistics anxiety subscales, “interpretation anxiety” and “test and class anxiety.”
In addition, the CSSE scale had a moderate, positive relationship with the ATR total score, and the “research difficulty” subscale, such that students with more statistics self-efficacy were also likely to have more positive attitudes toward statistics, adding to the support of the ATR's convergent validity. However, a similar result was not found when self-efficacy in research methods was examined. Surprisingly, the ATR total score and the SERM total score were not significantly related, although the coefficient was positive and moderate in size. Similarly, there was a lack of convergent validity among the ATR subscales and the subscales of the SERM. While not statistically significant, the strongest relationships were found between the “research difficulty” and “research anxiety” ATR subscales and the SERM subscales; i.e., research design self-efficacy, writing skills self-efficacy, practical research skills self-efficacy, and quantitative and computer skills self-efficacy.
Overall, the results suggest that the ATR total score was not a significant predictor of grades on either of the homework assignments or grades on the midterm exam. The only exception to this was the “research difficulty” subscale, which was a significant predictor of grades on the second assignment pertaining to threats to validity. The relationship was such that students who rated research methods as less challenging also tended to have higher grades on their assignment. Ultimately, it does not appear that attitudes toward research predicted student grades in this study. It should also be noted that no other constructs (e.g. STARS, CSSE, SERM, etc.) were predictive of grades. While surprising, this could have been due to characteristics of the assignments and the exam as well as a restriction of range of the student grades.
The results of the EFA indicated that there are seven, three, or four factors within the ATR scale using these data. This is inconsistent with past research that had found five factors to the ATR scale (Papanastasiou, 2005). It was expected that the confirmatory factor analysis would support the original five-factor model for the ATR and the original three-factor model for the R-ATR. However, this was not the case; the analysis revealed that the items did not group in a way that supported a five or three-factor models within the data.
One of the primary differences between this study and the original Papanastasiou study (2005) is the sample. Initially, the authors used a sample of undergraduate education students in developing the scale whereas the current study used graduate psychology students. The difference in the sample is one possible explanation for the incongruent factor analyses. It is possible that students in psychology view concepts like “research usefulness” and “relevance to life” differently than education students. Further, graduate students are in a later stage of their career and may be utilizing research differently than undergraduate students, impacting how they think about research. The major implication of this finding is that there may be fundamental differences in how graduate psychology students conceptualize research, and the tools we use to measure their attitudes may need to reflect these differences.
One possible limitation of this study is that the sample size may have been too small for the factor analyses, even though factorability assessments did not suggest the data were problematic. Further, it deserves noting that inferences and generalizations based on inter-individual sample statistics (i.e., nomothetic research) may not necessarily hold true for some individuals in the target population. As Hamaker (2012) pointed out, it is reasonable to assume “that within-person relationships are characterized by individual differences such that there is no general law which applies to each person” (p. 4). Further, studying intra-individual differences over time may result in very different relationships than ones based on cross-sectional designs. Thus, future research should focus on using sampling methods over time in order to make inferences about intra-individual associations in regard to attitudes toward research. In addition to continued study of the ATR in different target populations, the use of dynamic factor analysis may be beneficial in leading to a better understanding of the structure of the ATR and intra-individual variation.
Declaration of Conflicting Interests
The author(s) declared no potential conflicts of interest with respect to the research, authorship, and/or publication of this article.
Funding
The author(s) received no financial support for the research, authorship, and/or publication of this article.