
Abstract
Lecturers teaching statistics are faced with several challenges supporting students’ learning in appropriate ways. A variety of methods and tools exist to facilitate students’ learning on statistics courses. The online questionnaires presented in this report are a new, slightly different computer-based tool: the central aim was to support students to master the course content and to provide the lecturer with continuous feedback about the students’ difficulties and deficits.
The aims of online questionnaires supporting teaching and learning of statistics are compared to aims of other computer-based and non-computerized methods and tools. Additionally, data from a first evaluation of the questionnaires is presented. In a first year psychology student’s statistics course (bachelor program), students were offered the possibility of filling in an online questionnaire every time a specific theme had been taught. Out of the 126 first year students there were 28 who answered the online questionnaires regularly and 12 answered them sometimes. Those who answered the online questionnaires assessed them as helpful for their understanding of the course’s content. The lecturer judged the online questionnaires as particular helpful for improving teaching and assessing performance deficits.
Introduction
In many undergraduate psychology programs, statistics courses are mandatory (e.g., American Psychological Association, 2007; British Psychological Society, 2012; German Psychological Society, 2005). At the same time, students often have negative attitudes or beliefs towards statistics (Ruggeri et al., 2008; Tremblay, Gardner, & Heipel, 2000). Thus, lecturers teaching statistics are faced with special challenges. They have to motivate students to study statistics, deal with performance extremes and support students’ learning (Conners, McCown, & Roskos-Ewoldsen, 1998). Following Conners et al. (1998) lecturers can adequately address these challenges by providing concrete learning content, clarifying the practical relevance of statistics and promoting active learning. For these purposes, face-to-face statistics courses are often supplemented by accompanying tutorial classes, (assessment) exercises and/or computer-based learning tools.
This report gives an overview of computer-based learning tools used in statistics education and their contribution to a better understanding of the learning content. Additionally, we introduce the use of consecutive online questionnaires as a new computer-based tool to improve learning and teaching statistics. We describe its implementation in a first year introductory course of statistics and compare its basic aims to those of other computer-based tools and classic non-computerized methods. Finally, we present the results from a first evaluation and address critical issues and further improvements.
Computer-based learning tools in statistics
Computer-based learning tools have been developed to offer students the possibility of actively practicing the learning content, reflecting on their learning processes – including deficits and improvements – and obtaining metacognitive knowledge about their learning, for example, self-regulation and thought processes (Ben-Zvi, 2000; Moore, 1997). It has been shown that the use of such tools can increase psychology students’ performance in statistics (Aberson, Berger, Healy, Kyle, & Romero, 2000; Bliwise, 2005; Britt, Sellinger, & Stillerman, 2002; Mitchell & Jolley, 1999) and that students judge such tools to be helpful and evaluate them positively (Neumann, Neumann, & Hood, 2011).
Nowadays, a huge variety of computer-based learning tools supporting the statistics education of psychology students exists: commercial software-based tutorials include ActivStats (Currall, Young, & Bowman, 1997), ConStatS (Cohen & Chechile, 1997), Authentic Statistics Stack (ASP; Lajoie, 1997), Statistik (Statistics) (Mittag & Stemann, 2004) and EMILeA-stat (Genschel, Gather, & Busch, 2002). These tools provide learning material for various topics in textual form, video clips or experimental simulations and include assessment exercises and performance feedback.
Furthermore, lecturers and students can draw on internet resources supporting statistics education (Tishkovskaya & Lancaster, 2012; West & Ogden, 1998). Applets that are tied to specific learning objectives illustrate concepts visually by letting students experiment with mathematical statements (see overview in Bush, Menzies, & Thorp, 2009; Mittag, 2002; or visit http://www.rossmanchance.com/applets/index.html). Also, free tutorials and learning repositories, combining supplementary course materials for statistics with interactive illustrations, data sets and assessment exercises, provide support. Tutorials can be obtained via http://stattrek.com/ or https://www.usablestats.com/tutorials.php, whereas two large and continually growing repositories are MERLOT and CAUSEweb (Everson & Gundlach, 2010).
However, material from these tools can usually not be modified or extended and therefore cannot be adapted to the specific needs of a given class. Moreover, although the assessment feedback for students is often quite detailed in these tools, a feedback for lecturers, for example, regarding frequency of tool use, students’ achievement and students’ evaluations of comprehensibility of the course, is usually not available. For these reasons, lecturers teaching statistics often employ individual learning platforms in their courses, enabling them to provide material they have created (or at least consciously selected) themselves and to choose between several feedback options implemented in the platforms. However, these options are usually predefined, only slightly adjustable and therefore restricted. Nevertheless, such blended learning configurations can fit well with specific needs and have been evaluated positively. Wieling and Hofman (2010) showed that the use of an online platform with videos, quizzes and feedback can increase student achievement. Neumann et al. (2011) demonstrated that the use of a learning environment providing lecture notes and multimedia presentations helped students to understand the course content.
In this report we introduce a new computer-based learning tool that has accompanied a statistics course for first year psychology students 1 and can be used solely or in combination with existing tools. It is a set of multiple consecutive online questionnaires 2 in which students reflect on the course content, work on assessment exercises followed by sample solutions, and give feedback concerning the lectures. In particular, the potential of a flexibly tailored, constant and mutual feedback between students and lecturers was exploited in the implementation, and considered especially the specific needs of the lecturer and students on that course.
The online questionnaires
After having completed a thematic unit in the course, the lecturer announced that a questionnaire about the theme would be available online for the next seven days and published the web address via email. The main aim of the online questionnaires was to support students to master the course content. To this end, the questionnaires promoted students’ reflection of their abilities and deficits, as well as their acquisition of knowledge.
Within the questionnaires students were advised to carefully reflect the course content taught in the previous face-to-face lectures, both the entire themes (e.g., probability distributions) as well as each concept of the theme (e.g., normal distribution, students’ t-distribution). They indicated how well they have been able to follow the lectures on a scale ranging from 1 (not at all) to 6 (very good). Then they stated in an open response format what had contributed to their understanding of the lectures and what problems they had encountered. Subsequently students rated how well they understood the specific concepts from 1 (not at all) to 6 (very good). Therefore, the authors listed the most important concepts presented in the previous lectures. By indicating how well they have been able to follow the lectures and how well they have understood the concepts, students differentiated between content they did understand and content they did not understand and thereby identified difficulties and deficits. Because reflection is a key component of learning, which leads to the construction of meaning from experience and a broader understanding of the learning content (Boud, Keogh, & Walker, 1985; Costa & Kallick, 2008; Mezirow, 1990), providing students with regular possibilities to review their learning is a valuable support.
Also, each questionnaire offered the opportunity to practice the course content and to receive performance feedback. Within statistics education, realistic applications that include assessment exercises and a subsequent constructive feedback are effective (Garfield & Ben-Zvi, 2007; Lovett & Greenhouse, 2000). Thus, in the second part of each questionnaire, students were asked to solve several knowledge based questions, using either a multiple choice format with one correct answer or an open response format with a predefined text area. Afterwards, sample solutions including stepwise explanations were presented. Again, this enabled students to identify possible deficits and to redirect their learning towards those deficits. Besides the transfer of learned content to real problems, students obtained a more objective feedback about their learning achievement than by indicating how well they “think” they understood a concept. From a didactic point of view another benefit can be added: highly relevant content was accentuated, which might help students to differentiate between major and less relevant concepts.
Another important aim of the online questionnaires was to provide the lecturer with a detailed feedback regarding the comprehensibility of the lecture and the students’ level of knowledge, enabling the lecturer to respond to students’ problems in the following lectures, for example, by explaining a concept again. Ultimately, such feedback can help lecturers to improve future lectures and instructional methods as well as their professional development (Beck, Livne, & Bear, 2005; Rolfe & McPherson, 1995). In this respect, it should be emphasized that improvements in teaching lead to better learning outcomes among students and to a higher competence and satisfaction among lecturers (Hellmann, Paus, & Jucks, 2014).
The questionnaires were created using the software package “Unipark” (Globalpark, 2007) and were accessible from any internet-supported device. It is important to note that students answered the questionnaires in a self-sufficient and independent way. Completing the questionnaires was voluntary and anonymous, and could be done at any convenient time and place within one week. Approximately three days later, the lecturer received a summary of the students’ responses.
Comparison with classic non-computerized methods
In order to examine if and how the online questionnaires improve the learning and teaching of statistics, a comparison with non-computerized methods, supporting students in their statistics education, seems promising. Two frequently used methods are accompanying tutorial classes (e.g., extra classes taught by senior students) and assessment exercises in courses (e.g., provision of worksheets or mock examinations by the lecturer).
While a detailed feedback for students and lecturers that is geared to their specific needs is possible in both methods (as in the online questionnaires), the flexibility for lecturers and students (a major advantage of the online questionnaires) is quite restricted. Content and implementation of both methods are largely dependent on the structure and progress of the main course (i.e., the lecture). Thus, an entirely flexible adaptation to changes in course contents, didactic approaches or focus -- for example, to respond to actual course requirements -- is in principle feasible, but is associated with a lot (more) work to appropriately prepare and coordinate the supplementary methods. In contrast an online questionnaire can be edited easily and independently at any time and place. Thus, an entirely flexible adaptation to changes can be done much more quickly and with little effort. Moreover, in both non-computerized methods, regular participation and physical attendance of students at the university at a certain time is usually required (except for exercises that can be done outside class).
Systematic comparison of accompanying methods and tools.
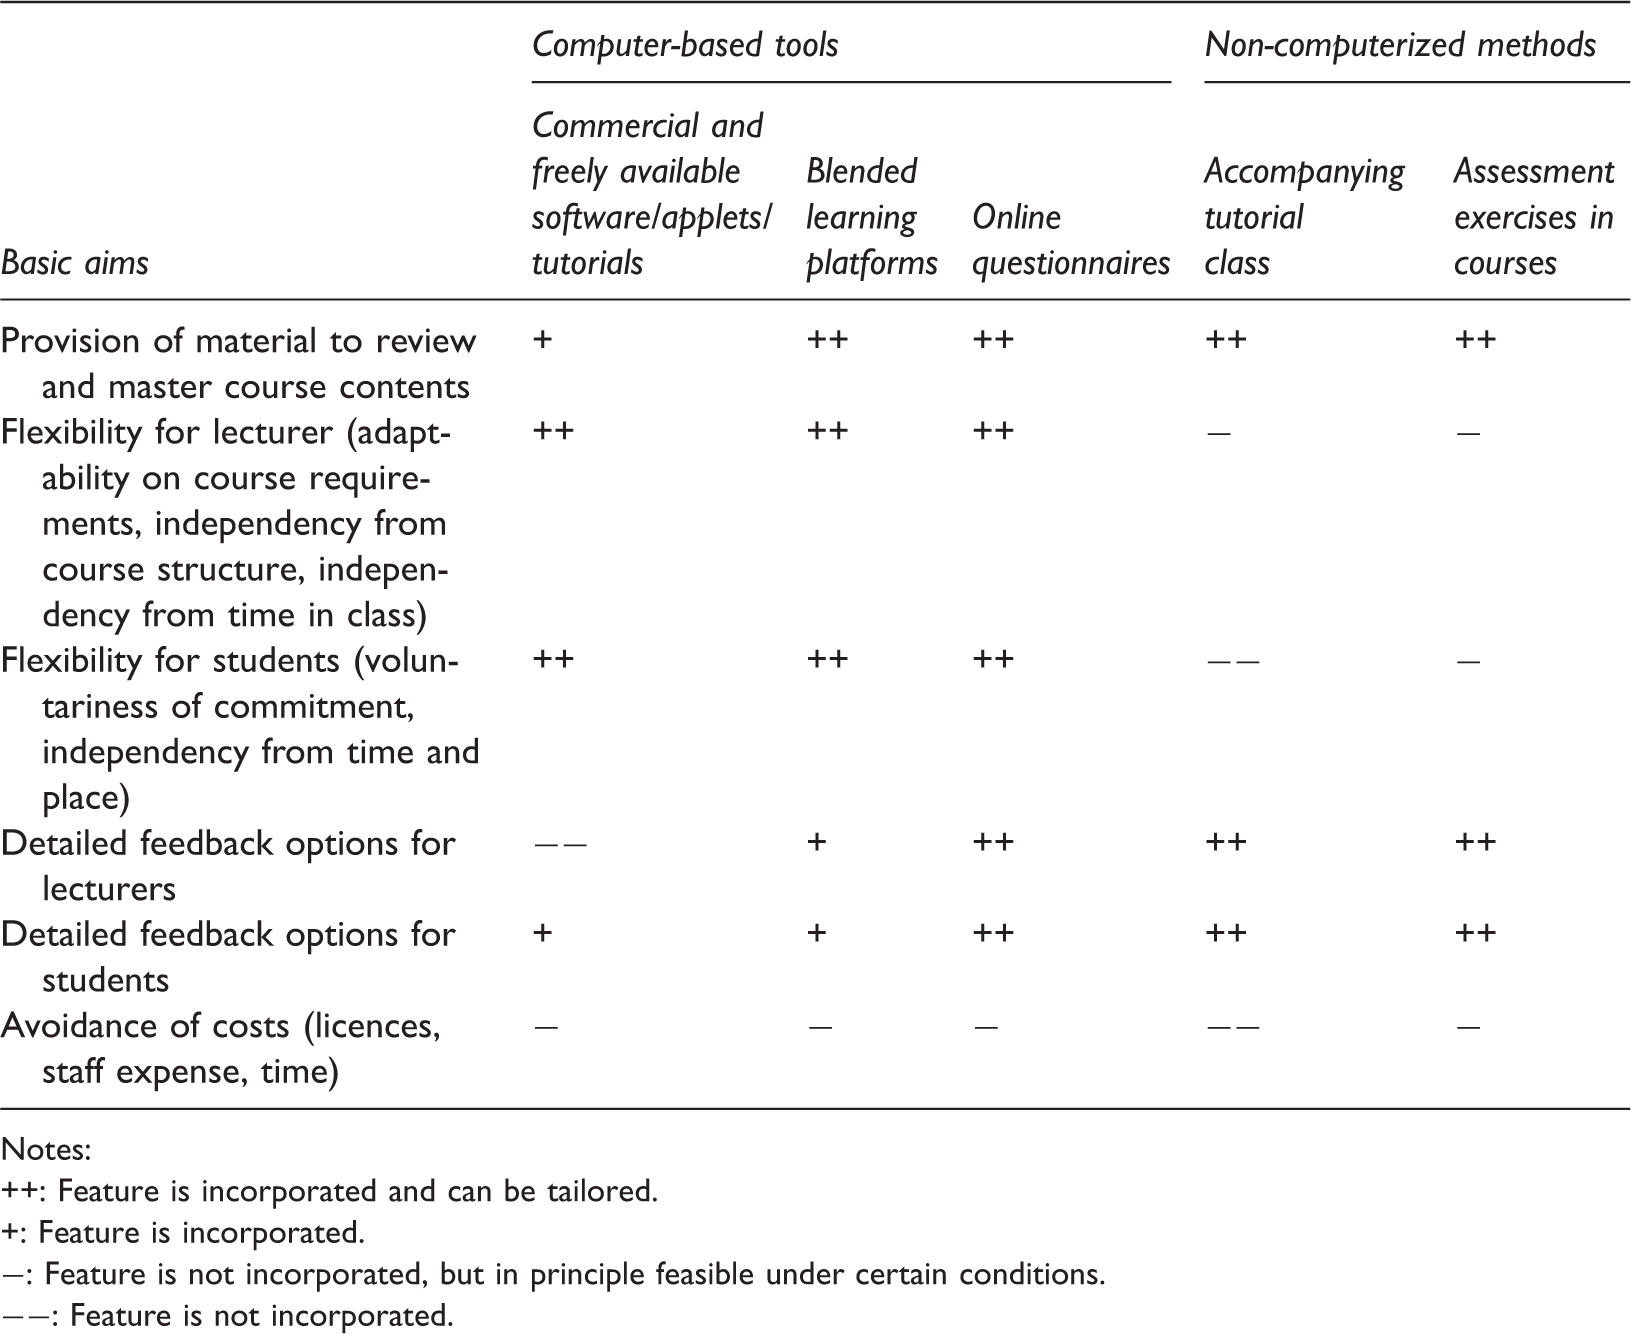
Notes:
Feature is incorporated and can be tailored.
Feature is incorporated.
Feature is not incorporated, but in principle feasible under certain conditions.
Feature is not incorporated.
Evaluation
Student participation in answering the online questionnaires in the 1st semester (Winter Term 2012) and in the 2nd semester (Summer Term 2013).
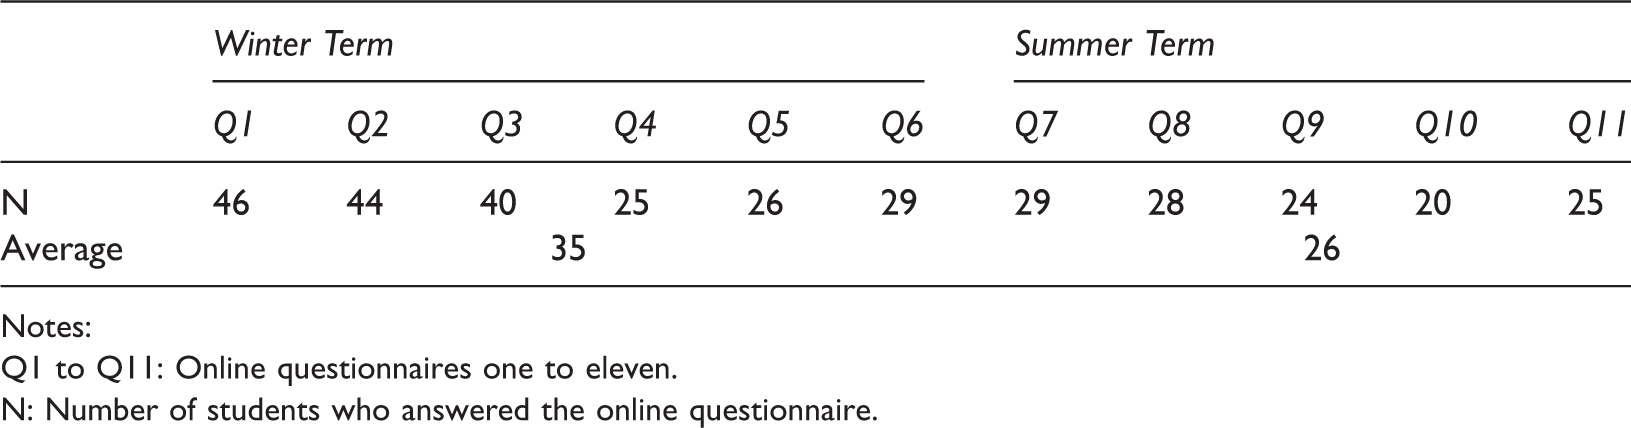
Notes:
Q1 to Q11: Online questionnaires one to eleven.
N: Number of students who answered the online questionnaire.
Since answering the online questionnaires was anonymous, there was no objective way of determining whether students participated constantly by filling in each online questionnaire, or whether students did not participate constantly, so that each online questionnaire was answered by different students. Thus, for an entire investigation of the usefulness of the online questionnaires, more data was required.
Hence, data from an ongoing longitudinal study was used for evaluation purposes. Having completed their first year, psychology students were asked to fill in a paper-and-pencil questionnaire to assess the frequency of answering the online questionnaires from 1 (never) to 6 (every time), the helpfulness of the online questionnaires from 1 (not helpful at all) to 6 (very helpful) and were asked to give an (optional) open feedback regarding the online questionnaires. Also, students were asked for information about demographics and academic success (measured by study grades and satisfaction with the studies). Answering the paper-and-pencil questionnaire was voluntary and anonymous.
The total number of students who answered the paper-and-pencil questionnaire was 81 (69 female, 12 male; Mage = 23.22, SD = 6.40). 3 Almost half of them (n = 40) stated that they answered the online questionnaires at least once and 28 out of these stated that they answered them regularly. Students who had answered at least one online questionnaire (n = 40) evaluated them as helpful (M = 4.50, SD = 1.06).
Pearson correlation coefficients between frequency of answering the online questionnaires and students’ satisfaction and performance.
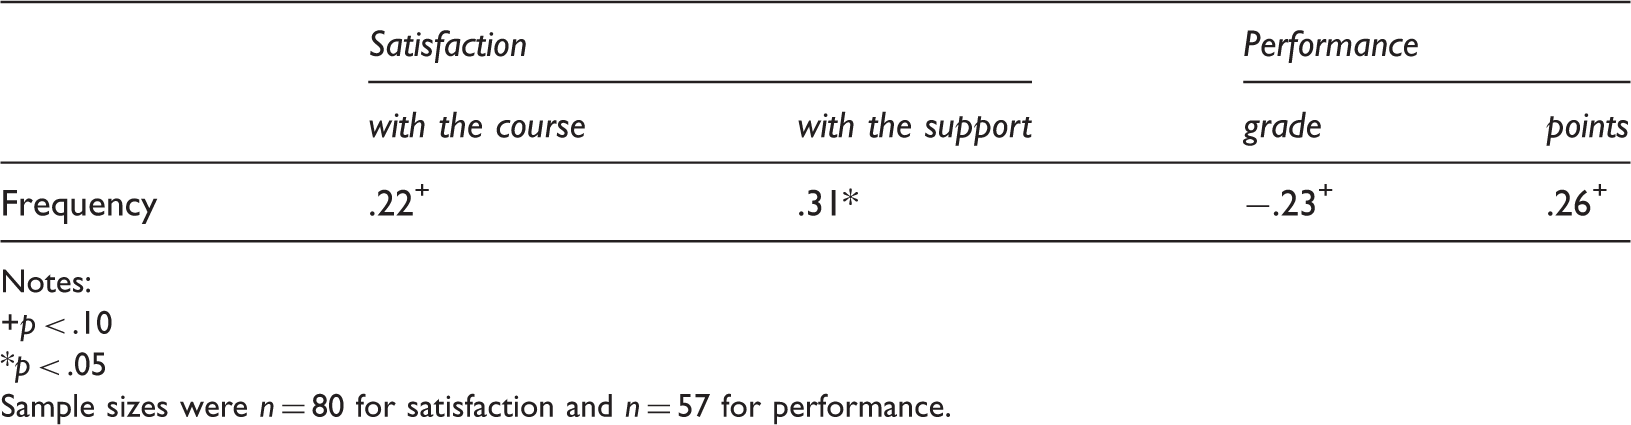
Notes:
p < .10
p < .05
Sample sizes were n = 80 for satisfaction and n = 57 for performance.
Of the respondents from the paper-and-pencil questionnaire 55 completed the open feedback regarding the online questionnaires. Positive (versus negative) feedback and suggestions for improvements were identified and counted. Overall, students referred to the questionnaires as “great help” or “very good support” (n = 29). Only a few students (n = 8) gave negative feedback and stated that, because of the high workload in other courses, they did not have time to answer the online questionnaires. Additionally, four students stated that an individual, personalized feedback would be helpful and a potential improvement of the questionnaires.
To complete the evaluation, we finally assessed the judgements of the lecturer. He particularly emphasized students’ responses in the online questionnaires regarding their understanding of the concepts as helpful for improvements of the current course but also for future courses. He reported that, because of the feedback from the online questionnaires, he provided additional learning material for some basic mathematical operations he had assumed to be known and quickly talked them over during class.
Conclusions
With regard to the comparison of the presented tools, the online questionnaires offer the highest flexibility for students and lecturers. The provision of material, and the type and detail of feedback, are easily adaptable to specific needs and students, and lecturers receive highly relevant information at relatively low costs. Thus, online questionnaires can be valuable to improve the learning and teaching of statistics, and should be seen as a new additional computer-based tool that can be used solely or in combination with other methods.
By establishing online questionnaires in the first year teaching of statistics we mainly pursued two goals: (1) the first aim was to implement a highly flexible method to support students’ learning of the course contents and, thus, to better prepare them for their exam and future studies. In this respect, we found that students answering the online questionnaires emphasized the helpfulness of the questionnaires for their learning progress. Thus, the online questionnaires can improve the understanding of course contents at least according to students’ self-reports; and (2) the second aim was to support the lecturer with useful feedback. In this respect, we found that the summary of students’ responses was helpful in several ways: the lecturer received feedback on whether he explained concepts clearly and on whether students understood the course contents and which difficulties and deficits they reported. Then he used this feedback in the preparation of subsequent lectures. Thus, the online questionnaires can improve lecturers teaching as well.
It should be emphasized that this evaluation provides particularly ecologically valid empirical evidence, because the results originate from a real teaching situation within the university. Nevertheless, we do not want to conceal threats of the internal validity of our results. First, besides the objective participation rates, the evaluation was carried out by self-reports, which can be socially distorted. However, it is unlikely that students hid their true attitudes, since the judgements contained positive as well as negative feedback. Second, although participation rates in the online questionnaires were satisfactory, bearing in mind the general workload of first year students and the expected number of students never answering the questionnaires, the results can be distorted by a self-selection bias. Perhaps particularly highly conscientious, motivated, interested or competent students answered the online questionnaires frequently, whereas students with low conscientiousness, motivation, interest or competencies, but a presumably high need for support, avoided the confrontation with the course content and rarely answered the online questionnaires. In addition, the frequency of answering the online questionnaires could be related to the more or less (both is conceivable) frequent usage of other forms of provided support (consultation hours, R-tutorial, learning center). Thus, the relationship between frequency of answering the online questionnaires and academic success would represent a phenomenon similar to the “Matthew effect”, in which outcomes (e.g., frequency of use, success) are achieved through target characteristics (e.g., competence of the students) and not through the given conditions (e.g., provided support) (Merton, 1968). Therefore, it is essential to examine and control potential confounding variables in future studies. Third, due to the correlative data in our evaluation, causal inferences were not admissible. For now, we found that students who had answered the online questionnaires more often tended to perform better in the final exam. However, this finding should be interpreted with caution. Correlation coefficients between the frequency of answering the online questionnaires and success in the statistics exam had a small to medium effect (Cohen, 1988), but were not significant. Additionally, in order to trace back students’ performance and satisfaction to the usage of online questionnaires, experimental studies (with randomized assignment to the conditions) are needed. However, strengthening the internal validity (by ensuring control and standardization) usually decreases the ecological validity of a study (where particularly realistic conditions are needed). Ideally, natural and experimental data should be combined to draw reliable inferences. Thus, the validity of the presented results could be strengthened by further evaluations of the online questionnaires through experimental studies and longitudinal examinations in which (potential) confounders will have to be considered.
Finally, future improvements of the online questionnaires might be the development of a smartphone-applet of the online questionnaires, announcing new questionnaires immediately and reminding students of questionnaires they have not yet completed. The implementation of a personalized performance feedback in addition to the sample solutions seems promising, because recent studies have shown advantages for students’ academic success through personalized feedback (Cretu, & Negovan, 2012; Gallien, & Oomen-Early, 2008).