
Abstract
Topic modelling and clustering algorithms in tandem with qualitative appraisal of their results are an ideal approach to analyse and map the field of (European) educational research exemplified by the contributions to ECER since 1998. The results provide insight into past and current foci and trends and may also inform or even enable future research projects. Since researchers have varying interests, competences in the area of natural language processing and differing research questions regarding such analyses, the results of this approach are provided in the free and interactive web-app EduTopics: ECER. It enables gathering (visual) information on the content of the contributions via topic modelling, EERA networks, authors and countries of affiliation and all intersections of those parameters. The app therefore enables the individual exploration, satisfaction of interest and subsequent answering of potential research questions. This article explains the methods applied in the app and highlights key results and visualisations. Additionally, implications regarding the database, future developments of the app and for the (European) educational research landscape in general are discussed.
Introduction
Large conferences provide a lens through which focal points of discussions, trends and developments of a research field may be ascertained. Afterall, they are the fulcrum of (interdisciplinary) exchange and feedback on completed or ongoing research projects. Conferences have been dabbed as ‘Marketplaces for Ideas’ (Hansen and Budtz Pedersen, 2018), where not only research is presented but also new paradigms and research (sub-)fields are discussed (Gross and Fleming, 2011). For the broad field of educational research, those discussions substantially occur at one of the major (European) conferences on educational research – the ‘European Conference on Educational Research’ (henceforth abbreviated as ECER) organised by the ‘European Educational Research Association’ (EERA). Since 1992 ECER was conducted 30 times in various European nations with ever increasing numbers of participants and contributions (see EERA, 2024a). In parallel with the increasing number of participants and contributions, the heterogeneity of presented research projects also increased substantially over the decades. This is clearly indicated by the development of the EERA networks, which are loosely connected groups of researchers investigating similar themes such as inclusive education or sustainability education (EERA, 2024b). While in 1998 there were a total of seven EERA networks, in 2024 there are now 34 networks with ‘34 – Research on Citizenship Education’ having just been accepted by the EERA council in 2023 and having its first conference in 2024 in Nicosia.
Three decades, 34 networks, tens of thousands of contributions and authors are representative of the vastness and heterogeneity of educational research. Analysing this data – kindly made available to us by EERA via the database of ECER abstracts (EERA, 2024c) – may provide insight into key themes and trends of educational research presented at ECER. Knowledge and findings regarding those themes, trends and potential clusters may not only foster intro- and retrospection of ECER as a whole, the single networks and authors, but also help individual authors and networks to see beyond their (sub-)disciplinary or network related boundaries and even open up new cooperations and new avenues of research. Unfortunately, the sheer size and heterogeneity leads to several obstacles for an efficient overview over the research themes, trends and clusters. On the one side of the coin, the size and heterogeneity presents a challenge, on the flipside though, it also offers the opportunity and potential to provide a perspective on a vast and varied research field and its innerworkings that has not been realised and achieved to date. This vision requires analyses beyond simple bibliographic approaches of counting authors, EERA networks, years and countries of affiliation by also determining the central themes of the contributions to ECER with methods developed in the context of natural language processing such as topic modelling (Blei et al., 2003; Blei and Lafferty, 2009; Griffiths and Steyvers, 2004). Clustering the contributions at the intersections of the bibliographic parameters and latent themes of the corpus enables the identification of trends in singular networks, focus topics for countries of affiliation or the most prolific authors for single topics. Furthermore, modern developments in statistical programming can be utilised to give all interested parties an interactive, direct and user-driven access to the results and findings, by not only publishing the findings in a research paper, but by integrating the results in an interactive web-app called EduTopics: ECER (see Christ et al., 2024a, 2025; URL for 2025 version: https://dipf-lis.shinyapps.io/EduTopicsECER/). This app enables users to freely look at the results, set individual foci and interpret them in their own measure. Its’ target audience are therefore researchers (in science studies) and organisers (convenors or national representatives at EERA) looking for (historic) information on thematic, country-related, network-related or person-related developments and cooperations at ECER, as well as (emerging) researchers who are interested in the shifting methodological and theoretical paradigms of (European) educational research. It enables users to gain insights into a representation of the (European) educational research landscape which was not available before and which requires the application of machine learning and other clustering methods without the need for competences in those methods to being with. It may therefore in turn lead to individual or organisational intro- and retrospection as well as inform future research and even enable new avenues for research.
In this article, we will first discuss the application of natural language processing and algorithmic clustering approaches in research. This is followed by a detailed explanation on the applied methods and procedures. Subsequently, we highlight certain sections and visualisations. Finally, the article will finish with limitations and implications for research and future similar app developments.
Meta-research and topic modelling
EduTopics as a meta-research-tool
EduTopics: ECER is an interactive meta-research tool visualising the results of natural language processing, clustering algorithms and quantitative approaches. Due to the nature of its database, it maps a representation of the (European) educational research field along shifting theoretical and methodological paradigms and research questions. It enables users to explore the development of trends regarding countries, authors, EERA networks and content-related themes, which may be used to identify discourses and structures in the broader field of educational research.
However, research into education stems from different national and cultural research traditions and thus also from different disciplinary understandings and a variety of theoretical and methodological approaches (Keiner, 2006; Knaupp et al., 2014). Hence, from the very beginning, the aim of ECER was to represent and bring together the diversity of research, to encourage collaboration among European educational researchers (Lindblad, 2015) and provide a forum to address global issues from a European perspective and European research and cultural traditions (Moos et al., 2015). This brought up the idea and goal of a ‘European Educational Research Space’ (Lawn, 2002). But studies on participants questioned this claim. Kenk (2003), for example, studied the three conferences at the turn of the millennium and discovered that participants from a few countries in Western and Northern Europe, especially from the United Kingdom, were significantly overrepresented. Keiner and Hofbauer (2014) returned to this and identified a continuing imbalance of the countries from which ECER participants came. As a platform for European educational research, it is crucial not only to analyse the research trends showcased at ECER, but also to reflect on who is contributing to the discourse and whether transnational collaborations are taking shape. This endeavour aligns with the call for the establishment of an ‘observatory’ dedicated to critically reflect European educational research (Lindblad, 2015). While collaboration in the form of co-authorships is increasingly evident in publication practices (Aman and Botte, 2017), transnational collaboration at educational conferences remains an underexplored area of study.
In accordance with the aforementioned ideas, the app – similar to large research syntheses and other meta research tools such as PsychTopics (ZPID, 2023) - offers cleaned, structured and aggregated information on the field, its content and relevant persons. Before EduTopics was made available, there was no way to for example identify author- or country-cooperations at ECER. There was also no information on thematic hot spots or trends. Therefore, EduTopics allows interested researchers with sufficient content and organisational knowledge on the various research themes and EERA networks to dig deep into the data and apply research perspectives and methods such as actor-network-theory regarding the author-cooperations or discourse analysis regarding the research themes (Benites-Lazaro et al., 2018; Brookes and McEnery, 2019; Hellsten and Leydesdorff, 2020; Jacobs and Tschötschel, 2019; Jo, 2019). It may even be used to approximate the research cultures inherent to the various research areas, (sub-)disciplines and topics by identifying its relevant documents and structuring elements such as authors, countries or EERA networks (Cetina, 1999; Gurevitch et al., 2018; Ioannidis, 2010). But it may also be used on an informational level to identify relevant authors – for the role of coauthors, speakers at other conferences or as discussants for panels or symposia. How the app is used lies entirely in the hand of the individuals and organisations, as in contrast to a normal paper on the same topic, it allows the users to filter the data and figures and interpret them themselves.
Topic modelling
The themes of ECER since 1998 were identified with topic modelling. This methods has been widely used before to analyse and visualise large literature corpora, for research syntheses, mappings of research fields or bibliographic analyses (Bittermann and Fischer, 2018; Blei et al., 2003; Blei and Lafferty, 2009; Christ et al., 2021, 2024b; Deleye et al., 2024; Griffiths and Steyvers, 2004; Heidenreich et al., 2019; Kee et al., 2019; Tran et al., 2024; Westerlund et al., 2018; Zhu et al., 2019). Topic modelling is a part of text mining/natural language processing, which are blanket terms for various methods for algorithmically and (pseudo-)automatically processing, analysing and categorising unstructured fuzzy text data (Gandomi and Haider, 2015; O’Mara-Eves et al., 2015; Silge and Robinson, 2017). One of the most important works on topic modelling was the seminal paper of Blei et al. (2003) on latent Dirichlet allocations (LDA), a probabilistic dimensionality – and therefore complexity – reduction technique for textual data. The core assumptions of LDA are:
(1) k different topics are covered by the documents in a corpus.
(2) Each document consists of a mixture of different topics.
(3) The topics are based on words frequently occurring (together).
(4) Each topic can be identified by the words occurring in the documents.
LDAs cluster corpora via two parallel clustering procedures: one clustering words occurring frequently together and one clustering documents containing these words. Across several hundreds to thousands of iterations, the clustering weights are optimised and the density within topics and the distance between topics is maximised. It results in two matrices which are utilised to describe the content of the corpus: a word-topic-matrix and a document-topic-matrix. The word-topic-matrix lists all words within the documents of the corpus with a word-topic-probability β assigned to each word for each topic. The word-topic-probability β represents the relevance for each word for each topic, that is, words indicative of a topic result in high β-values for the respective topic. The document-topic-matrix contains the probabilities of all documents for all topics with their respective document-topic-probabilities γ. Documents indicative for a topic are given higher γ-value. The final model and the single topics can then be analysed qualitatively to (a) determine whether the topics hold up to the scrutiny of the researcher’s expertise and (b) to determine the actual content of the individual topics. The qualitative assessment of the topics is based on its terms with high β-values and its documents with high γ-values. For example, a topic with the terms ‘teacher, education, university, higher, didactics, training’ may be assigned the title ‘Teacher Education and Training’.
One of the most relevant decisions in topic modelling is the initial decision on the number of topics k. In general, there is no true number of topics for any given corpus. Different goals or research questions require different levels of granularity for the modelling process, that is, a different number of topics k. In this regard, topic modelling shares similarities with other clustering techniques such as explorative factor analysis or k-means-clustering: a priori compromising between statistical fit via preliminary simulations and qualitative assessment of the micro- and macrostructures of the clusters as well as their interpretability (see Arun et al., 2010; Cao et al., 2009; Casella and George, 1992; Deveaud et al., 2014; Steyvers and Griffiths, 2007).
Applications of topic modelling for research syntheses and mappings of research fields
LDAs and subsequent refinements and developments similar to LDAs have been applied to literature corpora of various disciplines with differing goals over the last 20 years. One of the first and most highly regarded works was by Griffiths and Steyvers (2004), who applied the LDA-approach of Blei et al. (2003) to a corpus of abstracts of the Proceedings of the National Academy of Sciences of the United States (PNAS), which resulted in meaningful and good fitting topics in comparison to the disciplinary designation of the analysed papers, which was allocated by the authors when submitting papers to PNAS. They were also able to show, that analysing the results of topic modelling at intersections with various covariates (such as publication year) enabled the identification of further underlying clusters, structures and trends. Subsequently, topic modelling has been used in numerous research syntheses and mapping studies to identify topics, trends, desiderata and clusters within large literature corpora (Churchill and Singh, 2022; Jacobi et al., 2018; Kherwa and Bansal, 2020; Ramage et al., 2009; Vayansky and Kumar, 2020; Westerlund et al., 2018; Zhu et al., 2019). Topic modelling has also been applied in various educational research studies, such as those by Christ et al. (2024b, 2021), who mapped international research on digitalisation in cultural education, and by Heidenreich et al. (2019), who used the technique to identify trends and central topics in over 130,000 media reports on the ‘European Refugee Crisis’. Further examples and discussion of the method in educational research are included in Khine (2024).
Objective: enabling the interactive exploration of the corpus
Similar to the aforementioned papers, this project set out to map a large corpus of texts – the contributions to ECER from 1998 to 2024 – by identifying the central themes regarding the content of the contributions as well as clusters of themes with covariates such as year, author or EERA network. In contrast to the aforementioned papers though, this article’s goal is not to give a straightforward overview of topics, trends and clusters of the contributions to ECER. Instead, an app is presented that enables all users to individually explore and interpret the results of such a study. The study can build upon the similar but less comprehensive app PsychTopics, which identifies hot and cold topics in psychological research based on literature metadata (Bittermann and Rieger, 2022).
Methods
App development
The app was developed entirely in R by using the R-package Shiny (Chang et al., 2024). Shiny enables the building of interactive web apps with R and Python, of which the former coding language was used. All options available in ‘classical, offline’ R programming are also available for Shiny-Apps. This makes it easy to create interactive plots and tables with packages such as ggplot2 (Wickham, 2016), Plotly (Sievert, 2020) and Data.table (Barrett et al., 2024).
Databases
Abstract database: The initial corpus of all accepted contributions to the ECER conferences consisted of all N = 43,221 entries from 1998 to 2024, which were deemed of a sufficient quality during double-blinded peer-review processes in the respective years. It contained the fields title, year, method, expected outcome, references, detailed information (i.e. abstract), format, EERA network and contribution id, which were filled in by the respective authors of the contributions during the submission processes. All fields containing personal information such as (e-mail) addresses were deleted by default before we were handed the data. But not all fields were equally suited for analyses. For example, methods and expected outcome as required contribution information during the submission process were first introduced in 2008.
Author database: All author information was included in a separate author database including details of each authors’ affiliation, if entered during the submission process. Both databases were linked via the contribution id. It consisted of n = 30,138 authors after preprocessing, cleaning and clustering by author.
Preprocessing and cleaning
Preprocessing the databases
Preprocessing the contribution database: All content related text fields of the database – title, detailed information, method, expected outcome – were parsed into a single new variable called text (references were excluded due to inconsistent availability and citation styles and missing text fields were replaced with whitespace). Then irrelevant entries such as duplicates due to the involvement of more than one EERA network (joint sessions; n = 830), cancelled or withdrawn contributions (n = 233), general meetings and events (n = 1180) and faulty or empty database entries (n = 5206) were deleted. For the subsequent analyses only contributions with the following formats were kept: research workshops, paper, symposium paper or symposium session. Posters (n = 1916), round tables (n = 329), ignite talks (n = 170), videos (n = 55) and network meetings (n = 350) were excluded. Additionally, all contributions which contained too little or no information at all were also excluded, such as contributions with no text and contributions with a text length smaller than 200 characters (n = 174). Finally, all non-English texts (n = 29) were identified by computing the average probability for each language for each text in the database with the R packages textcat (Hornik et al., 2023) and fastText (Mouselimis, 2024) and subsequently excluded. All those steps resulted in a corpus of n = 32,398 relevant contributions for all subsequent analyses. For all included contributions, an URL-link was determined to link the contribution to the database of ECER abstracts (EERA, 2024c) via their contribution id.
Preprocessing the author database: At the first glance, it immediately became apparent, that a lot of work had to be done for the preprocessing of the author database. This was mainly due to the lack of a consistent author identifier across the years of ECER and due to different spellings of the author names. First, all punctuations and occurrences of ‘Dr’., ‘PhD’, ‘Habil’., ‘Prof’., ‘Professor’, ‘Miss’, ‘Mister’, ‘B.A’. etc. were deleted. Next, all spellings were normalised by (1) transforming the encoding into the standard Latin alphabet, that is, ‘é’, ‘è’, ‘ê’ was transformed to ‘e’ or ‘ø’ was transformed to ‘o’, (2) removing all single letters and spaces and (3) decapitalising all letters. Then, all entries in the database were grouped by this new string and the number of different spellings per author was counted. If there were different spellings for an author, the most recent spelling as submitting author was selected, based on the assumption that the data entry was done by the author in question. If there was no submission by the author, we selected the most frequent spelling. If there was no submission by the author and additionally a tie between different spellings, we selected the most recent spelling. The author database was then matched with the pre-processed database of contributions via the contribution id. Finally, the number of contributions in the cleaned contribution database were counted via the cleaned author identifier. This resulted in the cleaned author database with a total of n = 29,847 authors including their number of contributions to each ECER.
Preprocessing Countries of Affiliation: The initial goal for the author affiliations was the identification and clustering of affiliated institutes. Due to the large heterogeneity of spellings for the same institutions, this venture was abandoned in favour of identifying the countries of affiliation of each author, who submitted any affiliation information. The initial, raw information on the countries of affiliation was extracted from the author database. With a two-step approach, the countries within the affiliation information were identified: First, a vector containing all countries was matched with the affiliation variable. All affiliations with no matches with the country vector were then matched with a city vector of the R-package maps (Becker et al., 2023) to determine the missing countries of affiliation. All cities which resulted in conflicting matches with the list of cities from maps were handled manually. It was not possible to assign a country of affiliation to all authors, as a substantial amount of affiliation information either was empty or contained neither countries nor cities, resulting in a substantial amount of missing countries of affiliation with 11.6%.
Cleaning the texts of the contributions
After the preprocessing step, the text variable was prepared for the subsequent topic modelling approach. This started by removing export problems like HTML-fragments such as <p> (for paragraph), <br> (for linebreak) or <li> (for list element) and special characters like bullet points, quotation marks and brackets including their content. Then, all numbers were deleted and all special characters like α, β or γ were substituted with their names, that is, alpha, beta or gamma. Next, all words without any relevance to the content of the documents – so called stop words – included in the English stop word list from the R-package tidytext (Silge and Robinson, 2016) were deleted, which mainly consist of binding words such as ‘and’, ‘or’, ‘is’, ‘it’, etc. The list of stop words was enriched by the list of research specific stop words from Christ et al. (2024b, 2021). Additionally, all words indicating countries and languages were deleted as well to prevent country or language specific topics during the topic modelling approach. Finally, all words were reduced to their word stems via the stemming function of the R-package SnowballC (Bouchet-Valat, 2023). The stemming of words was an essential step for the subsequent application of topic modelling, to prevent words indicating the same topics to be regarded as separate entities by the algorithms.
Bibliographic analyses
The bibliographic analyses of the database entries consisted of counting the number of contributions grouped by the bibliographic parameters and their intersections (for previous analyses of country-specific participation to ECER, see Röschlein and Schindler, 2023). Therefore, we counted the number of (1) contributions per year, (2) per EERA network, (3) per author and (4) per country of affiliation as well as the intersection of all permutations of those four parameters. When counting the countries of affiliations, we counted the country of the contribution not of the authors: for example, if a contribution had five Swedish authors and two Finnish authors, it was counted as Swedish and Finnish only once.
Topic modelling the Corpus
Determining the number of topics k = 50: The first decision regarding a range for the number of topics k was determined by our aim to map the contributions to ECER in regard to broad research topics with a maximum of k = 80 topics. Secondly, the lower limit of k was set to be at least as high as the number of EERA networks of k = 37 (including no longer active networks). For the range of k ∈ [37; 80], Gibbs sampling as described by Steyvers and Griffiths (2007) with the measures of Cao et al. (2009), Arun et al. (2010), Deveaud et al. (2014) and Griffiths and Steyvers (2004) as well as analyses of perplexity (De Waal and Barnard, 2008) and coherence (Mimno et al., 2011; Newman et al., 2010) were applied to identify well-fitting choices for k. Topic models with good statistical fits were then extracted and qualitatively assessed to determine the content of the topics. The qualitative assessment followed the procedure laid out above in ‘Topic Modelling’: The broad content of each topic was determined by analysing its indicative terms and documents. The assessed topic models with differing numbers of topics k were then compared to determine the number of topics k which best compromised on (a) being small enough to catch broad research topics, (b) resulting in distinct topics without large intersections of themes and (c) being large enough to identify nuances of the investigated themes in the corpus which would have remained obscure with smaller numbers for k. This process led to the decision to model the corpus with k = 50 topics.
Assessing the topics: The final k = 50 topics were then subjected to qualitative assessment to determine their content. For this, the top n = 25 words by their word-topic-probability β and top n = 50 documents by their document-topic-probability γ were selected for each topic and analysed to determine the content of each topic.
Aggregating document-topic-probabilities γ: Additionally, the topic modelling results were aggregated over years, EERA networks, authors and countries of affiliation similar to previous applications of topic modelling for large literature corpora (Christ et al., 2021, 2024b; Griffiths and Steyvers, 2004; Heidenreich et al., 2019; Steyvers and Griffiths, 2007): The documents were grouped by the aggregation covariate – for example year – and topics (years × topics resulted in 26 conferences × 50 topics = 1300 groups). Then for each grouping, the mean document-topic-probability μ(γ) for each topic including its standard error was computed.
Applied Cluster- and Visualisation Methods
Most of the visualisation and clustering techniques utilised in the app are common scientific practice and require no further explanation. This includes simple histograms, scatterplots or pie charts. In contrast, graph drawings as a visualisation technique are not as common and needs some explanation:
Graphs are used to show relations between datapoints by splitting the data and its relations into nodes and edges. Nodes are the data objects such as EERA networks, authors or topics. The size of the nodes is determined by the number of contributions associated with the EERA network, author or topic. The edges represent the relations between the nodes for example cooperations between networks or authors or similarities between topics based on their shared words, which is represented by the thickness in the drawings (see the Sections EERA Networks, Authors and Topic Modelling Results). The visual structure of the graph is determined by the applied algorithm. The app utilises the Fruchtermann-Reingold-force-directed-graph-approach (FR, Fruchterman and Reingold, 1991) as it is widely used, intuitively understood, robust and provides clear visualisations (Huang, 2024; Kobourov, 2012; Stone, 2022). In the FR approach each node is assigned a negative electrical charge and each edge a mechanical attractive spring-force based on Hooke’s Law between the two connected nodes. A physical simulation then positions the nodes with strong relations close to each other, as the spring-like force pulls them together stronger than the negative electrical charge repels them from each other. Subsequently, nodes with weak or no relations are pushed further away from each other and nodes with many strong relations to other nodes are therefore pushed to the centre of the graph, the nodes with only few and weak relations are pushed to the periphery of the drawing.
Presenting the App EduTopics: ECER
The development finally resulted in the app EduTopics: ECER, which entails a range of visualisations and figures (see Appendix 1 for a full list of all sections and visualisations). As those are too many results to be presented in a single article, this section will first explain the interactivity features of the figures and tables and subsequently highlight some examples.
Interactivity features for figures and tables
All figures and tables are provided with interactive features, which are listed for each specific (sub-)sections in Appendix 1. Across all (sub-)sections, each datapoint in each figure – scatterplots, histograms, graphs etc. – is labelled, which can be displayed by hovering over or clicking the datapoints (see displayed label in Figure 1). It is also possible to zoom in and out for each figure except for pie charts, to drag the figures, to select datapoints via box- or lasso-selections and to drag the minimum and maximum of coordinate axes (to limit the displayed part of the figure). All figures containing grouping variables additionally have the feature of selecting the groups to be displayed by either clicking on the group in the figure’s legend to remove it from the figure or by double-clicking on a group to remove all other groups from the figure. Especially useful for all users interested to use the figures in their own research, each figure with the current selections and manipulations can be downloaded as a PNG-image with a click on the camera-button on the top right corner of the respective figure.
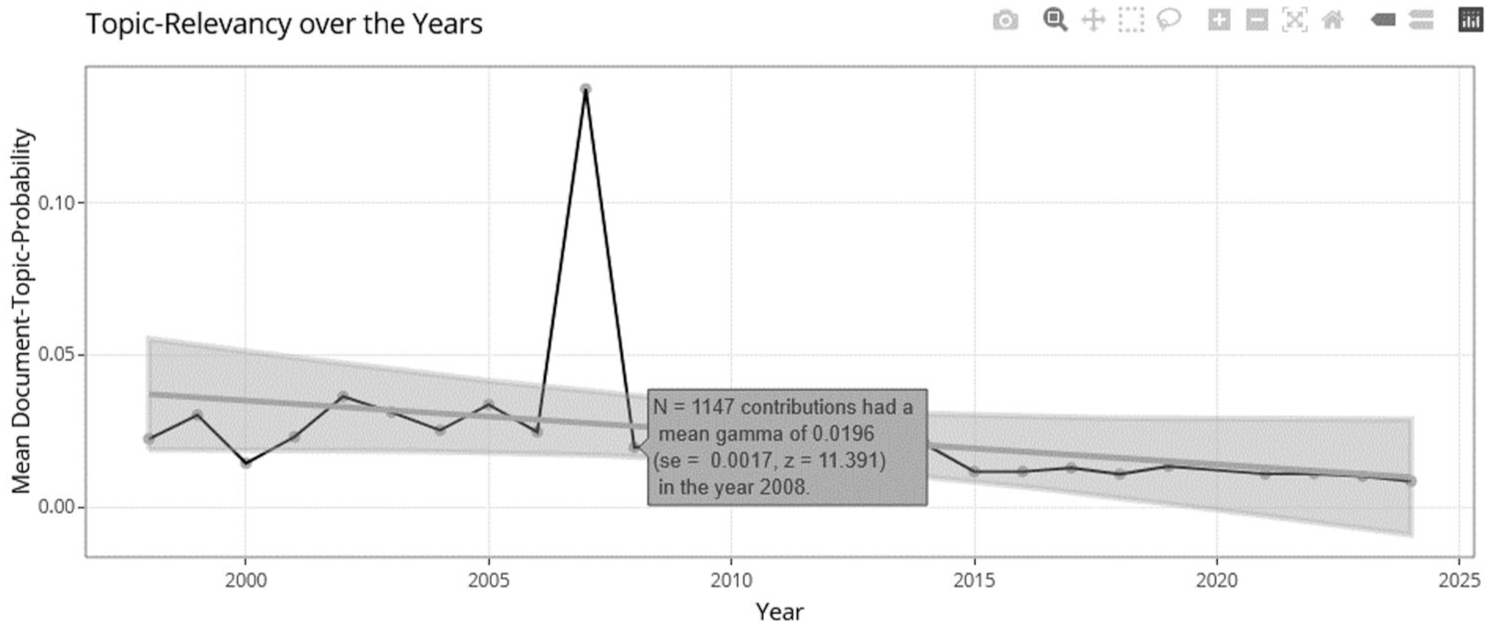
Example for interactive labels when hovering over a datapoint in a scatterplot on the topic-relevancy over the years for the topic ‘General Educational Research’. Shortcuts on the top right from left to right: Download as PNG, Zoom, Pan/Drag, Box Select, Lasso Select, Zoom-In, Zoom-Out, Autoscale Axis and Reset Axis.
All tables in the app are sortable via arrows in the column headings and searchable via a search field at the top of the table. In addition, the tables in the section ‘Explore the Corpus’ are also downloadable as clipboard-copies, CSV, XLSX or PDF-files.
Showcasing examples
EERA networks
Results by EERA network
In this section, results for individual EERA networks can be displayed such as the relative share of contributions affiliated with the selected network among all contributions to ECER from 1998 to 2024 (see EduTopics >> Individual Networks) or the most relevant topics for the contributions affiliated with the selected network (see Figure 2). The interconnectedness of EERA networks can also be explored in this section via graph representations (see EduTopics >> Network-Cooperations).
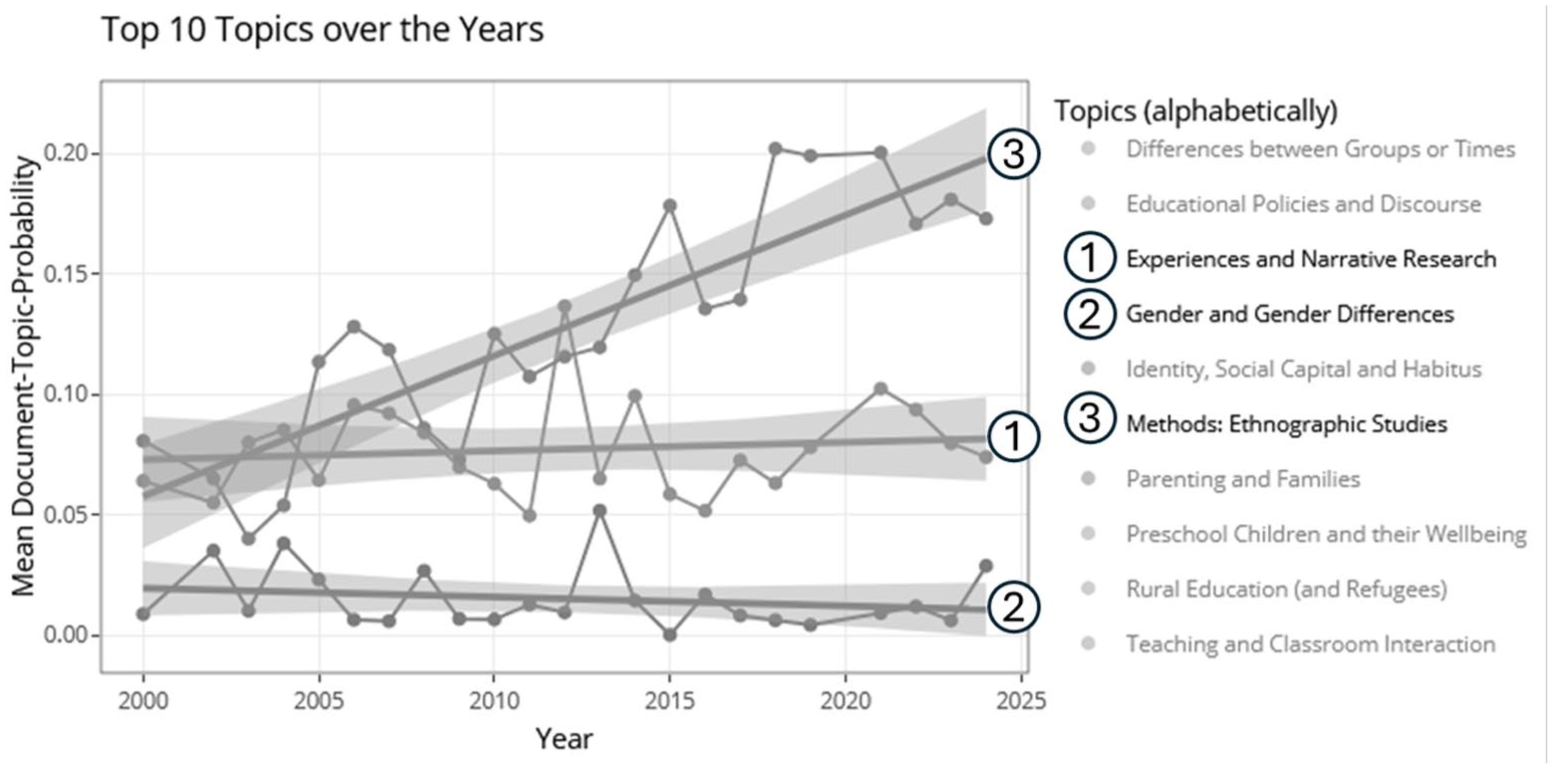
Example of the grouped scatterplots for the top 10 most relevant topics for network ‘19 – Ethnography’ with a selection on the three topics ‘Methods: Ethnographic Studies’, ‘Experiences and Narrative Research’ and ‘Gender and Gender Differences’.
Authors
For all n = 3338 authors who have at least contributed n = 5 times to ECER from 1998 to 2024 (from the total of n = 29,847 authors), author specific results can be displayed with a click on a button in a sortable and filterable table. Those results include – but are not limited to – the EERA network affiliation, the top 10 topics of the author’s work or the Level 2 author cooperation graph (see Figure 3).
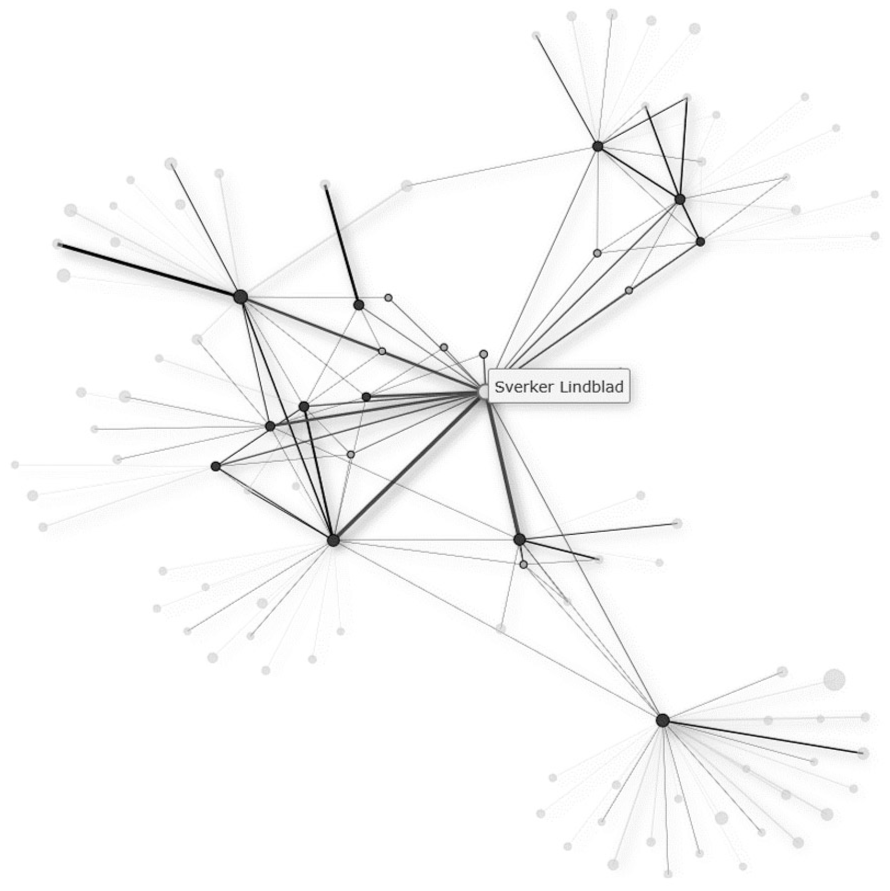
Level 2 author cooperation graph for Sverker Lindblad (other author labels hidden). The nodes represent all authors who cooperated directly with Sverker Lindblad (Level 1) or cooperated with his cooperating authors (Level 2). The edges represent the number of cooperations. The direct cooperations are highlighted by clicking on an author’s node, as is the case per default for the selected author.
Countries of affiliation
For all n = 73 countries of affiliation with at least 10 contributions to ECER from 1998 to 2024, results aggregated on a country level – in this example for Iceland – can be displayed as well such as the relative share of contributions of the country to ECER or the mean document-topic-probability μ(γ) of the contributions of the selected country for selected topics (Figure 4). Countries with less than 10 contributions were not selected for the detailed visualisations due to considerations of statistical power.
Development of the mean document-topic-probability μ(γ) for the topic ‘Inclusive and Special Needs Education’ across all contributions from Iceland from 2004 to 2024.
Topic modelling results
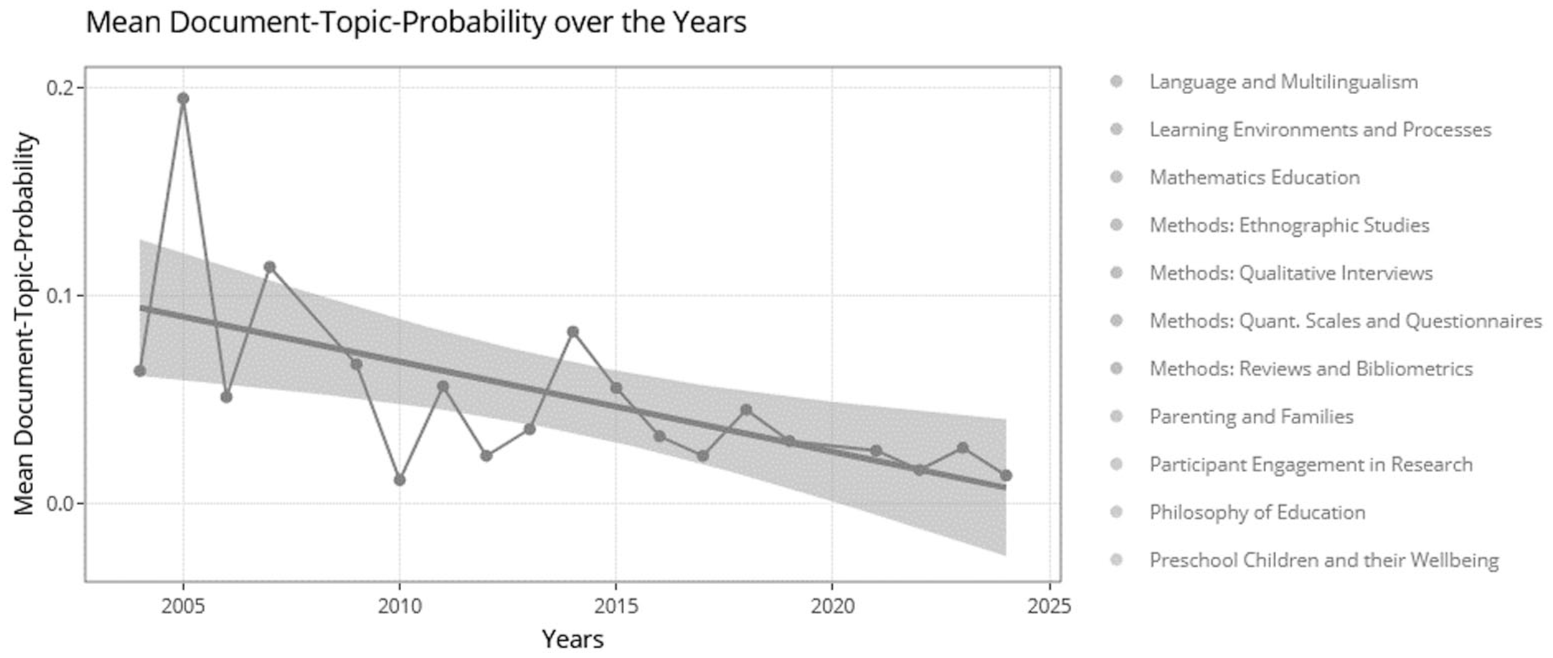
The results of individual topics can be displayed by selecting the topic in a filterable and sortable table. For the selection of the topic ‘Language und Multilingualism’, an example on the development of the mean document-topic-probability μ(γ) from 1998 to 2024 including a fitted linear regression and a funnel plot for the 95% confidence interval can be seen in Figure 5. Additionally, users can get information on the top 25 words by their word-topic probability β (Figure 6), the top 50 documents by their document-topic-probability γ (Figure 7) and the top 50 authors by their weighted topic relevancy nAuthor * μ(γ)’Language and Multilingualism’ (Figure 8) for each topic.
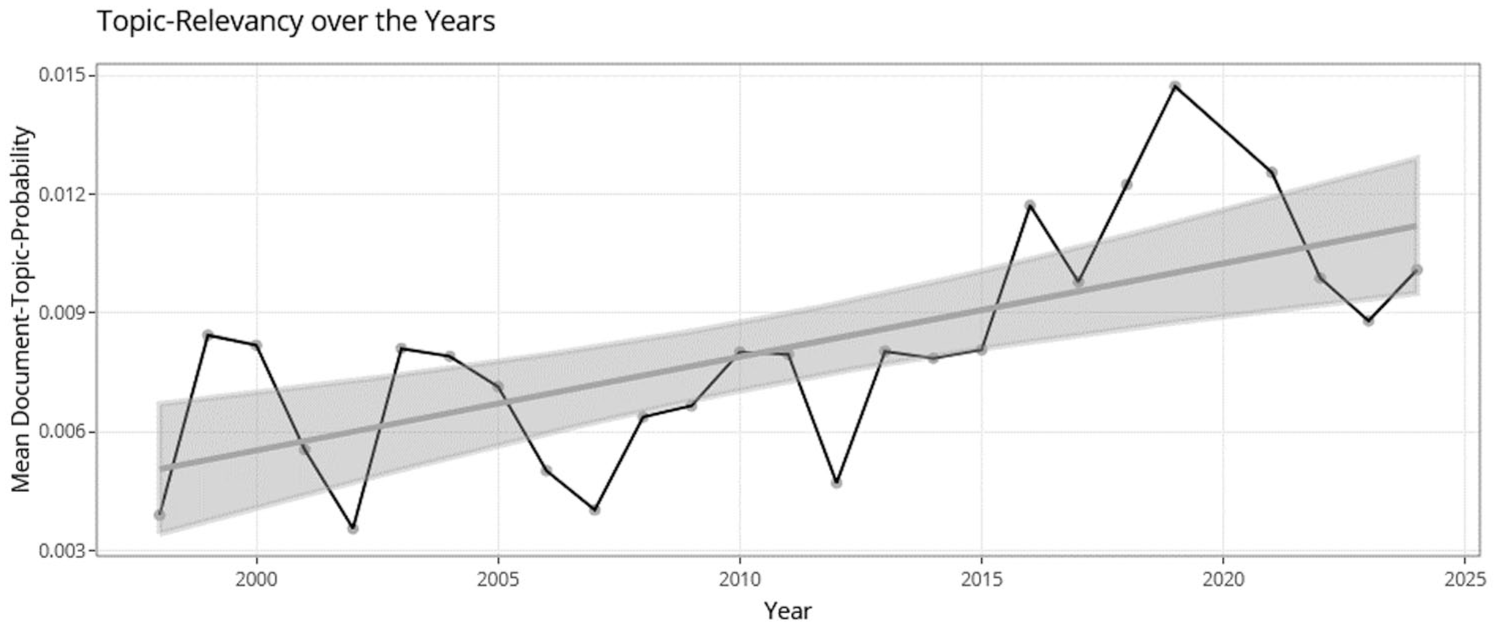
Development of the mean document-topic-probability μ(γ) of the topic ‘Language and Multilingualism’ from 1998 to 2024 including a fitted linear regression line and a funnel plot for the 95% confidence interval.
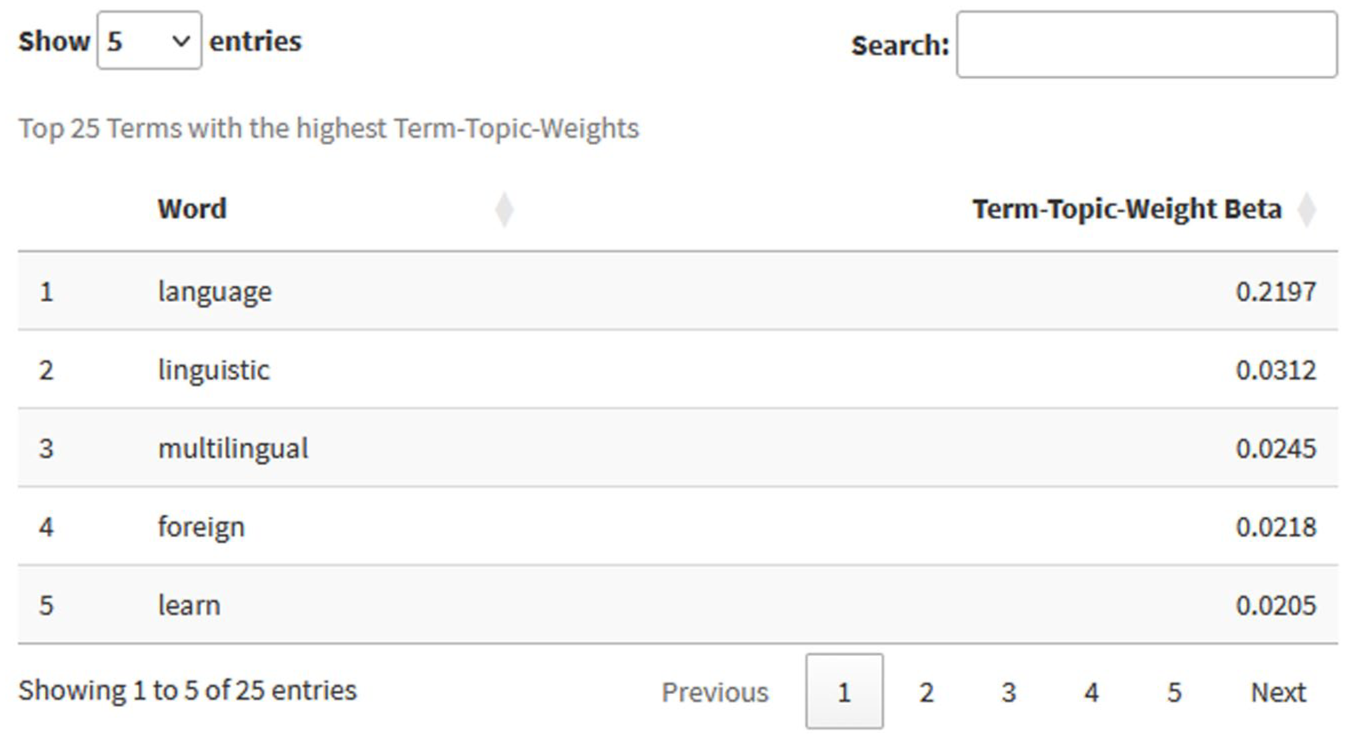
Table for the top 25 words by their word-topic-probability β for the topic ‘Language and Multilingualism’.
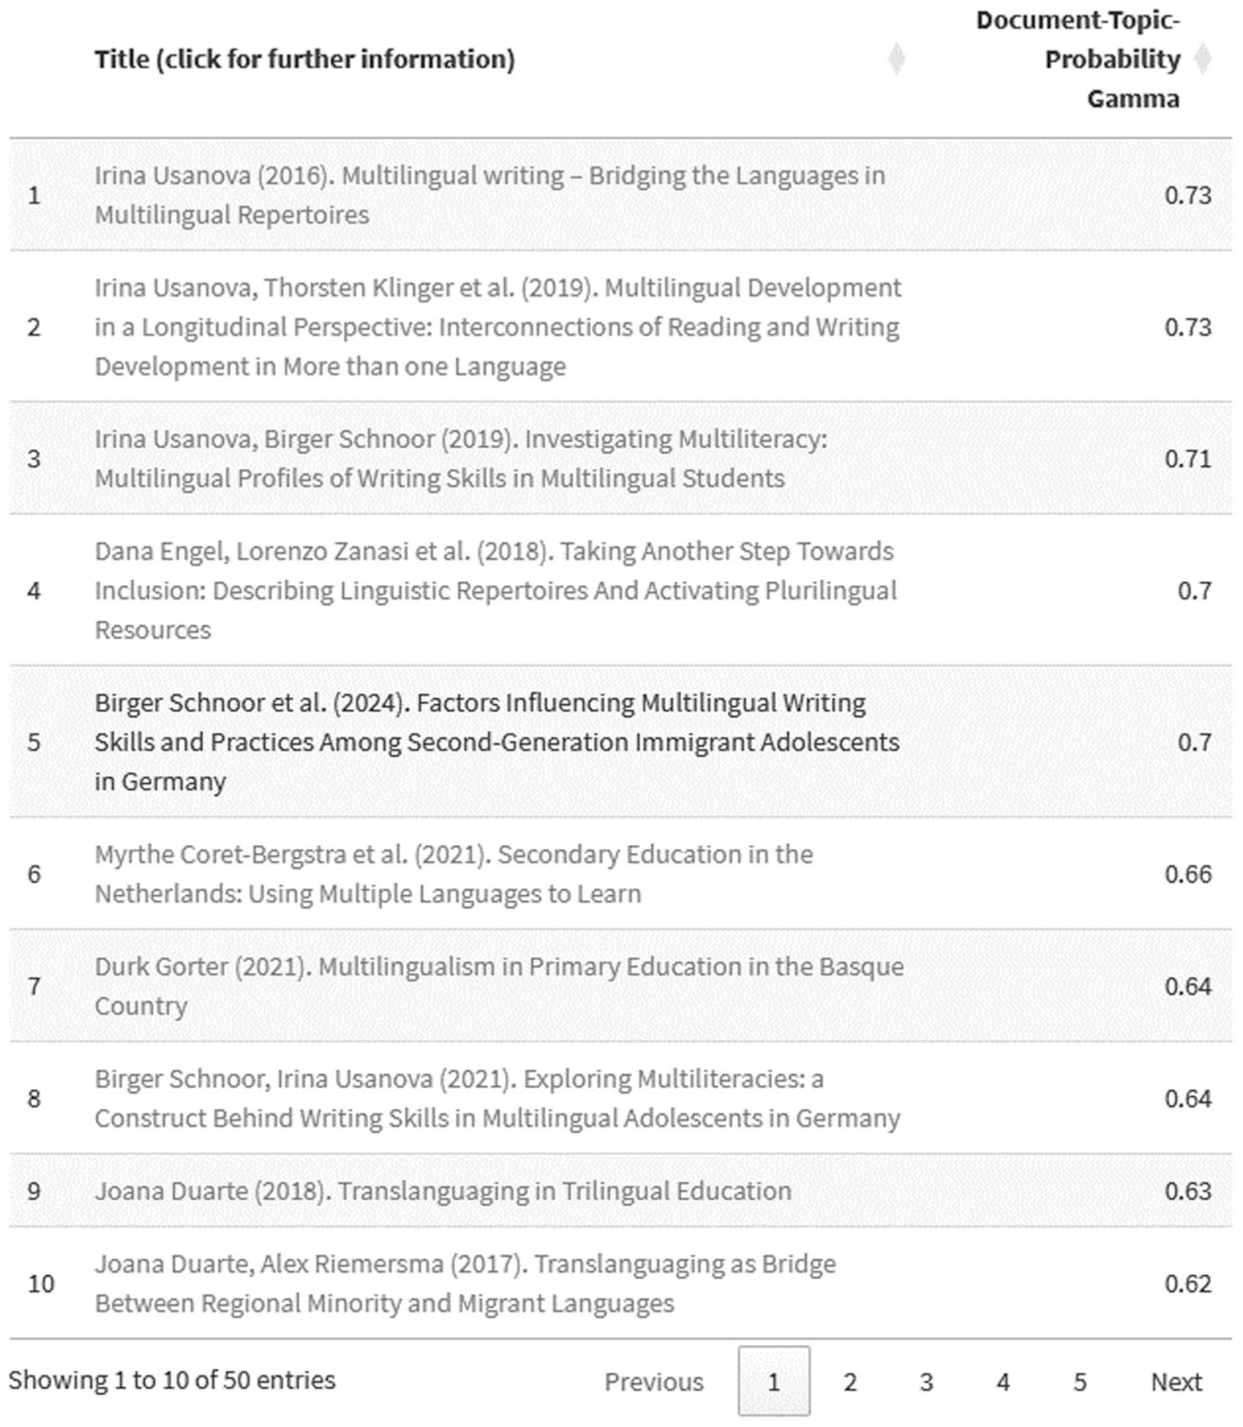
Table for the top 50 documents by their document-topic-probability γ for the topic ‘Language and Multilingualism’.
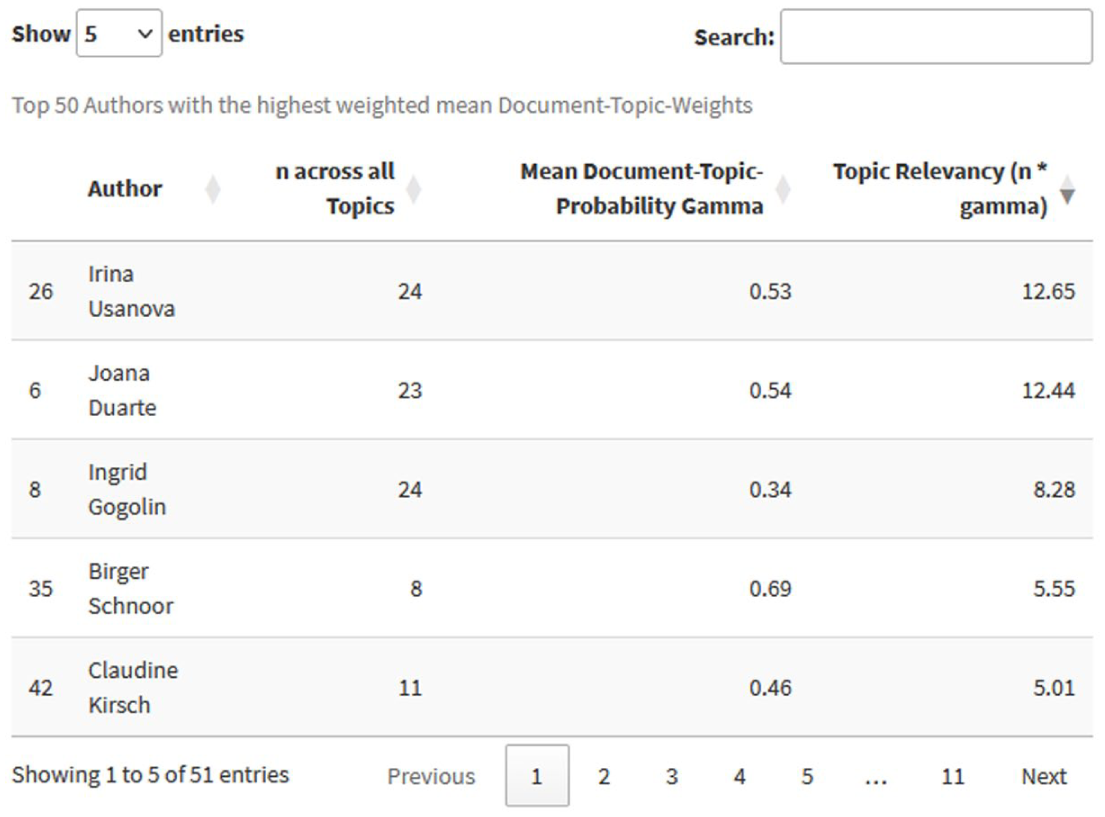
Table for the top 50 authors by their weighted author-topic relevancy for the topic ‘Language and Multilingualism’.
Explore the corpus
Build your own corpus
In this section, users can select a network, a topic and a specific timeframe to create a sample from the corpus. The sample corpus can be downloaded with a click on the chosen file format at the top left corner of the output table (Figure 9).
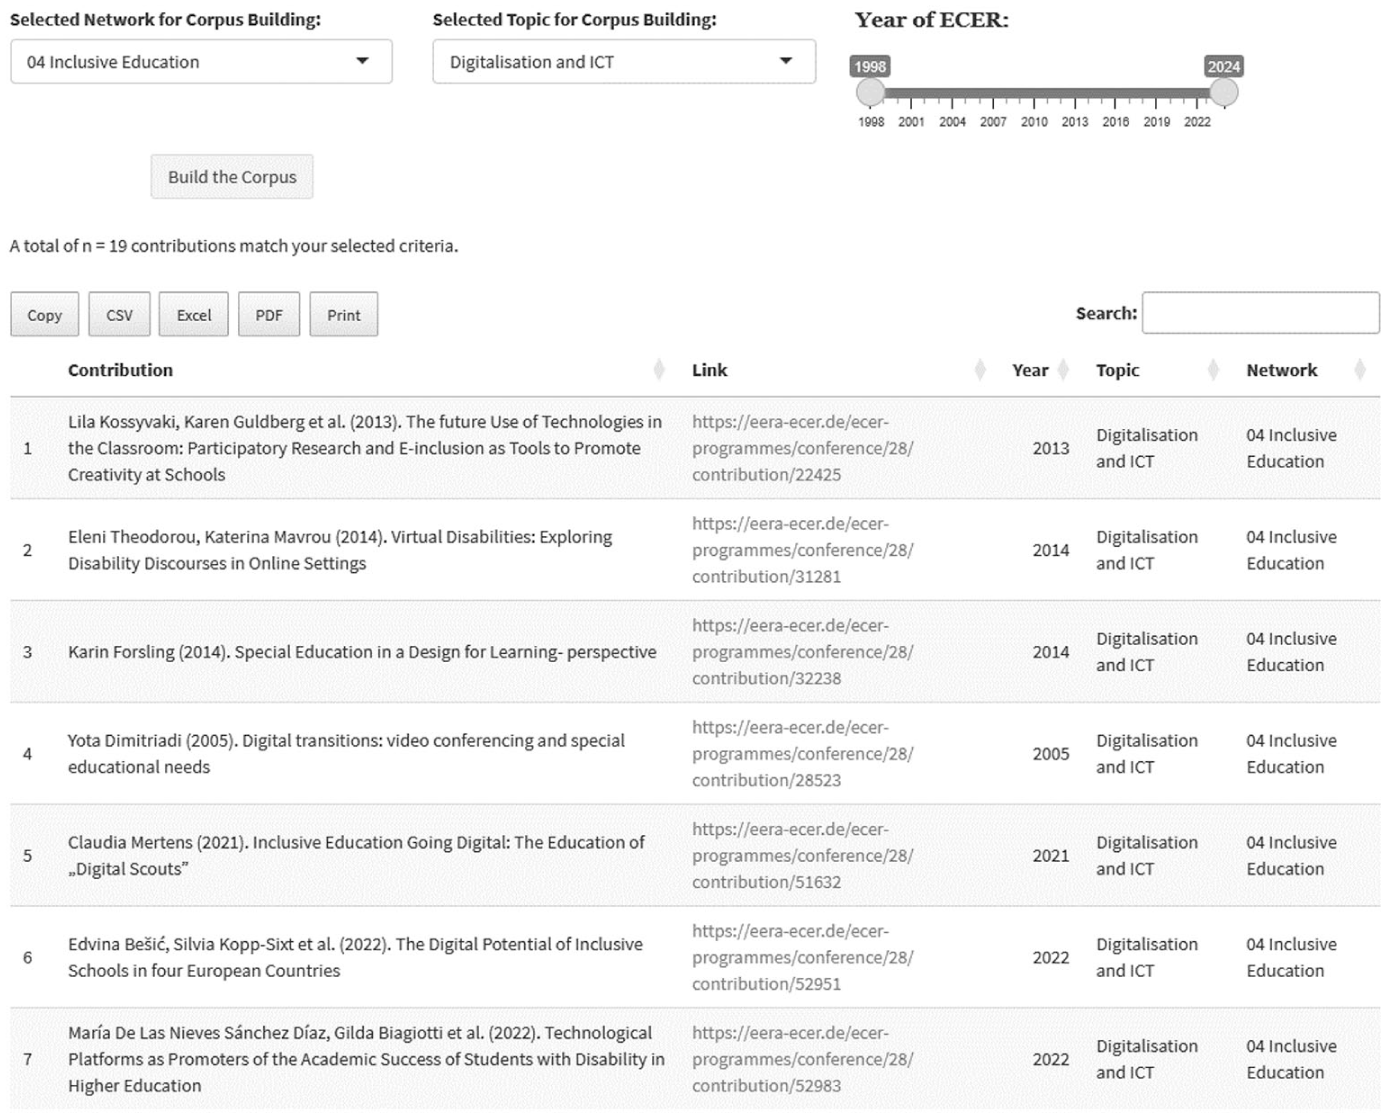
Example for the export-function for contributions from the EERA network ’04 - Inclusive Education’ on the topic ‘Digitalisation and ICT’ from 1998 to 2024. Buttons for export and download are at the top left of the resulting table.
Map your own text
The feature enables users to enter any text to be analysed via the posterior distribution of the topic model, that is, the results of the topic model can be utilised to determine the text’s document-topic-probabilities γ for the k = 50 topics of the model presented in this article. For the example below, we selected the online description of the EERA network ‘1 – Professional Learning and Development’ (see top of Figure 10, EERA, 2024d) to be mapped. Unsurprisingly, this mapping resulted in a high document-topic-probability γ for the topic ‘Professional Development and Learning’ (Figure 10) and the EERA network ‘1 – Professional Development and Learning’ (Figure 11).
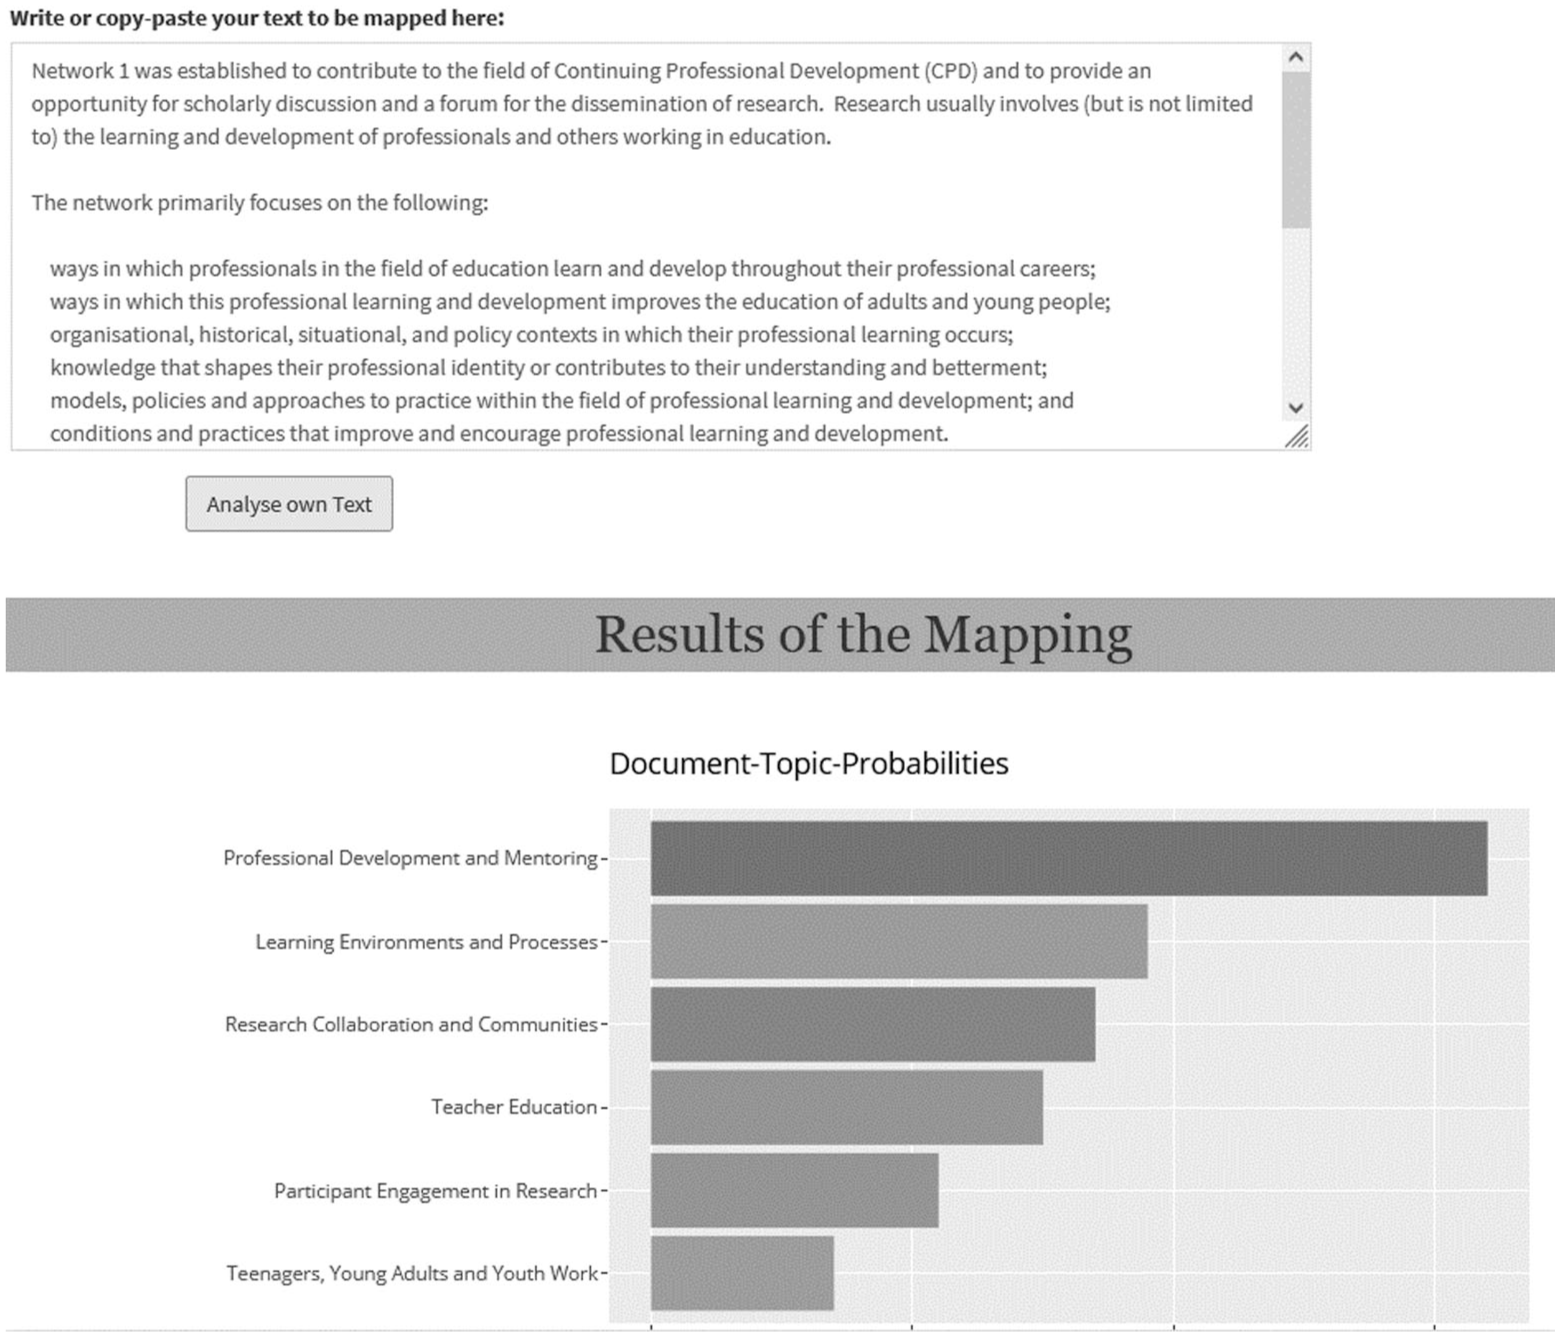
Top: Text field filled with the text to be mapped by the posterior of the topic model. Below: Significant document-topic-probabilities γ of the topic modelling of the entered text.
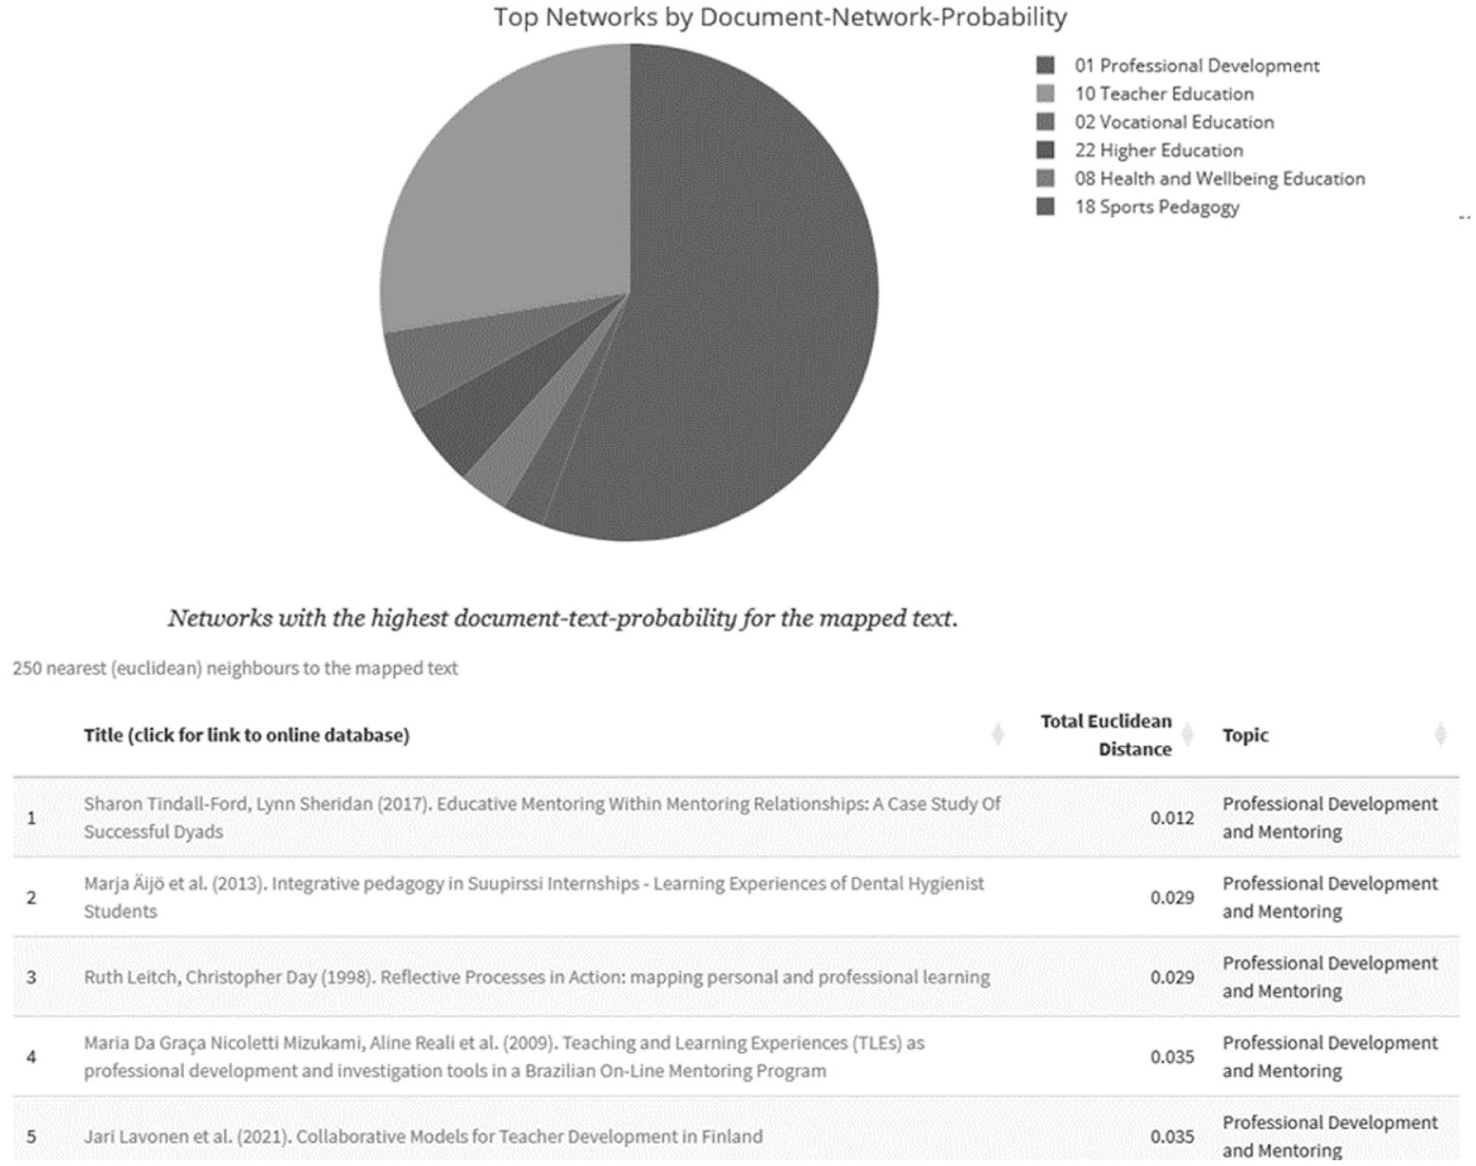
Top: Most likely EERA networks relevant to the entered text. Bottom: table of the top 250 contributions closest to the mapped text based on the Euclidean distance between the mapped text’s document-topic-probabilities γ and all contributions γ-values.
Additionally, the top 250 most similar contributions based on the Euclidean distance between the entered text’s document-topic-probabilities γ and the contributions to ECER are displayed as well (Figure 11).
Discussion
EduTopics: ECER provides information on bibliographic and content-related parameters of over 30,000 contributions from 1998 to 2024. It also enables the individual exploration of the corpus of contributions to ECER to any interested user across various different parameters. It may enable intro- and retrospection of individuals and structures such as the various EERA networks or EERA as a whole. The app is an ongoing development, therefore updates to this app are not only expected but already planned, at least for the year of 2025. This update will include next year’s contributions as well as additional functions which were already in work before ECER 2024 and functions which were inspired by discussions and feedback during the presentation of this app at ECER 2024 in Nicosia, other presentations between both ECERs and the valuable feedback by the reviewers of this article.
Limitation and implications
As is the case for every research project, several limitations and implications can also be identified for this app and its underlying analyses. Limitations and implications can be discerned for the database of ECER contributions, for the development of this and similar apps and for educational research in general.
Implications regarding the database
While analysing the corpus several challenges became immediately apparent. One of the biggest challenges was the lack of uniformity of the database entries over the years. Starting from 2008, contributors were required to structure their contributions with fields for detailed information, methods and outcomes, which was not necessary before. It was therefore not possible – as we initially planned – to run several topic models: one for the theoretically and content focussed detailed information and one for the methods and outcomes sections. This would have enabled the identification of methodological paradigms, which could have been intersected and aggregated across the various bibliographic covariates. Even with the change from ‘classical’ to structured abstracts, a quick glance showed a lack of control or quality in the methods and outcomes sections, with some contributions either providing no information or only useless information.
Additionally, the addition of unambiguous identifiers for authors and countries of affiliation would have gone a long way of speeding up the analyses of those parameters as well as reduce potential errors in the automated process of identifying authors and affiliations.
Lastly, mining and analysing the references would have enabled additional perspectives on the contributions, their associated methodological and theoretical paradigms and relationships between the available formal and latent structures within the corpus and therefore within ECER. Unfortunately, this was not possible as the amount of missing data on references was substantial and even for the cases of available data on the references, no uniform reference style was available.
Implications regarding EduTopics: ECER
Working on the app, getting feedback during the development process, presenting the results at ECER 2024 in Nicosia and at several other occasions as well as the peer-review provided several new perspectives for the app and its functionality: while the general tenor was very positive and enthusiastic, questions on the methodology and limitations of it were raised as well as ideas for additional functions were discussed. Even though the app contains a tutorial and methods section, which briefly explains the applied methods, several voices were asking for a more in-depth document on the functions and the underlying algorithms, which is provided with this manuscript. One of the main points of contention regarding the topic modelling approach was (a) the reliability and validity of the resulting topics and (b) the question, whether k = 50 topics can capture the heterogeneity of such a large corpus. The first point may be addressed by integrating the EERA community and the educational research community at large for determining the content of the topics, as their members have the scientific expertise and their (sub-)disciplinary and network related perspectives needed for a detailed qualitative assessment of the content of the topics. This is even more important when addressing the remaining second point: To combat the potential superficiality of only k = 50 topics, the updated version of the app (Christ et al., 2025) contains a more in-depth topic model with k = 300 topics, which contains much more detailed and differentiated information. For example, it contains multiple topics on teacher education with differing foci which enable the interpretation of several different theoretical and methodological paradigms over the years. The results of the larger topic model are intersected with the k = 50 to determine a hierarchical structure of supertopics and subtopics similar to super- and subcategories in qualitative content analysis.
Furthermore, LDAs are not the only model available to determine the content of text collections. Algorithms and methods such as structural topic modelling (Du et al., 2013), correlated topic modelling (Blei and Lafferty, 2006), word-embedded (correlated) topic modelling (Xun et al., 2017) or pachinko allocation (Li and McCallum, 2006; Li et al., 2012) may enable even deeper insights into the thematic map of the (European) educational research landscape. Those methods are substantially more complex and less intuitively understandable than LDAs and require a substantially larger amount of (server-side) processing power and memory, which is why the decision for using LDAs was made in beginning. Nonetheless, comparing the results of the various algorithms with each other to determine the most suitable modelling approach would be a worthwhile endeavour for future projects, albeit with different outputs due to technical limitations of shiny apps.
Implications regarding (educational) research
As reported throughout the entire paper, the app provides information for individuals and other relevant parties such as EERA networks on research trends and clusters (such as country of affiliation) and enables bibliographic and content related analyses for interested users. Additionally, the app may enables new opportunities for research by providing information for researchers, which was not readily available before. This information includes – but is not limited to – the results of the topic modelling approach, trends by networks and countries but also cooperation graphs for researchers and for EERA networks. It therefore enables analyses which usually are not based on the results of machine learning and natural language processing such as heuristic, theoretical or qualitative approaches investigating hierarchical structures within EERA and the (European) educational research landscape. The access to cleaned and structured data as well as to large graphs and databases provides new access for researchers, which is already becoming apparent with several publications and projects utilising the app for their own research objectives such as investigating trends of specific themes and their relevant authors across the last few decades or analysing the countries, networks and authors from an actor-network-theory-perspective (Latour, 2005).
Presenting the app to various groups of people with different backgrounds also opened our eyes to critical voices regarding its usage. Reservations consisted of the results and the usage of the app shaping future conferences, contributions or organisational developments and questions about who owns the data of research conferences. Those reservations can only be addressed by integrating the community and their ideas into the app and its utilisation, by keeping it free of charge and as open as possible and by listening to members of the community and their concerns. For example, we are trying to integrate members of the community into the qualitative process of topic assessment to benefit from their scientific expertise and knowledge and to prevent biases of the results due to our own entrenched expectations and preconceptions. Because after all, EduTopics is and was always meant to be a tool from the community and for the community.
Finally, several other institutions – both international and national – have already contacted us to look at possibilities to analyse and map their specific corpora. In the case of that eventually happening, it will improve the validity and reliability of the results and further enable new perspectives and access points to the (European) educational research landscape. But it will also lead to new challenges, like multilingualism of the corpora, nation- and culture specific research objectives and paradigms, further technical challenges such as memory and processing capacity as well as economic challenges related to financing and workhours.
Outlook
The development of EduTopics is continuing and will continue. This may lead to additional functions enabling even more information for interested parties and new perspectives on and for research (a new version of the app has e.g. been published in July 2025, see Christ et al., 2025). Whether the app will have an effect on educational research and research presented at ECER is entirely dependent on whether it will be well received and adopted by interested users. Nevertheless, as it offers a new perspective for everyone on the ECER abstracts and a representation of the (European) educational research landscape, it enables a new disciplinary self-observation (Keiner, 2010), to think about, reflect and rearrange educational research, its aims and outcomes. And it is entirely free of charge and independent from any corporations or large publishers.
We therefore want to use this last sentence to invite and encourage every interested user to try the app, explore the past and present of research presented at ECER and let us know your thoughts, feedback and criticism. Furthermore, if you are interested to use the app for your own research and/or contributions to ECER, we would be interested and happy to get into contact.
Footnotes
Appendix 1
Outline and description of the sections and subsections of EduTopics: ECER.
| Section | Subsection | Description, figures and functions |
|---|---|---|
| Introduction | A simple introduction to the app, its sections, recommendations on its usage and citation. | |
| How-to-use | An outline of all the sections of the app and an explanation about the interactive features. | |
| Methods | A brief explanation on the methods split into preprocessing, cleaning, bibliographic analyses and text mining analyses. | |
| Number of contributions | A figure on the development of the number of contributions from 1998 to 2024 grouped by ECER networks. | |
| EERA networks | Results by EERA network | For each single EERA network: |
| EERA network cooperation graph | A graph-drawing of the cooperation between networks based on the number of shared authors. The number of drawn edges per network are adjustable by slider by displaying the top 1–10 collaborations for each network. | |
| Authors | A table of all authors with at least n = 5 contributions to ECER from 1998 to 2024 sorted by the total number of contributions. Clicking on a button in the table displays the following information for the selected author: |
|
| Countries of affiliation | Geographic mapping | A 3D globe with the total number of contributions matched to the countries of affiliation. The timeframe can be selected via a bipolar slider. For the scaling of the number of contributions either absolute or logarithmic can be selected. |
| Results by Country of Affiliation | A table of all countries of affiliation with at least 10 contributions from 1998 to 2024 sorted by the total amount of contributions. Clicking on a button in the table displays the following figures on a country level: |
|
| Topic modelling results | Overview of results | A 2D bubble plot of the t-SNE-mapping of all k = 50 topics. |
| Topics × networks | A heatmap on the distribution of topics across all EERA networks based on the logarithmic amount of contributions assigned to each possible pairing. | |
| Results by individual topics | A table of all k = 50 topics including the topic-number k, title of the topic, top 20 words by word-topic-probability β and number of contributions assigned to the topic. Clicking on a button displays for the selected topics the following information: |
|
| Graph-Visualisation of Topics | A graph-drawing on the relations between the k = 50 topics by their similarity of relevant words (edges). The minimum word-topic-probability β of a word to be displayed can be adjusted with a slider between β ∈ (0.005; 0.030) | |
| Geometric Visualisation of Topics | A scatterplot on the geometric structure of corpus by the document-topic-probability γ for all k = 50 topics. The dimensionality of the geometric mapping via the applied t-SNE-algorithm can be selected via a click on either the 2D or 3D button. For each topic, only the top n = 200 contributions according to the document-topic-probability γ are displayed. | |
| Explore the corpus | Build your own Corpus | Function for building tables of contributions to ECER by selecting (1) an EERA network, (2) a Topic and (3) a timeframe. After selecting from (1) to (3) a click on a button displays all applicable contributions. The table is printable and exportable into either the clipboard, CSV, XLSX or PDF formats. |
| Map your own Text | Function for entering an own text which is cleaned and analysed with the topic-modelling-posterior. A click on a button displays the top 5 document-topic-probabilities γ, the document-network probability and the most similar contributions to the entered text based on the smallest Euclidean distance between the entered text’s γ-values and the γ-values of the ECER contributions. | |
| Authors of this app | Information on the authors as well as imprint information. |
Acknowledgements
Additionally, we are very grateful for the feedback of Susann Hofbauer, Marita Cronqvist, Edwin Keiner, Sverker Lindblad, Fabio Dovigo and Martin Lawn, while developing the app.
Declaration of conflicting interests
The authors declared no potential conflicts of interest with respect to the research, authorship, and/or publication of this article.
Funding
The authors disclosed receipt of the following financial support for the research, authorship, and/or publication of this article: We are grateful for getting a network seed funding of the EERA for analysing the conditions for an update of the ECER abstract corpus (see Christ et al., 2025).