
Abstract
International Large-Scale Assessments (ILSAs) have had significant impact on education policy across the globe. But has interest in ILSAs now started to wane? This paper presents new evidence on this issue, exploring how the amount of attention three major ILSAs receive compares across countries, between studies and over time. Using information on Google searches made for ILSAs over time, we illustrate how results from TIMSS and PIRLS results receive significantly less attention than those from PISA. Globally, interest in ILSAs seems to have peaked in 2012 and has been on the decline since. There is however substantial cross-country variation, with increasing interest in some countries over the last decade (e.g. Sweden, Turkey) offsetting some of the fall in others (e.g. Japan, German). Moreover, while changes in scores seem to be related to the attention that ILSAs receive, other factors – including their current position in political and policy narratives – are also likely at play.
Keywords
Introduction
International Large-Scale Assessments (ILSAs) have become a key source of education data across the globe. Although ILSAs have received substantial policy and media interest since the turn of the millennium – in large part due to the success of the OECD’s Programme for International Student Assessment (PISA) – their origins can be traced back to the 1960s (Lockheed et al., 2015). Together, they provide a rich set of data that facilitates comparisons of educational achievement across countries and over time. Their high profile has translated into significant political and policy impact in several countries, including motivating or justifying major curriculum/assessment reforms in Wales (Oates, 2021), Ireland (Kirwan, 2017), Hungary (Neumann et al., 2012), Mexico and Australia (Froese-Germain, 2010), amongst others. There can thus be little doubt that, over the last quarter century, ILSAs have had a substantial impact on education debates (Breakspear, 2012).
Yet, although ILSAs have clearly had impact, there have been few attempts to measure the attention they have received in different countries. For instance, how much attention has PISA received compared to other ILSAs, such as the Progress in International Reading Literacy Study (PIRLS) and the Trends in Mathematics and Science Study (TIMSS)? In which countries do each of these studies receive most interest? And how has interest in ILSAs changed over time – has ‘Peak PISA’ passed? The overarching contribution of this paper is to provide new evidence on such issues, drawing upon information from Google Trends as a unique data source.
Previous research into the attention ILSAs receive
Most existing research into the attention ILSAs receive focus on the prominence of PISA within national newspapers. Perhaps the most well-known study is Martens and Niemann (2010) who investigated PISA-related media coverage within one high-quality newspaper between December 2001 and November 2008 across 22 OECD countries. They found that ‘although poor results seem to increase the education issue’s likelihood of becoming a substantial object of public discourse, as one can easily conclude regarding the cases of Germany, Spain, Austria, and Mexico, this phenomenon is not universally valid’ (Martens and Niemann, 2010: 5). Examining 380 newspaper articles and 200 protocols from parliamentary debates in Sweden, Lundahl and Serder (2020: 193) argue that the use of PISA data is selective and have been ‘used to legitimize selective (party political) solutions’. Crome (2022) explored media reporting of PISA in Singapore and Australia, arguing the results were reported in a much more measured way in the former than the latter. Also focusing on Australia, Baroutsis and Lingard (2017) note how PISA received increased media coverage over the 2000–2014 period. Exploring the role of the UK media, Grek (2008: 1) concluded that ‘the media response to PISA shows that it is an event that cannot be ignored’, with it becoming ‘the major international tool focusing interest and debate on the issue of education’. Looking into articles in two national newspapers about the East Asian Tigers in Australia, Germany and South Korea, Waldow et al. (2014) noted how discourse about such reference societies may be influenced by whether PISA scores are increasing or declining. In Portugal, Santos et al. (2022: 34) find that ‘after initial “enthusiasm” in 2001 PISA was barely discussed during the following two cycles. More attention was paid to the results of PISA 2009 and – though less prominently – subsequent cycles’. They put forward two possible explanations – an increase in the scores towards the OECD average and expanding national interest in the use of assessments. Using reports from 49 Chinese Newspapers, Hu (2022) noted how there was a spike in media reporting of the PISA 2012 results, followed by a muted media response to PISA 2015. They suggest this is likely related to the apparent drop in China’s scores (despite different provinces taking part).
The impact of ILSAs on national education policy
The attention that ILSAs have received has also had significant impact on education policy. In several countries, such attention has been used to justify education reforms (Breakspear, 2012). It has also arguably led to increased interest in evidence-based policymaking in education across the globe (OECD, 2019). The result has been for countries to increasingly look overseas for policy inspirations and ideas, leading to the creation of so-called reference societies (Santos and Centeno, 2021). Finland is a widely cited example, with the widespread international attention paid to their PISA results leading to other countries attempting to borrow policy from them (Chung, 2019). Bilateral relations between countries have thus also been affected. On the one hand, the high-profile nature of ILSAs has led to increased international collaboration on education-related issues – including greater sharing of best practise across national borders. Yet, in some countries, strong ILSA performance of regional or global competitors has also been met with cynicism and scare stories, including accusations that some nations artificially inflate their results (NCEE, 2020) and heightening fears over future economic decline (Grey and Morris, 2018). Indeed, Baird et al. (2011 : 22) note how the ‘international media has focused on the West losing its competitive edge’.
A host of previous work has discussed specific policy impacts of ILSAs, including how these have been driven by the broad attention the results receive. In Norway, the PISA 2000 results led policymakers to make changes to mathematics curricula, teacher training and national assessment regimes (Nortvedt, 2018). Cantley (2019) describes how interest in ILSAs led England to engage in policy borrowing from East Asia. This includes aspects of policy tourism through the Shanghai exchange programme (where teachers from Shanghai’s schools were invited to teach in England, and vice-versa) and incentivising the implementation of East Asian ‘mastery’ approaches to mathematics instruction. Baird et al. (2011) discuss how the PISA 2000 results received significant media coverage in Switzerland, with this accelerating the implementation of key policy reforms (e.g. harmonisation of educational standards, the creation of a common curricula). Lagos (2021) similarly argues that – by highlighting differences in performance across groups and the limited progress made over time – ILSAs led to curriculum, regulation and assessment reforms in Chile.
Although most associate the impact of ILSAs to stem from the attention generated by PISA, TIMSS and PIRLS have had significant influence as well. As noted by the IEA (2011), in 2004 Hong Kong incorporated the PIRLS test framework into its assessment of children’s reading. Norway used results from PIRLS 2006 to motivate early interventions for weak learners, while in New Zealand PIRLS and TIMSS helped set standards of achievement expected in primary schools. Likewise, Korsnakova et al. (2021) discuss how TIMSS influenced policy development in Croatia, Serbia and North Macedonia, most notably in terms of curriculum development. PIRLS and TIMSS are also used by some countries to benchmark progress against the Sustainable Development Goals.
Contribution and research questions
The aforementioned research has made a significant contribution to our understanding of the media attention ILSAs have received, and the subsequent impact this has had on education policy. Yet clear gaps in the evidence base remain. For instance, most existing research focuses on a small number of countries and/or a single timepoint. There has thus been less work on how interest in ILSAs has ebbed and flowed across a larger pool of countries and over time. Likewise, most existing research focuses exclusively on PISA, without considering (and comparing against) other ILSAs. Likewise, newspaper articles represent a specific form of attention that ILSAs receive, which will to some extent be driven by an outlet’s readership and how the media in a particular country operates. There is consequently clear scope for further work in this area, particularly with respect to how interest in ILSAs varies across different studies, countries and over time.
This paper attempts to make such a contribution to the literature. Specifically, we draw on Google Trends data to explore the extent the world has been searching for information about ILSAs over the past 15 years. Such an approach has been widely used to study human behaviour (Mavragani et al., 2018) – particularly in health (e.g. Fulk et al., 2022) – but has rarely been applied in education research. By drawing on this resource, we can provide a much more comprehensive overview of the attention that ILSAs have received globally since the mid-2000s.
We seek to answer three research questions. To begin, comparisons are drawn between the three most well-known and long-running ILSAs – PISA, PIRLS and TIMSS. Although it is anecdotally thought that PISA has been the most influential ILSA (at least politically), no previous study has attempted to measure the attention it has received compared to other international studies. This is important as there is little scientific reason why one ILSA should be more influential or receive more attention than others. Rather, it has been argued that the evidence they jointly provide should be considered holistically when policy decisions are made (Jerrim, 2013). Thus, if one ILSA is consistently receiving much more attention than others, one may question whether one piece of evidence (most likely PISA) maybe having undue influence over international education debates. We will thus contribute to the literature by presenting the first piece of scientific evidence on PISA’s profile relative to other ILSAs, including – critically – being the first study to attempt to measure this. Our first research question hence asks:
Research question 1. How much attention does PISA receive compared to other major ILSAs, such as PIRLS and TIMSS?
Next, we turn to comparisons across countries. Specifically, where does each ILSA receive most attention (relative – broadly speaking – to population size) 1 ? While much previous research has discussed the policy impact or media articles written in single countries, cross-national comparative evidence on the attention ILSAs receive is mostly lacking. This is partly due to the challenges with capturing such attention in an internationally comparable manner. Google Trends data offers a potential solution to this problem, given the dominance of this search engine in most countries. Our second research question hence asks:
Research question 2. In which countries have PISA, TIMSS and PIRLS received most attention?
Finally, interest and attention paid to ILSAs is likely to ebb and flow over time. Moreover, this is likely to vary across countries; when interest is low in one nation it is likely to be peaking in others. Yet there is currently little evidence on this matter – how interest in ILSAs has changed over time – and how this varies across different national settings. This is important as it provides the first quantitative evidence as to when ILSAs were receiving most attention in each country, and hence an indication of how and where their profiles have changed. Our final research question is therefore:
Research question 3. How has interest in PISA, PIRLS and TIMSS changed over time? How does this compare across countries?
Data and methods
The data we use are drawn from Google Trends (https://trends.google.com/trends/?geo=GB), with this information extracted using the Python ‘Pytrends’ package on 21/10/2022 2 . This allows users to investigate the frequency of different Google search terms or topics. As Google is the most widely used search engine worldwide – with over 90% market share (https://gs.statcounter.com/search-engine-market-share) – it provides high-quality information about the key issues explored in a given country (or globally) over a specific time horizon.
Google Trends can be used to explore the relative importance of a search term/topic in one of two ways:
(a) Comparing changes in the importance of a search term over time within a single country (or globally).
(b) Comparing the importance of a search term (or terms) across countries over a specified time horizon.
Google Trends can thus be used to draw comparisons across countries and to compare change within countries over time. It, however, cannot perform both these functions simultaneously due to how the data are scaled (see below for further details). Consequently, when interpreting data from Google Trends, it is critical to know which dimension (time, countries or terms) is being compared. This will hence be clarified for each table/figure in the results section.
From each search query, Google Trends returns a ‘normalised’ value between 0 and 100. Google (2022) states how ‘each data point is divided by the total searches of the geography and time range it represents to compare relative popularity. The resulting numbers are then scaled on a range of 0 to 100 based on a topic’s proportion to all searches on all topics’. Values of 100 indicate ‘peak popularity’ of a search (the point where it had greatest share of all searches) within the country and time horizon specified. Note that, by implication, the figures returned by Google Trends are not comparable across different queries, as everything is standardised within each individual query. A value of 50 on this scale can thus be interpreted as a search term receiving half the attention it did at its peak within the parameters specified (country, time horizon, search terms). A value of zero on this scale indicates either very low levels of interest relative to the peak, or that there were too few searches for the term in that country/period to provide reliable data.
This focus on relative differences is important as it stops countries or time points with the most search volumes (i.e. the largest countries) from always receiving the highest scores. In particular, by focusing on the frequency search terms appear relative to all searches made in that geography during the specified time horizon, one is able to establish its level of interest compared to elsewhere. As Google Trends puts it ‘a higher value means a higher proportion of all queries, not a higher absolute query count. So a tiny country where 80% of the queries are for “bananas” will get twice the score of a giant country where only 40% of the queries are for “bananas”’ (Du Preez, 2019: 20).
Figure 1 provides a firm example, comparing searches for the topics ‘University of Oxford’ and ‘University of Cambridge’ made in the UK since 2004. The attention paid to either of these universities over this 18-year time horizon was at its peak in January 2021 (search popularity = 100). This was when the Oxford-AstraZeneca Coronavirus vaccine started to be administered. At this timepoint, searches for the University of Oxford outnumbered those for the University of Cambridge by five-to-one. The other interesting point of note from Figure 1 is that searches for these two universities make up a smaller proportion of all Google searches now than previously – falling approximately in half (search popularity of around 30 in 2022 compared to around 60 in 2004/2005).
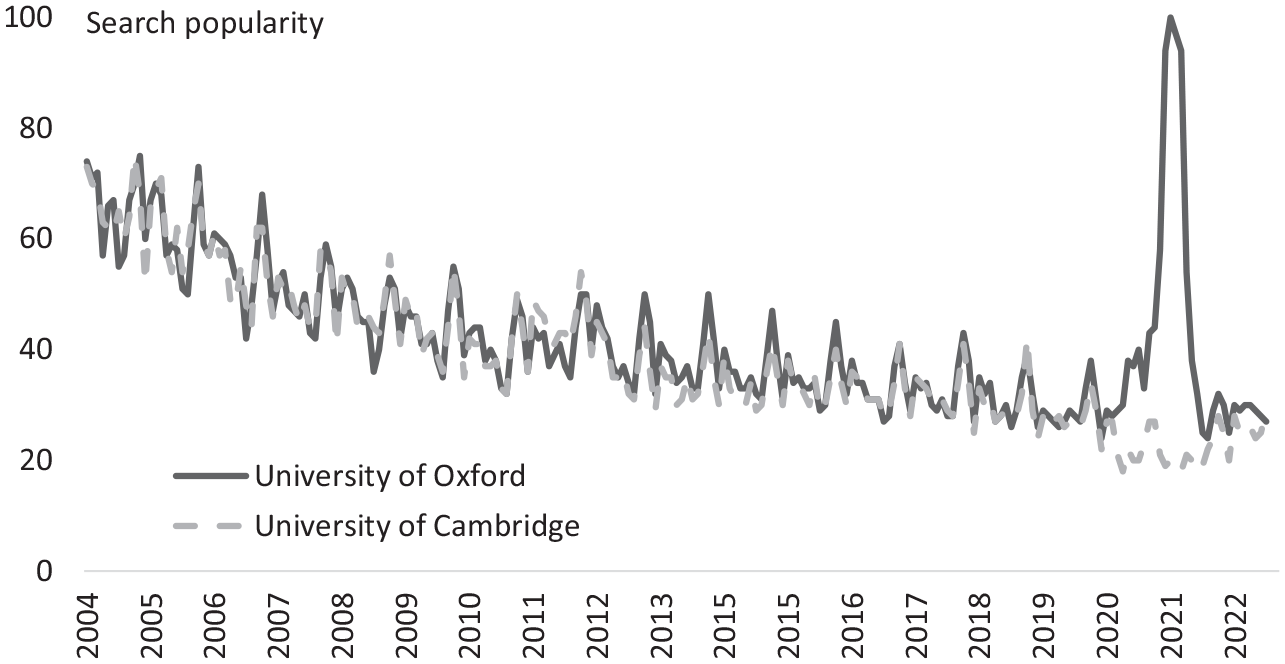
Google searches for the topic ‘University of Oxford’ and ‘University of Cambridge’ made in the UK between 2004 and 2022.
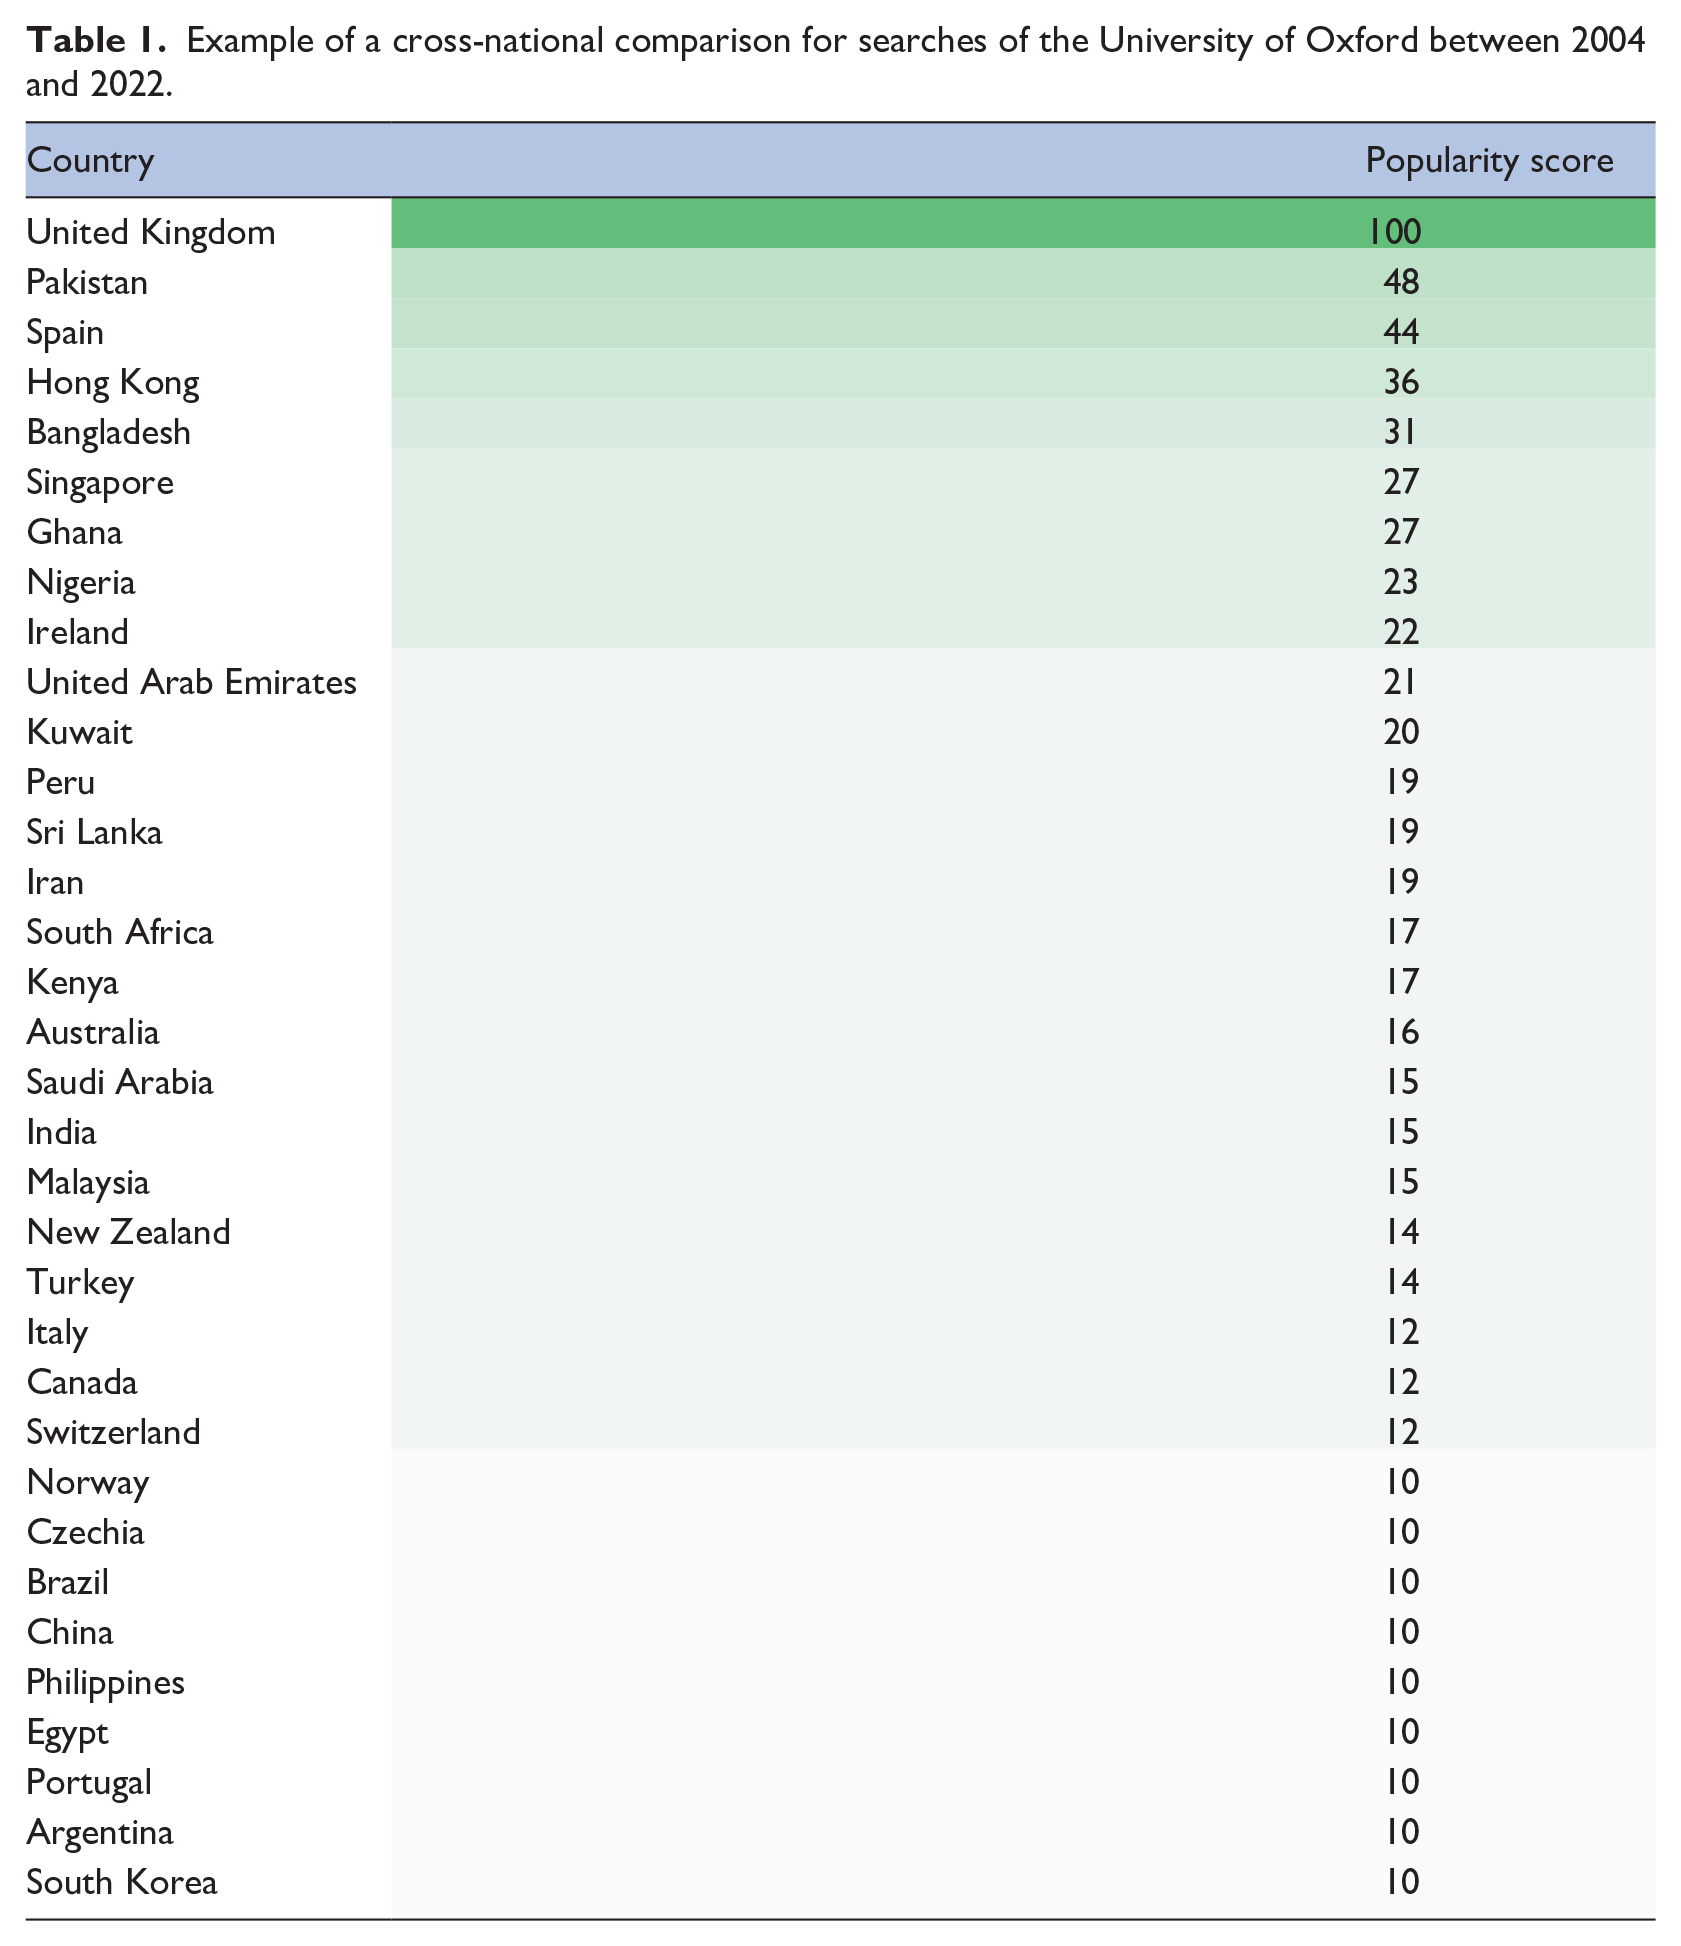
Table 1 then compares the countries where the University of Oxford has made up the greatest proportion of all Google searches across 2004–2022. Unsurprisingly, peak interest is in the UK, where the university is based. Next, however, is Pakistan with a value of 48. This means that the proportion of all Google searches in Pakistan for the University of Oxford is at approximately half the level of the UK. Meanwhile, in countries like Norway, Portugal, Brazil and China, Google searches for the University of Oxford are only around 10% of the level they are in the UK (as a proportion of all Google searches). It is hoped that this simple example helps readers understand how Google Trend’s 0–100 scale should be interpreted.
Example of a cross-national comparison for searches of the University of Oxford between 2004 and 2022.
Search terms versus topics
Google Trends allows one to investigate the popularity of specific search terms (e.g. ‘OECD PISA’, ‘TIMSS’) or for entire ‘topics’ related to the same issue or entity. Topics can be thought of as a collection of search terms for very closely related content. Our analysis is based on topics rather than specific search terms for three reasons. First, topics – unlike search terms – are language agnostic, which is important when exploring patterns across a diverse set of countries. Second, different individuals might use different search terms (e.g. ‘OECD PISA’ vs ‘PISA OECD’) with no clear reason to prefer one over others. Finally, topics include searches for content with common spelling mistakes, which may be important in our application. For instance, by using topics rather than search terms, we will capture searches for both the correct European spelling (Programme for International Student Assessment) and incorrect American spelling (Program for International Student Assessment).
This approach is implemented in the Pytrends package by first exploring topic suggestions for the terms ‘Programme for International Student Assessment’, ‘TIMSS’ and ‘PIRLS’. The following topics and topic codes were then returned, which we subsequently use in our Google Trends queries:
Programme for International Student Assessment. Topic code = /m/04n90c
Trends in Mathematics and Science Study. Topic code = /m/0d81kz
Progress in International Reading Literacy Study. Topic code = /m/0972t8
Research question 1
To address research question 1, we focus on narrow time periods when results from ILSAs were released very close together. For instance, both TIMSS and PISA took place in 2015. Results from the former were released on 29th November 2016, while those from the latter came out just 1 week later (6th December 2016). As our results will reveal, there tends to be a sharp increase in the attention ILSAs receive every time new findings are released. We are thus able to compare the size of these peaks – that is how much attention each study generates – using Google Trends data from November/December 2016. Our primary focus is on the global attention that the results receive. However, as PISA and TIMSS cover a different number and pool of countries, we also replicate our analysis for six large members of the OECD that took part in both studies to check whether similar substantive findings hold. A similar approach is used to compare the attention PIRLS and TIMSS receive, focusing on the 2011 cycle, when results from both studies were released on the same day (11th December 2012).
Of course, one limitation of this approach is that it focuses on a specific set of results over a narrow time horizon. We hence also provide country-by-country results covering all Google searches made for ILSAs between January 2006 and December 2020. When doing so, we focus on the percentage of Google searches for ILSAs in a country that were looking for information about PISA (rather than for TIMSS or PIRLS).
Research question 2
Our second research question turns to cross-national comparisons of where the results from ILSAs received most attention. We begin by limiting the time horizon for each search to between January 2006 and December 2018. The topic codes for PISA, PIRLS and TIMSS are then used in our queries within the education category. 3 Countries are then ranked by their search popularity score, with 100 representing where searches for a given ILSA (e.g. PISA) made up the greatest proportion of all Google searches within a country over this time period. The same process is followed for each ILSA in turn. Note that, following the discussion above, figures from this analysis can only be compared across countries within each ILSA, and not across ILSAs.
Research question 3
The third research question turns to trends over time. We start by looking at the global picture, plotting monthly Google searches for the relevant ILSA topic codes between 2006 and 2022. 4 Separate queries are made for each ILSA, so we are comparing relative interest in a specific study over time. Values of 100 indicate when the study was of peak interest globally.
We then replicate this analysis for each country in turn. For brevity, in the main body of the paper, we focus on PISA amongst members of the OECD. Analogous graphs for non-OECD members are provided in Appendix A. We also discuss results from six countries – the United States, United Kingdom, Japan, Turkey, France and Germany – in further detail, and for whom we also present the trend in interest in TIMSS. These countries have been selected as six of the seven largest members of the OECD that have regularly participated in at least two of the major ILSAs. 5 As trends for countries with large populations have the least noise (due to there being more Google searches), these provide the most robust examples to drill down further into the results.
Strengths and limitations of Google Trends as a data source
Using Google Trends to investigate our research questions has both strengths and limitations. A major advantage is the broad international coverage of the data over a prolonged time horizon. This makes investigations of broad country trends and comparisons possible in a way that is not feasible using alternative approaches (e.g. manually reading media reports). Likewise – although not perfect – a common metric (Google searches) means that measurement is likely to be as consistent as possible in this line of research. One can also focus on specific time periods to identify how certain events – such as the release of new findings – leads to an increase in the attention each ILSA receives.
On the other hand, although Google has more than 90% of the internet search market share in most countries, it is lower in some such as China (around 4%) and Russia (48%). Thus, in a small number of non-OECD countries, selection of who uses Google could impact the results. Moreover, Google Trends only provides information about the relative volume of searches and not about who is searching. One could argue that attention and interest amongst a smaller set of key stakeholders (e.g. policymakers, school leaders) might be more important than the general interest measure that Google Trends provides. Relatedly, Google searches – like previous research exploring newspaper reports – are just one dimension of the attention that ILSAs receive. It is also possible that frequent consumers of ILSAs (e.g. policymakers, scholars) bypass Google to access the information another way, such as by bookmarking pages or via their internet search histories.
On balance, we therefore believe that Google Trends data can provide a useful yardstick of the general interest that ILSAs receive, and how this compares across countries, studies and over time. Indeed, we do not believe there is currently better data available to investigate such issues. At the same time, we recognise its limitations, and readers should bear these in mind when interpreting our results.
Results
Research question 1. How much attention does PISA receive compared to other ILSAs?
Figure 2 panel (a) compares the attention generated by the TIMSS 2015 results (dashed line) in comparison to those from PISA 2015 that were released just a week later (black line). There is a clear, striking difference between the two. While there is a peak in interest (as measured by Google searches) when the results from both PISA and TIMSS 2015 were released, the increase is much more pronounced in the former than the latter. In terms of magnitude, globally, the release of the PISA results received around 10 times more attention than those from TIMSS. This is despite TIMSS covering both primary and secondary education (PISA is secondary only) and the focus of PISA in 2015 being science (one of the subjects covered within TIMSS).
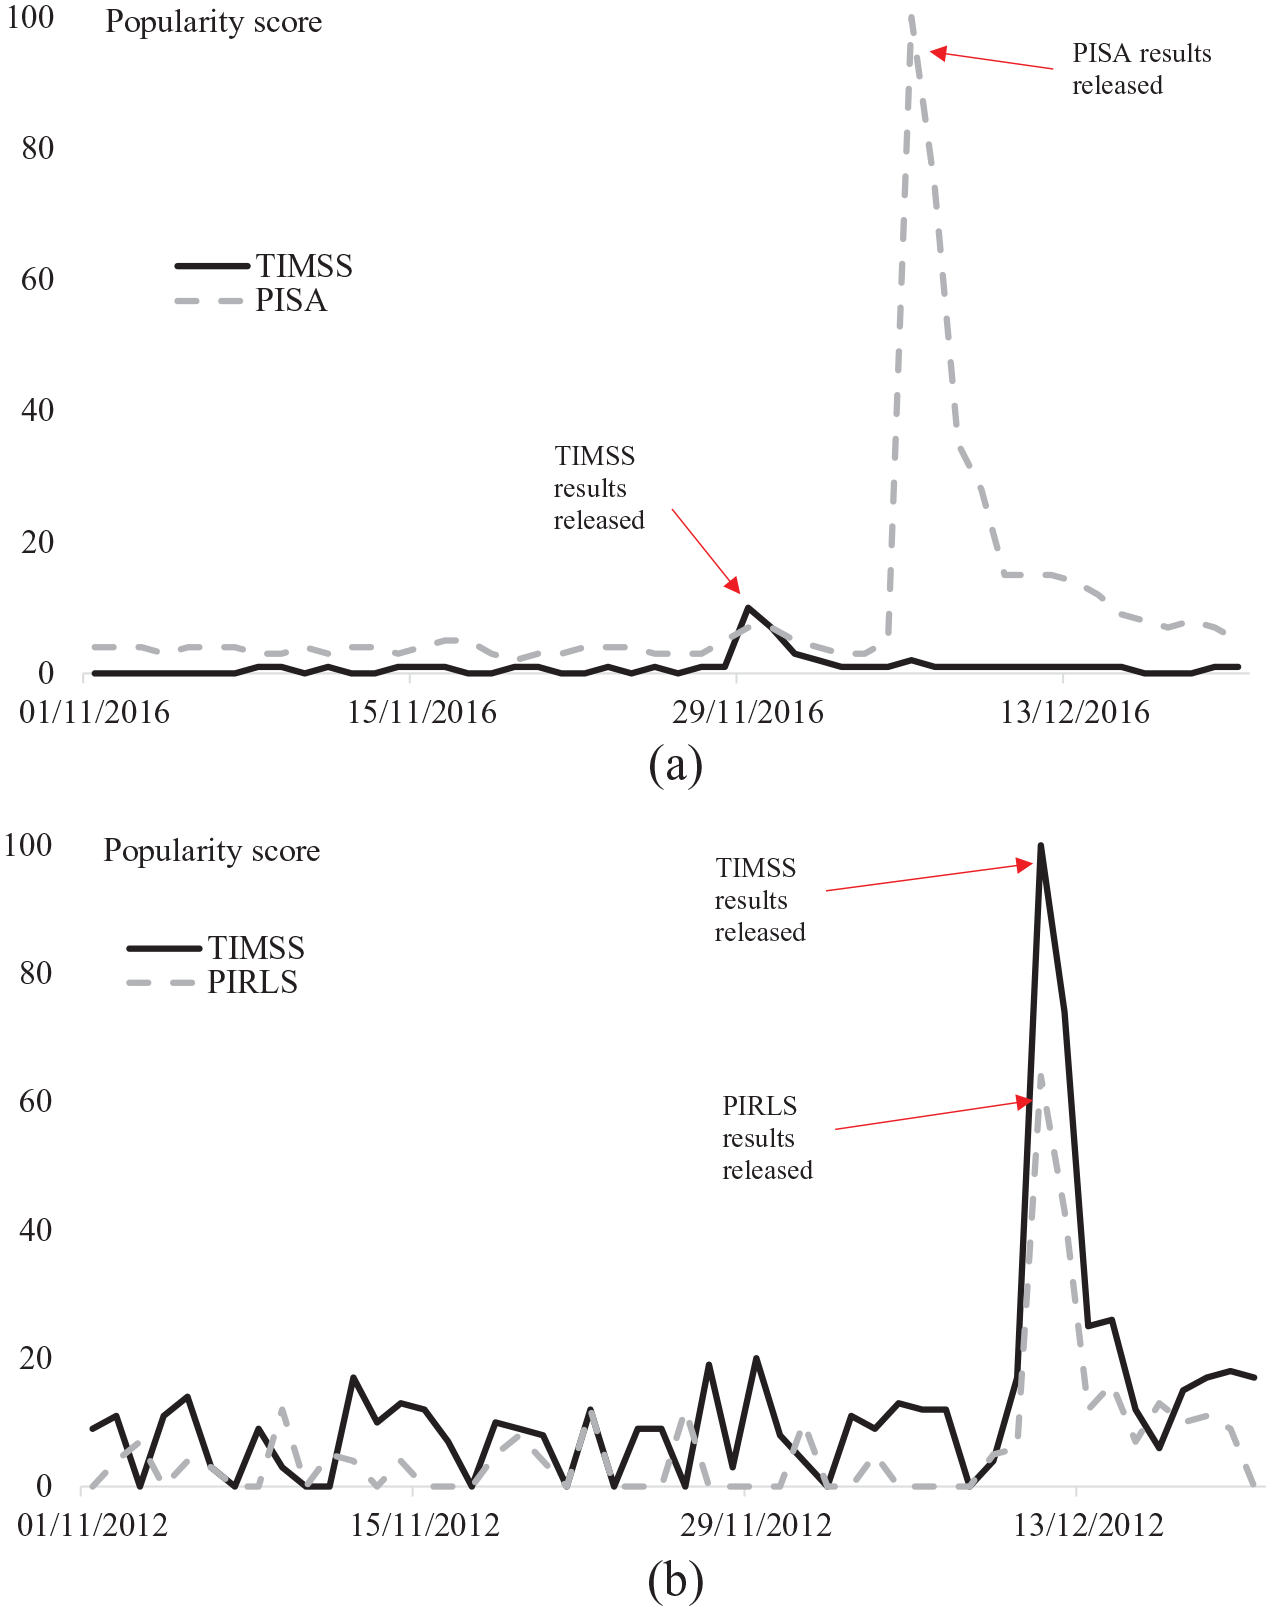
The popularity of Google searches when ILSA results are released: (a) PISA versus TIMSS 2015 and (b) PIRLS versus TIMSS 2011.
Appendix B replicates these results for six large OECD countries (United States, Japan, United Kingdom, France, Germany and Turkey). The same pattern emerges in each; the spike in Google searches for PISA is much larger than for TIMSS. This difference is most apparent in Turkey and the United Kingdom, where the Google Trends score for PISA at its peak is around 20 times higher than the peak for TIMSS. Indeed, in the UK, the release of the TIMSS 2015 results actually led to more interest (Google searches) for PISA than for TIMSS. On the other hand, in the United States PISA only received around five times more searches than TIMSS when results from the 2015 cycle were released, and around three times more in Japan. Nevertheless, overall, the results presented in Appendix B illustrates that the global picture presented in Figure 2a is not simply due to the different pool of countries PISA and TIMSS include.
Panel (b) of Figure 2 provides an analogous comparison between TIMSS and PIRLS. Although the trend prior to the release date (11th December 2012) is somewhat noisier (due to lower daily search volumes) there is still clear evidence of a spike in the attention both studies received. Yet the peak for TIMSS was clearly higher; for every 100 Google searches made for TIMSS, around 60 were made for PIRLS. This is likely due to the narrower focus of PIRLS – covering reading skills of primary school pupils only – while TIMSS covers two subjects (mathematics and science) across both primary and secondary sectors.
One limitation of Figure 2 is that it focuses on a narrow period of time surrounding one set of results. Hence, in Table 2, we investigate the percentage of Google searches made for each of the three ILSAs (PISA, TIMSS and PIRLS) throughout the January 20006 to December 2020 period. For instance, a value of 90 in the PISA column indicates that 90% of all Google searches made for ILSAs were looking for information about PISA. Results are presented separately by country, with shading to be read horizontally. The darker the green shading the greater the attention PISA received relative to the other ILSAs.
The relative attention paid to each ILSA. The picture by country.
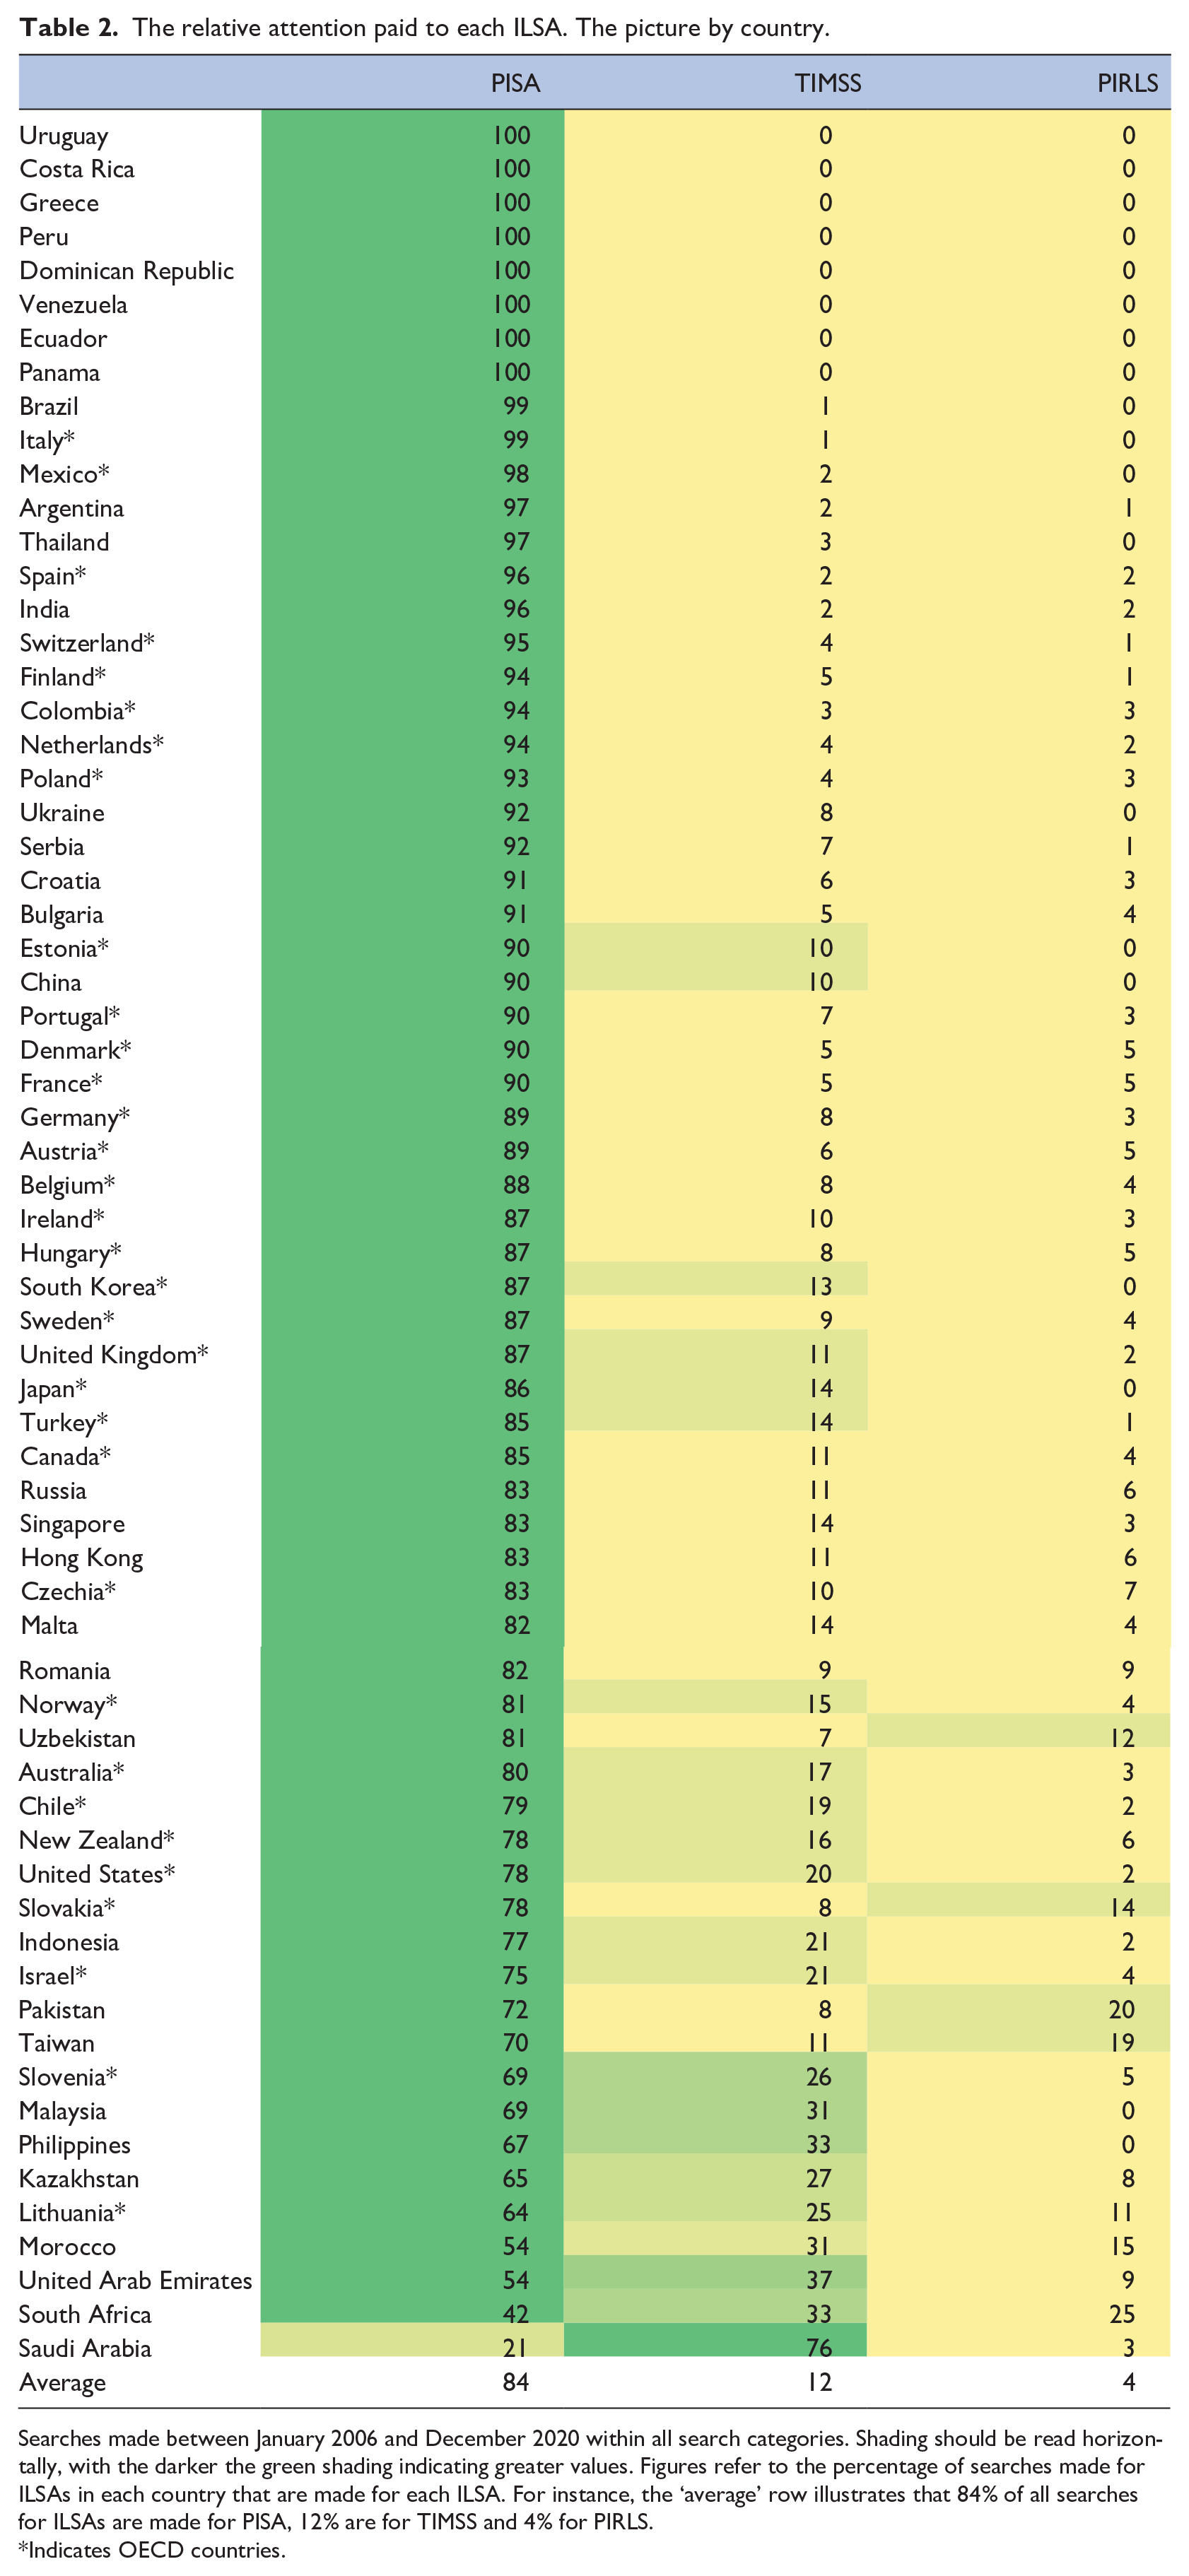
Searches made between January 2006 and December 2020 within all search categories. Shading should be read horizontally, with the darker the green shading indicating greater values. Figures refer to the percentage of searches made for ILSAs in each country that are made for each ILSA. For instance, the ‘average’ row illustrates that 84% of all searches for ILSAs are made for PISA, 12% are for TIMSS and 4% for PIRLS.
Indicates OECD countries.
These results confirm the pattern observed in Figure 2 – PISA receives by far the most attention out of the three main ILSAs. On average across countries, for every 100 Google searches looking for information about ILSAs, 84 were for PISA, 12 were for TIMSS and just 4 for PIRLS. This holds true across most countries. Saudi Arabia is the only exception, where 76% of searches for ILSAs were trying to find information about TIMSS. This is unsurprising, given that Saudi Arabia has participated in TIMSS regularly since 2003, but only in PISA in 2018. It is also noteworthy that there are only a handful of OECD countries (Lithuania, Slovenia, Ireland, New Zealand, United States, Chile and the Slovak Republic) where PISA receives less than 80% of all Google searches for ILSAs.
Research question 2. In which countries have PISA, TIMSS and PIRLS received most attention?
Table 3 provides a cross-country comparison of where PISA has received most interest between January 2006 and December 2018. 6 The country where PISA has received most relative attention is the former Soviet republic of Estonia. This country first participated in PISA in 2006 and is now Europe’s top performing country (Estonia achieved the highest reading, science and mathematics scores of any European nation in PISA 2018). It is hence becoming one of the new ‘reference societies’ that other countries are looking towards, with its strong performance in PISA being commented upon around the world (e.g. Jeffreys, 2019). This has clearly also generated significant interest in Estonia itself.
Cross-country comparison of where PISA has received most attention.
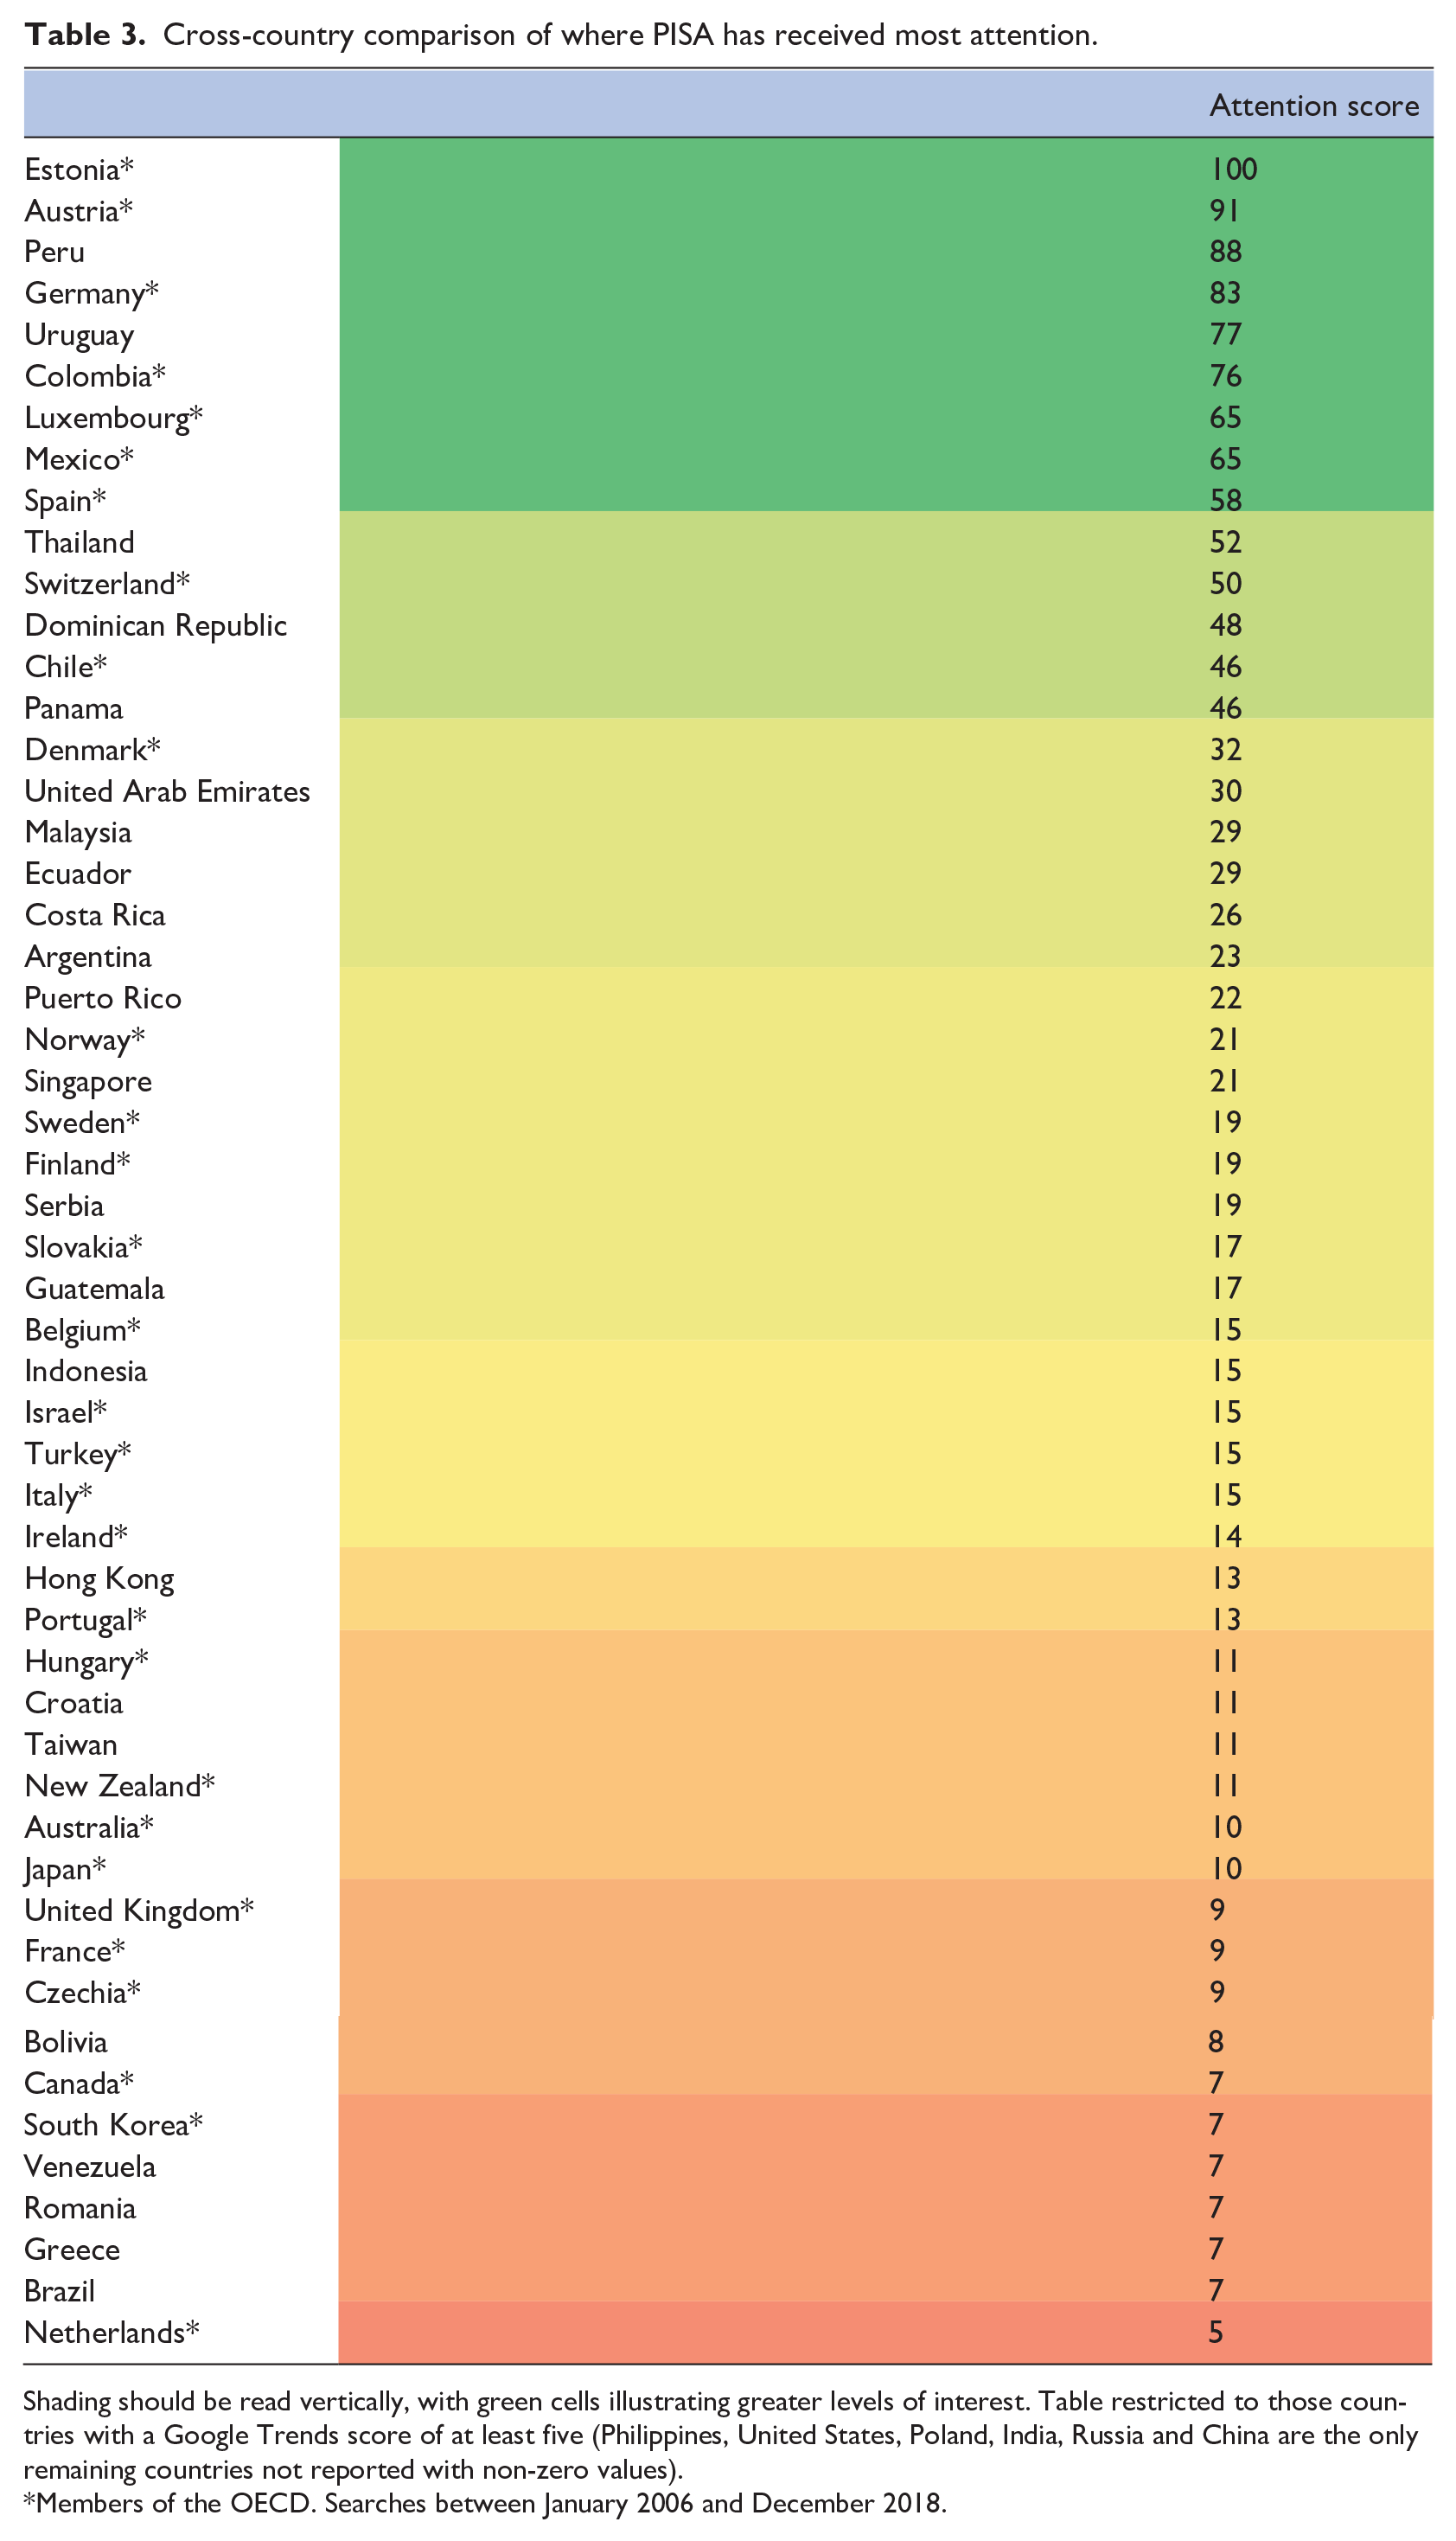
Shading should be read vertically, with green cells illustrating greater levels of interest. Table restricted to those countries with a Google Trends score of at least five (Philippines, United States, Poland, India, Russia and China are the only remaining countries not reported with non-zero values).
Members of the OECD. Searches between January 2006 and December 2018.
Also towards the top of Table 3 sits a cluster of central European nations – Austria, Germany, Luxembourg and Switzerland. Previous research has noted how several of these countries experienced a ‘PISA shock’ when the results from the first PISA study were released in December 2001 (Baird et al., 2011; Waldow, 2009). Our results suggest that PISA has continued to be more prominent in these countries than elsewhere. This may be due to the raft of policy reforms that were enacted or accelerated in some of these countries following their disappointing results, with PISA providing a tool to monitor whether the situation has since improved.
The final notable cluster of countries towards the top of Table 3 are the South American nations of Peru, Colombia, Uruguay and Chile. When PISA began, none of these countries were members of the OECD. 7 Yet three of them have consistently participated in PISA since 2006 (Peru is the exception which participated in 2000, and then again from 2009) which sets them apart from many other middle-income nations. The same is also true of Thailand, which also sits towards the top of Table 3. It is interesting to compare the attention that PISA has received in these four South American countries to their neighbour Brazil. It too has participated in PISA over a prolonged period of time (all waves since 2000) yet it has received much less attention; around 15 Google searches were made in Peru, Colombia and Uruguay for PISA for each single search in Brazil.
The final interesting feature of Table 3 is identifying where interest in PISA has been comparatively low. This includes the Anglophone countries of the Republic of Ireland, New Zealand, Australia, United Kingdom, Canada and the United States. 8 Despite participating since 2000, and with some experiencing sharp declines in performance (e.g. Australia) or otherwise disappointing scores (e.g. United States), PISA has received less attention in these countries than elsewhere. A possible explanation could be that these countries have several other sources of educational data available (surveys, administrative records, standardised assessments). PISA may thus experience more ‘competition’ from other sources of education data in these countries.
Table 4 provides analogous results for TIMSS and PIRLS. Starting with TIMSS, one immediate difference from PISA is in the countries that sit towards the top of the table. Several are of lower levels of economic development, such as Oman, Palestine and Jordan. These countries may not have many other robust and regular independent sources of evidence about their education system; a gap that TIMSS has filled. Some of the other countries where TIMSS has received most (relative) interest have also not regularly participated in PISA – for example Kuwait – again perhaps pointing towards TIMSS being one of the few high quality, independent data sources available. The fact that TIMSS includes primary school pupils may also make the study more relevant to lower/middle-income countries than high-income countries, where there is a particular focus on raising basic education levels (including as part of the Sustainable Development Goals). Finally, interest in TIMSS is lower amongst OECD nations, even those that have participated in both the primary and secondary components of this study consistently over time (e.g. England, Japan and the United States).
Cross-country comparison of where TIMSS and PIRLS have received most attention.
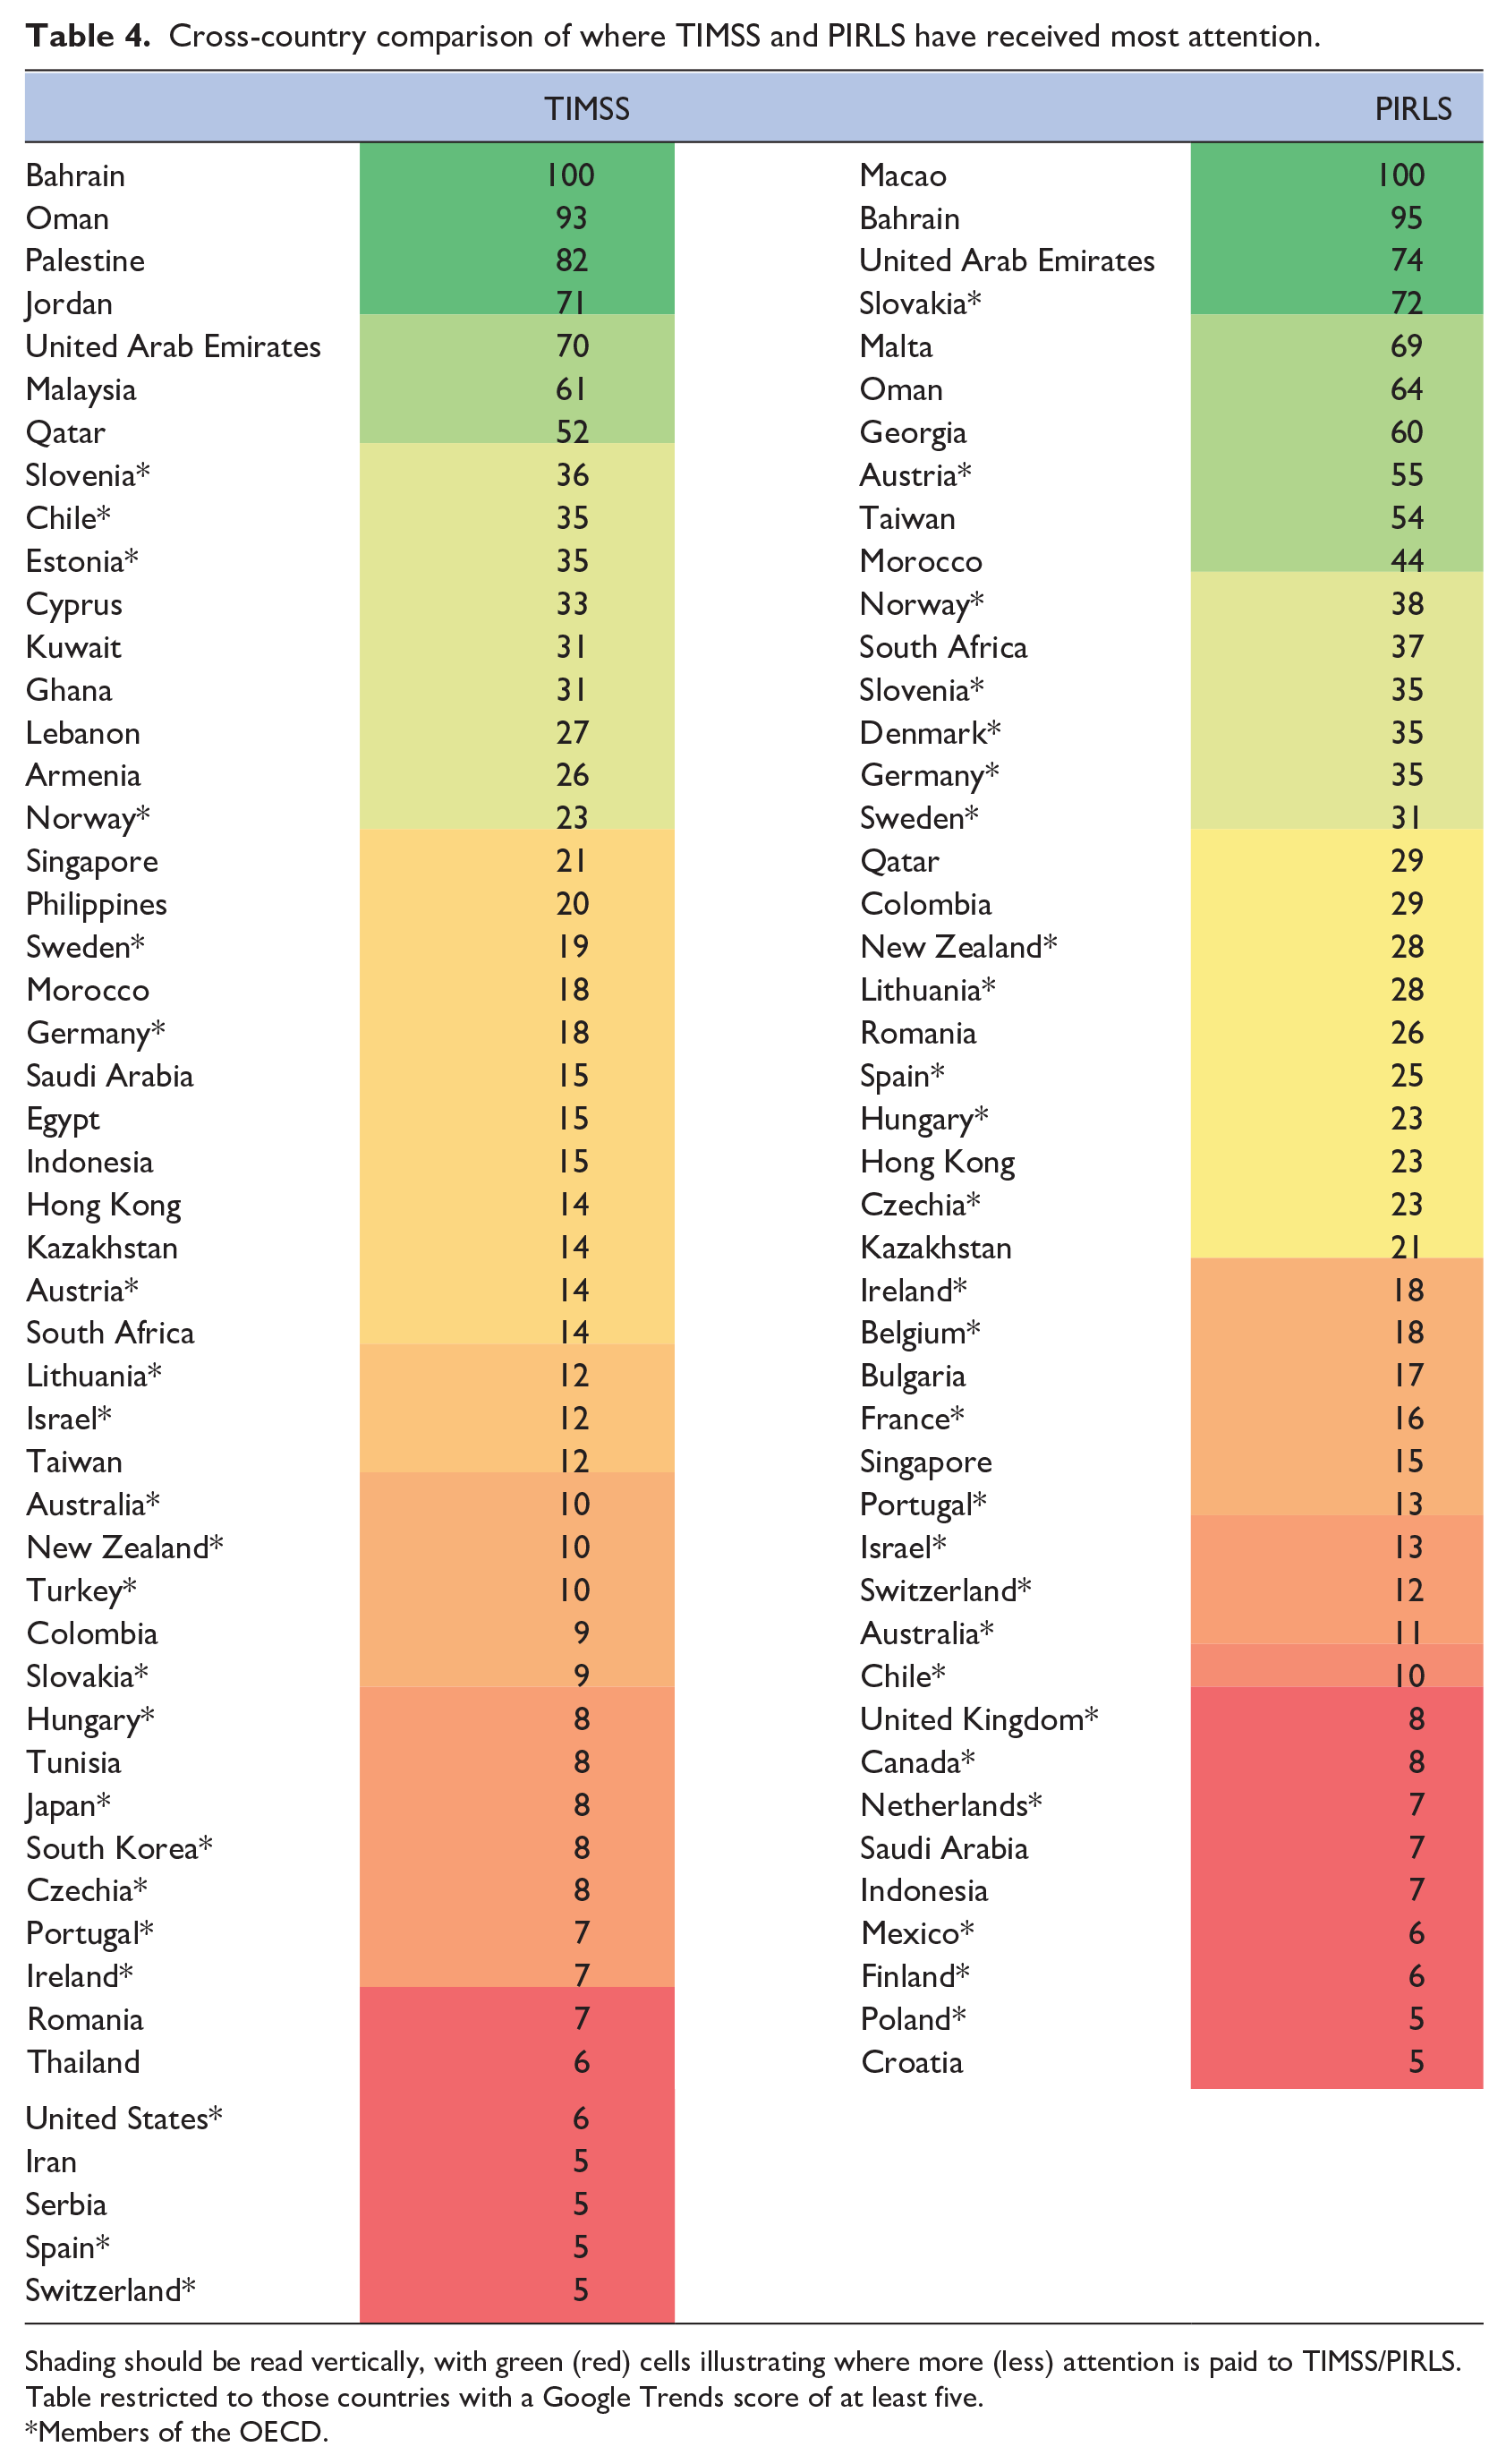
Shading should be read vertically, with green (red) cells illustrating where more (less) attention is paid to TIMSS/PIRLS. Table restricted to those countries with a Google Trends score of at least five.
Members of the OECD.
Broadly similar patterns emerge for PIRLS in the right-hand side of Table 4. There are several middle- and lower-income countries towards the top where interest is comparatively high, including Oman, Malta and Georgia. Out of the OECD members, PIRLS seems to gain more interest in the three Scandinavian countries that have participated regularly in this study, particularly in comparison to the English-speaking nations of New Zealand, Ireland, Australia, United Kingdom and the United States (not shown in table). This is consistent with the pattern of results reported in the left-hand side of Table 4 for TIMSS.
Finally, to what extent does interest in one ILSA (e.g. PISA) correlate with interest in another (e.g. TIMSS) at the country level? To answer this question, we first restrict the sample of countries included in the analysis to those with non-zero Google Trends scores. Spearman rank correlations are then estimated, leading to the following results:
Correlation between the attention paid to PISA and TIMSS = .40 (n = 47).
Correlation between the attention paid to TIMSS and PIRLS = .67 (n = 53).
Correlation between the attention paid to PISA and PIRLS = .48 (n = 41).
As these figures indicate, there is a modest, positive correlation between the attention received by the three ILSAs. This is clearest for the relationship between TIMSS and PIRLS and is slightly weaker for the relationship between PISA to TIMSS. However, overall, there seems to be some evidence that countries where there is more interest in one ILSA also show more interest in others.
Research question 3. How has interest in PISA, PIRLS and TIMSS changed over time?
Figure 3 begins by presenting the number of Google searches (as a proportion of all searches) for PISA, TIMSS and PIRLS over time. Recall that the vertical axis refers to the relative importance of the search term at that timepoint. A value of 100 indicates when Google searches for the ILSA (relative to all searches) was at its peak.
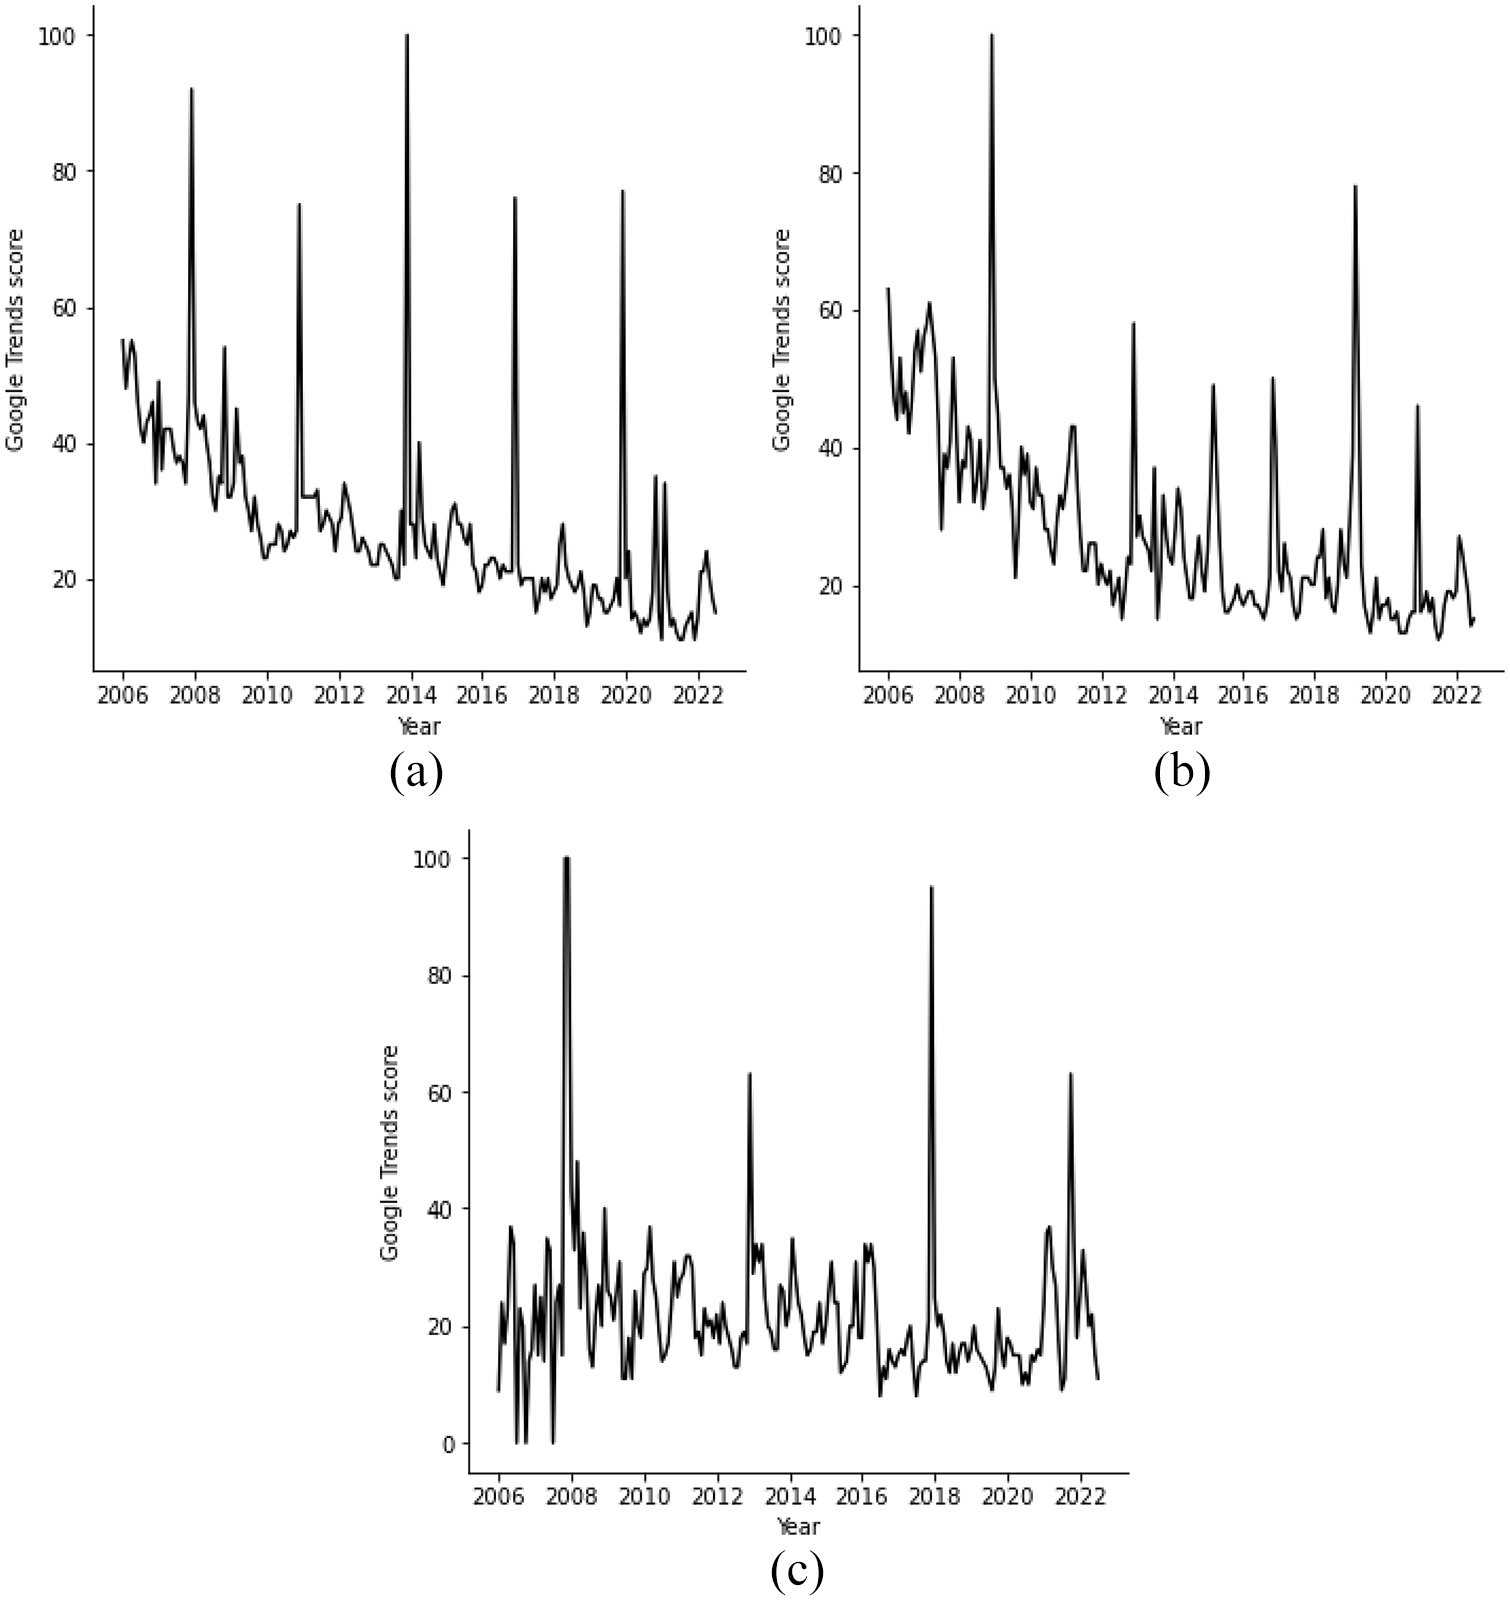
Trends in the attention ILSAs have received over time: (a) PISA (b) TIMSS, and (c) PIRLS.
Starting with PISA (panel a) there are four points to note. First, as alluded to under research question 1, Google searches for PISA peak when each new set of results are released. Second, the global peak in the attention was when the PISA 2012 results were released in December 2013. Findings from the subsequent two releases (in December 2016 and 2019) only received about 80% of the attention of the 2012 results. Third, in-between the peaks, there is evidence of a downward trend in the proportion of searches made for PISA. This perhaps suggests that – outside of the release of the main results –interest in PISA has declined. Finally, the OECD tends to release results from its ‘innovative domains’ (e.g. financial literacy, global competency) after the main study results. Yet these do not seem to garner the same amount of attention. For instance, we find no evidence that Google searches related to PISA increased when the global competency results were released in October 2020.
Panels (b) and (c) present analogous results for TIMSS and PIRLS. Similar patterns emerge for both. These ILSAs received most attention when the PIRLS 2006 and TIMSS 2007 results were released in November 2007 and December 2008 respectively. The response to the next set of releases (TIMSS 2011 and PIRLS 2011 in December 2012) was more muted, with Google searches standing at only 60% of their previous peak. One possible explanation is that results from both studies were released on the same day, meaning they were likely to be competing against one another for attention, or individuals who searched for one also found the other. However, global interest in both picked up again for the release of results from the most recent round, with Google searches made for PIRLS returning close to its 2007 peak. The other notable feature is that, although the Google Trends score for TIMSS clearly declined between 2006 and 2012, it has remained broadly stable since. Relatedly, for PIRLS, there is no clear pattern of global interest either increasing or declining over time.
The results in Figure 3 refer to the global picture. How has the attention paid to ILSAs changed in specific countries? Figure 4 provides the answer for PISA, where Google Trends scores are plotted over time for each OECD country.
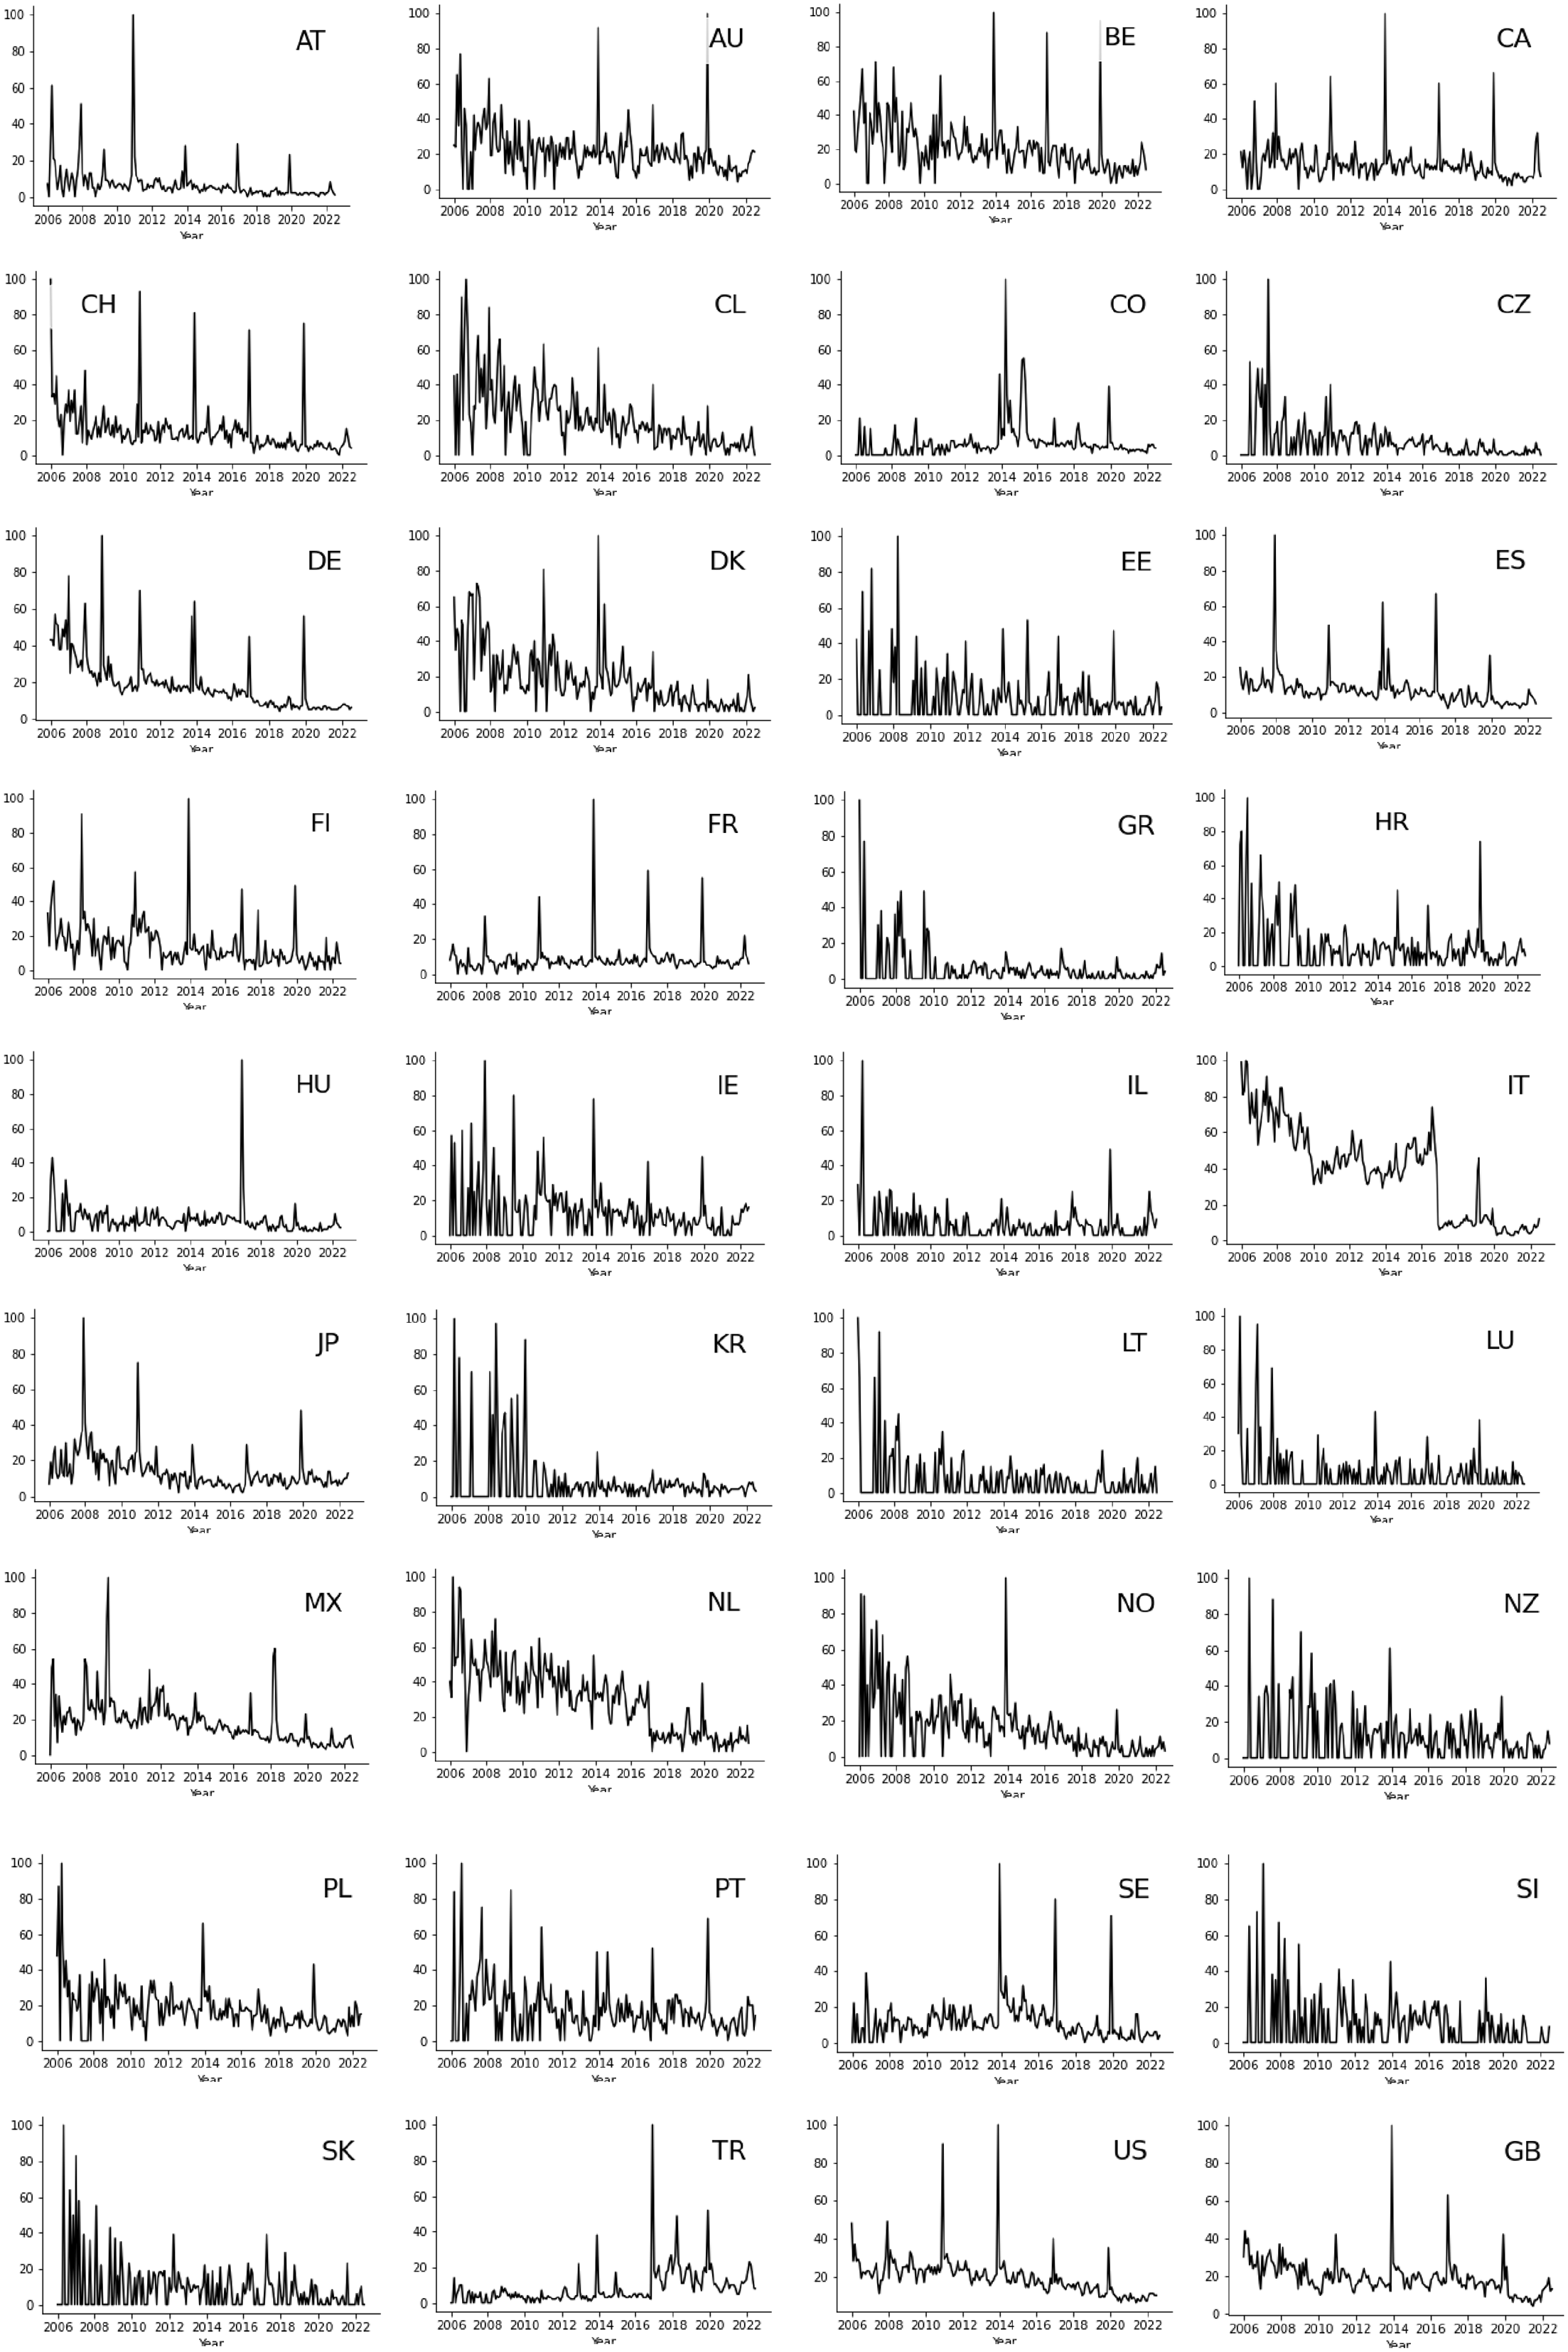
Trends in the attention paid to PISA over time for each OECD country.
Most countries fall into one of four groups. The first are those where interest in PISA has declined over time. The clearest example is Germany, though a similar pattern can also be observed in Spain (ES), Italy (IT), Japan (JP) and the Netherlands (NL). Second are a group of countries with a single large spike in Google searches, coinciding with the release of a specific set of results. The PISA 2015 results for Hungary (HU) – released in December 2016 – is a prime example. Yet others include Austria (AT), Colombia (CO) and Norway (NO). Third are those countries where interest in PISA was previously low but increased more recently. Sweden (SE) is perhaps the clearest example, although this also includes Turkey (TR) and to some extent the United Kingdom (GB). Finally, there are several countries where there is little evidence of a clear trend over time, including Australia (AU), Belgium (BE), Canada (CA), Switzerland (CH), the Czech Republic (CZ), Estonia (EE), Greece (GR) and the Republic of Ireland (IE).
We now discuss the trends observed in six large OECD countries in further detail, 9 covering both PISA (Figure 4) and TIMSS (Figure 5).
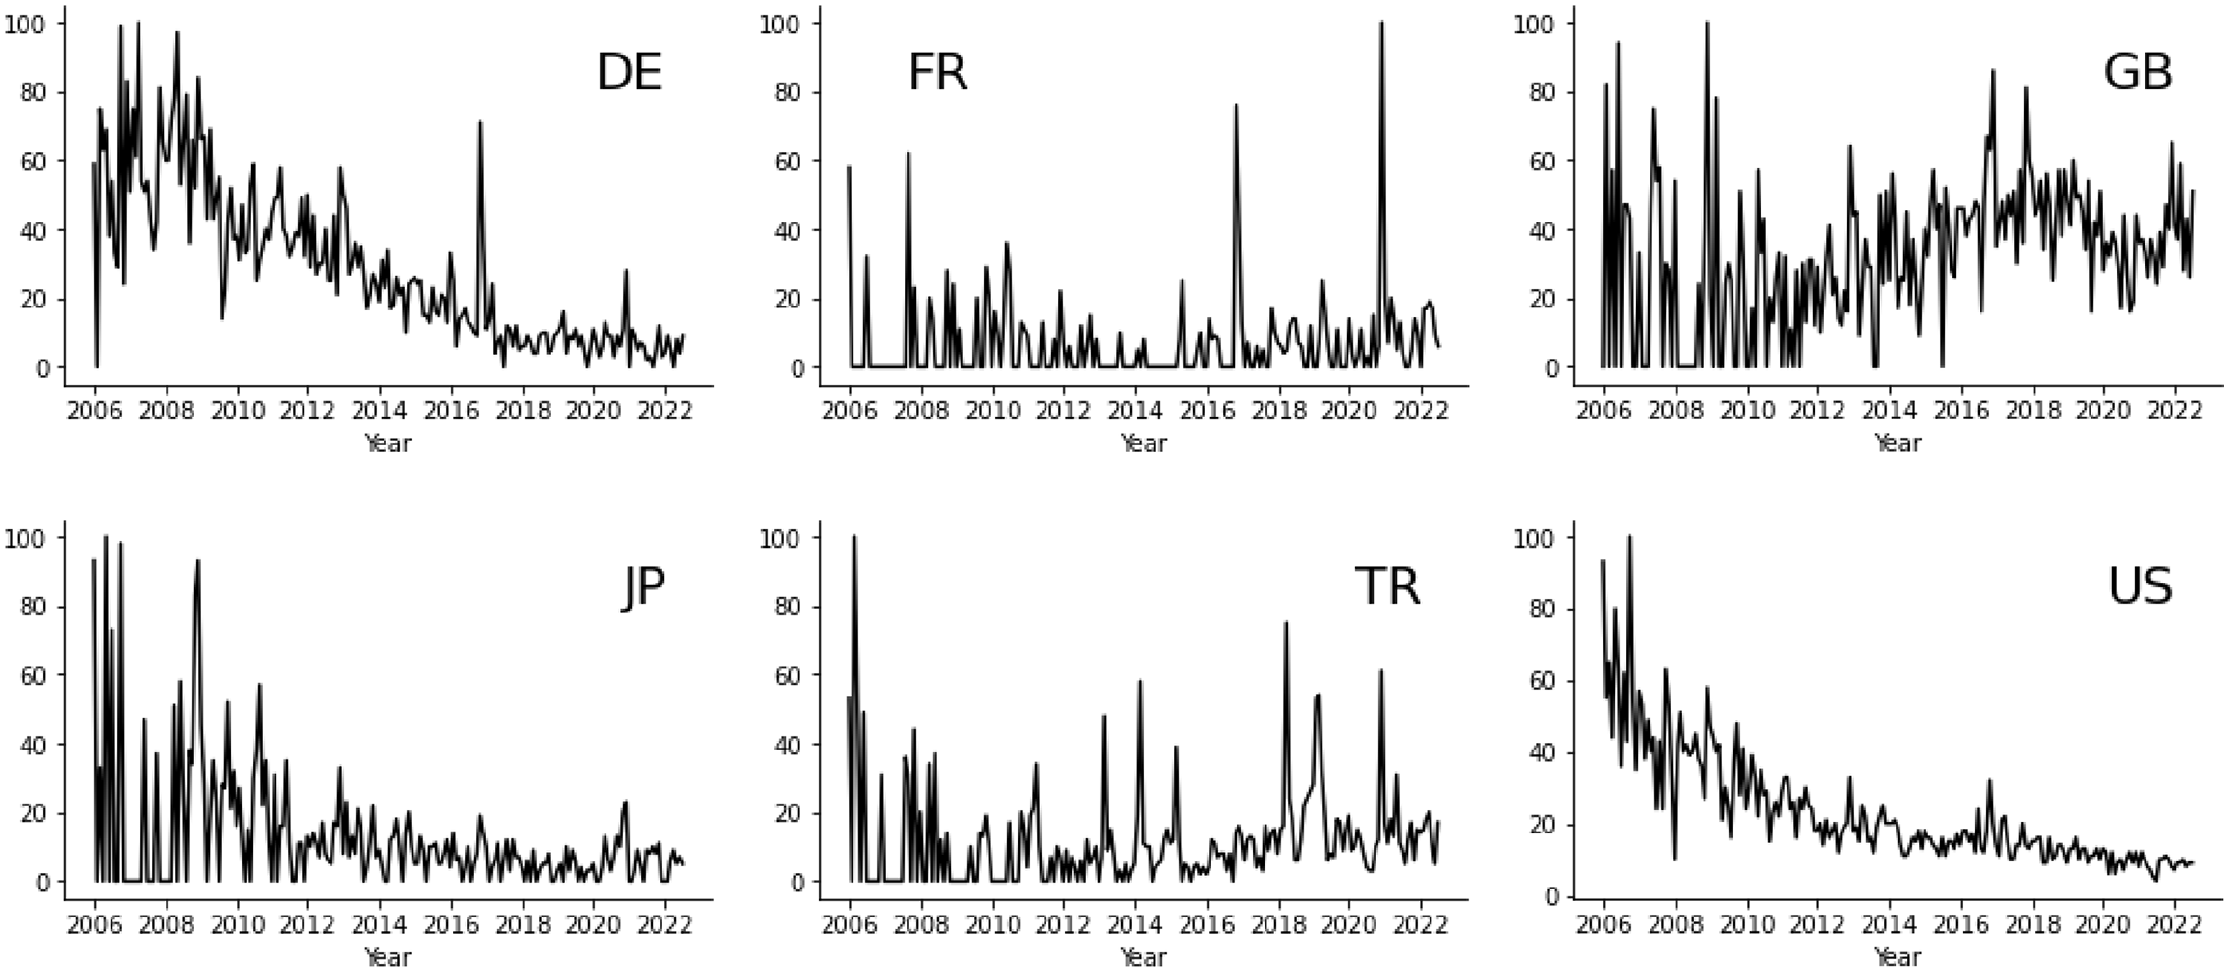
Trends in the attention paid to TIMSS over time in selected OECD countries.
Starting with the United States (US), Figure 5 illustrates a clear decline in the attention TIMSS has received over time. Peak interest in this ILSA in the US was 2007, with it steadily declining ever since. Indeed, there were around 10 times more Google searches for TIMSS (as a proportion of all searches) in 2007 than in 2020. Turning to PISA, there were two clear peaks in interest. The first came with the release of the PISA 2009 results in December 2010. Although average mathematics (474–487) and science (489–502) scores experienced a significant increase compared to the previous cycle (PISA, 2006), the then Secretary of State for Education Arne Duncan expressed disappointment in the results, describing them as a ‘wake-up call’ (Armario, 2010). The Obama administration then used this to justify policy change. The second peak came in December 2013, when results from the next PISA cycle were released. However, following this, the attention future PISA results have received in the US have been much less pronounced. For instance, the PISA 2018 results released in 2019 received only around a third of the Google searches of those in December 2013. Thus, taking the evidence from PISA and TIMSS together, interest in ILSAs in the United States seems to have passed its peak.
A rather different pattern emerges for Turkey (TR). Despite Turkey taking part in TIMSS since 1999 and PISA since 2003, both generated comparatively little attention until the PISA 2012 results were released in 2013. Like the United States, this coincided with an increase in average scores compared to previous rounds. Interest in PISA within Turkey has subsequently been appreciably higher than previously, particularly each time new results are released. It is also notable that Turkey’s headline PISA scores have been particularly volatile over this period, being on an upward trend through to 2012, falling back in 2015 before bouncing back up in 2018. 10 It seems plausible that such volatility in results may be related to the attention PISA has received. Regardless, the recent increase in attention paid to ILSAs in Turkey is most apparent for PISA; the pattern observed for TIMSS is less clear.
In Japan (JP), interest in PISA peaked with the release of the PISA 2006 and 2009 results in December 2007 and 2010. This may be linked to how Japan performed in PISA in 2006, with average scores down in mathematics, being around the OECD average in reading and lagging behind key regional competitors (South Korea and Hong Kong) in these subjects. However, over the last decade, the attention PISA received in Japan has been comparatively muted. Despite some spikes in attention around the release dates in recent years, these have been comparatively small compared to previously. For instance, the proportion of Google searches made for PISA when the 2012 and 2015 results were released in Japan were less than a third of the 2006 results peak. Interestingly, this is despite there being signs of decline in Japan’s recent PISA performance. In contrast, the trend for TIMSS in Japan is somewhat inconclusive. Nevertheless, overall, there is some suggestion that the attention ILSAs have received in Japan has recently waned.
Next, we turn to the United Kingdom (GB). There is a clear point when PISA received a disproportionate amount of attention in this country (December 2013). This was a time when the then Secretary of State for Education (Michael Gove) closely tied education policy to England’s performance in PISA. Several reforms were made to the education system in response to PISA during his tenure, including to national examinations and school curricula. Since his departure, interest in PISA has declined somewhat in England, with the proportion of Google searches made for this ILSA when the 2018 results were released only around 40% of its peak. Interestingly, the opposite seems to hold true for TIMSS in Figure 5, with some evidence that interest in this ILSA has increased in UK over the last decade.
The results for Germany (DE) across both PISA and TIMSS are consistent and clear; there has been a decline in the attention they have both received over time. Each set of PISA results has been met with a lower peak in Google searches (as a proportion of all searches), accompanied by a clear downward trend in interest in the periods between these peaks. This is perhaps unsurprising given that Germany’s well-publicised ‘PISA shock’ came in 2001, with each subsequent set of results providing limited new information. Likewise, the trend for TIMSS in Germany clearly declined between 2008 and 2018, with the only exception being a spike when the TIMSS 2015 results were released in December 2016 (despite Germany’s TIMSS scores being similar to the previous wave). Nevertheless, there is clearly a suggestion that peak interest in ILSAs in Germany may have now passed.
Finally, we turn to France. Much like the global picture presented in Figure 3, interest in PISA peaked in France with the release of the 2012 results in December 2013. There have since been smaller spikes in December 2016 and 2019 following the release of the next two waves. However, overall, the trend in Google searches for PISA in France is somewhat unremarkable – at least in comparison to some other OECD countries. This in many ways reflects the pattern in France’s PISA scores, which have remained broadly stable over time. For TIMSS, there has been spikes in Google searches in France when the 2015 and 2019 results were released (2015 was the first time France participated in TIMSS since 1995).
Together, Figures 4 and 5 demonstrate how the attention paid to ILSAs – and PISA in particular – ebbs-and-flows over time. When interest picks up in one country (e.g. Turkey) it falls away in others (e.g. Germany). However, overall, peak interest in ILSAs globally may have now passed.
Conclusions
ILSAs have become high-profile resources over the last 25 years, driven by the advent and expansion of the OECD PISA study. They have together had a major impact on education policy, most notably in terms of curriculum and assessment reform (Froese-Germain, 2010). Yet, despite widespread interest in ILSAs, little previous work has investigated how the attention they receive varies across countries, over time and between the various studies. There has thus been little objective evidence as to whether the prominence of ILSAs is increasing or decreasing over time and how this may be changing across countries. This paper has sought to make this contribution to the evidence base.
The analysis quantifies for the first time just how much more attention results from one ILSA (PISA) receives compared to others such as TIMSS; Google searches for the former outnumber the latter by approximately ten-to-one. Yet, even for PISA, global interest seems to have reached its peak. This does however mask substantial heterogeneity across countries, with sizeable recent increases in attention in ILSAs (PISA in particular) in countries like Sweden and Turkey, but large declines in others such as Germany and Japan. Interestingly, while the relative attention PISA receives continues to be greatest within the OECD, the main ‘market’ for TIMSS now seems to be lower and middle-income settings (e.g. Oman, Palestine, Bahrain).
The overarching contribution these findings have made to the literature is that they have quantified many views of ILSAs that were previously based on anecdotal evidence alone. For instance, we have provided the first quantitative evidence that PISA does indeed receive substantially more attention than either TIMSS or PIRLS, and that this holds true across almost every country. This is important as there is little methodological reason why this should be the case and demonstrates PISA’s disproportionate influence (compared to other ILSAs) on public education debate. Similarly, in some countries there is a perception that the prominence of ILSAs has been in decline. Our findings have illustrated that while there is clear evidence of a decline in attention in some countries (e.g. Germany) there has been recent increases in others (e.g. Sweden, Turkey). Moreover, many national commentators perceive ILSAs to have received more attention in their country than elsewhere. An example is the Anglophone members of the OECD – including the Republic of Ireland, the United Kingdom and the United States – where ILSAs (and PISA in particular) have at times had a significant impact on education policy. Yet, as we have shown, ILSAs have actually received much more attention in other countries, such as the central European nations of Germany, Austria, Luxemburg and Switzerland. Thus, to some extent, our findings may challenge views about where ILSAs have gained most traction. Finally, the paper has made a methodological contribution by illustrating the potential for Google Trends data to inform comparative education research.
Following our findings, one may ask why PISA receives so much more attention than PIRLS and TIMSS? Although we are unable to provide a definitive answer, it is possible to speculate. One key difference is subject coverage – PISA includes three subjects plus innovative domains such as financial literacy and global competency – while TIMSS focuses on just two (and PIRLS just one). We do not believe this to be the driving force though, given the substantial difference in Google searches we found for the PISA and TIMSS 2015 results (when the focus of PISA was science – a subject also covered in TIMSS – with both covering mathematics as well). An alternative explanation is that PISA targets an older age group who are nearer to the end of compulsory education and/or key transition points. Again, however, we feel this is unlikely, particularly as participants in the eighth grade TIMSS study are only around 2 years younger. Likewise, although PISA is conducted more often (every 3 years) than TIMSS (every 4 years) and PIRLS (every 5 years), TIMSS is longer running than PISA (starting 1995 vs 2000) and currently has the same number of completed cycles (seven). Frequency hence seems an unlikely explanation as well. A more plausible reason is PISA’s focus on ‘real world’ application of skills – compared to TIMSS and PIRLS focus on achievement in an international curriculum. Related is PISA’s attachment to the OECD’s global brand, and whose creator (Andreas Schleicher) has played a very prominent role in disseminating findings to policymakers and the media. Indeed, one could argue that the reason why PISA has received so much more attention than other ILSAs is because the OECD purposefully set out to do so, branding and marketing the study in such a way to maximise media, public and policy attention.
There are of course limitations to our work. First, our outcome measure is based on Google searches. Although this is being increasingly used to understand human behaviour and reactions to key events (Nuti et al., 2014) it is just one way to operationalise the concept of the attention that a subject matter receives. Second, relatedly, Google Trends provides information on the proportion of Google searches for a particular topic. It does not provide any data about who is searching for the term and what information they eventually access. Arguably, more focused interest in ILSAs amongst key groups (e.g. teachers, schools, policymakers) may be more important than the ‘general interest’ data that Google Trends uncovers. Third, despite Google dominating the search engine market globally (over 90% market share), it is notably lower in some countries of potential interest, such as China (4% market share) and Russia (48% market share). 11 Hence the extent that one can draw generalisable results for such countries is likely to be more limited. Finally, there is currently only a limited number of countries and timepoints available to explore the link between the attention a study receives and how a country performed in each cycle. Further exploration of this matter is likely to be of interest when further data become available.
What, then, do the findings imply for future use and development of ILSAs? The declining attention being paid to the results highlights the continual need for innovation in what ILSAs deliver. Both the OECD and IEA have been active in this area, introducing new assessment domains, moving to computer-based testing and starting to measure the progress students make over time. Clearly, it is important for such innovations to continue – so that they continue to provide new, interesting, original insights – for their position at the forefront of evidence-based education debates to be maintained. At the same time, the disproportionate attention PISA receives relative to other ILSAs may be unhelpful if it leads to this single study driving global education debates, rather than evidence from across multiple ILSAs being used holistically. This may suggest that the IEA should try to do even more to raise the profile of TIMSS and PIRLS so that it is seen to be on an equal footing to PISA. It would also be beneficial for the OECD to be part of such endeavours as well, highlighting the complementary evidence from across all ILSAs – not just PISA – when they engage with the media and attempt to influence education policy debate.
Supplemental Material
sj-docx-1-eer-10.1177_14749041231151793 – Supplemental material for Has Peak PISA passed? An investigation of interest in International Large-Scale Assessments across countries and over time
Supplemental material, sj-docx-1-eer-10.1177_14749041231151793 for Has Peak PISA passed? An investigation of interest in International Large-Scale Assessments across countries and over time by John Jerrim in European Educational Research Journal
Supplemental Material
sj-docx-2-eer-10.1177_14749041231151793 – Supplemental material for Has Peak PISA passed? An investigation of interest in International Large-Scale Assessments across countries and over time
Supplemental material, sj-docx-2-eer-10.1177_14749041231151793 for Has Peak PISA passed? An investigation of interest in International Large-Scale Assessments across countries and over time by John Jerrim in European Educational Research Journal
Supplemental Material
sj-docx-3-eer-10.1177_14749041231151793 – Supplemental material for Has Peak PISA passed? An investigation of interest in International Large-Scale Assessments across countries and over time
Supplemental material, sj-docx-3-eer-10.1177_14749041231151793 for Has Peak PISA passed? An investigation of interest in International Large-Scale Assessments across countries and over time by John Jerrim in European Educational Research Journal
Footnotes
Declaration of conflicting interests
The author declared no potential conflicts of interest with respect to the research, authorship, and/or publication of this article.
Funding
The author received no financial support for the research, authorship, and/or publication of this article.
Supplemental material
Supplemental material for this article is available online.
Notes
Author biography
References
Supplementary Material
Please find the following supplemental material available below.
For Open Access articles published under a Creative Commons License, all supplemental material carries the same license as the article it is associated with.
For non-Open Access articles published, all supplemental material carries a non-exclusive license, and permission requests for re-use of supplemental material or any part of supplemental material shall be sent directly to the copyright owner as specified in the copyright notice associated with the article.