
Abstract
This study examines the impact of post-secondary education on the well-being of Europeans, comparing single-item hedonic and multi-dimensional eudaimonic models of well-being, operationalized as ‘satisfaction with life’ (SWL) and ‘flourishing’. The results indicate that the impact of education varies significantly when well-being is defined from each of these two perspectives: although vocational education is not significantly associated with the SWL of women and men, it is significantly associated with the extent to which both men and women are flourishing in their lives. Tertiary education is significant across all models for both SWL and flourishing. This study highlights the importance of comprehensive conceptualizations and measurements of well-being in European educational research and public policy.
Introduction
Education is a pivotal institution in all European countries, touted as the key to individual and societal success. While educationalists emphasize post-secondary education’s ability to shape engaged and discriminating citizens, economists typically underscore the influence of education on earnings and prosperity (McMahon and Oketch, 2013; Nussbaum, 1997). Indeed, when the impacts of education are researched empirically, they often measure economic productivity rather than quality of life (Gouthro, 2010) – an intangible demand-side factor that is largely ignored (Seeberg, 2011).
Research mobilizing measures of ‘subjective well-being’ (SWB) enhances human capital approaches to educational studies (Forgeard et al., 2011; Zepke, 2013). This approach is able to examine individual welfare in non-monetary terms and examine directly what income examines indirectly: how well is this person doing in life? This is a relevant question in contemporary Europe, as ever-increasing credential levels become more expensive for individuals and governments (McMahon, 2009; van de Werfhorst, 2009). Studying the impact of education on well-being offers a new way to measure the efficacy of educational systems, a core value of the European Union. 1
There is a significant direct statistical relationship between well-being, as measured by ‘satisfaction with life’ (SWL), and highest educational credential (Blanchflower and Oswald, 2004; Dolan and White, 2007; Salinas-Jiménez et al., 2013). However, this link is contested as the effect of education alters or loses statistical significance with changing model specifications (Helliwell and Putnam, 2004; Helliwell et al., 2012). Researchers argue that education has little direct impact on SWL; rather, it affects well-being indirectly through enhanced occupational, financial, and social opportunities (Castriota, 2006; Chen, 2011; Helliwell et al., 2012). Encompassing these debates from a wider perspective, contradictory findings regarding the impact of education on well-being also result from the diverse ways in which well-being is measured (Elwick and Cannizzaro, 2017; Michalos, 2008; Ryan and Deci, 2001).
The present study builds upon the work of Huppert and So (2011, 2013), who explore the conceptual framework of ‘flourishing’ to measure well-being using the European Social Survey (ESS). Our analysis critically evaluates research that uses ‘happiness, satisfaction and (subjective) well-being indistinctly’ (Salinas-Jiménez et al., 2013: 368). Rather, we examine hedonic and eudaimonic measures of well-being separately to tease out the nuances in the education–well-being relationship, controlling for relevant variables, among women and men.
Based on contemporary research exploring different conceptions of well-being, we ask: is post-secondary education associated with well-being as measured from hedonic and eudaimonic perspectives? We hypothesize that: (a) both vocational and tertiary attainment is directly associated with well-being; and (b) the significance of this association differs by the conceptualization and measurement of well-being adopted. The driving aim is to provide a comprehensive measure of well-being that captures the relationship between post-secondary education and well-being in the European context.
In the first section, we briefly review prior research on the measurement of well-being and the relationship between education and well-being. The second section outlines our measures of well-being and the third section describes the data and methodology. The fourth section describes analyses for each measure: the flourishing components; individual items; and a combined measure. Finally, the fifth section discusses our findings, limitations, and directions for future research.
Literature review
Theories of well-being
Literature on well-being has developed different conceptual and methodological approaches, due, in part, to cross-disciplinary interest. Psychology, economics, philosophy, sociology, and education all produce unique studies of well-being. This results in a multiplicity of approaches rather than a unified theory. Guided by Sen’s (1999) argument that well-being is at its core a plural and not a singular construct, Jayawickreme et al. (2012) use the ‘engine of well-being’ as a metaphor to illustrate how these seemingly contradictory approaches can be unified. They separate theories of well-being into three major groups: (a) approaches that emphasize desire-fulfilment; (b) approaches that focus on hedonic pleasure or ‘feeling good’; and (c) approaches that propose objective lists or models of what people need in order to be well. These can be summed up succinctly as theories of ‘wanting’, liking’, and ‘needing’ (Dolan and White, 2007) and have been classified into similar categories by other researchers (Allardt, 1993; Deci and Ryan, 2006; Parfit, 1984).
Desire-fulfilment theories conceptualize well-being as the satisfaction of preferences and desires and focus on market behaviour and the individual’s possession of goods (Sen, 1979, 1987; van de Werfhorst, 2011). This basic approach is often modified, such as by the inclusion of idealized preferences to account for the influence of insufficient information on rational choice (Dolan et al., 2008).
Within the second group, hedonic theories tend to conceptualize well-being as feeling good or happy – key terms being SWL and SWB. SWL encompasses an individual’s evaluation of their life as a whole (Barrington-Leigh, 2013; Helliwell and Putnam, 2004). SWB focuses on either momentary feelings of positive emotion (Kahneman and Krueger, 2006) or the balance of positive and negative affect (Diener et al., 1999). Important critiques to the study of SWB highlight that this approach is not (typically) sensitive to the socio-economic distribution of well-being, neglects other valuable outcomes, and is easily influenced by adaptation and mental conditioning (Raibley, 2011; Sen, 1985, 1987, 1999; Stewart, 2014).
The final theoretical grouping, eudaimonic theories of well-being, focuses on objective lists of attributes needed in order to be well, especially in terms of personal meaning, purpose, and autonomy (Deci and Ryan, 2006; Ryan and Deci, 2000, 2001; Ryff and Singer, 2006). Indeed, the term eudaimonia was used by Aristotle to conceptualize and measure the extent to which an individual reaches their full potential (Aristotle, 350BC/1996; Ryan et al., 2006). One such theory, the ‘capability approach’ conceptualizes well-being as the real freedoms an individual has to attain a life he or she has reason to value (Nussbaum, 2003, 2011; Sen, 1987, 1999). Both functionings, or ‘the various things a person may value doing or being’, and capability, or ‘the alternative combinations of functionings that are feasible for her to achieve’, are key units of measurement (Sen, 1999: 75). Although this approach does not reject subjective accounts of well-being, it posits that a view of well-being that neglects what people actually do in their lives is incomplete.
Theories of flourishing
Building on these three strains of research, several theories of human ‘flourishing’ have emerged and gained empirical support. ‘Flourishing’ refers to the achievement of high levels of well-being and typically includes both hedonic and eudaimonic components (Hone et al., 2014). Keyes (2002), the first to use this term, outlines 14 components of flourishing, including positive relationships, positive affect, purpose in life, self-acceptance, social contribution, identity well-being, autonomy, and life satisfaction. These elements can be sublimated into emotional, psychological, and social well-being (Hone et al., 2014).
Likewise, Diener et al. (2010) expand their measurement of SWB to include dimensions of psychological well-being and other attributes empirically linked to high levels of SWB to create a measure of flourishing (Diener et al., 2010; Ryff and Singer, 2006). It incorporates positive relationships, engagement, purpose and meaning, self-acceptance and self-esteem, competence, optimism, and social contribution. Seligman’s (2011) measure focuses on what things people value for their own sake rather than for instrumental reasons and includes positive emotion, engagement, (positive) relationships, meaning in life, and accomplishments (Forgeard et al., 2011).
These approaches to flourishing all incorporate feeling and functioning and include positive relationships, engagement or interest, and meaning and purpose (Hone et al., 2014). Only Keyes’ (2002) original model of ‘flourishing’ includes SWL – the most common measure of well-being used in research and public policy. In regards to measurement, Diener et al. (2010) sum individual items into a composite variable of ‘psychological wealth’. Keyes (2002) and Seligman (2011) average item scores for each component and report them individually (Hone et al., 2014).
Using the same approach as Keyes (2002), another team working with the ESS Round 3 supplementary well-being module created a measurement scheme that closely aligns with these conceptualizations of flourishing by combining hedonic and eudaimonic approaches into a single, multi-dimensional measure (Huppert and So, 2011; Huppert et al., 2009). Huppert and So (2011) use thresholds to determine who is (and is not) flourishing, outlining levels across European countries. The present article, using ESS Round 6 (European Social Survey, 2012) data, utilizes a new measure based on their operationalization of flourishing and emphasizes commonalities and differences with the models described above.
Well-being and education
Educational practitioners, researchers, and policy-makers nearly always assume, explicitly or implicitly, that education 2 leads to better lives and increased well-being (Cockerill, 2014). For example, the 2009 ‘Inquiry into the Future of Lifelong Learning in the UK’ focuses explicitly on well-being as an outcome of lifelong learning. It acknowledges that while education is generally assumed to have a positive impact on individual well-being, only recently has it become a topic of research (Gouthro, 2010). The relationship between education and well-being is indeed unclear. A ‘World Happiness Report’ claims that education has no clear direct effect on happiness (Helliwell, Layard and Sachs, 2012). The authors posit that education mainly impacts well-being indirectly through income, job possibilities, and job security. They describe the positive direct effect as ‘smaller than is often claimed by educationalists’ (Layard and Sachs, 2012: 78).
There is also contradictory evidence that education improves well-being. In certain contexts, higher educational levels decrease job satisfaction (Mora and Ferrer-i-Carbonell, 2009) or can be a source of regret (Roese and Summerville, 2005). Research also suggests demographic differences. For example, highly educated men are more likely to report being depressed (Chevalier and Feinstein, 2006). Research suggests that education changes an individual’s subjective evaluation of their objective conditions and expectations (Huppert, 2009; Norwegian Social Science Data Services, 2013). Indeed, education may have little effect on life satisfaction even when it is subjectively rated as very important (Camfield and Esposito, 2014).
Despite these contradictory findings, education often has a small but significant positive effect on well-being (Blanchflower and Oswald, 2004; Salinas-Jiménez et al., 2013; Witter et al., 1984). However, how these findings should be interpreted and used in public policy is unclear. In a call for further insight into the education–well-being link, Michalos (2008) emphasizes the need for more sophisticated measures of all or part of this relationship. Heeding this advice, a complex measure of well-being as ‘flourishing’ offers a novel way to examine this association.
Well-being and socio-economic variables
Well-being has also been shown to vary with occupation, income, and socio-economic status. Typically higher income and more prestigious occupations are linked to greater well-being, and unemployment exhibits a clear negative relationship with well-being at both the individual and national levels (Bockerman and Ilmakunnas, 2006; Boyce et al., 2010; Di Tella et al., 2006; Michalos and Orlando, 2006). These findings are considered to be similar internationally.
Another element that is strongly associated with well-being is social relationships, both close personal relationships and social capital as defined by social networks, involvement, and trust (Aknin et al., 2013; Helliwell and Putnam, 2004; Sarracino, 2012). Once again, this is often viewed as one component of well-being itself, as seen in the literature on ‘flourishing’ outlined above, as well as in most eudaimonic theories of well-being.
Health exhibits a robust impact on all measures of well-being, including SWL. Indeed, it is sometimes argued to be one component of well-being (Michalos et al., 2012; Perneger et al., 2012). For example, Nussbaum (2011) includes physical health in two of her ten central capabilities, and laypeople often mention health as an important part of their well-being (Anand et al., 2005; Collomb et al., 2012; Jongbloed and Andres, 2015). Health is strongly linked to education as well (Furnée et al., 2008). Some have even argued that controlling for health may overcorrect associations, such as between income and SWL, because of its high correlation with well-being (Hou, 2014). 3
Methodology
Data
This study uses ESS data drawn from the sixth wave (European Social Survey, 2012) – a sample of more than 50,000 individuals in 27 European countries (European Social Survey, 2012, 2014). The ESS is a cross-national survey project that began in 2001 and is conducted every two years. Its goal is to explore people’s values, beliefs, and behaviours. The sixth wave included a rotating module adapted from the third wave that focused specifically on personal and social well-being. It includes measures of SWL, happiness, and numerous other aspects of well-being. It also includes measures of education, health, income level, occupational status, and family make-up, as well as many other variables.
Measures
Well-being
This study employs and compares different conceptualizations of well-being: a traditional hedonic approach; SWL; 4 and a more complex eudaimonic approach capturing ‘flourishing’. To measure flourishing, we use eleven separate items and test the data structure of this construct using a principal component analysis (PCA). Following this, we conduct regression analyses on each PCA component to examine their relationships with post-secondary education. Additionally, all eleven indicators are examined separately in a ‘dashboard approach’ (Forgeard et al., 2011). This methodology highlights the multifaceted nature of well-being and potential differences in the effects of education on each component.
Education
The measurement of education is also central to these analyses. Education is measured through four categories: lower tier upper secondary or below (comparison group); upper tier upper secondary (‘secondary education’); advanced vocational training (‘vocational education’); and lower tertiary education and above (‘tertiary education’). 5 This simplified schema highlights important qualitative differences in educational credentials while providing adequate sample sizes in all categories. Average levels of SWL and ‘flourishing’ differ significantly by highest credential for the sample as a whole (p < 0.01); however, only a very small percentage (1% and 3% respectively) of the variance is explained by education alone.
Control variables
Prior research investigating the most robust methods available to examine the determinants of well-being has shown that using analyses that assume cardinality or interpersonal ordinality of responses to well-being questions produce similar results, while including relevant control variables related to observables is very important in explaining well-being and creates stark differences in findings (Ferrer-i-Carbonell and Frijters, 2004). Four key variables that consistently relate to well-being are: age; income; marriage; and physical health. These variables, as well as gender and professional occupational status – which have significant but less consistent effects on well-being – are included in the present analyses.
Drawing on existing research, the control variables in this study are as follows: gender (comparison group is women, compared to men); income (comparison group is low, compared to medium or high); subjective 6 physical health (comparison group is low, compared medium or high); marital status (comparison group is single, compared to married or living with a partner); age and age squared; occupational status (comparison group is employed, compared to unemployed); professional status (comparison group is non-professional, defined as an International Standard Classification of Occupations score of 4,000 or higher, compared to professional, defined as an ISCO of 3,999 or lower; a missing category was also included as a separate control variable); currently in education (comparison group is not engaged in education, compared to students); and retired (comparison group is not retired). All of these except age are introduced as dummy variables. 7
Analysis
The analyses are carried out using ordinary least squares (OLS) regressions in Stata version 12 (StataCorp, 2009) with errors clustered within countries and controls included for all countries to account for national and socio-cultural differences. Post-stratification weights in combination with population size weights are applied in all analyses. The analyses are split into three parts: the first part uses the three components of ‘flourishing’ as the dependent measures of well-being; the second part predicts individual items, including SWL; and the third part uses a single flourishing composite variable to measure the impact of education on well-being. Scales 8 created from the standardized items for each well-being component are used as the dependent variables in the regression analyses. Likewise, when examining individual indicators, we use the standardized rather than raw scores. The final set of analyses uses a single composite dependent variable to represent the construct flourishing.
The first models include demographic, health, and socio-economic control variables, as well as the education variables. Further variables are added sequentially to control for occupational status. To assess the robustness of the findings, we examine results from models for each sub-component separately for women and men. Finally, all analyses are rerun using ordered probit regression to confirm the statistical significance of our results. Consistent with prior findings (Ferrer-i-Carbonell and Frijters, 2004), the ordered probit and OLS regression models are similar (i.e. the sign of the coefficients and whether a coefficient is significant). Thus, because we espouse a cardinal vision of well-being 9 in our theoretical framework of ‘flourishing’, the OLS results are reported here unless otherwise specified.
Results
Measurement of well-being
Employing a measurement model similar to that developed by Huppert and So (2013), items were chosen from the ESS that parallel the indicators used in the four extant operationalizations of flourishing (see Table 1). It includes positive emotion, positive relationships, engagement, meaning, competence, optimism, self-esteem, emotional stability, resilience and vitality (Huppert et al., 2009; Huppert and So, 2011). A measure of SWL was also included, consistent with Keyes’ (2002) original ‘flourishing’ model and the New Economic Foundation’s conceptualization of personal well-being (New Economics Foundation, 2009, 2011).
Components and indicators of flourishing.
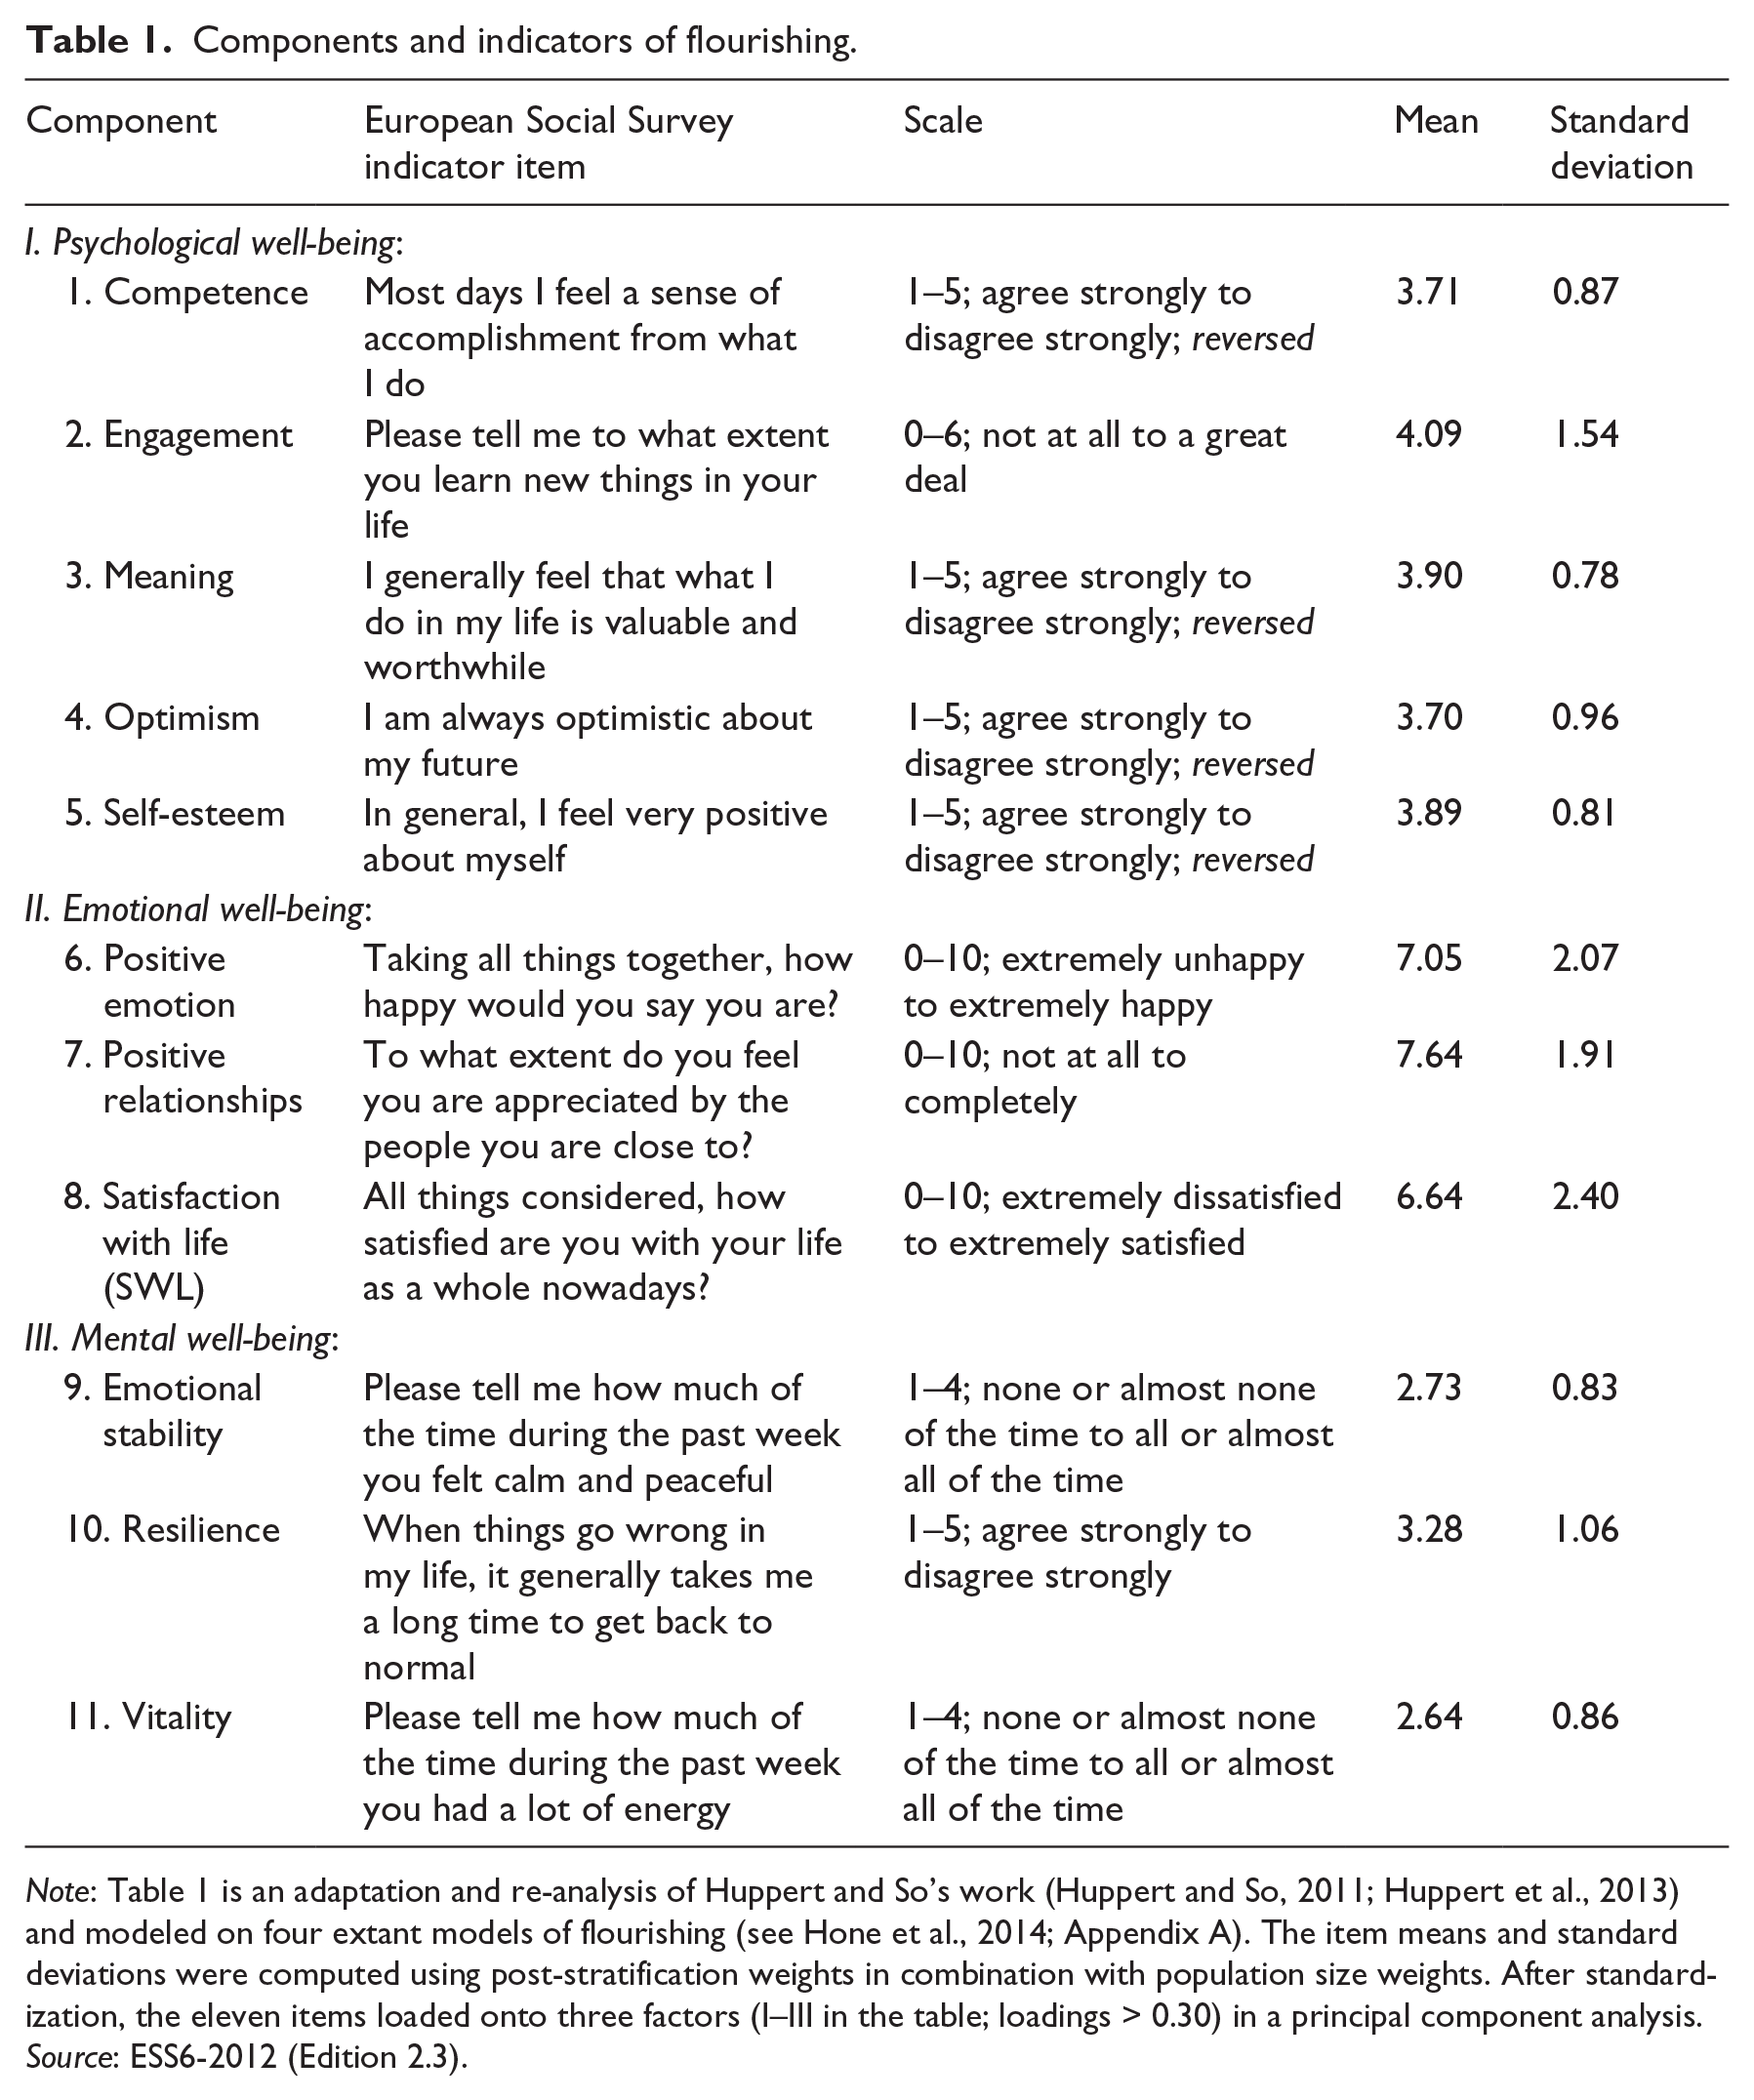
Note: Table 1 is an adaptation and re-analysis of Huppert and So’s work (Huppert and So, 2011; Huppert et al., 2013) and modeled on four extant models of flourishing (see Hone et al., 2014; Appendix A). The item means and standard deviations were computed using post-stratification weights in combination with population size weights. After standardization, the eleven items loaded onto three factors (I–III in the table; loadings > 0.30) in a principal component analysis.
Source: ESS6-2012 (Edition 2.3).
We conducted a PCA with Varimax rotation to test the overall construct of flourishing. The eleven standardized indicators (z-scores) loaded onto three factors (I–III in Table 1; loadings > 0.30), suggesting that distinct components exist within the construct of flourishing (Cronbach’s alphas > 0.60). Supplemental PCA analyses with oblimin rotation, which has the advantage of assuming that the survey items are correlated, replicated these groupings. Furthermore, confirmatory factor analyses using structural equation modeling confirm that the three-factor solution provides satisfactory fit (root mean square error of approximation = 0.07, confidence distribution = 0.97).
Initial exploratory factor analyses without rotation favoured a one-factor solution (loadings > 0.30) and the overall Cronbach’s alpha of all eleven items together was 0.82 using standardized (z) values and 0.79 using the original scores, showing a high level of internal consistency for flourishing as a whole. Thus, both the three-component solution and the existence of a larger unitary construct are supported by statistical evidence. Nevertheless, we conclude that the best-fitting model statistically and theoretically is the three-component model from the PCA with Varimax rotation that explained 55% of the variance (see Table 1).
The three components extrapolated from the PCA are: psychological well-being; emotional well-being; and mental well-being (accounting for 22%, 18%, and 15% of the total variance respectively). These statistical groupings are similar theoretically to the groupings developed by Keyes (2002). The first comprises feelings of ‘thriving’ in one’s life, such as competence, engagement, and confidence (Ryff, 1989; Ryff and Keyes, 1995). The second captures classic measures of positive affect and positive social relationships. It reflects the most common conceptualization of well-being: hedonic well-being. Finally, the third taps into feelings of peacefulness and resiliency, but also of energy in one’s life. This component embodies what is often termed ‘mental health’ and relates to psychosocial functioning and impairment (Keyes, 2002).
Although these components clearly reflect existing constructs in the flourishing literature about ‘flourishing,’ interestingly, they do not exactly mirror the groupings found by Huppert and So (2011) in their exploratory factor analyses. They found the components of ‘positive characteristics’, ‘positive functioning’, and ‘positive appraisal’. The construct of ‘positive characteristics’ comprised emotional stability, vitality, optimism, resilience, and self-esteem, ‘positive functioning’ by engagement, competence, meaning, and positive relationships, and ‘positive appraisal’ by life satisfaction and positive emotion (Huppert and So, 2011).
Clearly, these groupings are similar to those found in the current study, but our findings reflect more closely the theoretical constructs mobilized by Keyes (2002). 10 These differences are not due to the methodology used, as exploratory factor analyses on the 2012 data give a single component solution, but may be due to the fact that Huppert and So (2011) chose to categorize features dichotomously as present or absent using cut-points on the response scale. Other possible explanations include differences in the questions and in the response categories between the two survey waves, 11 as well as sampling differences in the participating countries in the 2012 wave.
Multiple well-beings: psychological, emotional, and mental
As outlined in Table 1, our measure of well-being as flourishing consists of three components:
psychological well-being, defined by competence, engagement, meaning, optimism, and self-esteem;
emotional well-being, including positive emotion, positive relationships, and SWL; and
mental well-being, measured by emotional stability, resilience, and vitality.
Table 2 presents the regression results predicting the three components. We find that tertiary and vocational education has a significant positive impact on each of the three components. The control variables show consistently significant effects across all models, with the exception of age, which only significantly predicts emotional well-being.
Education and occupation variables regressed on the multiple well-beings.
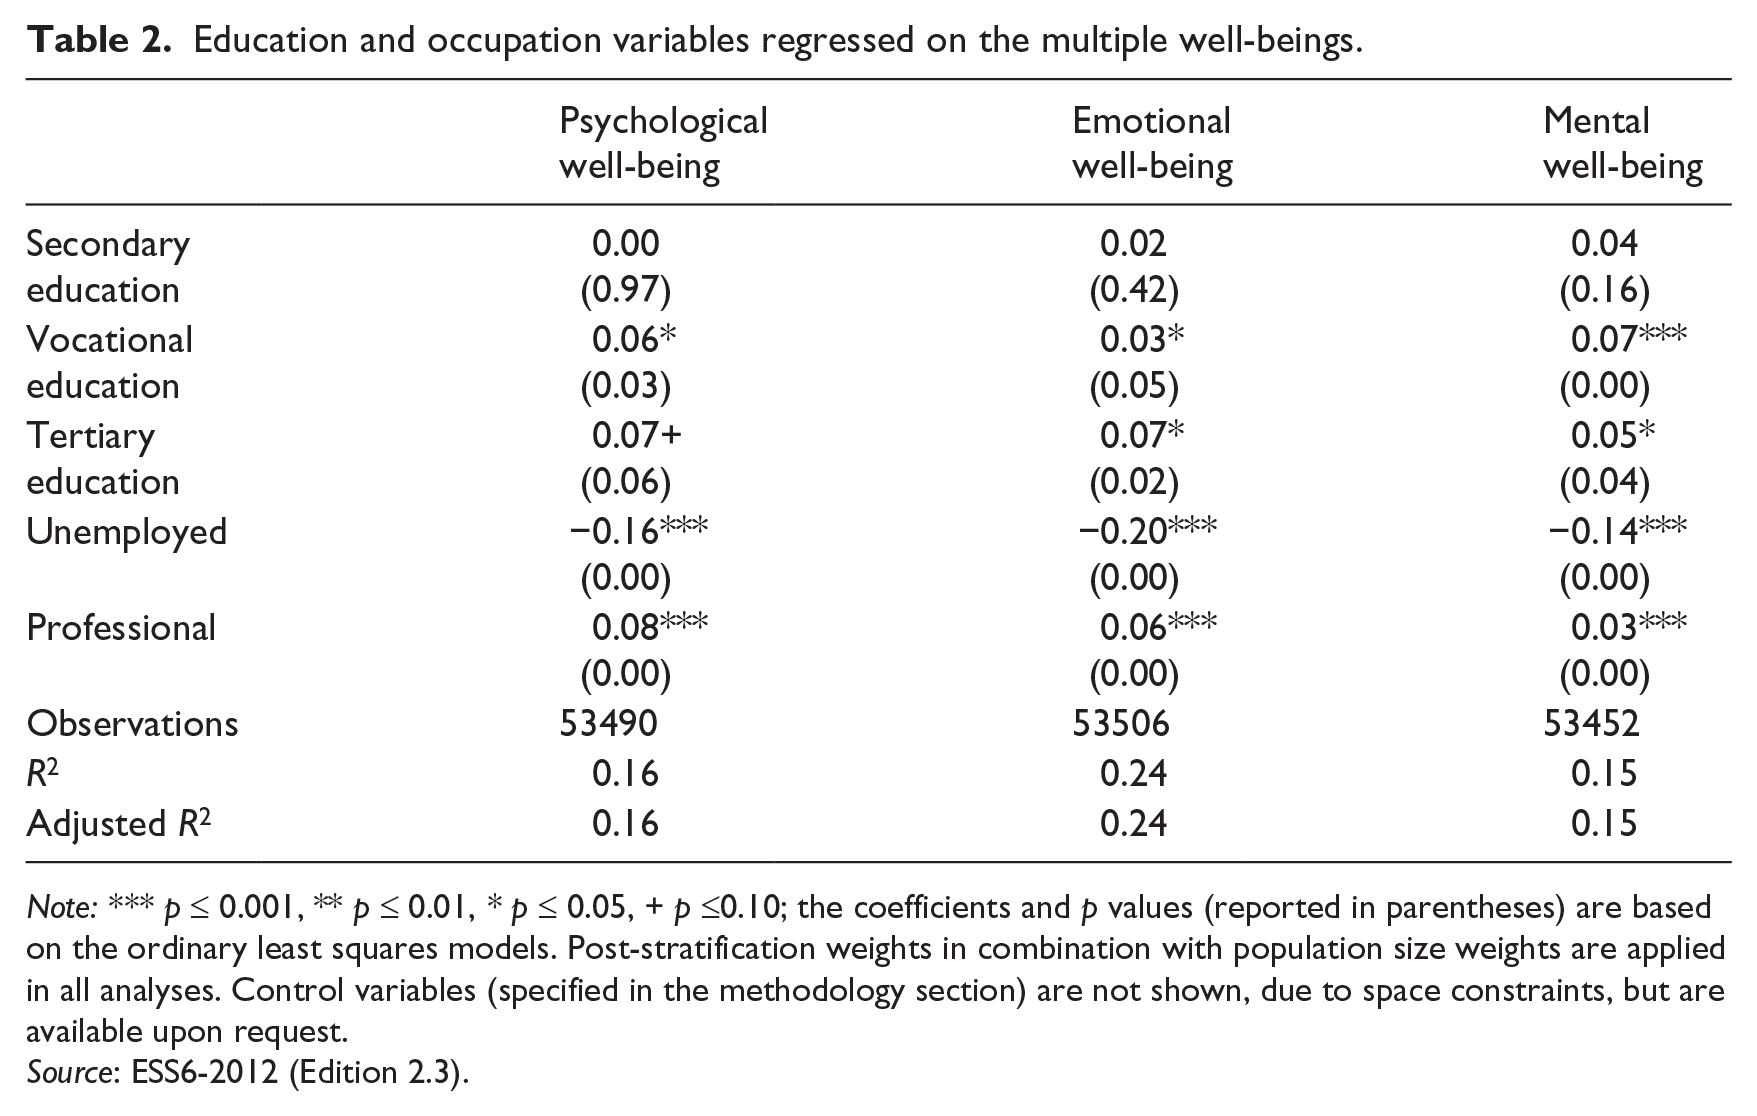
Note: *** p ⩽ 0.001, ** p ⩽ 0.01, * p ⩽ 0.05, + p ⩽0.10; the coefficients and p values (reported in parentheses) are based on the ordinary least squares models. Post-stratification weights in combination with population size weights are applied in all analyses. Control variables (specified in the methodology section) are not shown, due to space constraints, but are available upon request.
Source: ESS6-2012 (Edition 2.3).
Examining these findings in more detail, we see that psychological well-being is influenced by both vocational and tertiary post-secondary education, although vocational education clearly has a more significant effect. These items can be linked theoretically to skills within the labour market and workplace, as well as overall self-confidence that may be imparted by education. In particular, the item measuring ‘engagement’ has a strong logical connection to post-secondary education, as we discuss further below.
Both vocational and tertiary education are also significant predictors of emotional and mental well-being when compared to those with less than a secondary school education. These clear positive effects of post-secondary education on emotional well-being, net of controls, contrast with previous findings suggesting that no direct effects exist (Helliwell et al., 2012). Mental well-being, which may overlap theoretically with other constructs, such as that of ‘grit,’ is clearly an attribute that could be both taught through education and, reversely, may also increase an individual’s chances of successfully completing post-secondary education (Akos and Kretchmar, 2017).
More generally, we find that controls for unemployment and professional occupational status are highly significant and that almost all country coefficients show significant influences on well-being scores (p < 0.05). Nordic countries show significant positive effects on all measures of well-being, while Central and Eastern European countries generally show a negative association. This is consistent with other findings showing that levels of well-being are highest in ‘Social-Democratic’ countries, whereas relationships between education and well-being are strongest in ‘Conservative Welfare States’ (Jongbloed and Pullman, 2016). This may be due to the emphasis on vocational education in these countries, as well as more limited participation in tertiary education (Willemse and de Beer, 2012). Country-level differences are not explored in depth in this article but will be discussed as an important area for further study as they provide an important context for the relationship between education and well-being.
Single-item measures of well-being
When well-being is measured as SWL, income, health and marriage all show the expected significant positive relationships, while age shows the expected U-shape relationship. 12 When unemployment is introduced, it shows a highly significant negative relationship with SWL and slightly reduces the coefficients of income and post-secondary credentials. Tertiary education is a significant predictor across all models; however, vocational education does not significantly predict SWL (see Table 3).
Education and occupation variables regressed on satisfaction with life.
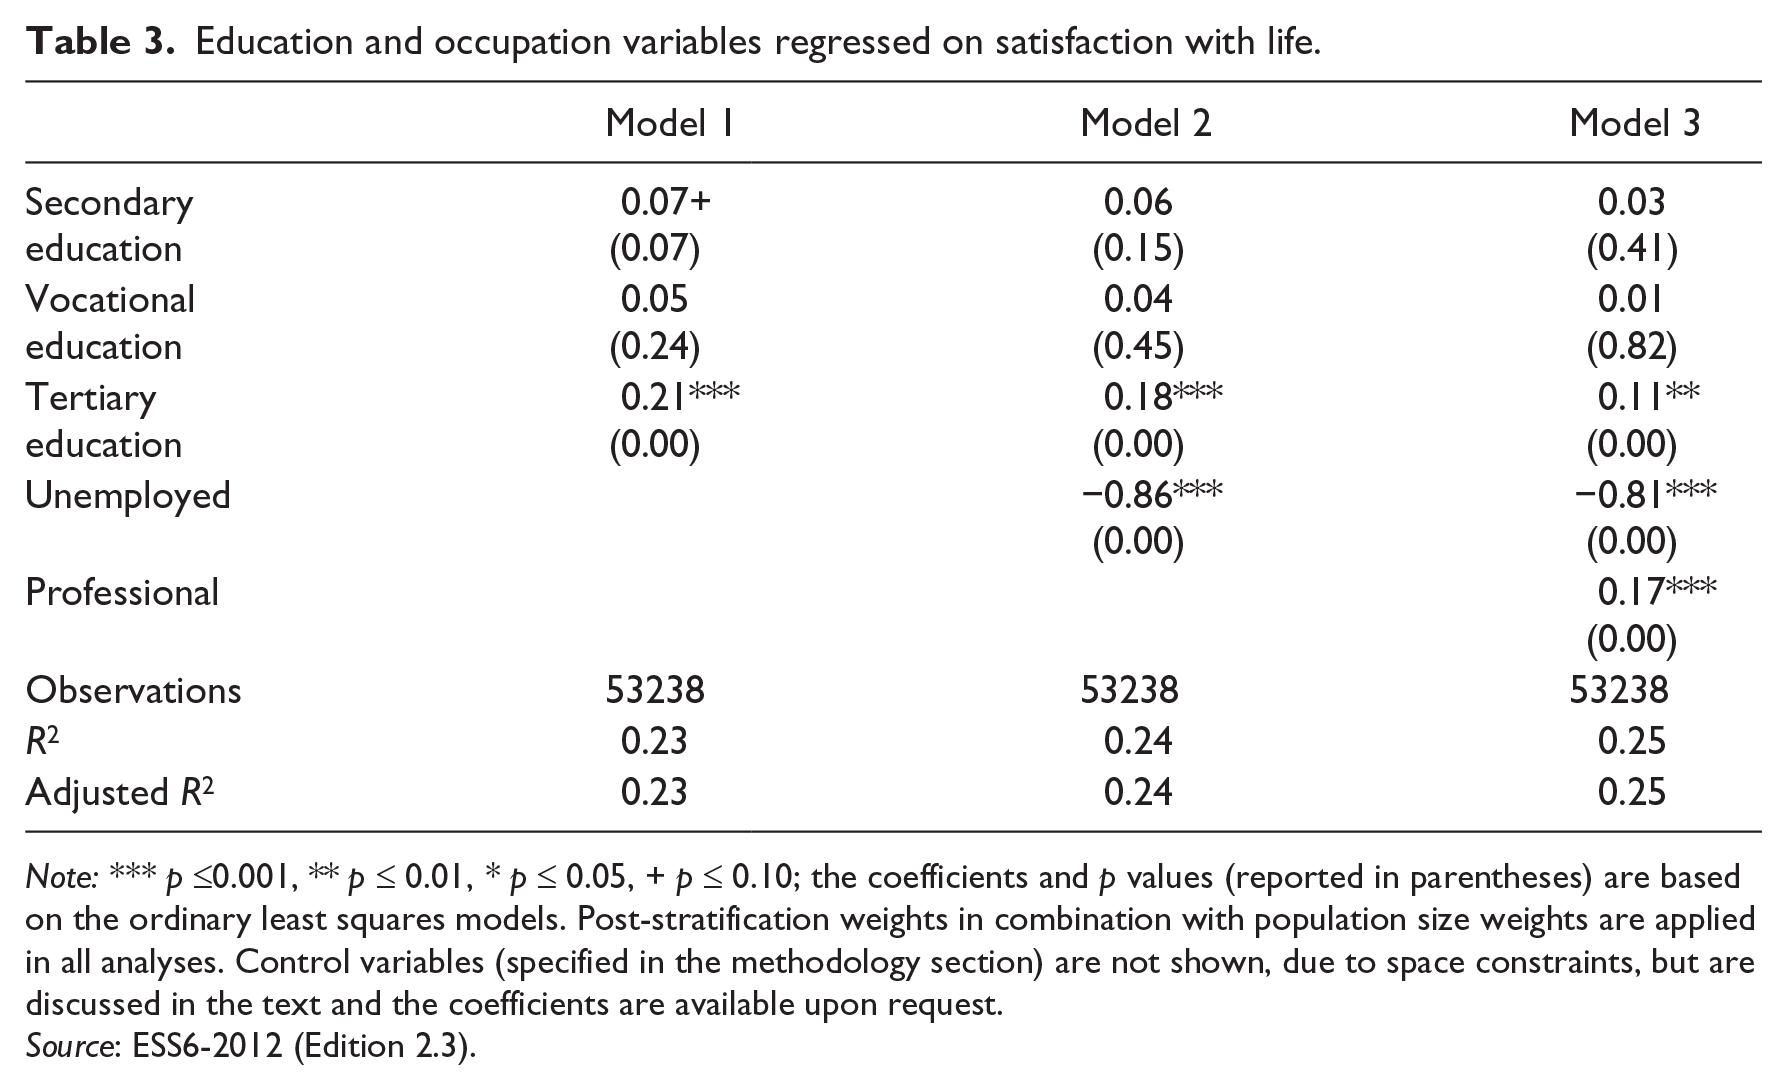
Note: *** p ⩽0.001, ** p ⩽ 0.01, * p ⩽ 0.05, + p ⩽ 0.10; the coefficients and p values (reported in parentheses) are based on the ordinary least squares models. Post-stratification weights in combination with population size weights are applied in all analyses. Control variables (specified in the methodology section) are not shown, due to space constraints, but are discussed in the text and the coefficients are available upon request.
Source: ESS6-2012 (Edition 2.3).
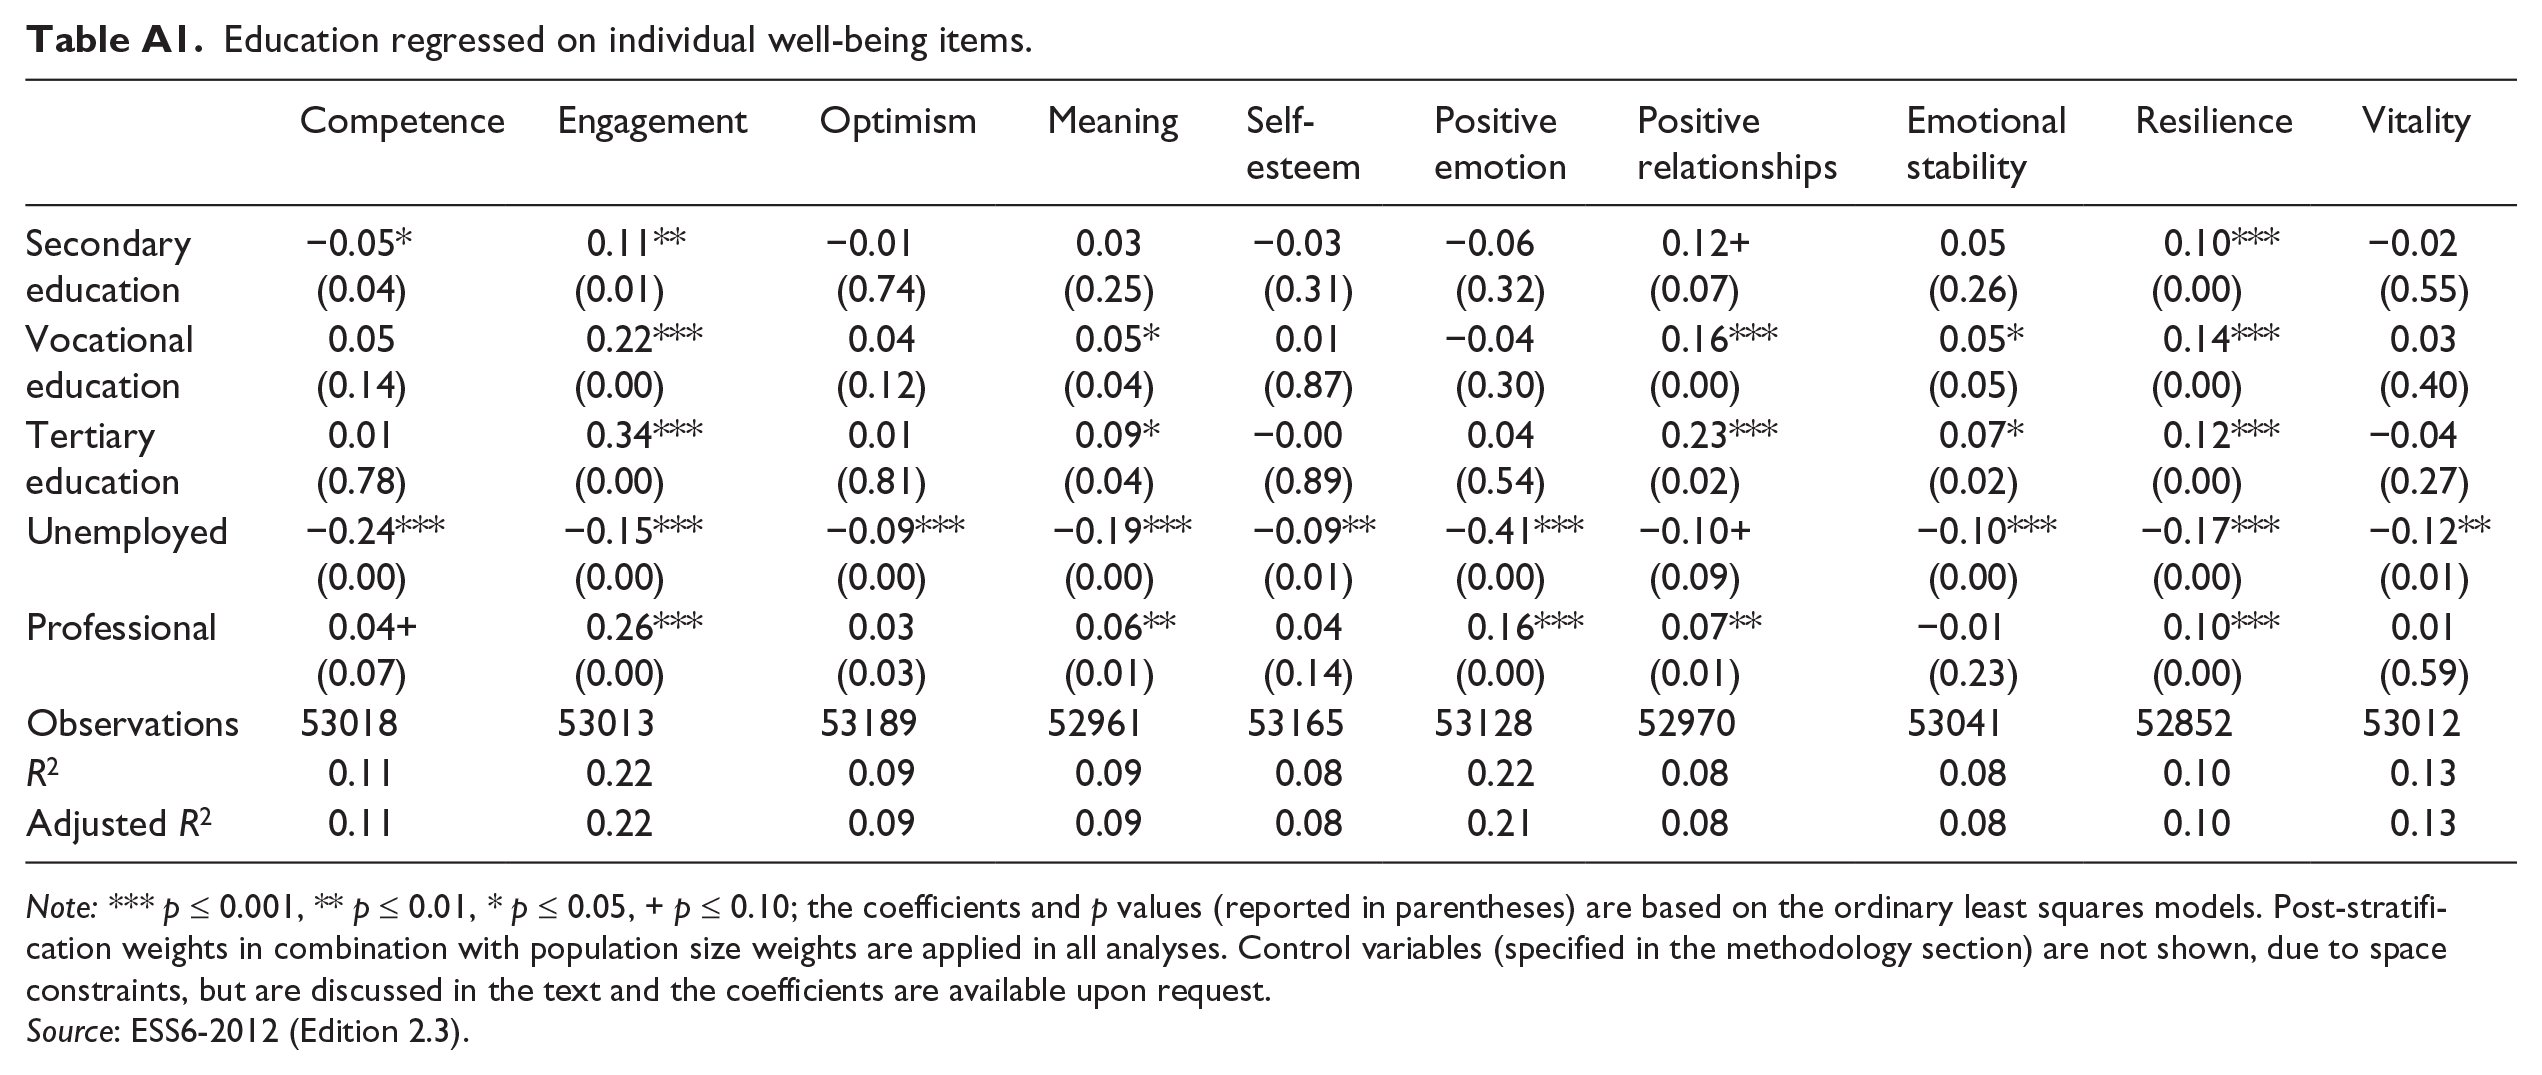
When examining the other items individually in a ‘dashboard approach’ (see Table A1 in Appendix A), one quickly sees that both vocational and tertiary education are highly significant in the models predicting engagement, as is currently being a student. This finding is intuitively appealing, as engagement measures the extent to which one learns new things in life. This suggests that higher education plays a strong role in both immediate and lifelong learning, consistent with the literature (Rubenson, 2007; Walberg and Tsai, 1983). Those currently in school have an expected highly significant positive association while those who are unemployed and retired exhibit a negative association (not shown).
Education plays a surprisingly small role in predicting competence, optimism, and self-esteem. Those with higher levels of education are not any more likely to report feeling a sense of accomplishment from what they do, although being a professional is significant in predicting a sense of competence. These non-findings are theoretically interesting, as we expected these psychological well-being variables to be more, rather than less, related to education. Indeed, much of the discourse concerning education emphasizes hope for the future, self-confidence, and enhanced abilities; however; these analyses signal that tertiary education in Europe may not be succeeding in this role.
Tertiary education significantly impacts positive relationships, as measured by the perception of being appreciated by the people one is close to. Thus, education may impact feelings of happiness through the ‘creation of social opportunities’ which make ‘a direct contribution to the expansion of human capabilities and the quality of life’ (Sen, 1999: 144). This may include enhanced social networks, more equal partnerships within marriage, and greater community participation, among other factors.
Those with higher levels of education also report significantly higher resilience scores, as defined by how long it takes one to get back to normal after things go wrong in one’s life. Being a professional and having a higher income are also significant in predicting resilience. 13 Both vocational and tertiary education are associated with greater emotional stability, while being currently in education exerts a positive influence on feelings of vitality (not shown). These findings suggest that education is associated with mental health, although reverse causation cannot be ruled out.
Flourishing
Finally, we examine the composite variable of flourishing as a single indicator. The final flourishing variable is a scale 14 constructed using the standardized scores of all the indicators listed in Table 1 and varies from −3.39 to 1.46, with a slight negative skew and a median of 0.03 (mean (M) = −0.04; standard deviation (SD) = 0.59). This continuous approach, as compared to a categorical approach, allows for a more nuanced examination of determinants of levels of flourishing, complementing prevalence studies (Huppert and So, 2011). As predicted theoretically, the SWL and flourishing items are correlated with one another: high scores on the SWL scale are generally associated with high scores on the flourishing measure (for the sample as a whole, Spearman rho = 0.65).
As shown in Table 4, vocational and tertiary education are significantly associated with the overall flourishing variable in all models. These relationships are significant even when adding all controls. However, secondary education, as compared to less than secondary education, does not predict higher levels of flourishing.
Education and occupation variables regressed on flourishing.
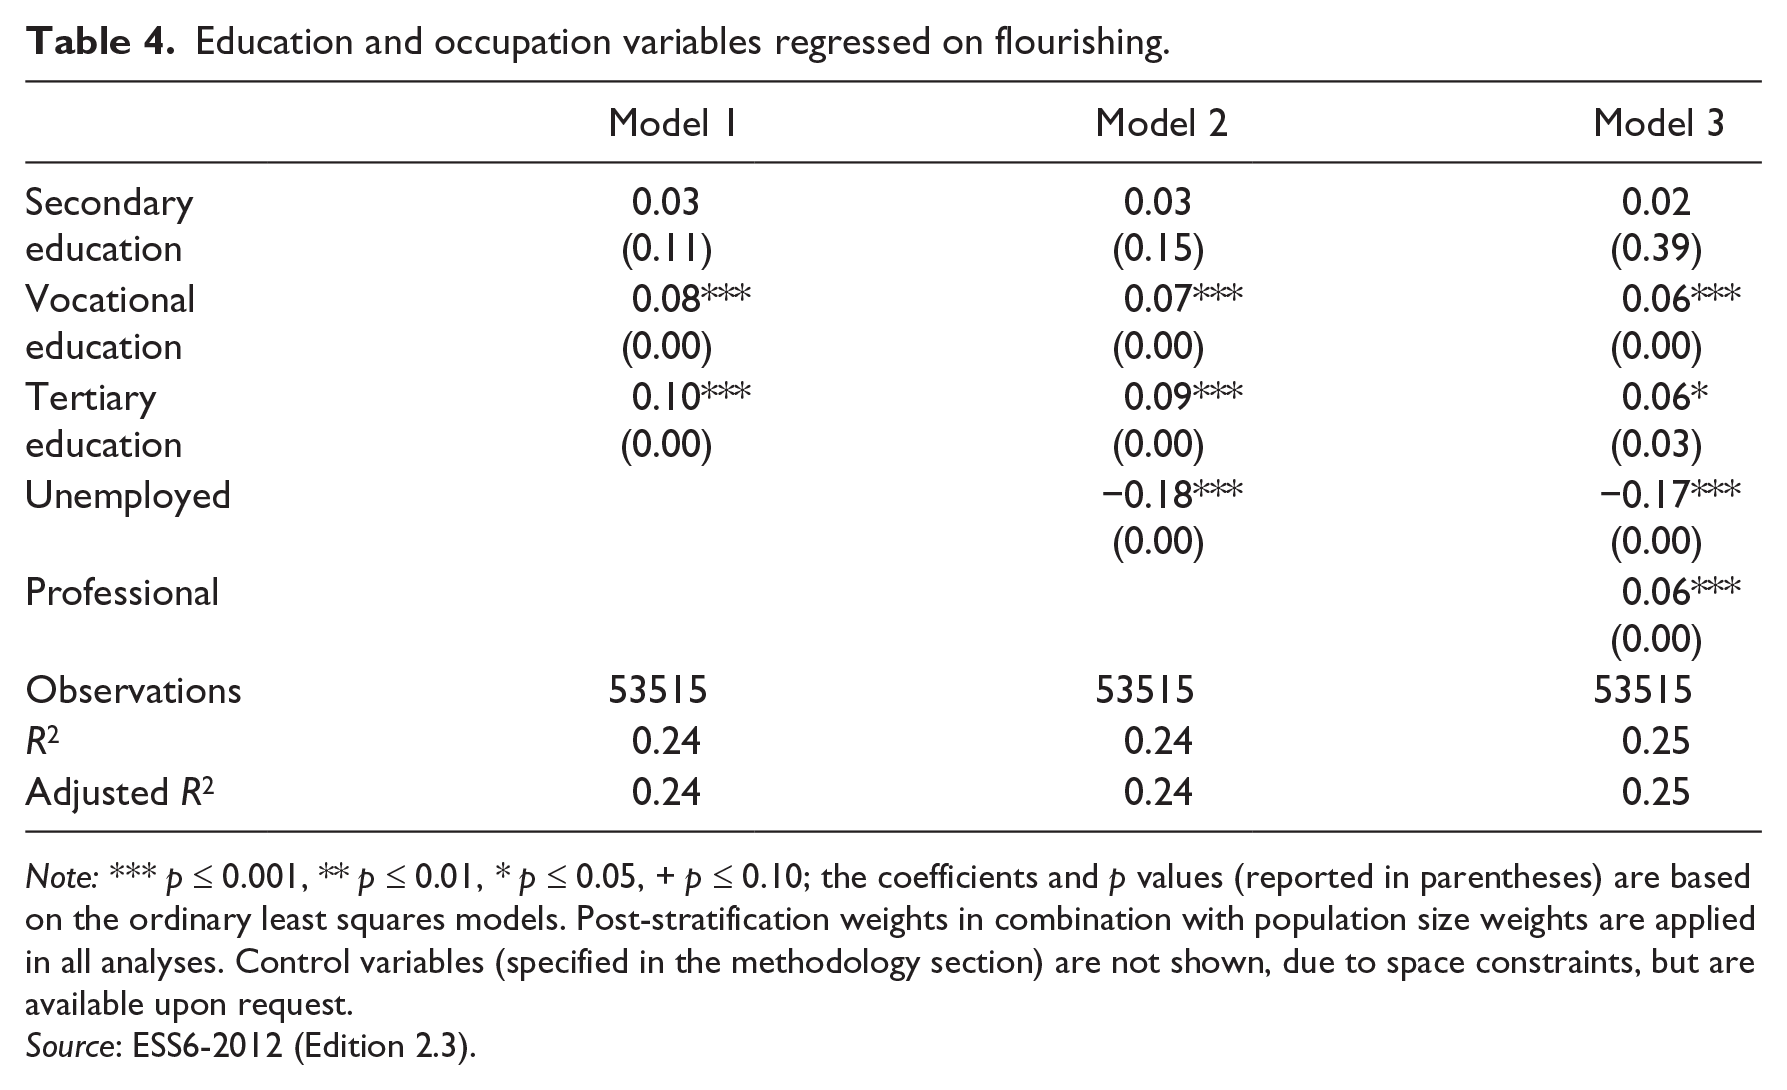
Note: *** p ⩽ 0.001, ** p ⩽ 0.01, * p ⩽ 0.05, + p ⩽ 0.10; the coefficients and p values (reported in parentheses) are based on the ordinary least squares models. Post-stratification weights in combination with population size weights are applied in all analyses. Control variables (specified in the methodology section) are not shown, due to space constraints, but are available upon request.
Source: ESS6-2012 (Edition 2.3).
These results are largely consistent with those for SWL, with one notable exception: vocational education significantly predicts higher levels of flourishing, while it did not significantly predict higher levels of SWL. Thus, previous research may have underestimated the positive effects of vocational education by limiting the definition of well-being. This adds empirical evidence to research that shows that the rewards of vocational education may be undervalued. These findings support the notion that occupational education contributes to individuals’ well-being, an important measure of their ‘worthwhileness’ (Winch, 2002).
Robustness of findings to gender differences
Average levels of SWL and flourishing differ significantly for women and men (p < 0.01). When predicting flourishing within the sub-populations of men and women, we find that both vocational and tertiary education are significant for both women and men (see Table B1 in Appendix B). In contrast, for SWL, tertiary education is significant across both groups, while vocational education is not significant for either men or women (see Table B2 in Appendix B). These findings mirror the results that we saw for the population as a whole.
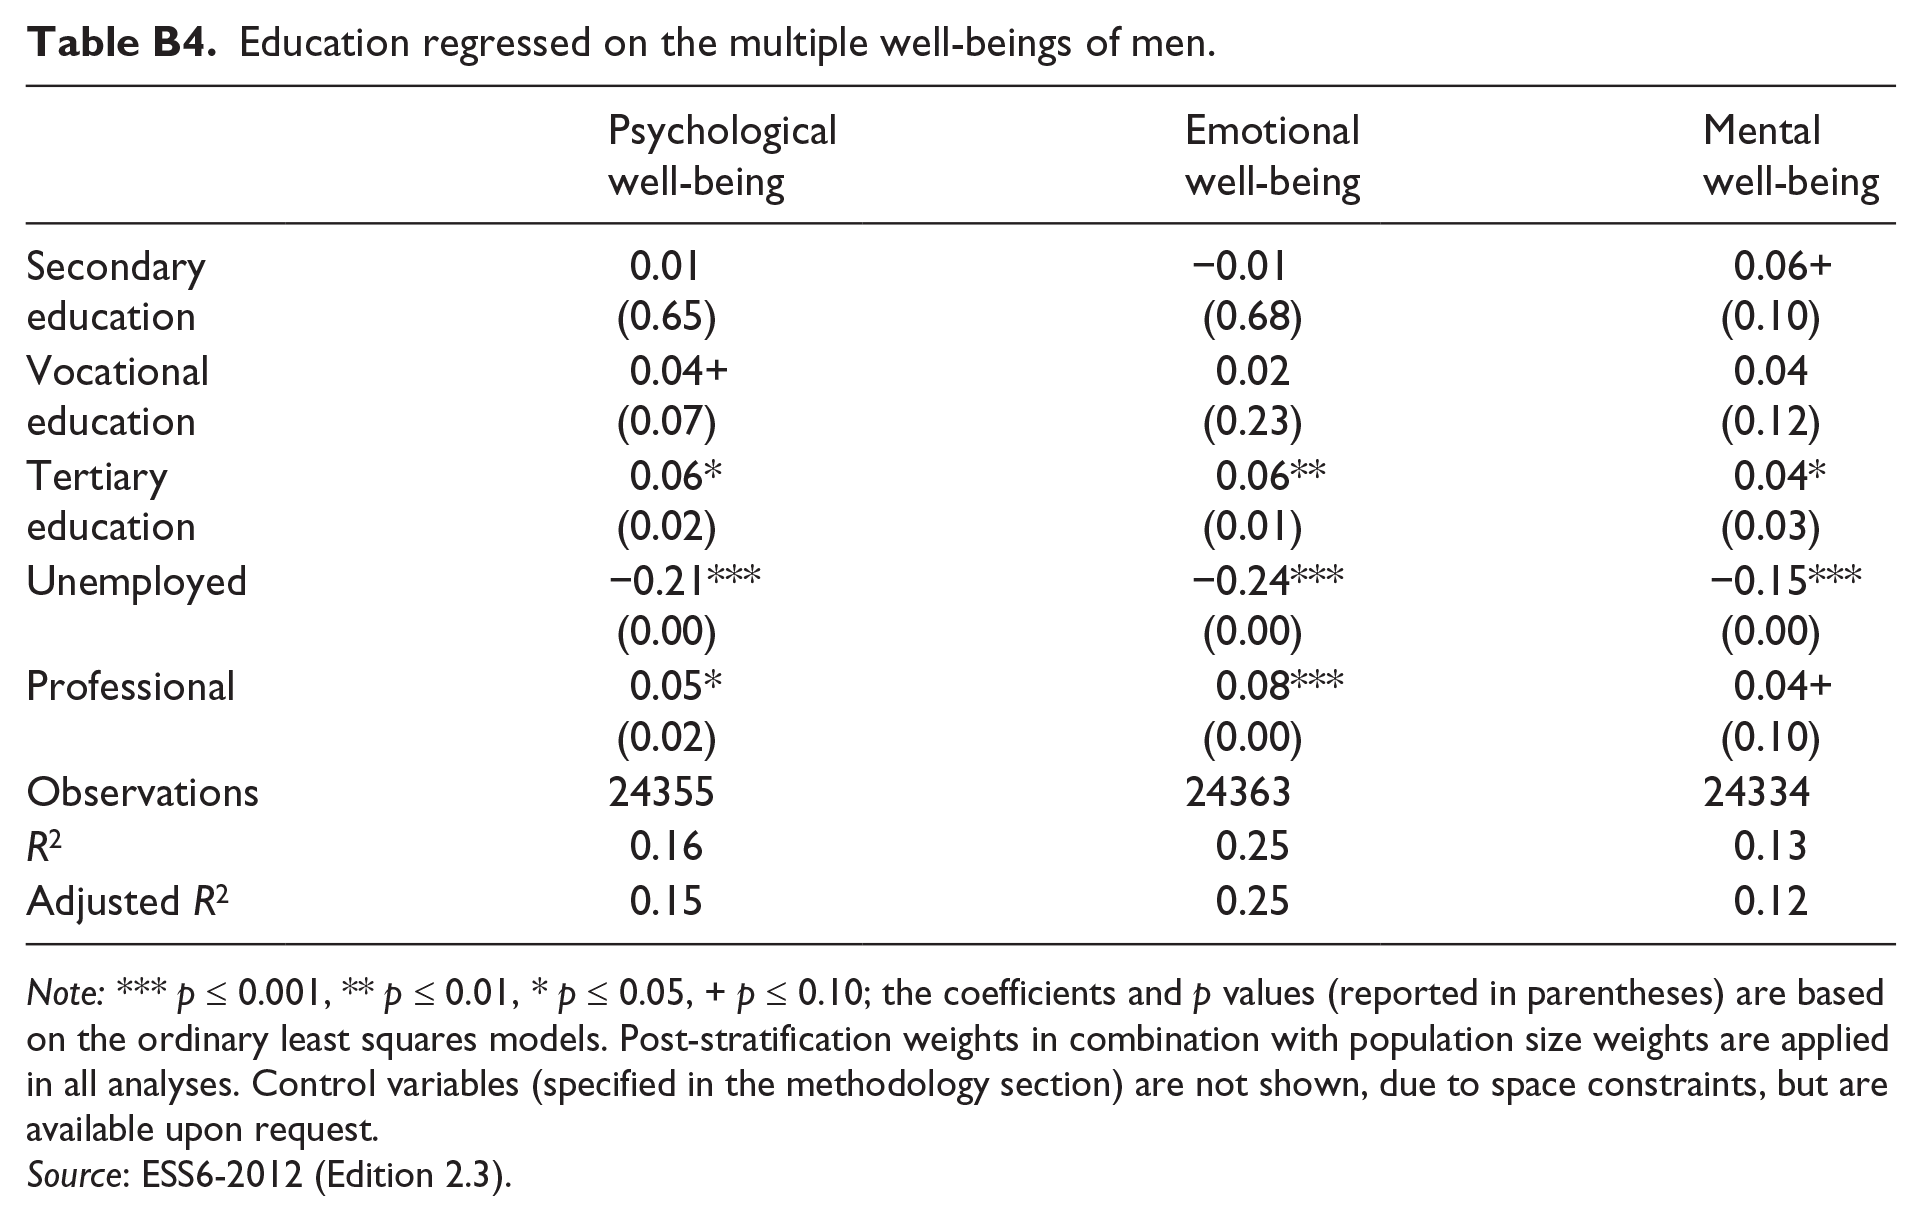
The effects of vocational and tertiary education are generally significant across the components of flourishing. However, mental well-being, as measured by emotional stability, resilience, and vitality, is more strongly linked to vocational education for women and tertiary education for men (see Tables B3 and B4 in Appendix B). This could be due to the types of jobs individuals typically perform after these two different types of post-secondary education: this component might be seen as the opposite of unhealthy stress, which is potentially more present for women in higher-status occupations demanding more investment.
Furthermore, men and women differ significantly in their levels of education and well-being: the women (M = 6.60; SD = 2.39) in our sample are significantly less satisfied than the men overall (M = 6.69; SD = 2.41), but also slightly more likely to have tertiary education than the men (18% of the women have tertiary education versus 17% of the men), equally likely to have vocational education (13%), and slightly less likely to be in a professional occupation (30% versus 29%). 15 Women’s levels of flourishing as measured by individual items and our component scales are significantly lower than those of men in this sample (p < 0.01). These findings are consistent with other studies using the ESS Wave 3 data (New Economics Foundation, 2009).
Discussion
This study combines two disparate theoretical and empirical strands: research examining the education–well-being association; and research exploring the impact of diverse operationalizations of well-being. We find that our measure of flourishing and the resulting components differ slightly from those found by Huppert and So (2011), but correspond fairly closely with Keyes’ (2002) conceptualization. Both three- and single-component solutions are supported empirically. The latter offers the advantage of parsimony, while the former allows for more nuanced assessments.
Addressing our primary objective, this study illustrates the importance of measurement models in studies examining the impact of education on well-being. Although vocational education does not significantly impact SWL, when a more comprehensive measure of flourishing is used to operationalize well-being, both vocational and tertiary education are significantly associated with well-being measured as flourishing.
There exist important differences in the impact of post-secondary education on our measures of well-being. In particular, the effects of the three components of flourishing are not uniformly robust: vocational education is more important in predicting psychological and mental well-being, while tertiary education is key in predicting emotional well-being. The fact that vocational education has a more significant effect than tertiary education on psychological well-being is an unexpected finding that potentially supports the notion of learning to ‘know what you do not know,’ which often comprises an integral part of tertiary education (Gibbs, 2014).
When examining individual measures, items measuring competence, optimism, and self-esteem, as well as positive emotion and vitality, are not significantly linked to post-secondary education. On the other hand, engagement, meaning, and positive relationships, as well as resilience, are positively associated with higher education. These differences amongst various well-being measures point to the importance of the choice of measurement when making broader claims about the overall relationship between higher education and happiness.
Previous studies may have underestimated the positive effects of post-secondary education on well-being. This has serious implications from a policy standpoint. A recent working paper attempted to rank components of the Human Development Index by their influence on happiness scores in different countries – as measured by SWL – as part of a proposal to focus monetary aid on those factors that exhibit the most robust relationship with happiness measures in each country (Kroll, 2013). Education exhibited the smallest effect – yet this may be due to how happiness was measured. The present study provides evidence that education may indeed exert a robust impact on well-being as measured by a more complex instrument. Policies incorporating ‘happiness’ or ‘well-being’ need to consider carefully how this construct is conceptualized and measured.
Limitations and areas for future research
This study is limited by the fact that, although country-effects are controlled for using dummy variables, they are not explored fully using multi-level models. Almost all countries were significant when introduced as dummy variables in OLS analyses, exhibiting both positive and negative coefficients. This raises the question of whether or not it is appropriate to assume that the relationship between education and well-being is the same in all European countries, in particular considering the significant differences in average well-being in different national educational and welfare state contexts (Jongbloed and Pullman, 2016).
When estimating intercept-only multi-level models for the two measures of well-being, the intraclass correlation coefficient (ICC), which indicates how much of the total variance can be attributed to country-level variations, for SWL is 0.18, indicating that there are indeed significant country-level variations that contribute to the total variance (Park and Lake, 2006). On the other hand, flourishing varies less between countries, with an ICC of 0.09. Thus, single-level models (as performed in this study) are likely sufficient. However, it is quite possible that the marginal effects of education on well-being differ by country, due to differences in educational systems and typical employment patterns (Estevez-Abe et al., 2001). This is an important area for future research.
Furthermore, gender differences in the impact of education on well-being need to be more fully explored. Gender differences in the education–well-being association also likely differ by country and might best be investigated with groupings of countries by welfare and labour systems related to gender (Mandel and Shalev, 2009; Siaroff, 1994). It would also be useful to run analyses separately for those who are engaged in full-time and part-time employment to tease out gender differences in education’s impact on well-being under these differing circumstances.
Finally, based on previous research, it seems likely that post-secondary education plays a different role for those who are unemployed versus those who are employed (Becchetti and Pelloni, 2013; Bockerman and Ilmakunnas, 2006; Cole et al., 2009; Michalos and Orlando, 2006). Indeed, when we examine models separately for employed and unemployed respondents (not shown), we find that tertiary education does not have a significant impact on SWL for unemployed individuals. This may be evidence for the indirect effects of education through occupation. Post-secondary education may be associated with an improvement in one’s job quality, experience of work, social connections at work, and other factors besides simply one’s occupational status as measured by professional status. Each of these limitations of the present study offers fruitful new avenues for future studies.
Conclusion
This study highlights a key challenge for future research: operationalization and measurement of well-being. The impact of education on well-being differed substantially when flourishing rather than SWL was measured and predicted. In particular, simple hedonic constructs may understate the impact of vocational education: when well-being was measured from a eudaimonic perspective, both vocational and tertiary education played an important role in predicting well-being across all models.
This clearly corroborates the hypothesis of Michalos (2007) who suggested that the lack of consistent and significant findings for the impact of education on well-being was due to measurement problems in both the independent variable and dependent variable. Thus, we find a possible reason for the fact that education, while highly valued in theories of well-being, has not shown a strong empirical relationship to well-being. Theorists in the eudaimonic tradition or using the capability approach view well-being in a complex, plural sense, while the extensive empirical work done in the economic literature, which tends to use education as a demographic control variable, measures well-being in a hedonic way and finds only very small or insignificant effects. Therefore, inconsistencies in the literature reflect differences in the theoretical understandings of these constructs and may not provide accurate comparisons of the relationship between these two variables. Future studies and policies need to be sensitive to these issues of conceptualization, operationalization, and measurement.
Footnotes
Appendix A
Education regressed on individual well-being items.
| Competence | Engagement | Optimism | Meaning | Self-esteem | Positive emotion | Positive relationships | Emotional stability | Resilience | Vitality | |
|---|---|---|---|---|---|---|---|---|---|---|
| Secondary education | −0.05*
(0.04) |
0.11**
(0.01) |
−0.01 (0.74) |
0.03 (0.25) |
−0.03 (0.31) |
−0.06 (0.32) |
0.12+ (0.07) |
0.05 (0.26) |
0.10***
(0.00) |
−0.02 (0.55) |
| Vocational education | 0.05 (0.14) |
0.22***
(0.00) |
0.04 (0.12) |
0.05*
(0.04) |
0.01 (0.87) |
−0.04 (0.30) |
0.16***
(0.00) |
0.05*
(0.05) |
0.14***
(0.00) |
0.03 (0.40) |
| Tertiary education | 0.01 (0.78) |
0.34***
(0.00) |
0.01 (0.81) |
0.09*
(0.04) |
−0.00 (0.89) |
0.04 (0.54) |
0.23***
(0.02) |
0.07*
(0.02) |
0.12***
(0.00) |
−0.04 (0.27) |
| Unemployed | −0.24***
(0.00) |
−0.15***
(0.00) |
−0.09***
(0.00) |
−0.19***
(0.00) |
−0.09**
(0.01) |
−0.41***
(0.00) |
−0.10+ (0.09) |
−0.10***
(0.00) |
−0.17***
(0.00) |
−0.12**
(0.01) |
| Professional | 0.04+ (0.07) |
0.26***
(0.00) |
0.03 (0.03) |
0.06**
(0.01) |
0.04 (0.14) |
0.16***
(0.00) |
0.07**
(0.01) |
−0.01 (0.23) |
0.10***
(0.00) |
0.01 (0.59) |
| Observations | 53018 | 53013 | 53189 | 52961 | 53165 | 53128 | 52970 | 53041 | 52852 | 53012 |
| R 2 | 0.11 | 0.22 | 0.09 | 0.09 | 0.08 | 0.22 | 0.08 | 0.08 | 0.10 | 0.13 |
| Adjusted R2 | 0.11 | 0.22 | 0.09 | 0.09 | 0.08 | 0.21 | 0.08 | 0.08 | 0.10 | 0.13 |
Note: *** p ⩽ 0.001, ** p ⩽ 0.01, * p ⩽ 0.05, + p ⩽ 0.10; the coefficients and p values (reported in parentheses) are based on the ordinary least squares models. Post-stratification weights in combination with population size weights are applied in all analyses. Control variables (specified in the methodology section) are not shown, due to space constraints, but are discussed in the text and the coefficients are available upon request.
Source: ESS6-2012 (Edition 2.3).
Appendix B
Education regressed on the multiple well-beings of men.
| Psychological well-being | Emotional well-being | Mental well-being | |
|---|---|---|---|
| Secondary education | 0.01 (0.65) |
−0.01 (0.68) |
0.06+ (0.10) |
| Vocational education | 0.04+ (0.07) |
0.02 (0.23) |
0.04 (0.12) |
| Tertiary education | 0.06*
(0.02) |
0.06**
(0.01) |
0.04*
(0.03) |
| Unemployed | −0.21***
(0.00) |
−0.24***
(0.00) |
−0.15***
(0.00) |
| Professional | 0.05*
(0.02) |
0.08***
(0.00) |
0.04+ (0.10) |
| Observations | 24355 | 24363 | 24334 |
| R 2 | 0.16 | 0.25 | 0.13 |
| Adjusted R2 | 0.15 | 0.25 | 0.12 |
Note: *** p ⩽ 0.001, ** p ⩽ 0.01, * p ⩽ 0.05, + p ⩽ 0.10; the coefficients and p values (reported in parentheses) are based on the ordinary least squares models. Post-stratification weights in combination with population size weights are applied in all analyses. Control variables (specified in the methodology section) are not shown, due to space constraints, but are available upon request.
Source: ESS6-2012 (Edition 2.3).
Acknowledgements
I would like to thank the anonymous reviewers, Lucy Hone, and Ashley Pullman for their insightful comments and helpful suggestions on the manuscript.
Declaration of Conflicting Interest
The author(s) declared no potential conflicts of interest with respect to the research, authorship, and/or publication of this article.
Funding
The author(s) disclosed receipt of the following financial support for the research, authorship, and/or publication of this article: This research was supported by the Social Sciences and Humanities Research Council of Canada.