
Abstract
The article argues that current discussions about governance through data in education can be fruitfully extended through: (1) the establishment of connections with wider debates about the role of commensuration processes and governmentality in the recreation of education systems; (2) greater emphasis on the ‘artefacts’ through which data – increasingly in the form of digital data – is collected, displayed and retrieved; and (3) the strategies of alignment and resistance that social actors adopt to deal with the increase in data availability and capacity for the automated interrogation of that data. The article concludes that these artefacts and strategies are providing a wide set of ‘active’ social actors with new resources in, and arenas for, their struggles for economic as well as social advancement, processes of self-monitoring and also, crucially, of self-formation. The article focuses on the interplay and tensions between governments and bureaucracies, private companies, education institutions, and various types of ‘active’ individuals (the individual customer, the individual manager and the individual worker) in the process of surveillance and recreation of education through digital data.
Introduction
The education policy literature has devoted significant attention to the soaring role of data as part of an array of public policy mechanisms based around harmonisation, comparison and the production of success and failure stories (Grek, 2009; Ozga, 2009). The emphasis is on public policy and the state machinery’s use of data to legitimise policy and steer practice in specific directions. While the increasingly intensive use of data by government in educational matters has been a feature since at least the 1800s, it is argued that in the late 20th century it led to the replacement of traditional forms of government through centralised and rule-governed processes by ‘goal-governed steering of outputs and outcomes, accompanied by the monitoring of targets’ (Ozga, 2009: 149). Such change is enabled by the availability, increasing standardisation, harmonisation and rapid flow of data. The interest of various stakeholders in data-work has increased with digitalisation and its promises to bring about enormous efficiency gains and drastically reduce the costs of data collection and analysis. McKinsey’s Global Institute has estimated that more ‘open data’ practices in education alone have the potential to unlock economic value around US$1 trillion annually through improvement in instructional outcomes by means of the identification of more effective pedagogies and cost-savings through more efficient administration (Manyika et al., 2014).
This article interrogates the emphasis of the education policy literature on ‘government and governance’ through (quantitative) data, and proposes an understanding of the ways in which data digitalisation is starting to affect education based on the concept of governmentality. The paper looks, specifically, at two elements that are largely missing in the governance through data literature: the artefacts for the collection, cleaning, classification, display and retrieval of education-related data and the strategies that social actors at various levels are adopting to navigate the current ‘data deluge’ (The Economist, 2010). This enables us to go beyond narratives of compliance, surveillance, control and acceptance – prevalent in the literature – to identify a range of resistance strategies used by social actors as well as possibilities for the formation of new kinds of agency and subjectivity.
We argue that social actors’ relationships are being qualitatively reshaped and changed by digitalisation, an aspect that has been largely neglected in extant literature on the governing through data. Digital artefacts and strategies are providing ‘active’ social actors with new resources and new arenas for their struggles for economic or social advancement, processes of self-monitoring and also of self-formation. In doing so, we try to avoid overly structural understandings of social systems by underlying forms of creative dynamics that can occur within hegemonic spaces (Rose, 2002). We also aim to avoid technological determinism, whereby technology determines changes in social relations. Instead, we see the use of technology as socially constructed: human action shapes technology (Bijker et al., 2012). Finally, it should be clarified that the digital turn does not imply an equal playing field. Access to data, the capacity to use digital technologies and the possibility to benefit from the use of new educational data at individual, institutional and national level are unequally distributed; creative opportunities will still be differentially apportioned.
The remainder of the article proceeds in six stages. The main arguments and foci of the governing through data literature are reviewed in the next section. The third section introduces the concept of governmentality. The fourth looks at the digital turn, the fifth at artefacts and the sixth at strategies. The seventh section concludes.
‘Governing through data’: the argument
Governance makes reference to the mechanisms ‘employed to bring order to a population of actors, by adaptation, negotiation, order and obedience; in a narrow sense, it refers to the different forms of purposeful acting of collective concerns’ (Amos, 2010: 24 – our emphasis; see also Mayntz, 2009). The governance literature has contributed to a shift in the focus of study from government as an institution – the state apparatus – to a task (governance). Various stakeholders are implicated in this task (see Rosenau and Czempiel, 1992), although the state has a strategic and central role, which makes studies of governance primarily concerned with the diffusion or transfer of political authority and responsibility from the centre to a range of actors and networks (Sending and Neumann, 2006).
In educational research, governance frameworks have been used to analyse ‘instruments and ways of steering, new forms of providing and organising educational services’ (Amos, 2010: 24). This shift is one from centralised, vertical and hierarchical forms of regulation into polycentric, heterarchical, horizontal, (de)regulated, devolved and decentralised governance structures, but within the context of a strong central steering (Ozga, 2009: 151 and 157). This analytical shift has provided a number of new insights into the social and organisational interactions that characterise policy-making in modern times. However in spite of the calls from the governance literature to examine processes of horizontal networks, the role of social actors beyond the state apparatus has received relatively scarce attention in the literature on data-work in education policy. Lawn (2011) looks at how data ‘travels’ between schools and government through private companies, and Williamson (2015a) at policy-labs, but these tend to be exceptions. The centre of policy, in particular ‘national government’, retains a predominant position:
Attempts by the centre to use governance forms to recover or promote trust through more bottom up and self-generated forms of evaluation of performance are undermined by the weight of the work of data production and use and the continued effects of managerial accountability on political or professional accountability. (Ozga, 2009:159)
As Ozga concludes in her study of the governing education through data in England:
the dependence created by central regulation, especially through data use, has established patterns of interaction between the centre, the locality and the schools that invoke the rhetoric of self-evaluation but retain key elements of managerial accountability or ‘answerability’. In this way the possibility of building ‘strong accountability’ around social goals and democratic processes in policy for social outcomes is reduced. This situation arises because of the continued influence of the centre on data production and use and the consequent restriction of the role of Local Education Authorities (LEAs) to that of data provider. (Ozga, 2009: 152)
This passage reflects the pivotal concern of this literature with themes related to student assessment, benchmarking exercises and accountability to government. The main activities through which the growth of data operates at the national level are seen to be: first, the measurement of attainment levels (pupils, schools, system) through national testing and the creation of targets in relation to those tests; and, second, inspection of schools by means of a common framework (Ozga, 2009). As such, much has been written on the effects that comparison, the creation of global benchmarks and the increasing use data have on the governance of the education system (Lingard, 2011; Martens, 2007; Nóvoa and Yariv-Mashal, 2003; Ozga, 2009; Ozga et al., 2011), ‘governing through data’, ‘policy in numbers’ (Lingard, 2011) or, more radically, ‘governing by numbers’ (Grek, 2009). The emphasis of these studies is, largely, on data-mediated interactions and how these lead to changes in the relation between central government, educational institutions, local government and international organisations (in particular the OECD and the European Commission). These interactions are shaped by the emergence of various new types of inspection and performance monitoring enabled by new and invigorated forms of data collection. On the whole, this literature concludes that increases in data availability and intelligence have unbalanced governing structures and resulted in highly centralised systems of steering at the national and international level (Grek, 2009), with local authorities playing a more peripheral role than in the past (see Ozga, 2009).
The national level steers, the local level supervises and applies pressure on schools, which compile the data. With the production and use of data comes government directed self-evaluation and the production of improvement plans in an inescapable way. These processes steer towards the convergence of educational discourses, practices, meanings and performances. They take place within countries and also at regional and global levels. In the European Union (EU), multilateral surveillance or ‘soft regulation’ (Jacobsson, 2004) operate through the definition of common objectives in education, benchmarking, the production of national action plans, national implementation of policy measures and reporting for multilateral discussion and public scrutiny (Nóvoa, 2002; Souto-Otero, 2013; Souto-Otero et al., 2008).
In the governance literature, the centre does or manages the ‘data work’, it is the centre who uses governance forms. While this literature has recognised that digitalisation modifies the ways in which central government operates in the use of data (Ozga, 2014), our aim here is to direct the attention to a more complex constellation of relationships opened up by the increased availability of data through digital means.
From governance to governmentality
While the governance and governmentality literature have many commonalities (Amos, 2010), there are also differences in their focus and approach. Thus, the concept of governmentality both supplements and challenges the governance literature (Sending and Neumann, 2006). In the governmentality frame, the focus is not on the transfer of power from government to non-state institutions (an action of government upon others). Rather, governmentality implies a change of logic, whereby civil society becomes an object and a subject of government, a central feature of the way in which power operates in society. Governmentality refers us to reconfigurations in the balance of power, but also in the location of its sources and its very nature.
Governmentality can be understood as the guidance of the behaviours of others, what Foucault (1982) called ‘the conduct of the conduct’, a term that ranges from the government of oneself to the government of others. It is a process in which ‘government’ and power are displaced from their classic territory – the state apparatus – and into the social body:
In the broad meaning of the word, governing people is not a way to force people to do what the governor wants; it is always a versatile equilibrium, with complementarity and conflicts between techniques which assure coercion and processes through which the self is constructed or modified by himself. (Foucault, 1993: 204)
This results in increased attention to how certain instruments, techniques, procedures and levels of application define governmental rationalities (Foucault, 1977). The governmentality model stresses the shaping of the field of possibilities. The techniques to effect this, as noted by Thompson (2003), are numerous:
inciting, inducing, releasing or contriving, making conditions more favourable or less so, and, in the extreme, compelling or forbidding the action of another absolutely. What each of these practices seeks to do is to establish an arena of possible actions such that another’s behavior has a certain trajectory, a set of preformed limits, a directionality. This creates a field within which action can occur. The other whose conduct is being shaped is taken to be capable of acting in accordance with the range of options or trajectories arrayed before them. Consequently, Foucault is able to claim that freedom, rather than simply resistance, is intrinsic to the exercise of power itself (…) freedom may well appear as the condition for the exercise of power (at once its prerequisite, since freedom must exist for power to be exerted, and also its permanent support since, if it were entirely concealed in the power that exerts itself on it, it would, in fact, disappear and should find itself a substitute in the pure and simple coercion of violence). (Thompson, 2003: 121)
As such, our analysis does not focus primarily on policy actors and institutions, but gives a central place to a wider set of social actors –see ‘The digital turn’ – as objects and subjects of government, and to the specific techniques that they employ for navigating policy and social spaces. This directs us to a study of the artefacts used to do data-work and the strategies of social actors in dealing with those artefacts as they are introduced in social relations (economic, political, pedagogical, etc.) – see ‘Artefacts’ and ‘Strategies’. These aspects have tended to be downplayed in the education policy literature, given its specific focus on the consequences of the use of data for the relationships between schools, central and local government and international organisations.
The digital turn
The digital turn implies a dual process of amplification in relation to data-work, one on the production side and one on the consumption side. On the production side, digitalisation has brought about unprecedented possibilities for data generation, collection, processing and display by various social actors, not just government. This is clearly seen, for example, in the data extracted from MOOC participants’ activities and the crawling of websites to obtain real-time information for labour market analytics. The scale and efficiency of such data collection is only possible thanks to digitalisation. The costs of consumption are reduced in terms of time, effort – including through data visualisation techniques – and often also in financial terms – open data. Digitalisation also enables targeting and customisation in the analysis of data, the opening of an exchange between the user and the data that was not possible before. The result is that social actors can now use more data, can use it in targeted ways and in real-time or almost real-time.
Participants in the resulting ‘data deluge’, include governments and international organisations, private companies (e.g. those working on search engines, learning and labour market analytics, school data management systems), education institutions and different manifestations of the ‘active subject’ (the individual-learner sometimes called the individual education ‘customer’, individual-manager and individual-worker). It is, in short, a social, rather than exclusively ‘policy’, trend. But there are other differences that the augmented use of data enabled by digitalisation brings about, as noted in Table 1 – which outlines differences in terms of emphasis rather than strict dichotomies.
The classic and digital models of the use of data in education compared.
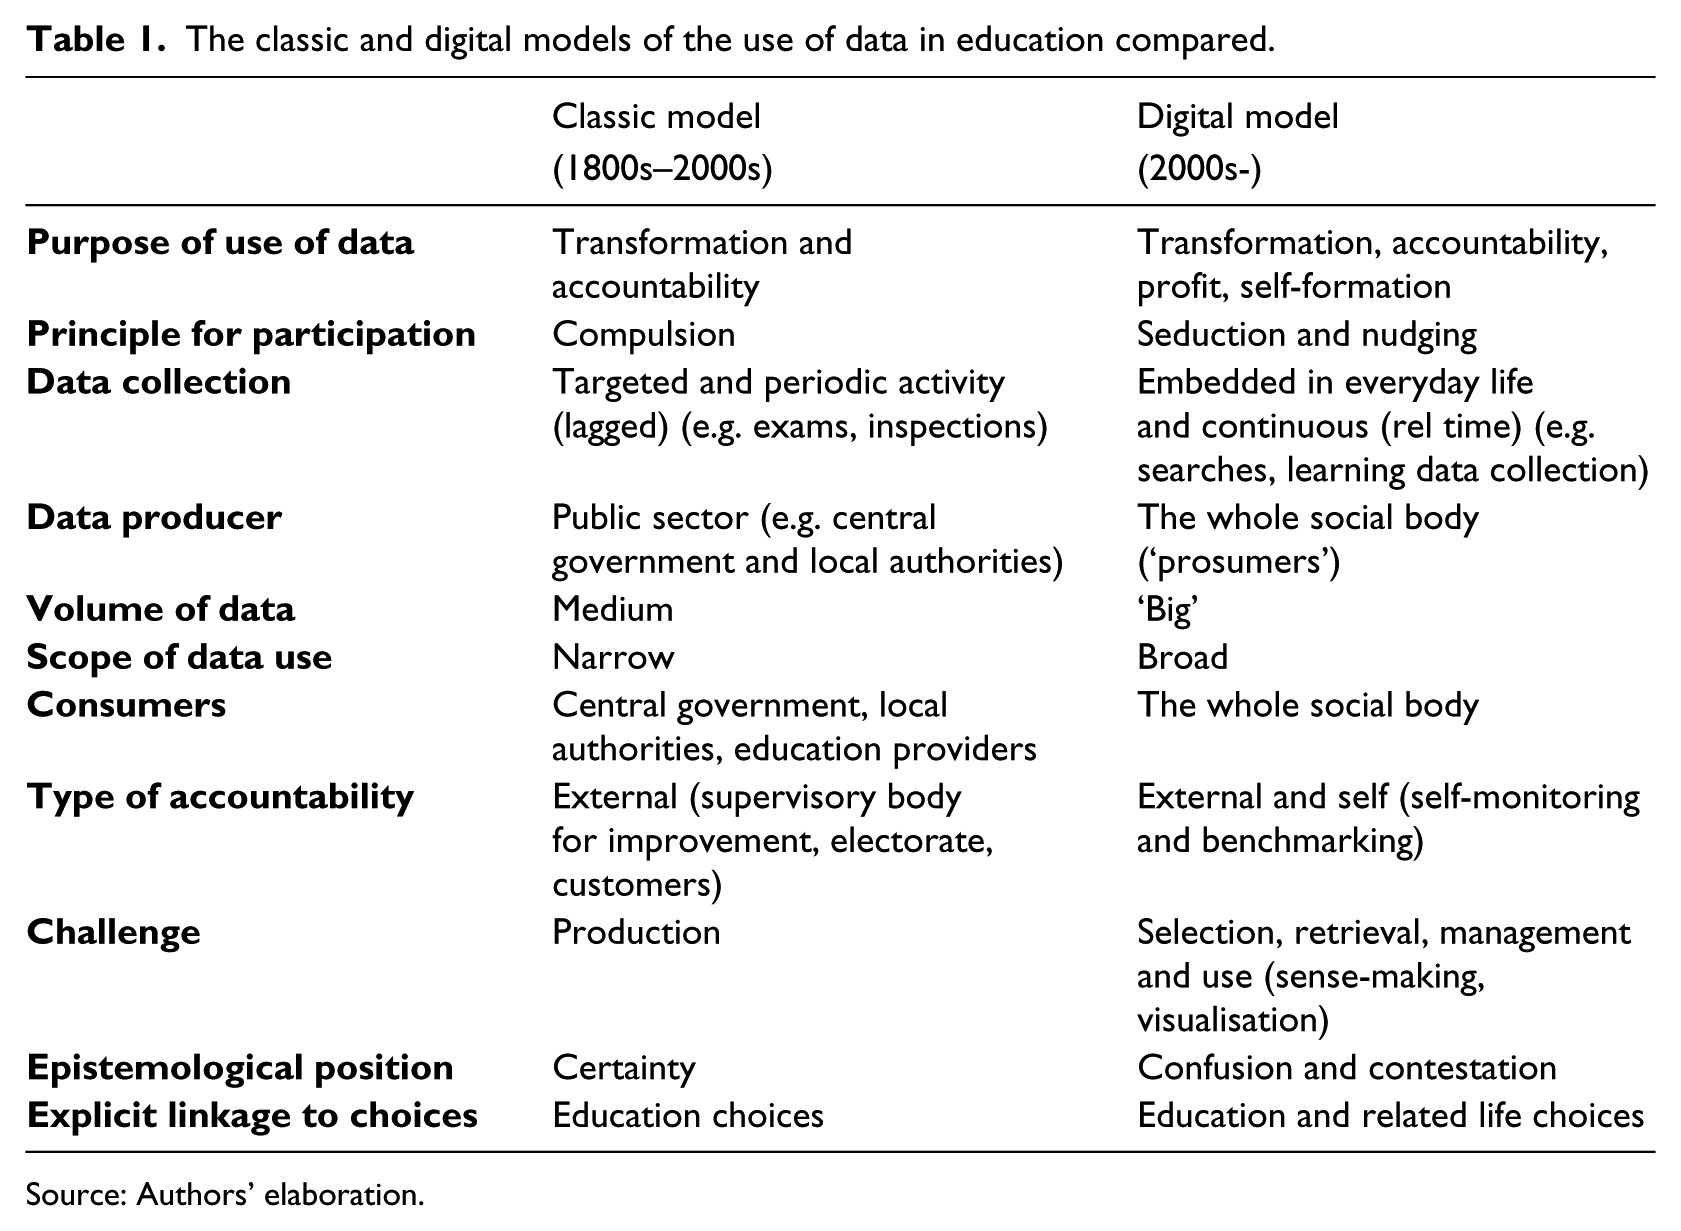
Source: Authors’ elaboration.
One of the more fundamental differences between both models is the diversification of the purposes of the use of data. While the education literature has been primarily concerned with transformation (improvement) and accountability – which is consistent with its focus on government actions – commodification of the subject and the generation of profit emerge as a third central purpose; newspapers created their league tables not to transform schools or make them accountable – in other words, not as a response to government needs or as a result of a government mandate – but to increase their revenues. This goes hand in hand with the enhanced role of private organisations in all of the stages of data management. However, these tendencies are not univocal. As we note later, the digital turn can also open up new possibilities for self-formation.
The digital turn implies a change in the principle for participation, which is based on seduction rather than compulsion (work ‘with’, not ‘on’ (Ball, 2009)), the promise of a gain, and the feeling of being informed, in touch with others, and of being responsible citizens and workers. In between compulsion and seduction are invitations to participate in international benchmarking and assessment exercises, such as those undertaken by the European Commission, the OECD (PISA, PIAAC, TALIS), private organisations such as The International Association for the Evaluation of Educational Achievement (IEA) (Nóvoa and Yariv-Mashal, 2003), or newspapers rankings. Participation is not a ‘free’ act; it is induced by the environment.
The main social actors making use of data are altered. In the classic model, central government, local authorities and educational institutions were the main users of data. Data was frequently produced by the public sector and not disseminated outside public sector institutions. In the digital model, exposure has expanded to the whole social body through the internet. But this exposure can lead to a saturation of data, confusion and contestation caused by contradictory results. The use of data is also much broader, as social actors have heterogeneous interests and moving priorities.
The role of actors, not only their topology, changes. In the digital model the individual is not only defined as a data consumer but also as a co-producer, and has a role in the selection of the productions in which (s)he wants to participate. In the classic model data collection is goal driven, focused and limited. In the new landscape, the social body becomes a data producer, sometimes from its everyday life activities. Data is generated as our behaviour is recorded during internet searches, purchases, participation in learning activities, and so on. The principle of participation is transformed: whereas in the classical model central government requires local authorities and other public bodies to produce data, under the digital model of governmentality the private sector and individuals also become prolific commissioners and avid consumers. At the same time data has become a valuable asset in itself, further altering cost-benefit calculations in data collection and production.
Thus, the main challenge is no longer data production, but data retrieval and selection (production of relevant data), management, use and display. This is why search engines should become more central in educational debates (Souto-Otero and Beneito-Montagut, 2013).
The notion of accountability evolves from the use of data to hold others (educational institutions, local authorities, politicians) accountable to also incorporate more central self-monitoring and benchmarking – a technology of desire – against immediate groups of peers and beyond, against a ‘normalised’ average or against ‘excellent’ performers. This creates new insecurities and ontological self-questioning by the objects and subjects of data, although it also creates new opportunities for identity, contestation and development; new contradictions and tensions emerge in the digital age.
A final point refers to the types of choices that are linked to the systematic use of data. Whereas in the classic model governments used educational data to guide educational choices, the barriers to link educational data with other life choices decreases dramatically in the digital model, as illustrated in the next section.
Artefacts
Commensuration – the transformation of qualities into quantities that share a metric, a process that is fundamental to measurement (Espeland and Stevens, 1998) – is accompanied today by performativity, whereby complex information is simplified in indicators which emerge as the new focus of attention and the way in which worth is judged (Ball, 2000). This leads to important changes on cognition and situation evaluation, on the ways in which government occurs, and on who is involved in it. However, little research has been done on the digital technologies that facilitate the collection, analysis and display of data (Williamson, 2015b) – what we call artefacts. This section reviews the kinds of artefacts introduced in the governmentality of education by various social agents. The purpose of this section is not to analyse those artefacts in detail (see Souto-Otero and Beneito-Montagut, 2013; Williamson, 2015b) or provide a comprehensive list of those available. Instead, the aim is to provide an illustration of the kinds of technologies that are shaping education data production and consumption across the social body. For presentational purposes we differentiate between artefacts for data collection, data display and data retrieval, although in practice artefacts often combine a variety of these elements.
Collecting, packaging and analysing data: learning, labour market and an ever-increasing number of ‘analytics’
Lawn (2011) documents government’s use of private companies for data collection in education under the philosophy of new public management. However, the possibility to digitally collect, package and analyse data enables increasing global access to this kind of data by various social actors, in addition to governments, at an affordable price. i-Graduate is an example of an online survey company – surveying students but also other relevant stakeholders – that work for education institutions, governments and private companies in Asia, Europe and North America. It claims capacity to:
provide the global benchmark for the student experience. We deliver comparative insight to the education sector worldwide, helping institutions deliver a world class student experience to enhance competitive advantage. (i-Graduate website)
Data collection is coupled with analysis to meet client needs: i-Graduate powers the global higher education think-tank Observatory on Borderless Higher Education. Both are part of the Tribal Group Plc., a global provider of education products and services. Non-profit associations such as EDUCASE also have ‘Core data services’ that focus on data collection.
But today much digital data collection is not done on behalf of a stakeholder – different to traditional surveys, tests and inspections. Educational institutions and private companies are active data collectors from everyday activities to inform their actions, dispute or shape government policies, or sell it to third parties. They do not simply respond to reporting requirements.
Learning analytics – which analyse and report digital data on learning processes – constantly audit students’ behaviour in an attempt to link it to performance and to allow prediction, real-time feedback and prescription around pedagogic interventions and course design (Greller and Drachsler, 2012). Complemented with background information from admissions systems, learning analytics provide models for education leaders and policy makers to ‘improve’ teaching and learning. Companies such as Pearson, Ellevation Education and Knewton are at the forefront of learning analytics. Social media platforms – either customised for education, such as Edmodo, or mainstream such as Facebook, a particularly (personal) data hungry company – have become reconceptualised as learning spaces and ‘course management systems’ (Tess 2013; Wang et al., 2011). Micro-blogging platforms, such as Twitter, have been found to increase student engagement and may be more frequently used for educational purposes in the future (Tess, 2013). This provides new opportunities for digital data collection on learning and interactions. Eynon (2013: 237) has criticised the prevalent efficiency discourse around learning analytics that views it as a ‘technical fix’ for education and a new tool for educational research that is likely to leave aspects of ‘meaning’ aside of its scope. But in exchange for commitment to the data system, learners and educationalists can see themselves as innovative, committed, professionals.
Research analytics are another type of education-related metrics, which have expanded from article view and citation counts (academic ‘impact’) to include counts of online discussions around articles (impact outside academia). Digital editions of Taylor and Francis journals now give each article an overall score and percentile position for the attention (mentions of the article on platforms such as Twitter and Mendeley) it has received compared to other articles of the same age. The company providing this information directly confronts notions of collaborative ethos in academia, portraying other academics as ‘competitors’:
Increasingly (researchers) need to show the impact of their papers, books and datasets are having beyond just citations (…) We watch social media sites, newspapers, government policy documents and other sources for mentions of scholarly articles (…)The Altmetric Explorer lets you monitor, search and measure conversations about your publications and those of your competitors. (Altmetrics website)
New ways of conduct, of direction of energy and responsibility are mobilised through instruments that play to academics’ ambition and competition. These metrics provide information valued by authors, moments of pride and self-esteem, as well as a tool for the administration of shame. These new digital artefacts have the potential to change the shaping of ‘public sociology’: a sociology that goes beyond the academy engaging in public debates about what society is or should be with multiple audiences – such as policy-makers, media and social movements – and co-produces with them (Burawoy, 2004). The incentives to become involved in public sociology are altered by putting ‘impact’ alongside other performance indicators, by creating public visual displays of standardised measures. This can reshape individual dispositions to engage in public communication channels such as social media. If one accepts that ‘the only value that public sociology should consistently cling to is the value of public discussion, the defense of the public sphere and its substratum of civil society’ (Burawoy, 2015: 7) digital technologies provide new spaces and incentives for it. This involvement, however, may be defined by calculation and the prioritisation of individual gains (in the form of mentions of research outputs) over longer-term and denser exchange of ideas or other forms of engagement with civil society, which metrics will not capture. This compels us to rethink the meaning of public engagement and its conditions of existence.
Private suppliers have not let go of opportunities in management-oriented data analytics (Schoolzilla, FreshGrade, Equal Opportunity Schools, Panorama Education (Murali, 2014)). In the USA school districts are increasingly turning to ‘big data’ consultancies such as 3D Group and Paragon K12 to identify future ‘superstar teachers’ based on a wide range of factors from SAT scores to appreciation of art (Simon, 2014). In their own terms these private companies play a role in the transformation of education, promising entrepreneurial schools and policy-makers new levels of efficiency. Schoolzilla helps to overcome educational data (enrolment, attendance, behaviour, results) ‘interconnection’ problems through its analytics and reporting platform, to make data more ‘actionable’:
Schoolzilla puts actionable data at the fingertips of our teachers and school leaders, enabling them to use the data to drive the instructional and managerial decisions that lead to strong outcomes. (…) Save hundreds of data analysis hours; spend those hours exploring data and driving action instead (…) quickly identify which students are on and off track for college success. (Schoolzilla website)
The language is suggestive: the system enables, does not force. Data drives decisions, does not inform them. Hours are saved to resolve the tension between monitoring, professional debate and learner support. Ball (2000: 326) documented how many school meetings attended during his ethnographic work as ‘enactments of self-monitoring (…) recording and making activities visible. Enormous amounts of time are spent ensuring that students are correctly labelled, reports are completed, records are up to date, etc.’. This reduced the time for debate, displaced by the ‘demands of performativity’. Technology is portrayed to confront this problem.
Labour market analytics collects education related data that can be sold to educational institutions, private companies or public sector organisations. Companies such as Islandrecruiting and Labour Analytics in Canada or BurningGlass in the USA and the UK use ‘big data’ and text mining from millions of job adverts posted online and résumés, to provide real-time labour market intelligence and advise employers on strategies to optimise the salaries and benefits they offer through competitor benchmarking, guide educational institutions on curriculum development or help users of public employment services to identify kinds of jobs for which they are qualified but have never thought about. A recent White House (2014) report ‘Ready to work: Job-Driven Training and American Opportunity’ quoted BurningGlass data more than any other data source, including the USA Bureau of Labour Statistics. US President Barack Obama (2015) used BurningGlass data in his 2015 State of the Union Address to claim that the USA had more open jobs in 2014 than at any point since he assumed office.
A key change is the shift of responsibility from the teacher, the school leader or the bureaucrat to the algorithm, the new automated manager who makes decisions for organisations and institutions (Beer, 2009), and allows change based on the ‘empiricism of the thing, of the event’ (Lash, 2007: 64). The power of the algorithm is not conceived primarily in terms of power over someone, but as the power to shape decisions, values and norms – through the internalisation of the basic logic(s) of the algorithm – and experiences. This power is non-linear or predictable. This is because algorithms depend on the social and technical conditions that affect their results and their use, and can have unintended consequences when left unattended or simply err (Kitchin, 2014).
Algorithms derive their social power from their complexity (algorithms are difficult to deconstruct, they often have a multiplicity of creators, more than one rationality and can be programmed to evolve over time and ‘learn’ independently of their creators; their results are produced in ‘algorithm systems’ rather than by individual algorithms (Gillespie, 2014)), and their apparent technical objectivity and impartiality. However, algorithms are socially produced as well as socially productive, not simply technically determined. They are the product of ‘complex socio-technical assembles, inherently framed and shaped by all kinds of decisions, politics and ideology’ (Kitchin, 2014: 9). They are affected by conditions such as availability of resources and data, social standards, protocols and laws (Neyland, 2015). Moreover, they are created for purposes that ‘are often far from neutral: to create value and capital; to nudge behaviour and structure preferences in a certain way, and to identify, sort, classify people’ (Kitchin, 2014: 10).
Yet data-driven systems also show a social face. Panorama Education aims to help teachers collect and analyse student feedback to improve engagement and instruction. Equal Opportunity Schools (EOS) is another edtech company that works together with school heads and superintendents to place students from under-represented groups (low socio-economic background, minority students) in the ‘most rigorous classes’, such as Advanced Placements, that allow students to take college-level studies while in secondary school, and the International Baccalaureate, to increase their enrolment and course success (Murali, 2014).
The use of education-related big data has challenges and limitations as well as advantages (Reich and Stevens, 2014), including ethical issues around digital observation of instruction or the mis-labelling of students according to imperfect algorithms in learning analytics. While educational researchers need to address these issues, there seems to have been limited academic and policy reflection so far.
Displaying data: data repositories and interfaces
In addition to digitalisation’s contribution to the collection of new kinds of data and the interconnection between data sources, digitalisation has also resulted in new ways of data display through ever more user-friendly tools – see also subsection ‘Sorting and retrieving data: search engines’. This is not only a cosmetic aspect. New capabilities to display data digitally have led to lower costs, greater personalisation and flexibility in data manipulation, transforming consumers into producers and consumers, ‘prosumers’, not only at the time of raw data collection, but also at the time of analysis (Beer, 2013).
Organisations such as the OECD make national-level data and micro-data from benchmarking surveys such as TALIS (Teaching and Learning International Survey) or PISA (Programme for International Student Assessment) available to all and at no cost. The OECD has created an Education GPS (Williamson, 2015b), an integrated source for internationally comparable data on and analysis on education policies and practices, opportunities and outcomes. The EU makes large volumes of data freely available through its Eurostat website and related services such as the GESIS Eurobarometer data platform. So do national governments and government-related organisations – such as The Office for Standards in Education, Children’s Services and Skills (Ofsted), a non-ministerial department of the UK government.
Williamson (2015b) analyses one of these repositories (The Learning Curve), an online databank produced by Pearson Education that constructs knowledge about education systems for policy-makers and researchers. But repositories target other social actors too. Google’s subsidiary Youtube is a repository of video material uploaded by individuals and organisations and a search tool. Youtube has more than one billion users, and 300 hours of video are uploaded every minute; every day people watch hundreds of millions of hours on Youtube (Youtube, 2015). The platform contains a large volume of materials on topics such as using data to raise student achievement, open and sharing education data or using big data for bigger education. It cinematises data excitement.
One area where profuse use has been made of the possibilities opened by digital technologies is higher education rankings. Many of these are now online, and are accessible to a global public 24/7. As a result, rankings have proliferated and specialised (more ‘international’ universities, best ‘young’ universities, best ‘campus’ universities). Personalised rankings have been created, such as the U-Multirank ranking, prepared with seed funding from the EU and led by universities in the Netherlands and Germany. It is:
a new multi-dimensional, user-driven approach to international ranking of higher education institutions. The dimensions it includes are teaching and learning, research, knowledge transfer, international orientation and regional engagement. (U-Multirank) allows users to develop personalised rankings by selecting performance measures/indicators in terms of their own preferences. (U-Multirank website)
This is not only a reduction in the cost of access to new information, but new agency in the use of that information and a juxtaposition of hierarchies.
Sorting and retrieving data: search engines
The digital environment that we inhabit is characterised by an overwhelming volume of generation of data, which puts the capacity of institutions and individuals who make use of it to the test. Private companies have acquired a central role in the sorting out and retrieving of these data. Souto-Otero and Beneito-Montagut (2013) argue that there is a risk that widespread use of search engines such as Google, Bing, Yahoo, Ask, Aol, or engines targeted to the search of academic literature such as Google Scholar, Scirus or Scopus, leads to a narrowing of the range of sources employed in the construction of knowledge. There is now a lively debate in the UK as to whether access to Google should be allowed in examinations (BBC, 2015). Search engines not only ‘find’ sources, they establish new hierarchies in the presentation of results according to the principles specified in their algorithms – such as relevance, popularity of a source and personalisation (as individual navigation histories inform the production of search results). This raises concerns regarding the power of search engines to shape the ways in which individuals think about the questions they ask, how they answer them and, increasingly, even the formulation of new questions to ask. Search engines have become surrogate, automated, experts. The challenge is one of excessive dependence upon these ways of storing information and informing ourselves, and the fact that commercial considerations can affect the operations of search engines.
Websites like School Finder or MySchool aim to support parents in their process of searching and finding schools in specific geographical areas (Williamson, 2015b). Mime Consultancy’s Skills Route goes one step further in that it enables users to see the range of local education providers that offer their chosen post-16 subjects and the grades that they are likely to achieve at each, based on their predicted GCSE results. These platforms are education choice websites for educational decisions.
But search engines have started to link education data to other life decisions for the ‘active individual’. The UK-based FTSE listed real estate search tool Rightmove connects educational data to other spheres of decision. Its property search functions now include a ‘school checker’ that visually reports on the likelihood of admission into nearby primary and secondary schools (see Figure 1).
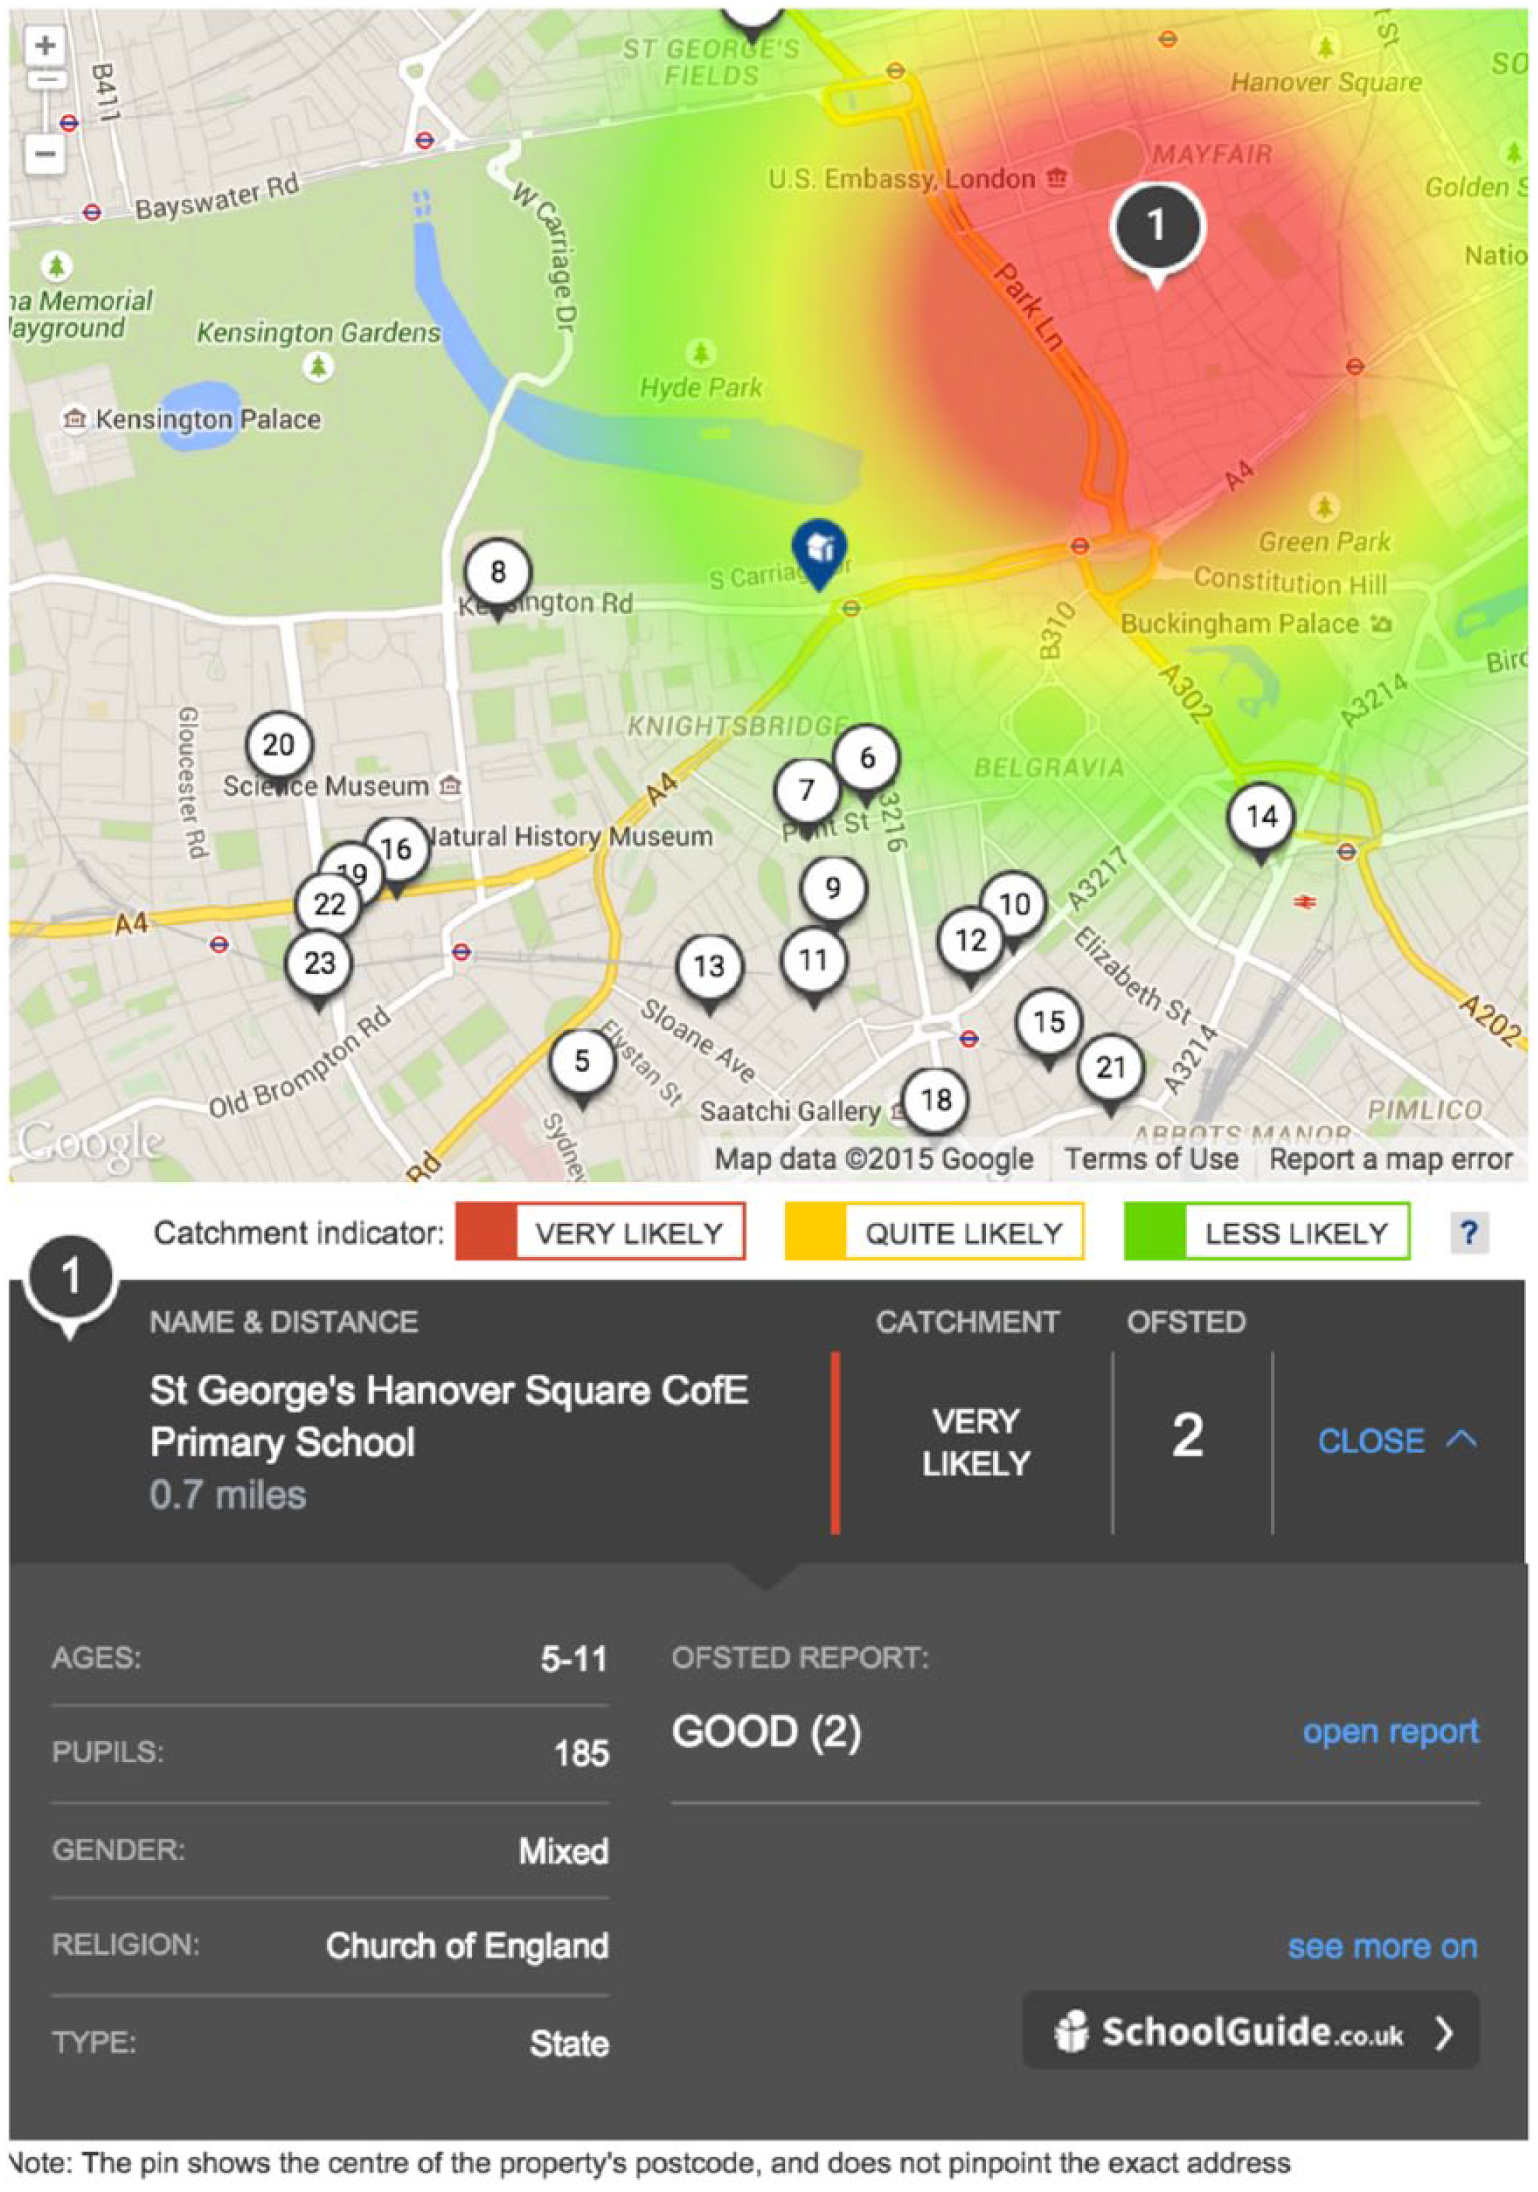
Rightmove’s school checker.
The data used by Rightmove is provided by School Guide, a company that aims to ‘help parents find the best school for their children’. Together with the likelihood indicator, Rightmove offers the distance of the property to the school, information about the school and its student population, Ofsted ratings and links to Ofsted reports. Additional information can be found on the School Guide website, where, acting as a data broker:
School Guide has done all the homework and put official information from several key sources in one place. Key exam data, inspection reports and school contact information are all clearly presented online for parents to access quickly and easily (…) School Guide’s colourful school pages also offer news and photos direct from schools as well as reviews from parents (…) Expert blogs on admissions, school open days, homework, tests, 11+ papers, catchment areas and National Curriculum changes complete the picture and make School Guide the perfect one-stop-shop for school information (…). Engaged parents start their search with School Guide. (School Guide website)
Here the private sector seizes the opportunity generated by parents’ anxieties, combined with the increasing availability of public sector generated data to inform education ‘users’.
This section has provided an illustration of the kinds of technologies that are shaping data consumption and production in education, operated by and targeted to the whole social body – governments, private companies, educational establishments and the ‘active individual’ in its multiple manifestations (the individual-learner, the education-manager, the individual-worker). Learning analytics promise to provide individualised and effective learning pathways. Managers of education institutions have new ammunition to shape and redefine the organisation of learning processes. The individual-worker can access new information on the labour market’s shifting demands, so that they can target their development to successfully meet market needs. The use of artefacts leads to changes in self-images, the allocation of responsibilities and expectations, surveillance practices, the allocation of shame and credit, the balance between the professional and the mechanical. The next section looks at the strategies social actors employ to negotiate their relationship with these artefacts.
Strategies
Digital artefacts create new social spaces and reactions. ‘Reactivity’ is based around the notion that people alter their behaviour in reaction to having been measured, evaluated, benchmarked or observed (Espeland and Sauder. 2007). The movement towards an ‘audit’ society has been extensively documented, but such a move is far from uniform across time and space. This suggests a need to focus on ‘reactive’ strategies, an aspect that has been largely neglected in the literature. These strategies are, at a general level and with different degrees of possibility, shared by social actors. We identify two reactivity strategies: alignment and resistance (which we divide into gaming, bordering, folding, rebellion). We illustrate the discussion with examples from different social actors that utilise various digital artefacts introduced in the previous section.
Alignment
Alignment is based on the acceptance of a proposition. Alignment can be explicit – when the social actor actively reflects upon and accepts the proposition- or implicit – when the proposition is accepted without reflection on its implications. Much of the literature on government through data, digital technologies and education documents processes of explicit alignment by educational providers and local authorities (Grek, 2009; Ozga, 2009). Similarly, Souto-Otero and Beneito-Montagut (2013) document a widespread implicit alignment with the principles and ontologies proposed by Google’s algorithm. Most individuals do not reflect upon the validity of the propositions of the algorithm – for example, more popular sources deserve greater attention.
Alignment with data verdicts is a process that can evolve over time. McKinsey & Co. argue that the benefits of open data can be self-reinforcing because they will increase as individuals come to see its advantages and help to improve the accuracy and detail of available data (Manyika et al., 2014). Espeland and Sauders (2007) document how ranking provokes self-fulfilling prophecies – predictions that cause themselves to be true because of the feedback between belief and behaviour. As social actors interact with rankings this interaction transforms them into entities that more closely conform to the criteria used in rankings’ measurements. For instance, when asked about the reputation of specific higher education institutions largely unknown to them, industry leaders and academics are likely to use previous ranking results, which solidifies the reputation of high-ranking institutions. Analogously, the reduction of learning to quantified exam results leads to teaching to the test, reducing the distance between actual learning and what is measured in exams.
Resistance
By and large the focus in the analysis of the use of data in the education literature has been on the re-centralisation that it has brought about, and on the inescapable influence of the centre. By contrast, aspects of resistance have tended to be overlooked. In the discussion that follows we identify four strategies of resistance: gaming, bordering, folding and rebellion, which can be used independently or in combination.
It should be noted that the advent of digital data and accessibility to digital devices has also enhanced the possibility of sousveillance (from the French ‘sous’ (below) and ‘veiller’ (watch)). This refers to the prospects that ordinary people now have to access, collect, analyse and display data about those systems and organisations that perform surveillance practices on them (Mann et al., 2002), including education organisations. Examples may include students using digital devices to capture and later assess lecturers’ teaching when they have been prohibited to do so – resituating the technologies for control and surveillance in the hands of students rather than educational institutions, enabling them to surveil those in authority. ‘Sousveilling individuals now can invert an organisation’s gaze and watch the watchers by collecting data on them’, calling into question the asymmetrical nature of surveillance through role reversal (Mann et al., 2002: 336; 345). Digital possibilities of sousveillance (of watching the watchers) can provide individuals with new resources to adopt resistance strategies.
Gaming
One resistance strategy is based on gaming. Gaming is close to Stephen Ball’s notion of ‘fabrication’ (Ball, 1997) whereby schools and teachers ‘fabricate themselves for the purposes of evaluation and comparison’ (Ball, 1997: 17). Under gaming, the social actor plays within the proposed field, but not under the set rules. It is a kind of ‘oblique compliance’, which games not only the system, but also colleagues and institutions and leads to the reduction of trust.
The digital turn has increased benchmarking exercises and their visibility and has thus accentuated incentives for gaming. Gaming academic search engine optimisation (GASEO) is one example. GASEO makes it easier for search engines to crawl and index academic work (Beel et al., 2010). GASEO strategies can include ‘citation spam’ – the indexing of fake papers to manipulate citation counts- or less ‘active’ strategies, such as ‘literature spam’ -e.g. not removing work wrongly assigned from other authors in a researcher’s Google Scholar profile, in order to bulk-up the number of citations associated with that profile. The increasing attention given to institutional rankings is another example of an area that has provided incentives for gaming, as institutions stretch their data on employability, admissions and other key indicators to present themselves in the best possible light (Espeland and Sauder, 2007). An overwhelming majority of US college admissions directors believe that other institutions inflate the data they report to ranking organisations (Jaschik, 2012).
Learning analytics holds the promise of personalisation of the learning and teaching experience, powered by algorithms, which have been designed from data and to manage/sort out data. It is still unclear whether algorithms will succeed in adjusting to students’ learning needs or if students will change their behaviour to game the algorithm in the quest of positive results. Big data programmes that grade essays rely on measures – like length of sentences and word sophistication, which tend to correlate with high grades – that once known can be gamed, with students beginning to write longer sentences and using more obscure words, instead of focusing on writing a clear and coherent argument (Marcus and Davis, 2014).
Bordering
Under bordering, the use and credibility attached to commensuration is strategically deployed; they drift and decay depending on the experiences and tactical interests of social actors. A primary example is the digital display of ranking data and results by higher education institutions and, to a lower extent, schools, in countries like the UK.
In the UK the Research Excellence Framework (REF) and its predecessors are customarily criticised by academics and university leaders because of their emphasis on academic accountability (Watermeyer, 2014), the specific metrics they use or their negative consequences: concentration of resources for research in a relatively small number of universities (Barker, 2007), the narrowing of disciplinary knowledge and innovation (Lee et al., 2013) and detachment from core academic ways of working, mission and values, amongst others. However, at the same time, most higher education institutions give preferential places on their websites to the display of REF results for reputational enhancement and student recruitment, and academics display their contribution to the REF submissions in their CVs and job applications. The multiplicity of angles for credit-claiming and creativity around how to present REF results publicly (digitally) are, in fact, now a trait of UK higher education.
The REF is largely based on peer assessment of the quality of research outputs. Wilsdon et al.’s (2015) report argues for further use of metrics in research assessment, but also concedes that the most valuable aspects of the academy resist simple quantification, that metrics should not substitute peer assessment of research quality and that ‘at present, further use of quantitative indicators in research assessment and management cannot be relied on to reduce costs or administrative burden’ (Wilsdon et al., 2015: ix). Higher education institutions have welcomed this conclusion, but universities themselves are adopting comprehensive digital information systems, making increasing use of metrics such as impact factors, management tools such as PURE and benchmarking tools such as SciVal and InCites for promotion and human resources management.
Folding
In his classic analysis of the optimal combination of tax levels and public goods provision Charles Tiebout (1956) developed the concept of feet voting – instead of voting for changes in the policies of the government of their community, or for a change in government, people can ‘vote with their feet’ to find a community where policies are closer to their ideologies. To ‘vote with your hand’, not moving it somewhere else but laying it down on the table – or ‘folding’ as it is called in poker – rather than ‘clicking’ the digital device is a further strategy. Indeed, there is a degree of choice as to whether to be part of data-work; in contrast to the cases of local authorities and schools that Ozga (2009) and others have analysed in detail, there are instances in which countries, educational institutions and individuals may be able to opt out from the data deluge.
Passive folding is folding by inaction. Scotland has not participated in TIMSS and PIRLS since 2007 and 2006, respectively. Other countries such as Algeria, Colombia, Greece, Latvia, Estonia and Iceland have adopted similar strategies. Reed College in the USA (Reed College, 2015) has not supplied data for the US News & World Report’s college rankings since 1995 due to disagreements with the methodology and ethos of the ranking, and concerns with manipulation in the submissions of other institutions. In 2007 a majority of members of the Annapolis Group, which represents over 100 USA liberal arts colleges, agreed not to participate in the US News reputational rankings – which asks college presidents to provide their views on the academic quality of undergraduate programmes in US colleges, and accounts for 25% of the total rank. Many of its members also agreed not to use rankings in promotion activities or refer to them as an indication of quality. A number of institutions have also recently refused to provide data for Mclean’s ranking in Canada (National Post, 2014), the Good University Guide in Australia (Bowman, 2015), U-Multirank in Europe (Grove, 2013) and The Economist ranking of MBA programmes (Byrne, 2014). At individual level, academics may not Tweet (sabotaging their chances to maximise Altmetrics scores), not create a Google Scholar profile and not join Researchgate. Many people do not contribute to the construction of learning analytics data because they do not take part in those activities, out of choice, because they do not have the means for participation, or because they do not even know that this possibility exists.
Others will take part in activities that could contribute to data production, but will actively choose to opt out from data production. Personalisation of search results based on the collection of data on the user’s past behaviour in Google, for instance, can be disabled by users.
Opting out normally has a price. The price paid for not feeding the data system tends to be associated with not reaping the benefits derived from its provision. For example, in the example of Google, an enhanced match between the search results provided by the search engine and one’s interests. Not feeding data to ranking organisations may result in exclusion from a popular ranking, or appearance with downwards estimations created by the ranking producer (Espeland and Sauder, 2007; Reed College, 2015).
Rebellion
A final strategy of resistance is rebellion. While in previous strategies users do not challenge the status quo – rather they make do around it – they challenge it under rebellious strategies. Rebellious strategies can be based on the critique of current systems (complaints when algorithms are changed, leading to changes in ranking positions, or when they are seen to be arbitrary or unsound), but also on ‘redefinition’, the proposition of alternative values, rights, obligations and conceptions of the world and constitutions of the self and self-government in the broad meaning of the term, prompting new forms of subjectivity and autonomy. They can also include various actions or inactions to lobby for the redefinition of the indicators used for commensuration, and the rejection of the inferences derived from the analysis of data that is not considered appropriate: the non-acceptance of discourses around the relationship between increased efficiency in education and the use of digital resources, for example.
Snowball metrics is an initiative where a number of research-intensive universities (initially in the UK and later in other countries, including the USA and Australia) and Elsevier agreed their own methodologies for benchmarking and comparison, as an alternative to newspaper university rankings. In 2015 US government released for the first time its College Scorecard data via CollegeScorecard.ed.gov to assist decision-making in college selection through open data on various factors, distancing itself from the ranking of institutions.
Conclusions
This article argues that the emergence of digital data has led to a qualitative change in the production and use of educational related data. The article has explored a change of logic towards governmentality, whereby social actors (private companies, higher education institutions, the ‘active individual’ in its multiple manifestations) become both objects and subjects of government through the use of digital data. This locates digital data-work as a socially directed enterprise. This enterprise is linked not only to the requirements of the state – and the delegation of responsibilities from state to non-state actors – but also to those of the market and of the social body. As such, there is an increasing need to examine the extent to which there are differences in the responsibilities of public and private agencies in data-work, notably in terms of ethical data collection, methodological transparency and curation. There is also a need to better understand the requirements that the public sector imposes on private sector organisations during the commissioning of data-work and how transparent the public sector is in the use of these companies (Souto-Otero, 2015).
New digital tools monitor and control the social body in new ways, but they also open up new possibilities. These challenges and opportunities point towards a renewed interest in public sociology that engages a broad range of publics in the production knowledge. For public sociology (and ‘public education research’ more specifically) it does not suffice to discuss possible social futures, collect data from or even with diverse social actors. It is also necessary to look at the strategies that they adopt. This is key, as it reduces possibilities for bias and misinterpretation of the data that are co-produced, for instance once strategies of withdrawal (folding) or cheating (gaming) are taken into account.
This directed us to the analysis of two largely overlooked areas: the artefacts through which data is collected, displayed and retrieved (worked) by social actors, and social actors’ strategies in dealing with commensuration processes and in navigating policy and social spaces. The former illustrated the ways in which digital educational data has penetrated and created exchanges with various parts of the social body, whereas the focus on strategies revealed that while the literature has tended to focus on alignment, surveillance and control, social actors also deploy strategies of resistance that try to render the digital turn inconsequential or to change its direction.
Furthermore, the focus on strategies suggested that data-work can be a ritualistic or image projecting (as an ‘innovative, efficient organisation on top of things’) endeavour but also a transformative endeavour – and the discussion showed that the data-driven systems that are associated with ‘efficiency enhancement’ can also show social faces. This warns equally against the naïve acceptance of the virtues of technology and overly structural understandings of social life and systems. In order to avoid technological determinism it is necessary to concentrate on an analysis of the effects of specific digital technologies on social life. We need to not only critically examine the risks that they entail, but also the scope that they may open for processes of self-formation – of experimentation, of new imagined futures and subjectivities in a process of becoming – as opposed to self-fabrication, or the imposition of an immutable form, a polished product under the logics of calculation and exchange.
The use of digital data in education displays contradictory features. The data deluge inundates us with data, but data collection is also a process of data simplification and elimination; vast amounts of information are still ignored, not collected. It is also a process of data selection and contradiction. It promises transparency but makes matters more complex, apparently contradictory results more frequent and manipulation of the non-expert easier. We loath that simplification but at the same time want to know what works, how students learn, which universities are best, and debates around simplicity can help us become clearer and more nuanced. We value professional judgement but subsume ourselves into metrics and performative practices. The data deluge condemns us to be the ‘marginal man’ Park (1928) talked about, an individual in ‘mental conflict’ that is influenced by ‘two, not merely different but antagonistic cultures’ – one a culture of the past with which (s)he is not willing to break and a new culture in which (s)he is not fully accepted and (s)he does not fully accept. This uneasy position leads not only to insecurity and emotional instability but also, Goldberg (2012) argues, potential for creativity, and the emergence of new, shared and meaningful ‘marginal’ cultures, which may derive from alternative juxtapositions of purposeful resistance and alignment strategies.
The digital turn brings promises of liberation with it, liberation from data collection and manipulation. This should provide greater space for creativity and transformation. While research does not unequivocally support this view (Johnson, 2012), what is certain is that these tools are putting more data on the menu than before, breaking old monopolies in collection and manipulation of data and bringing about new possibilities for contestation and debate within evolving governmentality frameworks. It enables social actors to see and present what they do under a different light, to contest policy and their own practice and conduct both towards new directions. But social actors need the energy and space to engage in these new dialogues. Therein lies the challenge.
Footnotes
Acknowledgements
We would like to thank Ben Williamson and two anonymous referees for helpful comments and suggestions. All remaining errors are the authors’.
Declaration of conflicting interests
The author(s) declared no potential conflicts of interest with respect to the research, authorship, and/or publication of this article.
Funding
The author(s) received no financial support for the research, authorship, and/or publication of this article.