
Abstract
In this paper, I examine the role of human and digital actants in various material and spatial configurations during the Programme for the International Assessment of Adult Competencies (PIAAC) e-assessment events. It reports on an investigation into how data are produced and subsequently fed into statistical models that in turn produce analyses of skills in ‘centres of calculation’. These data are then used to produce reports, scientific papers, marketing documents and visualizations that profoundly affect how we understand concepts such as literacy or skill. Drawing upon the theoretical resources of Actor Network Theory, this investigation employs a new and innovative methodology, trace ethnography, to follow the distributed agency of hypermobile digital actants. I examine the detail of e-assessment events and interactions between coded technologies and people and how these are translated into statements about what it means to be literate. This, in turn, highlights the role of non-governmental organizations in influencing educational and economic policy-making through the intensification of data production.
Keywords
Decisions about educational policy-making and spending are frequently informed by data-driven or evidence-based reports and studies. While a great deal of attention is often devoted to the data produced by these survey–test hybrids, much less attention is given to how these data are produced. This article is part of an investigation into the e-assessment practices of literacy testing conducted from 2008 to 2013 by the Organisation for Economic Cooperation and Development (OECD) for the latest item in its data product series, the Programme for the International Assessment of Adult Competencies (PIAAC).
What is the Programme for the International Assessment of Adult Competencies?
The PIAAC is a complex hybrid of educational, psychometric and economic technologies. Situating itself in a tradition of labour force surveys designed to measure human capital, the PIAAC offers an enticing portrait of the adult worker for use by governments, businesses, universities and training providers. Figure 1 maps out the host of national statistical agencies, universities, researchers, interviewers, statisticians, IT companies, testing instruments, software, respondents, administrators and host of other human and non-human actants mobilized by the PIAAC and enrolled in the e-assessment consortium. An application of network ethnography (Ball and Junemann, 2012), this bipartite network diagram was created in the visualization and analysis software Gephi (Bastian et al., 2009) drawing upon Internet searches, webcrawls, interviews and documentary evidence. Although, as with any network diagrams, it is limited in that it portrays fluid and dynamic networks as static, it serves as a useful descriptive device. In addition to having the advantage of showing the somewhat arbitrary lines of where the network was ‘cut’ (Strathern, 1996), it shows how the PIAAC is a highly distributed and ‘durable network of practices and materials entwined with people’ (Fenwick and Edwards, 2010: 84).
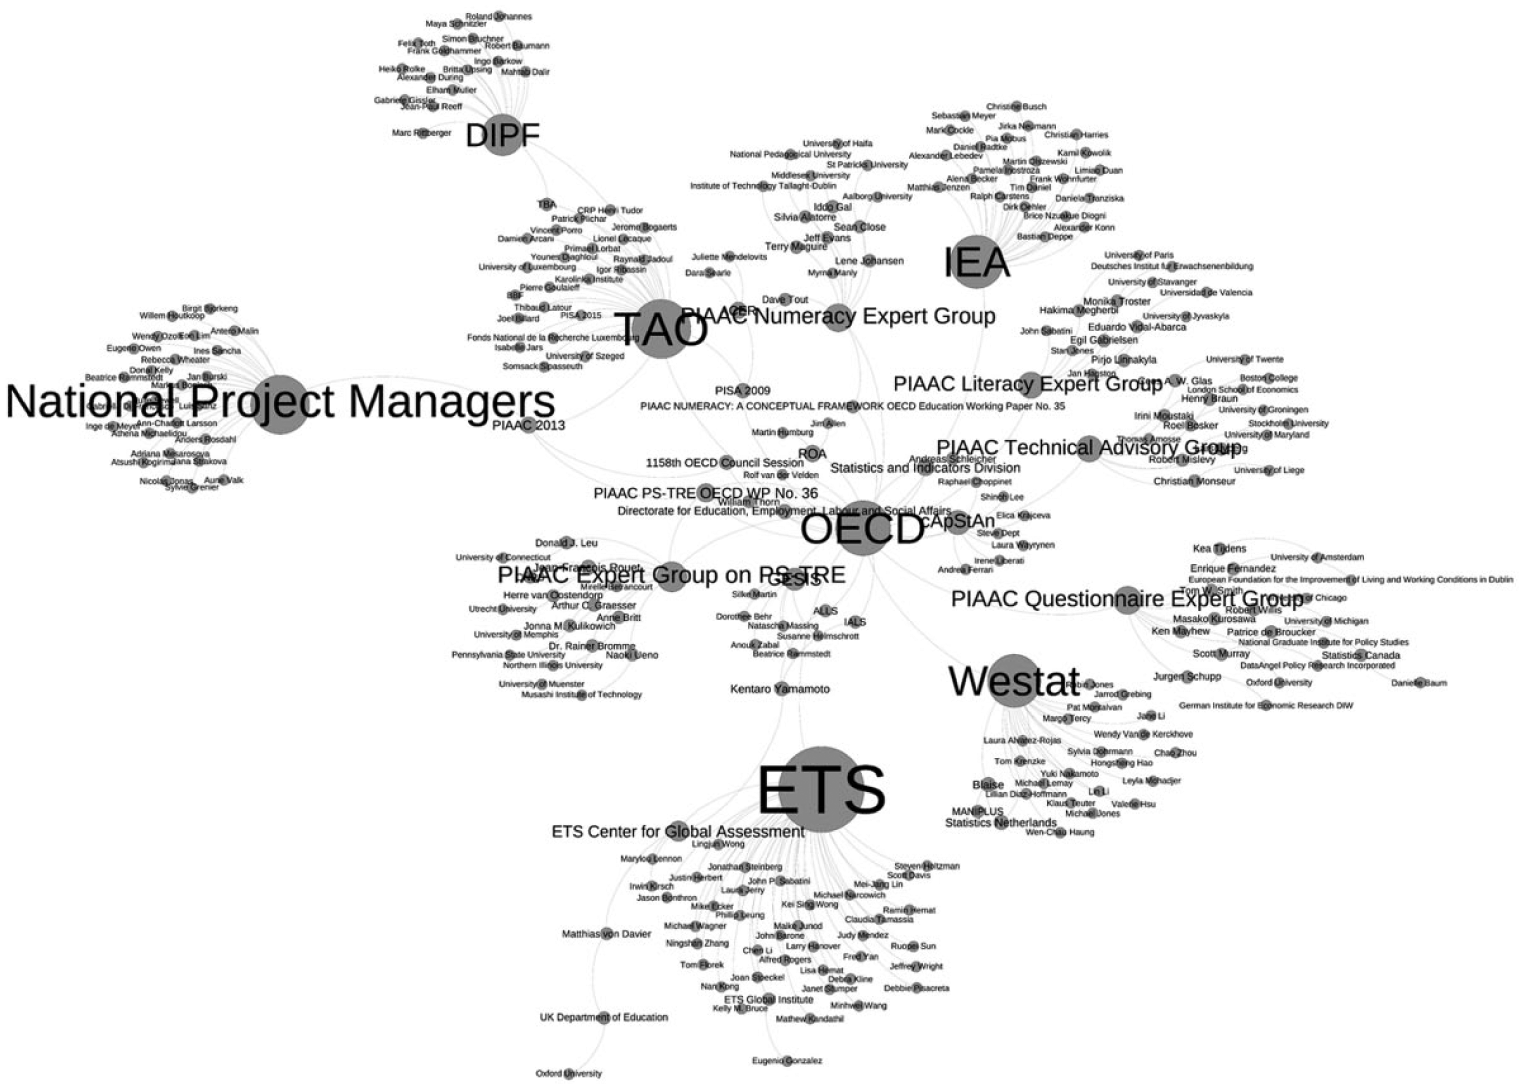
The Programme for the International Assessment of Adult Competencies network.
Far from being an isolated phenomenon, the PIAAC defines and measures standards that are inextricably connected to the European and transnational collectives that are ‘produced in an array of sites, often linked together, across private and public organisations’ (Lawn and Grek, 2012: 55). These fluid private and public organizational assemblages (Hogan et al., 2015) enact a broader set of processes of educational reform and policy that promote a very specific interpretation of literacy and skills. Sophisticated psychometric and statistical techniques methodologies lend the PIAAC an aura of objectivity, but it is highly value laden and promotes a very specific and normative vision of how sociomaterial relations in the world should be configured.
Centres of calculation
Centres of calculation are, as the name suggests, those ‘sites where literal and not simply metaphorical calculations are made possible by the mathematical or at least arithmetic format of the documents being brought back and forth’ (Latour, 2005: 181). The OECD, with the PIAAC, is like any centre of calculation in that it coordinates the production of data chiefly in tabular datasets that that ‘make it possible to maintain one site as central by providing connections from that place to activities located elsewhere, and by tracking those activities against a standardized temporal order’ (Suchman, 1997: 47–48). Two of the principal data-producing and coordinating operations performed by the PIAAC are to do with the measurement of ability and human capital.
Calculating ability or θ = [IR]+[BR]+Res
Ability in the PIAAC refers to skills or competences in one of three domains: literacy, numeracy and problem solving skills in technology rich environments. All three are conceptualized as latent traits that can be observed and measured through tests of verbal reasoning based on an ‘information processing model of literacy and attempts to identify levels of literacy skill that are independent of the context of use – the literacy counterpart of the generic and transferable labour skills supposedly possessed by the flexible worker’ (Hamilton, 2001: 182).
These data are used in equations to calculate the ability level of individuals in a population by scoring them in a test that maps their ability along a difficulty continuum with this equation

That is:
θ = ability;
[IR] = item response in the cognitive test;
[BR] = background questionnaire;
Res. = residuals.
Each ‘variable’ in this equation corresponds to the result of an interaction between an interviewer, a respondent and a computer in someone’s home.
Although individual scores are then dissociated from the individual participants, it is quite the opposite for the ‘scores’ for each regional entity (referred to as countries). Once the data has been aggregated, each country becomes known as a participant and, in subsequent statistical analyses, treated in much the same way as the now subsumed individual participants. Ranked on tables and data displays, educational and training systems are thus coordinated in a spirit of competition on an international league table, thus facilitating certain ways of representation; they will be either ‘high’ or ‘low’ performing countries for the OECD (OECD, 2013a) or portrayed in the press as ‘good’ or ‘bad’ pupils (Floc’h, 2013 ).
Calculating human capital: From Q(S) to C
These measures of intellectual ability are used to feed data-driven policy that has been ‘focused on making Europe the most competitive economy in the knowledge society’ (Méhaut, 2010) that, along with other wealthy nations, make the development of human capital pillars of both economic and social policy (European Commission, 2013). Organizations such as the OECD work to raise the ‘awareness of human capital as one of the driving forces of economic development’ (OECD, 2013b) and the need for policy to be based on a calculation of the money rate of return to formal education (Becker, 1975). The PIAAC provides economists with the means to do so.
Traditionally, equations for calculating human capital relied on schooling as a key variable (Ben-Porath, 1967; Burton-Jones and Spender, 2012). In the equation below (Mincer, 1970, cited in Hanushek et al., 2013), Q(S) represents the quality and quantity of schooling

However, the application of data from the PIAAC reinforces a fundamental move away from how rate of return in training is calculated

In the above equation (Hanushek et al., 2013), national differences, ‘N’, such as minimum wage or employment protection legislation, are included but national data from educational systems ‘Q(S)’ are not. Rather, they are replaced by ‘C’ or a composite of an individual’s ‘θ’ or ability.
This shift, that effectively replaces 10–20 years of schooling for 2.5–4 hours of cognitive tests, does a number of things. Within the apparent scientific objectivity of the equation is a broader political move typically associated with neoliberalism. The relevance of K-12 and university education is challenged and depicted as an inaccurate indicator of earnings. National educational systems are found wanting if their graduates do not master a specific range of verbal reasoning and test-taking skills as demanded by the PIAAC. Secondly, by enthroning skills imputed from cognitive tests, lifelong learning, rather than being a complex sociomaterial assemblage, becomes centred on the ‘knowing/learning’ individual with the above equations claiming to represent ‘the objective world to which separate subjects must adapt’ (Edwards, 2010).
Finally, the PIAAC advances the notion that cognitive and non-cognitive skills – residing in the individual – become more than indicators, but predictors. In this way, probabilistic technologies of macroeconomic statistical accounting dovetail with psychological perspectives that emphasize ‘the role of certain personality traits, such as openness to experience and conscientiousness, as playing an important role in determining socioeconomic success’ (Mazumder, 2015).
Tracing the Programme for the International Assessment of Adult Competencies’ e-assessment events
Much of the discussion around the PIAAC tends to focus on the results: the scores, comparative tables and judgements about to what extent skills are present in the populations of the 24 countries that took part. While it is certainly interesting and even useful to look at what was produced by the PIAAC, the purpose of this study is to look at how these results came into being.
To make the role played by digital actants during the PIAAC e-assessment less hidden and elusive, I draw upon four conceptual and methodological resources. Actor Network Theory (ANT) and praxiography constitute the principal theoretical resources for the investigation, while trace ethnography and software studies offer methodological approaches that allow the researcher to follow the distributed agency of hypermobile digital actants.
Actant is a term borrowed from semiotics and was later re-employed by ANT or material semiotics. Rather than being a theory, ANT is a repository of terms and sensitivities that encompasses a range of conceptual and methodological techniques for investigating relations between the natural, technical and social (Mol, 2010). Although it is outside of the scope of this article to give a thorough account of ANT, the notion of agency and the implications that this has for understanding digital actants and code is central to this investigation into the PIAAC.
Agency is not a priori attributed to any particular type of actant, but moves within the relationships between the digital and social. Agency circulates in a fluid and dynamic way through the myriad and shifting relations between human and non-human actants and provides non-humans (such as technological artefacts) with much of the same potential ability to act as humans (Callon, 2006). One such digital actant – code – can be understood as ‘a set of permutable distributions of agency between people, machines and contemporary symbolic environments carried as code. Code itself is structured as a distribution of agency’ (Mackenzie, 2006).
Digital ethnography is one way of dealing with the wide variety of technologically mediated communication ‘which makes interactions of diverse kinds persistent, traceable and amenable to sociological gaze’ (Hine, 2011: 568). Trace ethnography goes further in this direction and seeks to combine ‘the richness of participant-observation with the wealth of data in logs so as to reconstruct patterns and practices of users in distributed sociotechnical systems’ (Geiger and Ribes, 2011: 1). These often unassuming background processes, low-prestige coded routines and scripts, taken individually, may seem to provide trivial and ‘thin’ descriptions in comparison to other interactions. Taken together, however, they can provide valuable insights into how assessment is mediated through technology. This is not to say that an aggregated view of traces and other encoded interactions provides the researcher with a more privileged standpoint. Rather, it is the combination of offline and online sociomaterial assemblages that are intensely relational and make sense by virtue of their connectedness since the ‘power of these assemblages is their interconnection and interdependence creating systems whose complexity and power are much greater than the sum of their parts’ (Dodge and Kitchin, 2004: 10).
How was the Programme for the International Assessment of Adult Competencies performed?
At the heart of the PIAAC is the e-assessment event or survey instrument. Divided into two sections, there is a questionnaire that produces non-cognitive data such as age, level of schooling, income, health, civic participation, etc., followed by a series of IQ tests (verbal and mathematical reasoning) and an IT test. The neat and ordered information flows represented in the PIAAC’s official schematic (Zabal et al., 2014) are tidier versions of the complicated and entangled reality of producing data in the field. Rather than being a single, standardized scientific instrument, the PIAAC can be understood as 331,863 distinct e-assessment events.
Many of the details of how e-assessment data is produced tend to be opaque, with information difficult or deliberately concealed. In the words of one project manager, the PIAAC consortium’s assessment instrument was ‘developed as a “black-box” solution designed to run in its own virtual machine’ (Hunt, 2012). The metaphor of the black box is also used to show how things, once they have been made or come together are taken as normal, unremarkable or black-boxed, just as a computer or technical device hides the myriad connections that make it real (Latour, 1987).
This means that ‘documents and practices of the test are black-boxed in the sense they are cut from the networks that made them possible’ (Fenwick and Edwards, 2010: 138) and much of the work that goes into performing e-assessment is hidden or ignored. However, for the persistent researcher there is still a great deal of information about what happened during the e-assessment event. Assessment events, particularly those mediated by digital technologies, leave many traces. Some of these are taken up and called data or used in the official accounts and retellings. Others are buried in technical reports or hard drives.
Following code traces from e-assessment events
Although the PIAAC involved the considerable effort of tens of thousands of people, none of it would have been possible if not for the work performed by digital actants. For a project as large as the PIAAC to work, much of the day-to-day management was delegated to encoded actants to the point that it was described by the OECD as a ‘major IT development project and not just as an assessment project’ (Thorn, 2014: 9). During each e-assessment event, this process of automated management (Kitchin and Dodge, 2011) meant that digital actants surveilled, monitored, recorded and interacted with both test takers and interviewers, with the intention of ensuring that the strictly scripted interactions planned by the PIAAC’s authors actually took place.
One of these encoded actants was Blaise. Blaise is a software package and computing language (Statistics Netherlands, 2014) used to run Computer Assisted Personal Interview (CAPI) software. Nested outside of the virtual machine that contained the cognitive test, it acted as an intermediary between the triad of the interviewer, respondent and test and ‘managed the collection, division and allocation of visits by the interviewers, making contact, booking meetings etc.,’ (Interview with PIAAC official, 2014). As a manager, Blaise was delegated the task of controlling sample selection in the field due to the ‘concern that the interviewers exert influence on the household selections’ (OECD, 2010b: 45). Unlike interviewers, Blaise could be counted on to more reliably implement the sampling algorithm chosen by each country to determine which household should be invited to participate in the e-assessment event.
Before an e-assessment event can take place, a randomly selected household needed to be contacted by an interviewer. Interviewers did not contact potential participants simply ‘at random’, but in what is known as a systematic random manner. Individual participants, all of whom were required to belong to households, were selected using different techniques, such as the ‘cube’ algorithm (Deville and Tille, 2004), Systematic Random Sampling (SRS) or Probability Proportionate to Size (PPS) designs. All countries used software routines for determining which groups of people would be ‘targeted’ within pre-defined geographical areas working within the constraints of available information (census data) and budget.
Interviewers would go to each household and attempt to find people willing to take part in the e-assessment event. Along with each interviewer were other actants, such as the paper test booklet, a calculator, pens and, most critically of all, a 13”-17 laptop computer containing the CAPI and Testing Assisté par Ordinateur (TAO) software.
Out in the field, Blaise would communicate with Maniplus to assign interviewers households or cases to contact. Maniplus is a software environment installed on interviewers’ computers that specializes in case management. That is, it displays lists of assignments to the interviewer, selects cases for them, stores data, records the status of each case (complete, partial, etc.) and converts e-assessment and interview data into the statistical analysis system (SAS) format. It also, and very importantly, sends the captured data back to the field supervisor and home office before it can be lost or mislaid by interviewers (Allan et al., 2012).
Once in the participant’s home, Blaise would invite interviewers to start the ‘screener’. Although the interviewer would ask questions about age, gender and occupation, the choice of who was to be interviewed was determined by the screening software, which was designed to ensure that optimal sampling took place. For instance, in the Republic of Ireland and the USA, interviewers would run Blaise that would in turn, with the random function (RANDOM [ ( N ) ]), run ‘a sampling algorithm for the screener to determine who, if anyone, in the household is eligible to participate in the study’ (NCES, 2013: 6).
Once these initial steps or ‘case initializations’ had been completed, each member of the household had to be ‘enumerated’ (NCES, 2013: 6) by the interviewer, and run through the screener before they would be able to press the ‘Start PIAAC’ button.
Managing assessment events with code
One of the hallmarks of psychometric testing is attitude towards the role played by the invigilator or, in this case, the interviewer who performed both roles. Face-to-face interviews represent ‘a situation of significantly heightened complexity’ (Eckes, 2009: 2) and this complexity makes them ‘error prone’ (
In this respect, the PIAAC is no different to many other cognitive tests and great care was taken to attenuate the agency of the interviewer. During the training workshops for interviewers or ‘data collectors’, they were taught with scripted materials and role-plays with the purpose of ‘eliminating the need for training staff to speak extemporaneously’ (OECD, 2010b: 118). Indeed, the Guidelines document explicitly states that ‘interviewers are a component of survey error which can be minimized through frequent monitoring by supervisory staff’ (OECD, 2010b: 113).
For the most part, this dimension of standardization was successful, with little evidence to indicate that interviewers did anything other than follow the script as was asked of them. In some cases, interviewers deliberately decided not to work with the sampling software and ignored or subverted the screener’s recommendation.
Examples of this overriding of the agency within algorithms and code took place in the USA. Interviewers were not, to paraphrase Garfinkel (1984), passive ‘dopes’, for in their translation of the Guidelines, Standards and Recommendations (OECD, 2010b), they sometimes attempted to assert their own agency over that of the supervisor, manuals or software that accompanied them to each e-assessment event. Some interviewers ignored the sampling procedure, deliberately choosing a different address to that ordered by Blaise:
Another interviewer conducted screeners at the wrong address on at least two occasions, those cases were cleared out and re-fielded. Another interviewer closed out two cases as vacant when they were occupied, the cases were transferred to another interviewer. (Hogan et al., 2014: B40)
Other interviewers ignored the screener algorithm, choosing instead to decide who they would interview themselves:
Of the falsification previously reported, one interviewer routinely underreported the number of household members to make sure that the person she wanted to be selected for the interview would be. Another interviewer underreported the age of a screener respondent to make her eligible for the BQ. The case was removed from the data and will not be re-fielded. (Hogan et al., 2014: (B40))
The above cases appear to be examples of the interviewer preferring their own judgement to that of the software. Other examples seem to be little more than the interviewer covering up mistakes or attempting to fraudulently claim payment for fake interviews:
Another interviewer made up data for a number of households, discovered due to abnormally short BQ administration times. She also seems to have completed the Exercise herself on occasion, according to SPs who were called for validation. Cases were reset and reassigned. (Hogan et al., 2014: (B40)) One interviewer was found to have interviewed the wrong person in a household, that is she conducted the interview with a person in the household who was not selected by the screener. After being confronted with the information, she claimed it was an accident. While validating the case, it became clear that she intentionally interviewed the wrong person. The case will be removed from the data. All of her other cases validated acceptably and will be left intact. (Hogan et al., 2014: (B156))
What is worth noting here, however, is that beyond the enforcement of quality control, it was not the supervisor who detected these departures from the script, but the log-files from Blaise that scrupulously recorded and timestamped the interviewers’ interactions. Timestamps are possibly one of the most common features of most log-files; they are simply the act of marking the start and finish time of any interaction with software. Unlike in previous surveys, such as the International Adult Literacy Survey (IALS) and Adult Literacy and Lifeskills Survey (ALLS), where supervisors may have suspected but been unable to prove falsification, the software was now able to act as an effective ally:
All entries in the log were timestamped and enabled to reconstruct the entire sequence of user action and system responses of the CAPI system. An equivalent logging of events was provided within the cognitive instrument result file for further analysis at psychometric level. Except for the cognitive instruments (which were operated by the respondent), all actions of the interviewer were recorded in the log. This file was also used to generate audit trails for verification of interview quality. (OECD, 2013b: 20, Chapter 7)
This audit trail reveals to some extent how, in these e-assessment events, agency was distributed and procedures enforced. While the interviewer may have thought themselves alone or only with the respondent, the carefully coded character of the interactions demonstrates that this was anything but the case.
Once the sampling formalities were concluded, the collection of additional variables really began. The background questionnaire, containing a possible 455 variables, took a relatively long time (average of 45 minutes) to complete. Due to this complexity, this section of the e-assessment was controlled by the software. Neither the interviewer nor respondent had much control over the order of questions once it had begun, since…
…question sequencing in the PIAAC BQ followed a complex set of branching rules based on variables, either collected or calculated during the interview, loaded at initialization, or set up as global constants. Branching rules consisted of logical expressions that triggered a jump to a target question when a condition specified as a logical expression on any single variable or a combination of them was evaluated as true. (OECD, 2013b: 5, Chapter 7)
This meant that in the highly scripted questioning and answering between the interviewer and respondent, the routing code was very present, forming a conversational triad rather than what might be more intuitively seen as a dyad. In the question below about job-related training, the interviewer and respondent move through an if–then(–else) construct:
B_R13 Note If (B_D12h=1 and B_Q12a=1) then ^CurrentLast=‘ Press <Next key> to continue. (OECD, 2010a: 27)
If–then(–else) is a simple form of algorithm used extensively in programming to automate routine tasks, and the above text can be seen as a textual form of a flowchart or decision tree. One of the motivating factors to code interactions is the desire to keep the process as standardized as possible. Just as interviewers could have trouble following the scripts governing sampling, they also had trouble following the script of the background questionnaire:
I suppose one of the big things for us would be people actually reading background questionnaire questions as they’re supposed to be read and not paraphrasing it and I suppose it goes for any survey unit and interviewers will often think they’re being helpful, you know they’ll paraphrase the question for someone or they’ll add a bit a text if somebody hesitates and they don’t realize that what they’re doing is that they’re affecting the question that they’ve just asked and you’re never sure and well and they can’t do that really and it’s very hard to get people out of that. Even you mean these interviewers would have known that we were recording them, they would have switched on the recording, they knew they were being recorded and yet they would do some things that were just you know blatantly not what they were told to do at the training just a couple of weeks previously. So, no I wouldn’t say it happens wholesale but you always get some interviewers who, they’re out on their own, they’re in the field on their own and they don’t even realize that what they’re doing is affecting the data. (Interview, PIAAC official, 2014)
Blaise also tried to ensure that interviewers did not deviate from the script by ‘skipping a mandatory input field or entering values that were not compliant with a mask, a set of acceptable values, a field length limitation, or a numeric range’ (OECD, 2013b: 10, Chapter 7). If they did, interviewers would be greeted by a popup window that would not let them proceed with the e-assessment until the task had been performed correctly. No data would be sent to the national or OECD servers or without Blaise’s approval.
The role of software actants is important, partly because they also act as the ‘supervisory staff’ (OECD, 2010b: 113) previously mentioned. These staff members included human actors, yet much of this supervisory work was delegated to software actants. The relationship between data production and software actants is a significant one. The designers of this e-assessment sought to ‘minimise interviewer error and to ensure the collection of high-quality data…automated reports, used in conjunction with other measures, are integral to the successful monitoring of data collection’ (OECD, 2010b: 116). These digital entities directed the interviewers’ and respondents’ actions through tightly scripted workflows and protocols.
By automating the ‘collection’ of data, the OECD was able to act at a distance. Action at a distance is a term that explains how actants, through a series of technical inventions and although separated by thousands of kilometres, are able to link calculations made at one site to actions performed in another site on the periphery (Latour, 1987). For a sprawling enterprise such as the PIAAC, being able to coordinate and administer the calculations made on each laptop with the centre through the faithful and constant inscription of traces is necessary to manage so many people on a large scale and over such large distances.
The presence of these digital actants was also made visible through breakdowns and problems between the software and the more tangible hardware. In the literature around e-assessment (and e-learning), terms such as ‘virtual’ or ‘dematerialized’ tend to exaggerate the intangibility of digital technologies. An essential actant during the e-assessment events was the laptop and part of the ‘physical context constituted by material and digital tools and other artefacts, including those that are bearers of texts’ (Goodyear and Carvalho, 2014: 140). The laptops, although differing from country to country, all contained the same software actants.
One of the difficulties came from the conflict between Blaise and the OECD’s assessment software, TAO, that ran on a virtual machine within the laptop’s operating system. As TAO was coded in Linux, a third programming layer was needed to allow them to communicate. Due to the OECD’s secrecy requirements, technical information about TAO was limited. Unfortunately, this caused frequent problems as the software layers caused frequent crashes, as reported by interviewers:
Instrument was too vulnerable to power outages (if the connection to the outlet was loose or if someone turned off the switch to the outlet, etc). Could not restore the VM in these cases which was frustrating for willing respondents. Screen would go dark sometimes and had to wait up to half-hour for the instrument to be restored. Break-offs resulting in data loss, system should have auto-save function. (Hogan et al., 2014: E6)
As a result, interviews sometimes lasted for up to four hours due to rebooting the computer and, in some cases, having to re-enter the data.
These breakdowns are not a criticism of the hardware or project design. They do, however, serve to highlight the presence of code in e-assessment and demonstrate how ‘code, woven into the background of transactions, habits and perceptions, does not often become visible, except in breakdowns, failures and at certain other moments’ (Mackenzie, 2006: 170).
Tracing microdata
Unfortunately, much of the contextual data that are commonly found in ethnographies was not gathered during the PIAAC. Despite spending several hours with each respondent, interviewers did not take photos or make video recordings and rarely made audio recordings. As participants had not been asked for written consent, the information recorded is not accessible to researchers and is used primarily for quality control procedures. Strict concerns about privacy meant that it was impossible to access observational data. As one PIAAC official said, ‘it was only the background questionnaire that was recorded so we don’t really know what happened during the assessment. Presumably nothing would have happened, the respondent would have filled out the assessment themselves’ (Interview, PIAAC official, 2014). Fortunately, however, there are ways to glean from the prodigious quantity of files and traces kept some idea of what happened during these e-assessment events.
Profoundly quantitative in both conception and execution, the PIAAC also contains a less well-known, and much smaller, quasi-qualitative dimension. After each e-assessment event, interviewers had the possibility of recording their impressions. These data are extremely hard to get, protected by legislative requirements regarding privacy and there is a low appreciation of its worth:
I think we ended up suppressing the comments section at the end. I think every country suppressed all that from the international datasets anyway because it’s just, a lot of the stuff in it was just rubbish. It was just interviewer comments on what happened during the interview. When you say it was just dumped do you mean that it was just dumped or archived somewhere? No, it would be on, I suppose, our national files but it didn’t go into the international database. (Interview, PIAAC official, 2014)
However, not all was lost and it was not all rubbish. Descriptions of the e-assessment event can be found in the observation module, a generally neglected part of the PIAAC, about which at the time of writing no research has been published. Once the interviewer had left the respondent’s home or office, they were prompted by the CAPI software to record details about the context of the assessment and interview:
When the interview was complete and the interviewer had left the household, the interviewer used the computer to answer a series of questions which collected information about the interview setting such as any events that might have interrupted or distracted the respondent during the exercise. (Australian Bureau of Statistics, 2013)
These data, named variables ZZ1–ZZ6, were included among the 1328 variables included in the Public Use Files freely downloadable from the PIAAC website (OECD, 2012). Originally not part of the survey, they were developed for the United States study and eventually included in all studies:
Another U.S. enhancement for the Main Study was the development of the observation module questions (Consortium ZZ section) in Blaise rather than relying on the internal TAO instrumentation section. This section recorded interviewer observations about the case after the interviewer left the household and therefore required the interviewer to pause the VM software and come back at a later time to answer these questions … The Blaise ZZ module data was inserted into the DME data repository during post-processing aggregation. The U.S.-developed ZZ Blaise also allowed us to add two U.S.-specific questions (observed economic status and presence of second respondent). (Hogan et al., 2014: 5-5)
The final list of ZZ variables common to all participating countries was as follows:
From these traces of social and spatial interactions, the ZZ variables make it possible to partially reconstruct some of what happened during the e-assessment event itself.
Traditionally, assessment events are closely invigilated with precise instructions on seating arrangements and table spacing and lists of materials permitted or forbidden to avoid unfair advantages, as well as rules on assistance to ‘prevent candidates from viewing the work of others, intentionally or otherwise’ (CIE, 2012: 52). In a similar cognitive test, the iSkills Assessment, made by the designers of the PIAAC cognitive test (ETS), a test taker can be disqualified for committing any number of infractions from a long list, such as using a telephone, camera, giving assistance, failing to follow directions or behaving inappropriately (ETS, 2011). As with any high-stakes test, the rules and customs around the behaviour of the proctor and participant are strict.
The PIAAC, however, was a low-stakes assessment with respondents giving their time for a relatively modest reward, such as lottery tickets or gift vouchers. So while great care was taken to train interviewers on how to create the test environment that would not interfere with the validity of the e-assessment, invigilation needed to adapt to the circumstances. When respondents needed help from family members during the background test (e.g. interpreting), this was permitted. However, ‘help of any kind—including translation support—was forbidden for the direct assessment’ (Zabal et al., 2014: 27). Forbidden or not, however, giving help and bending the rules is a characteristic of literacy practices that found its way into these e-assessment events.
The first question in the observation module was designed to establish the presence of anyone other than the test taker. Routing in this section was much simpler. The interviewer would see on their screen:
Besides the respondent, was anyone else present during the interview? 1 Yes 2 No Depending on the answer given: Routing: If ZZ1a=1 go to ZZ1b, else go to ZZ2
While most interviewers and respondents were alone together, and since the e-assessment events all took place in the home, many respondents had other people present with them (Figure 2). All told, there were 46,424 ‘additional presences’. No information is available on who these presences were.
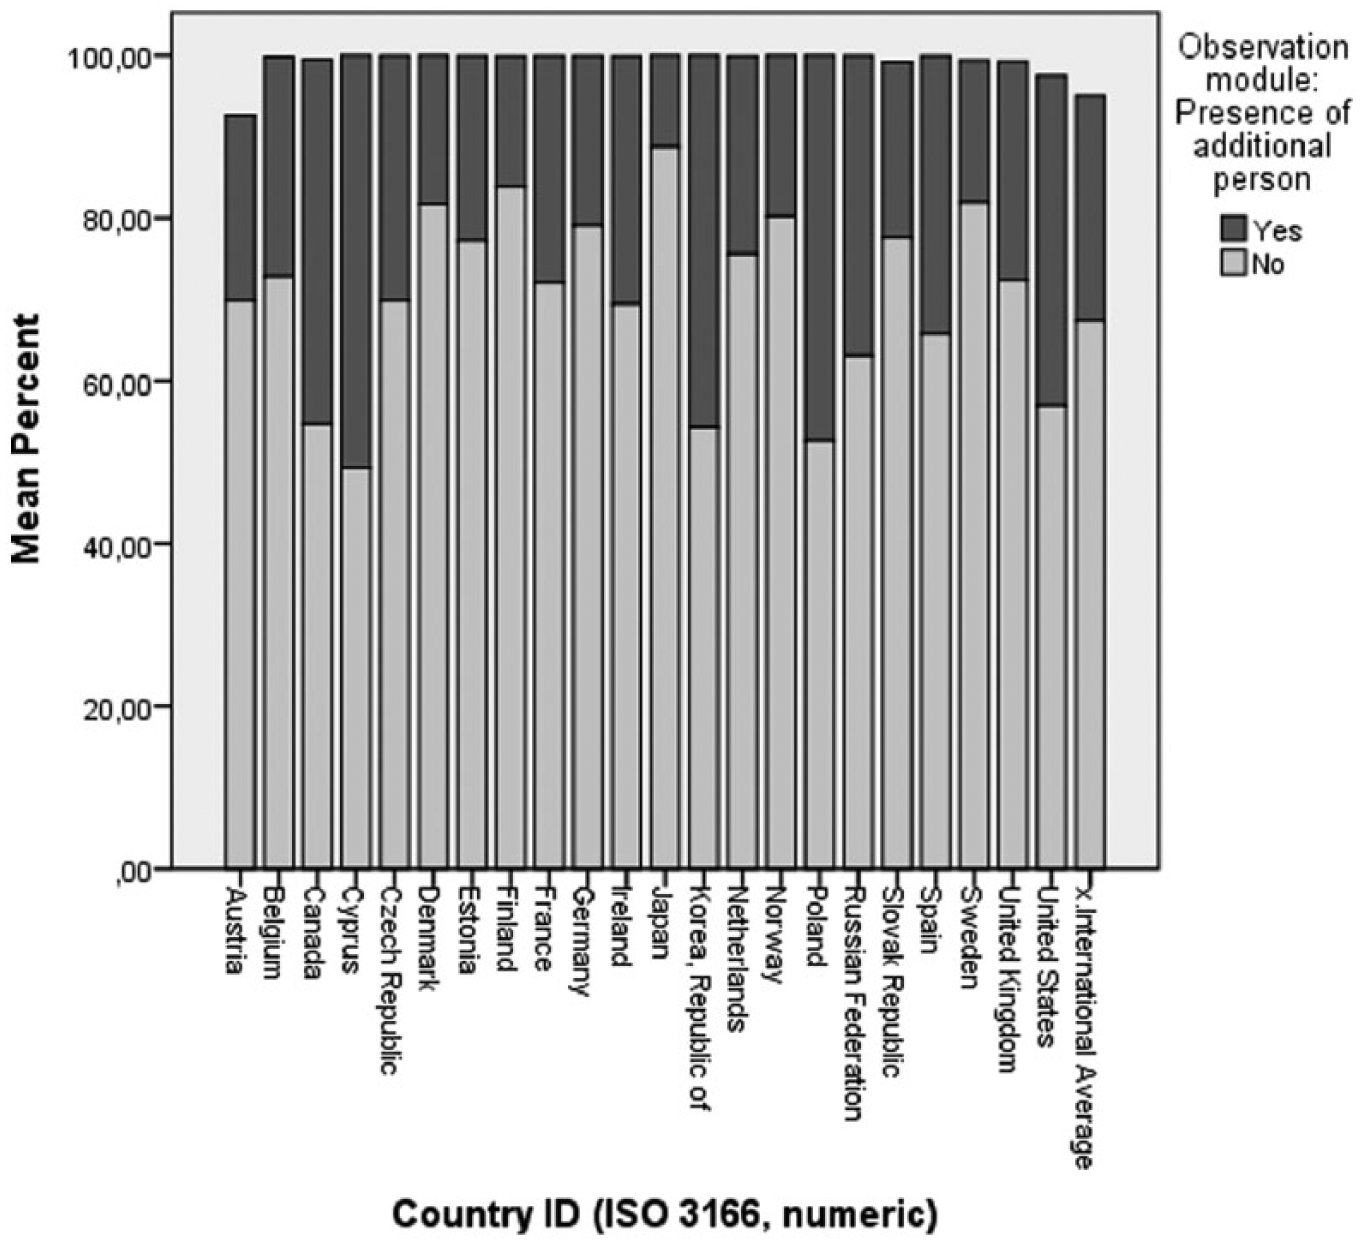
Presence of an additional person.
Both of the variables ZZ1b_01 and 02 sought to quantify the number of people who were assisted in some way in either the background questionnaire or the skills assessment.
Although the majority of people did not have any assistance in either the background questionnaire or the skills assessment, 6876 and 4429 people did. The observation module does not specify who did the helping and, since this part of the e-assessment was not recorded, it is difficult to know if these helpers were household members or interviewers themselves, since the question is open to interpretation. There is, however, some evidence to show that interviewers were not always able to ‘stick to the script’, and in some cases helped the respondents. Listening to the recordings, the PIAAC project managers noticed that interviewers would sometimes ‘paraphrase the question for someone’ or ‘add a bit a text if somebody hesitates’ (Interview, PIAAC official, 2014). During the training sessions, interviewers were drilled on how not to give any assistance, to ‘just shrug your shoulders and say “look I can’t help you but do the best you can”’ (Interview, PIAAC official, 2014). However, while not helping someone who is visibly struggling may be required to ensure high rates of statistical reliability when face to face with the respondent, it can be hard to resist. As one PIAAC official said:
It’s very hard to get people out of that. I mean these interviewers would have known that we were recording them, they would have switched on the recording, they knew they were being recorded and yet they would do some things that were just you know blatantly not what they were told to do at the training just a couple of weeks previously. (Interview, PIAAC Official, 2014)
Again, this is not to say that there was a wholesale flaunting of the guidelines, nor is there any intention to pronounce on whether this is ‘good’ or ‘bad’ practice. On the whole, the PIAAC is more remarkable for its success in achieving high rather than low levels of standardization. However, what is of interest to this inquiry is how ‘assessment events did not involve isolated, disembodied individuals’ but ‘embodied social actors with status, emotional lives and agency’ (Maddox, 2014: 5). The situated character of these e-assessment events is further evidenced by data gleaned from the other variables ZZ4–ZZ06. In each of these we see that, to greater or lesser degrees, respondents were not in standard assessment environments. While the majority of respondents managed to find a distraction-free place for the e-assessment event, the data produced by the interviewers filling out the observation module show that thousands of respondents remained immersed in their social environment; answering the telephone, the noise of the television or game console in the background, doing household chores, looking after children or simply holding a conversation with someone else.
Occasionally, the daily life of the respondents would overflow and escape the neatly framed reality of e-assessment standards:
The second major difficulty was according to us, that the interviewers, for long stretches of the interview, had absolutely nothing to do. This proved to be very difficult and created a source of tension during the interview … Sometimes it went for too long, the interviewer wanted to finish the interview. For stretches of up to one hour or an hour and a half, the interviewer had to sit there doing nothing, trying to avoid looking at the respondent too much and avoiding making them feel uncomfortable, trying to make their presence as unobtrusive as possible… Not only that, but they were in someone’s home too. Exactly. Sometimes there were children around and you’d have the husband who popped his head around the corner from time to time … It’s purely anecdotal but to help them pass the time, another member of the household would offer interviewers something to drink, sometimes quite a few drinks, and we had a few cases where interviewers went back home in a quite a sorry state. (Interview, PIAAC official, 2014)
It may be the intent of assessment makers to assess a carefully conceptualized construct of literacy as something that resides within individuals. However, more relational stances cannot dissociate the test taker from the social and material world around them and literacy practices are more than just ‘observable units of behaviour since they also involve values, attitudes, feelings and social relationships’ (Barton and Hamilton, 2003: 6). Although aspects of certain literacy practices are observable, if only indirectly, this New Literacy Studies perspective introduces an important point that is supported by data produced both by proponents of standardized literacy assessment and its critics. The relationships between helpers and additional presences, interviewers and respondents, rather than being extraneous variables, provide evidence that by overly focussing on the textual representation of literacy within the e-assessment, the literacy practices around the e-assessment were, albeit ephemeral and difficult to observe, no less valuable or relevant.
Calculating values
Assessment technologies allow for the instantiation of methodological and epistemological assumptions that are not always easily discernible. This identification of assessment with the very technologies and techniques used to assess means that ‘assessment practices implicitly endorse society’s dominant ideologies without questioning them’ (Delandshere, 2010: 121), thus being unwitting vehicles of theories of what it means to know and what it means to be.
This is not to claim that the technology determines how assessments are made and done. However, the technical skills or financial resources required to deviate from pre-made assessment authoring tools are often considerable and have a normalizing influence. As such, the logic of standards, that seeks to ‘construct uniformities across time and space through the generation of agreed-upon technical rules’ (Timmermans, 2014: 79) means that un-standardized assessment risks making assessments that will not be durable or persistent and, thus, taking the risk of being marginalized.
When looking at the neat rows and columns of tabulated scores and anonymized candidates produced by assessment events, it is sometimes easy to ignore the context that produced these results. Rather than seeing assessment as either a technology or a socio-political practice, I argue that e-assessment is a sociomaterial practice. That is, instead of framing assessment of a learner’s ability as an analysis of discrete cognitive features of the individual or as a critical understanding of the political and social forces played out through assessment, it can be seen as an assemblage of human and non-human actants that materialize and translate the standards and values attached to assessment.
Assessment embodies our values and ‘the decision to classify students by their standardised achievement and aptitude tests values certain kinds of knowledge skills and renders other kinds invisible (Bowker and Star, 1999: 6). Assessments are not neutral tools, but are in fact types of valuemeters, that is, the tools ‘that transmute facts in to values and values into facts’ (Latour, 2014: 1).
Once these facts, presented as ‘seemingly scientific and nonpolitical modes of measurement’ (Williamson, 2014: 8) have been made, they can be recombined or cross-tabulated to…
…create statistical tables and charts to explore adults’ (16-65 years of age) performance in literacy, numeracy, and problem solving in technology-rich environments. Data can be analysed by country as well as in relation to demographic characteristics, social and linguistic background, education, use of skills and employment status. (OECD, 2012)
The visualizations produced from data produced by the PIAAC are dependent on table-reliant technologies, such as spreadsheets and databases, and stimulate the development of numerical data production. In this way, centres of visualization are a semiotic extension of centres of calculation and serve to intensify the already powerful homogenizing agency of the spreadsheet (Law, 2002). Coupled with statistical technologies, adept at ‘constructing the properties of wholes from samplings of their parts’ (Lemke, 2000: 9), e-assessment is an attempt to translate the heterogeneous world of adult literacy practices into data that can populate equivalence spaces that make comparisons possible (Hamilton, 2012). For this reason, when the courses of action that create the polished data displays are treated as matters of concern they become porous (Mayer, 2012) and provide insights into not just what they represent but how the representations come into being.
Conclusion
Producing data on education and training, these surveys are chiefly statistical accounting devices, informed by human capital theory and not designed with the explicit intention of informing curriculum or modifying organizational and educational practices. In the rare instances where the literacy assessment framework has been applied to adult training, it has displaced the expert knowledge and practices of educators in favour of those of psychometricians and, for some critics, the ‘absence of pedagogically useful insights’ (Pinsent-Johnson, 2014: 202) can do more harm than good.
The PIAAC occupies the curious place of being simultaneously a low- and high-stakes summative assessment. Nevertheless, the offhand tone of the PIAAC as ‘PISA for everyone else’ (Prats-Monné, 2014) belies the very serious totalizing ambitions of the PIAAC’s creators. In mapping out the skills and background of citizens from childhood to retirement, the PIAAC creates an oligopticon that provides a narrow but extremely detailed view of everyday learning and working, stabilized through visualizations and spreadsheets that neatly classify people into those who can read and count well and those who cannot. This totalizing impulse is not at all unique to the PIAAC’s inventors, for every ‘ideal classification system provides total coverage of the world it describes’ (Bowker and Star, 1999: 12).
However, Fenwick and Edwards argue that this understanding of ‘standards travelling around different regions and insinuating themselves into different messy negotiations among actors in ways that translate all into an extended network is inadequate to describe educational practice, or arguably any practice’ (2010: 97). Rather than being an attempt to debunk or undermine efforts made by the OECD or European Commission to better understand literacy, this paper offers theoretical and methodological possibilities for generating detailed accounts of the sociomaterial technicity involved in the production of educational data. Investigations into the ‘messy’ and contingent reality of e-assessment can provide insights that are of interest and relevance to educators and policymakers alike, and thus resist attempts to make e-assessments that test no one in particular into tests of everyone.
Footnotes
Declaration of conflicting interest
The author(s) declared no potential conflicts of interest with respect to the research, authorship, and/or publication of this article.
Funding
The author(s) received no financial support for the research, authorship, and/or publication of this article.