
Abstract
This is an article about secondary schools in England, and what type of school is fair and efficient for a national education system. It discusses what ‘fair’ could mean in this context, summarises some key policy revisions since 1944 in this light, and reminds readers of the damage caused by unfairness within education. Most notably it discusses the almost complete introduction of comprehensive schools by the 1970s, and the subsequent proliferation of new school types. The article then presents the methods used for the illustrations from secondary data that follow. Based on the Annual Schools Census 1989 to 2014, the article shows that the clustering of disadvantaged students using all available indicators has declined over historical time. This may be largely determined by an increase in prevalence created by immigration, sensitivity and improved diagnosis, and economic downturn. However, the system shows considerable variation between regions and areas linked to the local diversity of schools. Selective, faith-based, converter academies and free schools, as opposed to local authority comprehensives, are disproportionately in areas with the greatest segregation of disadvantaged students. And this occurs for no gain in improvement. The article concludes that the comprehensive ideal is not simply worth retaining, but that its implementation could be seen as the clear ethical duty of any secretary of state.
Introduction
A state-funded, compulsory, universal school system ought to be fair – because all citizens are liable to pay for it, and all children and young people are required to attend. It is the only major part of public policy in a modern state that is applicable to all citizens (whereas health, criminal justice and social housing, for example, are only intended for a subset). However, fairness is not a simple concept. There are competing principles of justice, which tend to be applicable in rather different domains (Gorard and Smith, 2010). The applicable principle needs to be agreed before it is possible to say whether a policy is fair or not, and what to do about it if it is deemed not fair (Bøyum, 2014). Much education policy worldwide merely assumes a principle of equal opportunity, and assumes it to be fair, based as it is on ‘merited’ differences in results. However, merit is a difficult concept to sustain or even measure in terms of individual talent and effort (Stables et al., 2014), and the unequal outcomes even from purportedly fair equal opportunity processes can be unattractive (Nahai, 2013).
One of the competing principles of equity relevant to education is that all students and potential students must be treated equally, other than as specified below. This principle is stronger than merely offering equivalent opportunities, and generates many implications for practice. Funding would have to be equivalent for all equivalent students in each context. Education systems would be inclusive, in the sense that all students should attend the same kind of school and have the same kind of chances. Provision must be free or at least affordable for all. Institutions should not be selective on the basis of ability, need, personal characteristics, or family background (or else students would not be being treated equally). There is no need for specific diversity of institutional provision, so that the intakes can be as mixed as possible, socially and ethnically. All students should have the same opportunities wherever they live in the country. There is no need for deliberate tracking of young people onto different trajectories of unequal prestige and exchange-value. There is a need for a national curriculum of minimum entitlement that will also aid teaching staff, and student mobility between institutions.
A second competing principle, partly complicating the first, is that objectively disadvantaged students will, on average, need extra help. In this case, treatment must be unequal. This help is equitable up to an agreed point or threshold of entitlement, such as functional literacy perhaps. Again, this principle generates many implications. It leads to the policy of extra funding for each disadvantaged student, such as the Pupil Premium in England (Gov.UK, 2014), to help fund catch-up and second-chance interventions. The funding must be targeted accurately and should continue for only as long as it is needed (until the threshold of entitlement is reached or the student is no longer objectively disadvantaged). Children with learning challenges, disabilities, behavioural problems, and those not yet speaking the language of instruction must be taught in mainstream settings as far as possible (schools are social arenas with vertical as well as age-related activities, for example). The extra funding would follow them and pay for additional assistance while it was needed. It does not imply that such children should be taught in separate streams or institutions (Gorard et al., 2014).
A third relevant but competing principle of equity in education is respect for the individual. This applies mainly to interpersonal respect, as in the interactions between teachers and students (Gorard and Smith, 2010). And it would have likely benefits in terms of aspirations, appropriate trust in authority, and civic participation. It involves considerable autonomy for learners and minimising the power differential between students and teachers (O’Grady, 2014). And this, in turn, currently requires better development of teachers in respect of equity issues. It requires socially and ethnically mixed schools (as above), so that schools cease merely to represent divisions in wider society but can begin to overcome them by providing a decade or more of experiencing how society could be.
How well does the secondary school system in England meet these suggested requirements?
The rise (and fall) of comprehensive schools
In England, the 1944 Education Act led to the establishment of a tripartite system of grammar, secondary-modern and technical schools. Allocation of school places was based first on ‘merit’, which in reality meant selection by ability or prior attainment using the 11+ examination (taken around the age of 11). This was intended to determine a ‘suitable’ type of school for each pupil (Stillman, 1990). Only then was a specific school selected within that type based on a combination of primary and secondary school links, and parental wishes (Gorard et al., 2003). Some areas, rural ones especially, did not have the school places to provide all three (or even two) types of schools, and this distorted school intakes. Some children did not sit the 11+, sometimes because their families felt it was not appropriate. The result was a divided school system with the supposed selection by ability leading to considerable between-school segregation in terms of socio-economic status (Gorard and Rees, 2002).
In 1965, Circular 10/65 from the Department of Education and Science purportedly ‘requested’ but actually required (for receipt of funding) all local education authorities to prepare for re-organisation of their local schools along comprehensive lines. And Circular 10/66 required all newly funded schools to be comprehensive. By 1969 the selective tripartite system and the notion of selection at 11+ were disappearing. Most authorities moved towards a system of comprehensive secondary schools which were largely of one type, and which catered for students across the full ability range. The mixing of intakes was usually achieved by banding, with each banded school constrained to take a certain proportion of children across each ability band. This then led to rapid de-segregation by social class as well (Gorard et al., 2003). The tri-partite system was formally abolished by the Education Act 1976. The system of allocating school places remained varied but a common model was the zoning scheme, in which students at each primary school, or on the basis of where they lived, were automatically allocated a place at a specified comprehensive secondary. Even so, there was considerable variation in the types of comprehensives, in terms of sex and age range (most commonly 11–18 years old, but also including 11–16 and 13–18). Some of the schools in most authorities had a religious basis, including Anglican, Roman Catholic and Jewish. While nominally comprehensive, these schools routinely selected children on the basis of their family religion and observance. This is important because any school that selects its intake in terms of religion may also tend to increase segregation by ethnic origin, parental income and education, or social class (Allen and West, 2011; Harris, 2012). A very few authorities retained (and still retain) selection at age 11, and have a bipartite system of school provision. And similarly, any school that selects students by prior attainment will increase segregation by social class because of the well-established association between the social background and attainment.
The 1988 Education Reform Act introduced greater power for parents to express and insist on a right to choose a school for their child, in an attempt to overcome the zoning approach which had meant that schools, while not being selective, simply represented the nature and cost of nearby housing. In fact, the cost of housing and the perceived attractiveness of schools had begun to interact, reinforcing the impact of existing residential segregation on school intakes – a common issue (Frankenberg, 2013). Equally importantly, this Act moved towards comprehensive schools in process and nature as well as structure by creating a national curriculum stating what each child was entitled to know, allowing local communities and parents a greater role in school governance, and setting up regulatory bodies for the national qualification of teachers and the inspection of schools. At around the same time the main systems of qualifications for students aged 16+ were completely unified, further increasing moves towards the comprehensive ideal (even though some of the more minor elements of the Act also led to more diversity of school types).
There are valid criticisms of how these measures were implemented in practice, with the qualifications system soon starting to splinter again, and healthy continued debate about what precisely a national curriculum should contain. More importantly, there is still a considerable ‘poverty gradient’ or gap between the educational attainment of poorer children and the rest. Nevertheless, England today is a generally fairer country in terms of educational provision, opportunity and outcomes. Initial education is free, compulsory, and universal. The school system has evolved through its funding, its laws about when and how school places are allocated, regulations about teacher development, inspections, national curriculum and standard attainment in key stages to try to make as little difference between schools as possible. Students with special needs have been increasingly included in mainstream schools. England has one of the lowest levels of disadvantage in the PISA study, and average strength in the relationship between socio-economic background (SES) and attainment (Knowles and Evans, 2012). Over 99% of all students, including those in special schools, hospitals and referral units, attain a GCSE qualification or equivalent. Over decades, the proportion of the population with any level of qualification has risen, and the gaps between social and economic groups have slowly reduced (e.g., DfE, 2013a, 2013b). The system has become fairer in terms of school intakes, equal opportunity legislation, child protection, student and parent voice, and participation in subsequent and higher education. Some, at least, of this progress is associated with the comprehensive system.
Not all schools became comprehensives, and moves towards differentiating schools again started happening almost immediately, and have continued since. Most recently, since 2000, successive administrations have introduced academies and free schools (Gorard, 2014). All new types of schools in England since the 1970s have been similarly top-down, the brain-child of new secretaries of state. None of the new diversity has been driven by parental demand. Originally, the academy programme was intended to deal with schools that were deemed failing, and to improve student results in heavily disadvantaged areas. Therefore, the schools involved in the beginning had very disadvantaged intakes and so, where they changed their intake as a result of converting to an academy, this was no threat to local levels of socio-economic segregation between schools. For example, where new academies ended up taking a smaller share of local free-school-meal (FSM) eligible students, this meant that neighbouring schools had to take more and so the local clustering of poorer children into specific schools actually reduced.
However, the original idea of dealing with schools in spirals of decline has been over-shadowed more recently by the purported school improvement agenda. Almost any school is eligible to convert to being an academy, and these include fee-paying schools, ex-grammar schools and Foundation schools – both primary and secondary. Since 2010, the free schools have been set up as academies from the start. All these are clearly nothing like the most disadvantaged schools in their area, and were not in anything like a spiral of decline beforehand. This raises the very real danger of increased local SES segregation between schools, especially if the new academies also begin to take a smaller share of FSM eligible students than the early ones did (Gorard, 2009). Over time and across differing political administrations in the UK, the number of these autonomous schools in England has grown quickly. They now form the majority of all state-funded secondary schools in England. Recent education policy in England is covered more fully in Harris and Gorard (2014).
Why might this increasing diversity of schools matter?
The importance of school intakes
The existing research literature suggests diversity of school types as one of the chief causes of socio-economic segregation between schools (Lindborn, 2010). The authors of Circular 10/65 were well aware that the nature of school intakes – who goes to school with whom – matters. In England, there is disproportionate clustering of students within schools in terms of their personal characteristics, such as family income and ethnic origin (Gorard et al., 2013a). International studies illustrate that the stratification of students between schools by their parental income or immigrant status, all other things being equal, is linked to lower overall attainment and to a larger achievement gap between advantaged and disadvantaged students (Condron, 2013; Goldsmith, 2011; Vasque and Home, 2013). The social and racial segregation of students is strongly linked to lowered patterns of language development (Belfi et al., 2014) and lower percentages of high school graduation and college enrolment in the US, even after controlling for individual and other school factors (Palardy, 2013). The mix of peers in school is linked to these longer-term outcomes and also to wider non-cognitive outcomes such as students’ social skills (Gottfried, 2014), emotional and behavioural problems (Muller and Hofmann, 2014), sense of justice (Gorard and See, 2013), and civic knowledge and engagement (Collado et al., 2014).
Clustering students with similar backgrounds in schools therefore tends to strengthen social reproduction over generations because students in segregated poorer schools can receive poorer instruction at school, less qualified teachers, substandard resources/facilities and generally poorer local services (Harris and Williams, 2012; Kalogrides and Loeb, 2013). The school mix of students by socio-economic status (SES) even seems to influence how students are treated within each school (McCoy et al., 2014). These disadvantages feed on each other and perpetuate problems. Segregation by poverty will tend to depress the scores of the already disadvantaged, and so increase the poverty gap in attainment (Boliver and Swift, 2011).
In contrast, comprehensive, centralised and equitably funded school systems tend to produce both better outcomes overall and also smaller attainment gaps between rich and poor children (EGREES, 2005). Eurydice (2013) and OECD (2014) show that countries with high equity school systems do not use tracking by ability or have any other national system of selection. Countries with lower segregation between schools, more egalitarian systems and low achievement gaps also tend to have higher average attainment and also the highest percentage of very skilled students (Alegre and Ferrer, 2010). Students’ achievements then depend less on their social and cultural background (Schutz et al., 2008).
In light of these potential costs and benefits what difference has the increasing diversity of school in England made to patterns of school intakes?
Methods
To address the question above, this article is based on an analysis of the Annual Schools Census (ASC) using figures for all secondary mainstream state-funded schools in England from 1989 to 2014. The ASC includes the number of full-time equivalent students in each school, the number taking free school meals (labelled FSMt in figures and graphs below), the number known to be eligible for free school meals (FSMe), the number known to have a statement of special educational needs (SENs), or special needs without a statement (SENn), the number known to have English as a second or additional language (ESL), and the number of each known ethnic origin. The precise operational definition of each of these changes varies slightly over time, and this affects the perceived prevalence of these indicators (a point picked up later in the article). FSM is only available for families legally defined as living below a poverty threshold (Gorard, 2012). Some students are legally eligible for FSM (FSMe) but not all of these choose to take the meal option (FSMt). Ethnic origin is converted for the purposes of this article into a binary variable based on the number known not to have reported being of the majority white UK ethnicity (labelled NW). This compromise is used because many of the minority ethnic groups are very small. Each of the above is an indicator of potential disadvantage in education (although some of the very small ethnic minority groups such as Indian and Chinese have high average attainment at school).
An index of segregation (the Gorard Segregation Index or GS) was calculated at national and local authority levels, using the relevant annual figures for each school. A residual is computed for each school, which is the absolute value of the result of two proportions. The first is the number of potentially disadvantaged students (such as those with a statement of special educational need) in that school relative to the number of disadvantaged students in the population. The second is the number of all students in that school relative to the number of all students in the population. The sum of these residuals for all schools, divided by two, is the value for GS for that year and indicator. Dividing by two yields the proportion of all disadvantaged students who would have to exchange schools in order for all schools to have their ‘fair share’ of disadvantaged students.

Where:
Fi is the number of disadvantaged children in school i
Ti is the total number of children in school i
F is the total number of disadvantaged children in the region
T is the total number of children in the region.
A second analysis is based on the equivalent figures for 36 local authority areas (LAs). These LAs are the ones with the highest, lowest and median levels of segregation for each of the six indicators of potential disadvantage (FSMe, FSMt, SENs, SENn, NW, ESL), and the areas with greatest, lowest and median growth in those levels of segregation from 1999 to 2012. This allows a more in-depth consideration of local figures while retaining variation between the selected authorities. The dataset also contains potential explanatory variables (such as local unemployment figures, population density, and the nature of local schooling) from the Department for Education, and the Office for National Statistics. These 145 explanatory variables are used to identify possible determinants of local patterns of social segregation between schools, via correlation (Pearson’s R).
School diversity and segregation
As measured by all available indicators of disadvantage in the ASC, the long-term trend in England has been that segregation between schools has generally been reducing (Gorard et al., 2013a). In Figure 1, the results for segregation by take-up and eligibility for free school meals at the national level are almost identical, as are the results for primary and secondary schools. There are different levels and trends for FSM eligibility, special needs, ethnic minorities, and students with English as a second language, which suggests that each indicator may have its own determinants. In general, the historical trend for all except FSM eligibility has been downwards, with a plateau in recent years for several of them. All of the indicators seem to converge towards a common level of segregation to some extent. Yet all seem to be stuck at a lowest level of around 25 to 30%.
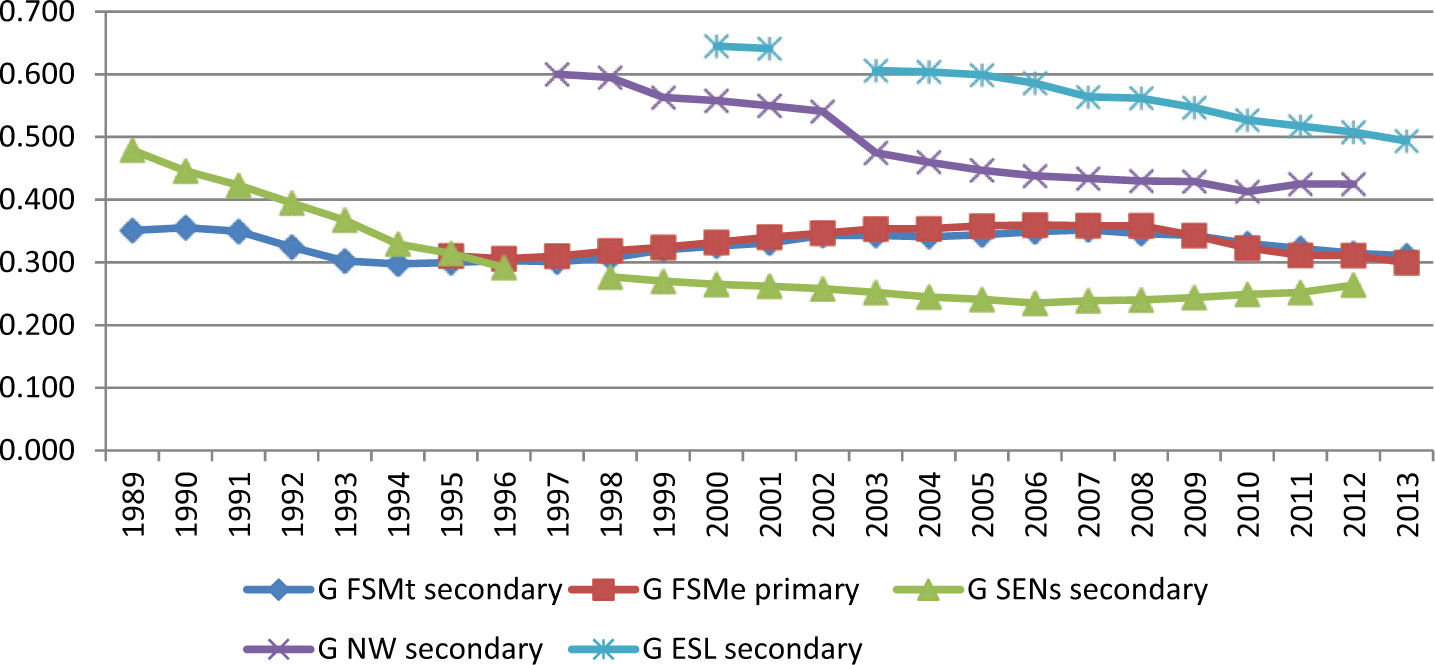
Segregation indices for five indicators, all schools, England, 1989 to 2013.
Over 25% of students would have to exchange schools for there to be no clustering of similar students, and the percentage would still be higher for some measures such as the proportion of students speaking English as a second language. These levels and their annual variation are largely explicable by factors which are not part of schooling itself. These factors include residential segregation, the economic cycle, local population density, local transport quality and the level of recent immigration (see Gorard et al., 2003). Segregation also tends to increase where school places are allocated by any policy that links them to the students’ area of residence. Where criteria such as catchment areas or distance travelled to school are used to decide contested places, then school intake will be very similar to the local population and so represent the cost and quality of local housing. And in turn the cost of housing will be affected by the perceived popularity of the local schools.
Some students are not educated in mainstream state-maintained secondary schools. Around 7% are educated in private fee-paying schools, and less than 1% in hospitals or Pupil Referral Units. The small annual changes in these figures are not related to the level of SES segregation in the remaining state schools. Students do not actually have to move schools. Rather students are being identified differently in their existing schools. The impact on segregation is the same either way. The number of students with any indicator of disadvantage can change because of a change in population for the mainstream school system, such as those caused by increased immigration (affecting the number of non-white UK children and those speaking English as a second language). This means that schools in some areas are taking in a slightly different profile of students. The prevalence can also change due to an improvement or modification in reporting, such as greater sensitivity in spotting special educational needs or in classifying ethnic minority status. In addition, an economic downturn such as that from 2007 onwards in the UK can increase the number of FSM-eligible students, and so lead to a more even spread between schools.
Figure 2 presents findings from six illustrative local authorities, selected as the most extreme and the average local authorities (LAs). The most segregated by FSM eligibility is Trafford. Trafford still has selection to grammar schools at age 11+ which, as shown more clearly below, always tends to drive up social segregation between schools. The Isle of Wight has low segregation which is reducing over time, and does not use selection. Islington in London has the lowest segregation by FSM in the country. It is a high population density area, meaning that travel to alternative schools is more feasible than in rural areas. It also has a high proportion of the local population using fee-paying schools or schools in other LAs. This gives it a relatively uniform school population. Despite the national decline in segregation, these local authority figures show that there is wide variation between LAs, and that the variation is growing over time (there is, for example, a wider gap between Trafford and Islington, or indeed any LA, in 2012 than in 1999).
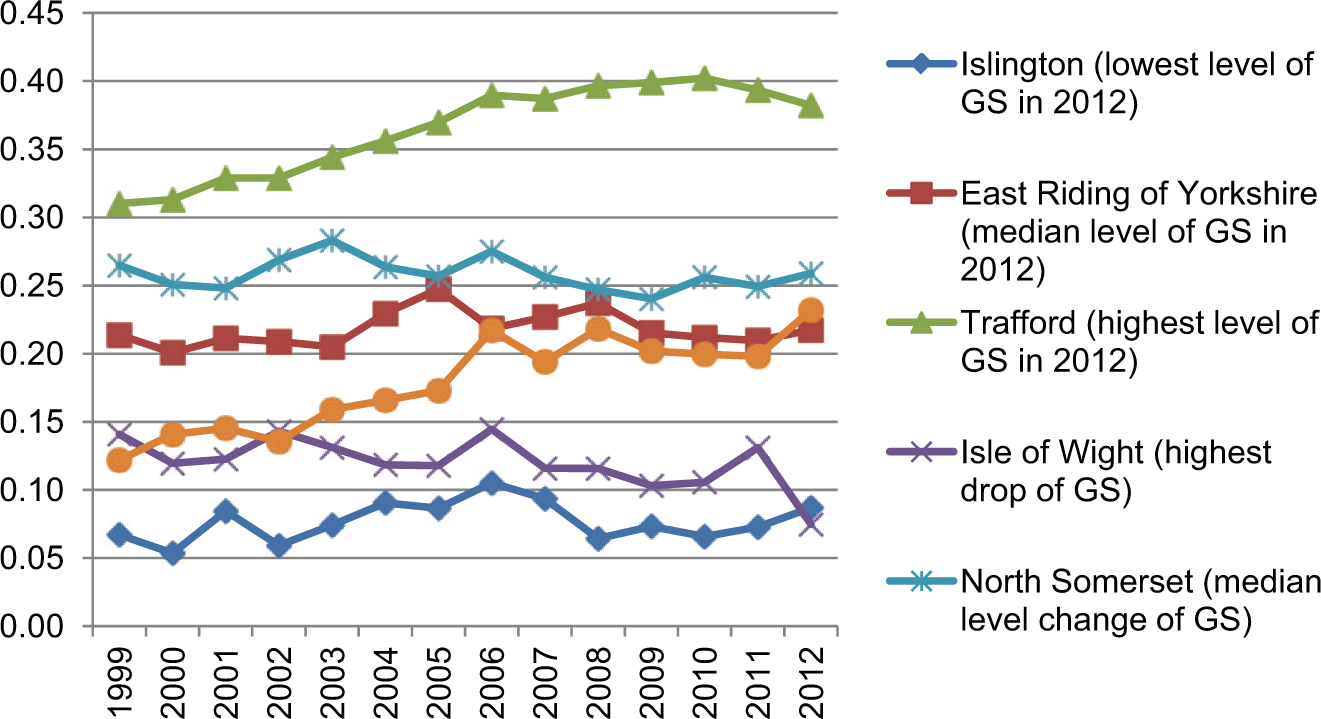
FSM eligibility segregation by local authority area, secondary schools, England, 1999–2012.
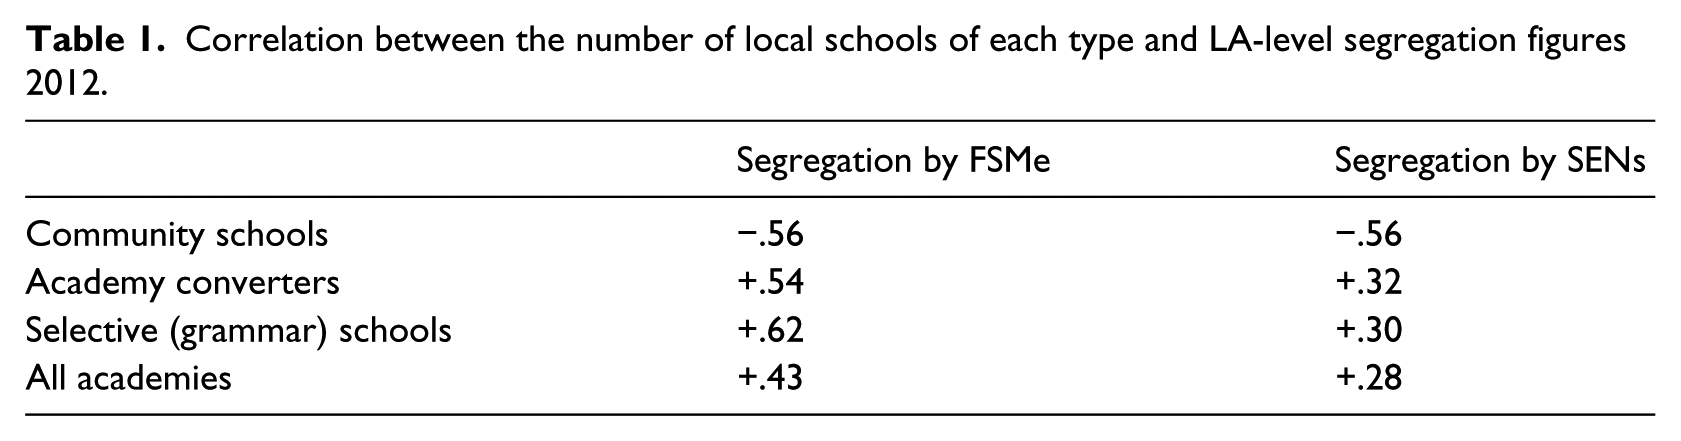
Looking next at the correlations between local characteristics and the figures for segregation, the strongest associations are between segregation and the types of local schools (Table 1). The pattern holds for segregation by FSM, SEN, ethnicity and first language. The proportion of local community schools that are controlled by the local authority, comprehensive, or at least not selective, is strongly linked to lower levels of, and reduction in, all types of segregation. This is a crucial finding. Some areas have greater diversity, and this permits the possibility of selection even if inadvertently, and leads to higher levels of between-school segregation by SES. Particularly problematic schools for levels of segregation are converter academies and grammar schools systems. These are strongly linked to higher levels of local segregation.
Correlation between the number of local schools of each type and LA-level segregation figures 2012.
The latter is made clearer in Figure 3, linking the number of grammar schools in any authority with the level of between-school segregation by poverty. All the areas with any grammar schools at all have high segregation (and poorer children are clustered into the other non-grammar schools).
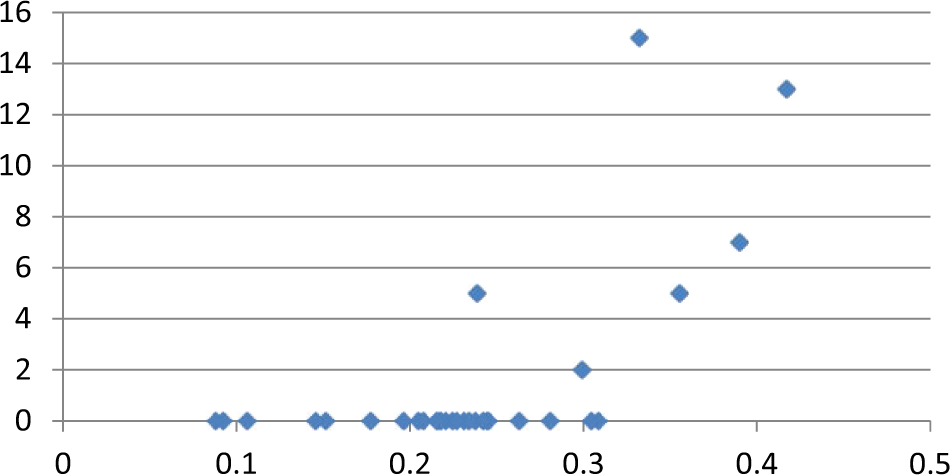
Cross-plot of local FSM segregation and prevalence of grammar schools.
In summary, segregation by poverty is highest in areas with fewest standard comprehensive schools, and lowest in areas with fewest special, selective, faith-based, Foundation, CTC or academy schools. The type of school in each area is easily the most malleable factor identified that is associated with segregation. The data here, even though looked at over a period of 13 years, cannot demonstrate a definitive causal relationship. But, unlike population changes or economic downturns, the types of schools in existence are directly under policy-makers’ control. Given that almost any type of diversity of schooling is linked to substantially greater local segregation by poverty, it is probably the diversity itself rather than the specific type of school that is related to segregation (Gorard, 2014). It would be cheap and easy to eliminate at a stroke.
Patterns of student ‘attainment’
It is clear that having segregated schools can cause considerable social damage. But are they actually worse schools for disadvantaged pupils? It is clear that attending school, as opposed to not attending school, makes some difference to attainment. Going to school is an important formative experience for young people, for good and ill. However, in a national school system such as that in England, this does not mean that any one school or type of school is necessarily more effective than any other. When studies have attempted to identify a consistently superior school or type of school, they have failed. Almost all the variation in outcomes between schools in England is explicable by the characteristics and prior attainment of their pupil intakes. With school intakes varying as much as they do at present, it is not surprising that there is considerable variation between schools in their raw-score attainment, but this is largely a reflection of the challenges facing the pupils, not an indictment of their schools and teachers.
Attempts to factor out the initial difference between school intakes and so produce fair figures for school performance include value-added progress and contextualised value-added scores. Neither has been shown to work, in the sense of identifying consistently effective schools or types of schools. What such school effectiveness models are mostly picking up is at least partly due to variation in the raw scores and factors such as missing data and small numbers (Gorard et al., 2013b), and partly a very large propagated error component (Gorard, 2010). Reported patterns of apparent differential effectiveness apply only to small schools or systems where a considerable amount of data is missing. This means that value-added progress models cannot yet be used as an ethical basis for policy or practice decisions. Whatever it is that VA is scoring, it is so unreliable that it would be absurd to encourage parents to use purported ‘school effects’ at age 16 to help select a secondary school for an 11-year-old, for example.
Recommendations
There is little or no good evidence that any one kind of school is consistently better than any other – whether for immediate attainment results or longer-term outcomes such as social mobility. This is largely because children only attend one type of school, and it is not deemed acceptable or practical to randomise a large group of children to different school systems in order to test for a causal link. There is repeated evidence that any appearance of advantage for those attending selective schools is at least outweighed by the disadvantage for those who do not. More children lose out than gain, and the attainment gaps between highest and lowest and between richest and poorest are larger as a consequence.
In England, social segregation between schools is much higher in areas with grammar schools. This is so whether the segregation is considered in terms of immigrant status, first language, ethnicity, educational needs, parental education or income. Most obviously, grammar schools have very few students eligible for free school meals. There is copious international evidence of the damaging effects, both short and long term, of socially segregated school systems. Clustering potentially disadvantaged children with similar characteristics such as poverty into the same schools is linked to worse treatment, worse teaching, more bullying, lower aspirations, less civic participation and sectarian views. Given the dangers, and the lack of evidence of any benefit, selection by ability is currently the very antithesis of an evidence-informed policy. Plausible as it may sound, selection by ability ought not to be promoted or condoned by anyone who cares about educational effectiveness or social justice.
The quality of education available in a national school system should surely not depend upon where a student lives or which school they attend. Therefore, new school types or schemes for only some schools are not the way forward. The poverty gap will more likely be reduced by reducing differences between schools, opportunities and treatments, not by celebrating them. There should be no state-funded diversity of schooling. If, for example, academies in England are really a superior form of school to the local authority-controlled comprehensives, then all schools should be made into academies. All students would then be entitled to this better form of education, rather than the state wilfully continuing to provide what they claim (by implication) is an inferior experience for some. In fact, it is not clear that academies are better than other schools, and so the money invested in them could have been used more fruitfully elsewhere. Again, the same could be said about most initiatives that tinker with the types of school available.
For the same reason there should be no 11–16 age schools alongside 11–18 schools, or indeed any variation in age range. One of these ranges will be the better for any nation or region as a whole, and should be adopted universally. If it is argued that we do not know which is best, then that means we have no reason to vary them (unless for the purposes of a genuine attempt to find out). Similarly, there should be no single-sex and co-educational schools in the same system. Again, one of these forms of schooling will be better for the region as a whole and should be adopted. It means there should be no selection by aptitude or prior attainment within a system that is also compulsory. There should be no differences between schools in terms of their faith-basis, or more simply no faith-basis at all. There should be no private investment (as opposed to welcome charitable giving to the system as a whole), and no curricular specialisms in the compulsory phase (there should be a truly national curriculum). All young people should be included in mainstream institutions as far as possible. Controlling the school mix like this is one of the most important educational tasks for central and local governments.
Given that techniques such as changing the way in which school places are allocated has no obvious financial cost, and would have a zero-sum effect on attainment at worst, there is no reason not to act. A national school system, intended to have mixed intakes, should be comprehensive in nature, and without curricular specialisation, religious identity, and financial or academic selection. The same admissions criteria should apply to every school. Schools should not select by attainment or aptitude, student background or faith. Government could offer free travel to any feasible school, not simply to the nearest available. In the short term it could offer incentives to schools taking students from disadvantaged backgrounds, ensure via banding or similar that school intakes represent the variation in the local population, and decide contested places at popular schools by lottery, not by distance or residence. Such measures would reduce social segregation between schools and slowly reduce the purchase premium on houses near desirable schools creating a backwash on residential segregation and so a virtuous circle of inclusion and integration.
Schools, in their structure and organisation, can then represent to young people the kind of mixed society that we wish to have, rather than reflecting the old inequalities in the society we actually have. Schools can provide 12 years or so of something better, which may then influence wider society when young people leave and expect the same outside schools.
Footnotes
Declaration of conflicting interest
The author declares that there is no conflict of interest.
Funding
This research received no specific grant from any funding agency in the public, commercial, or not-for-profit sectors.