
Abstract
Humans are equipped with a psychological system of followership that evolved to regulate choices of leaders based partly on would-be leaders’ physiological features. One such feature is voice pitch, which is determined by the physiology of the throat. Recent studies find that political candidates in modern elections with lower-pitched voices are generally more successful. As lower-pitched voices are perceived as stronger and more dominant, these findings have been taken to indicate a general preference for dispositional abilities in leaders to protect and prevail in conflicts. Here we extend upon these findings by demonstrating that conservatives and Republicans tend to view the world as much more competitive and threatening than liberals and Democrats. We utilize two existing data sources to show that political candidates with lower-pitched voices are preferred more among conservative Republicans than among liberal Democrats. In a third study we show that preferences for lower-pitched candidate voices stem from individual differences in Social Dominance Orientation (SDO). Importantly, across all three studies subjects’ party affiliation, ideology, and SDO only predict preferences for male candidate voices. We conclude with a discussion of the results in relation to followership psychology and general debates on the rationality of the public with respect to elections.
Introduction
Multiple human psychological systems are designed to extract information about the dispositions of others from their voices. The voice pitch of males, for example, correlates negatively with traits such as their mate value, reproductive success, and investment in offspring, and people reliably utilize the voice pitch of others to predict these traits in them (Apicella & Feinberg, 2009; Apicella, Feinberg, & Marlowe, 2007; Collins, 2000; Feinberg, Jones, Little, Burt, & Perrett, 2005; Puts, Hodges, Cárdenas, & Gaulin, 2007; Saxton, Caryl, & Roberts, 2006). Testifying the importance of vocal information in human social interaction, research has recently demonstrated its role in another domain: decisions to follow and support a particular leader. Specifically, a number of studies utilizing experimental as well as real-world electoral data find that candidates with lower pitched voices win more votes (Anderson & Klofstad, 2012; Klofstad, 2013; Klofstad, Anderson, & Peters, 2012; Tigue, Borak, O’Connor, Schandl, & Feinberg, 2012). Given that deeper voices are associated with strength, dominant behavior, muscularity, and masculinity (Evans, Neave, Wakelin, & Hamilton, 2008; Feinberg et al., 2005; Puts, Gaulin, & Verdolini, 2006; Sell et al., 2010), researchers have argued that this preference for low-pitched voices reflects a preference for dispositional abilities in leaders to protect and prevail in conflict (Tigue et al., 2012).
However, we still have limited knowledge about whether these average effects reflect a general preference for leaders with low-pitched voices or whether followers differ in their preferences for the dispositional cues available in a would-be leader’s voice. In this article, we integrate research on followership psychology into the study of voice effects (Laustsen & Petersen, 2015) and argue that followers strategically use voice pitch cues in order to align themselves with the leaders who appear most competent, given the followers’ perceptions of the social world and the corresponding problems confronting their group (Duckitt & Sibley, 2010; Hibbing, Smith, & Alford, 2013; Jost, Federico, & Napier, 2009). We hypothesize that those who perceive the world as a competitive and dangerous place should have stronger preferences for dominant leaders who are perceived as capable of navigating conflicts (see Laustsen & Petersen, 2015). Others will often be better off with a less dominant individual as leader.
We test these arguments across three studies of preferences for lower pitched voices in political candidates in the United States. In the realm of politics, reliable summary markers for individual differences in perceptions of the social world are party affiliations and political ideological predispositions. Republicans and conservatives are much more likely than Democrats and liberals to view the world as a competitive and dangerous place (Duckitt & Sibley, 2010; Hibbing et al., 2013). In Studies 1 and 2, we therefore utilize existing data sources (Anderson & Klofstad, 2012; Klofstad et al., 2012) to investigate whether party affiliations and ideological leanings moderate preferences for candidates’ voices. We find that Republicans and conservatives display a stronger preference for male political candidates with lower pitched voices than do Democrats and liberals. In Study 3, we provide more in-depth evidence for the psychological basis for these effects. We find that perceiving society as a competitive jungle and being attuned to group-based conflict (as measured by Social Dominance Orientation [SDO], cf. Duckitt & Sibley, 2010; Pratto, Sidanius, Stallworth, & Malle, 1994) helps explain the results from Studies 1 and 2. The implications of these findings, as well as differences with respect to preferences for male and female candidate voices, are discussed in the final section.
Followership Decisions: The Role of Context and Perceptions
Humans are equipped with a compilation of psychological mechanisms that evolved to regulate choices of leaders (Laustsen & Petersen, 2015; Spisak, Dekker, Krüger, & van Vugt, 2012a; Spisak, Homan, Grabo, & van Vugt, 2012b; van Vugt, 2006; van Vugt & Ahuja, 2010). Aligning oneself with the most competent leader has most likely conferred significant and positive fitness benefits to individual followers. For a substantial part of human evolution, leaders have served as focal points within groups, coordinating individual behavior to solve collective problems. More competent leaders would ceteris paribus have lead to better collective solutions and, as a consequence, gains in individual fitness.
In order to arrive at adaptive followership decisions, the psychological system for followership should be designed to take in all relevant cues of leadership competence and do so with a flexible sensitivity to the particular circumstances of the group. In this regard, anthropological research suggests that decision-making authority is typically granted to different individuals depending on the type of problem facing one’s group at a given time (Boehm, 2000; van Vugt, 2006; van Vugt & Ahuja, 2010). Perhaps the most direct illustration was the Native American tradition for appointing two chiefs, one for situations of war and one for situations of peace, each with a different skill set (Hoebel, 1954).
Psychological research has recently demonstrated that this reflects a general pattern: individuals prefer different leaders under war and peace, respectively. The focus of most of this research has been facial masculinity as a cue of leader competence. A masculine face is reliably associated with perceptions of being dominant and with actual aggressive and dominant behavior (Carré, McCormick, & Mondloch, 2009; Geniole, Keyes, Mondloch, Carré, & McCormick, 2012; Loehr & O’Hara, 2013; Stirrat & Perrett, 2010; Trebický, Havlícek, Roberts, Little, & Kleisner, 2013). Correspondingly, a series of studies have found that leaders with more masculine faces are preferred among subjects who are primed with war or between-group conflict scenarios, while subjects who are primed with peace or cooperation scenarios tend to prefer leaders with more feminine faces (Spisak, Dekker, et al., 2012a; Spisak, Homan, et al., 2012b; Laustsen & Petersen, 2015; Little, Burriss, Jones, & Roberts, 2007; Little & Roberts, 2012; Little, Roberts, Jones, & DeBruine, 2012; Re, DeBruine, Jones, & Perrett, 2013). Under conflict, individuals prefer a leader who can enforce collective action against the enemy. Under peace, in contrast, individuals feel no need to subject themselves to a dominant, aggressive, and potentially, exploitive leader (for a discussion, see Laustsen & Petersen, 2015). Recently, these findings have been extended to also account for how individual differences among followers shape preferences for masculine-looking leaders. Paralleling the findings on the contextual moderators of these preferences, individuals who tend to see the social world as a dangerous and conflict-ridden place in general show greater preferences for leaders with dominant faces (Laustsen & Petersen, 2015).
Because human psychology is designed to draw inferences about dominance and other dispositions not only from facial cues but also from vocal cues (cf. Feinberg, 2008), we should expect to see similar patterns in preferences for leaders with low-pitched voices, a reliable marker of dominance (Dabbs & Mallinger, 1999; Feinberg et al., 2005; see also Tigue et al., 2012). Consistent with this, one study has shown that sensitivity to physical prowess cues in voices is heightened during wartime (Tigue et al., 2012). In the present article, we extend this finding and investigate how individual differences related to perceptions of conflict influence preferences for lower pitched voices in the context of a key modern followership decision, voting in elections.
Predictions: Individual Differences and Preferences for Leaders With Low-Pitched Voices
In the domain of politics, research increasingly links differences in political ideology and party preferences to deep-seated personality differences and to differences in fundamental perceptions of the social world (Alford, Funk, & Hibbing, 2005; Caprara & Zimbardo, 2004; Carney, Jost, Gosling, & Potter, 2008; Duckitt & Sibley, 2010; Hibbing et al., 2013; Jost et al., 2009; Oxley et al., 2008). According to Hibbing, Smith, and Alford (2013, p. 114) conservatives and liberals basically “experience and process different worlds” (Hibbing et al., 2013, p. 114). Compared to liberals and Democrats, conservatives and Republicans are much more likely to see the world as a competitive and dangerous place (Duckitt & Sibley, 2010; Hibbing et al., 2013). This suggests that Republicans and conservatives will exhibit a larger preference for lower pitched candidate voices than will Democrats and liberals (the conservative Republican prediction). Republicans’ and conservatives’ perception of the world as a hostile place should lead them to put a premium on dominance in leaders. In the context of facial cues to dominance, this prediction has already received support: individuals who vote for a right-wing party tend to prefer more masculine leaders (Laustsen & Petersen, 2015). Here, we test whether this also applies to vocal cues to dominance in the form of voice pitch.
Psychological models of political ideology show that there are two fundamentally different types of perceptions of the social world that lead to conservative attitudes and vote choices. While an orientation toward social threats is at the center of both types of perceptions, the nature of these threats is different. Here, we extend previous research by investigating which of the perception types (if any) drive preferences for leaders with low-pitched voices. By providing an in-depth investigation of the precise psychological drivers of preference for lower pitched voices, we stand to gain important insights into how and when preferences for dominant leaders emerge more generally.
The first perception that underlies conservative psychological predispositions is the worldview that society is a “ruthlessly competitive jungle […] as opposed to a place of cooperative harmony” (Duckitt & Sibley, 2010, p. 1869). This perception influences individuals to subscribe to “values or motivational goals of power, dominance and superiority over others” (Duckitt & Sibley, 2010, p. 1869), which in turn are expressed through preferences for group-based dominance as indicated by political attitudes characterized by high social dominance orientation or “SDO” (a general attitudinal orientation toward intergroup relations reflecting preferences for equality or hierarchy between groups). Finally, individuals high in SDO will subscribe to conservative political positions and tend to vote for conservative parties like the Republicans (Duckitt & Sibley, 2010, pp. 1867–1868).
The second type of perception that underlies conservative psychological predispositions is the worldview belief that society “is an inherently dangerous, unpredictable, and threatening place as opposed to being safe, stable and secure” (Duckitt & Sibley, 2010, p. 1867). This social worldview makes individuals hold values or motivational goals such as “establishing and maintaining collective or social security, order, cohesion, and stability” (Duckitt & Sibley, 2010, p. 1867), which in turn create general preferences for obedience and respect toward authorities expressed through authoritarian political attitudes characterized by high right-wing authoritarianism or “RWA” (a general attitudinal orientation toward intragroup phenomena reflecting preferences for coercive social control, conforming to traditional moral norms, and the like.). Finally, individuals high in RWA, just as those high in SDO, subscribe to conservative political positions and tend to vote for conservative parties like the Republicans. Figure 1 illustrates this “dual-process motivational model” of ideology and political preferences (Figure 1 builds on the work by Duckitt and Sibley, 2010, where the two paths to conservatism are linked back to dispositions to view the social world in particular ways, see Duckitt & Sibley, 2010, p. 1868):
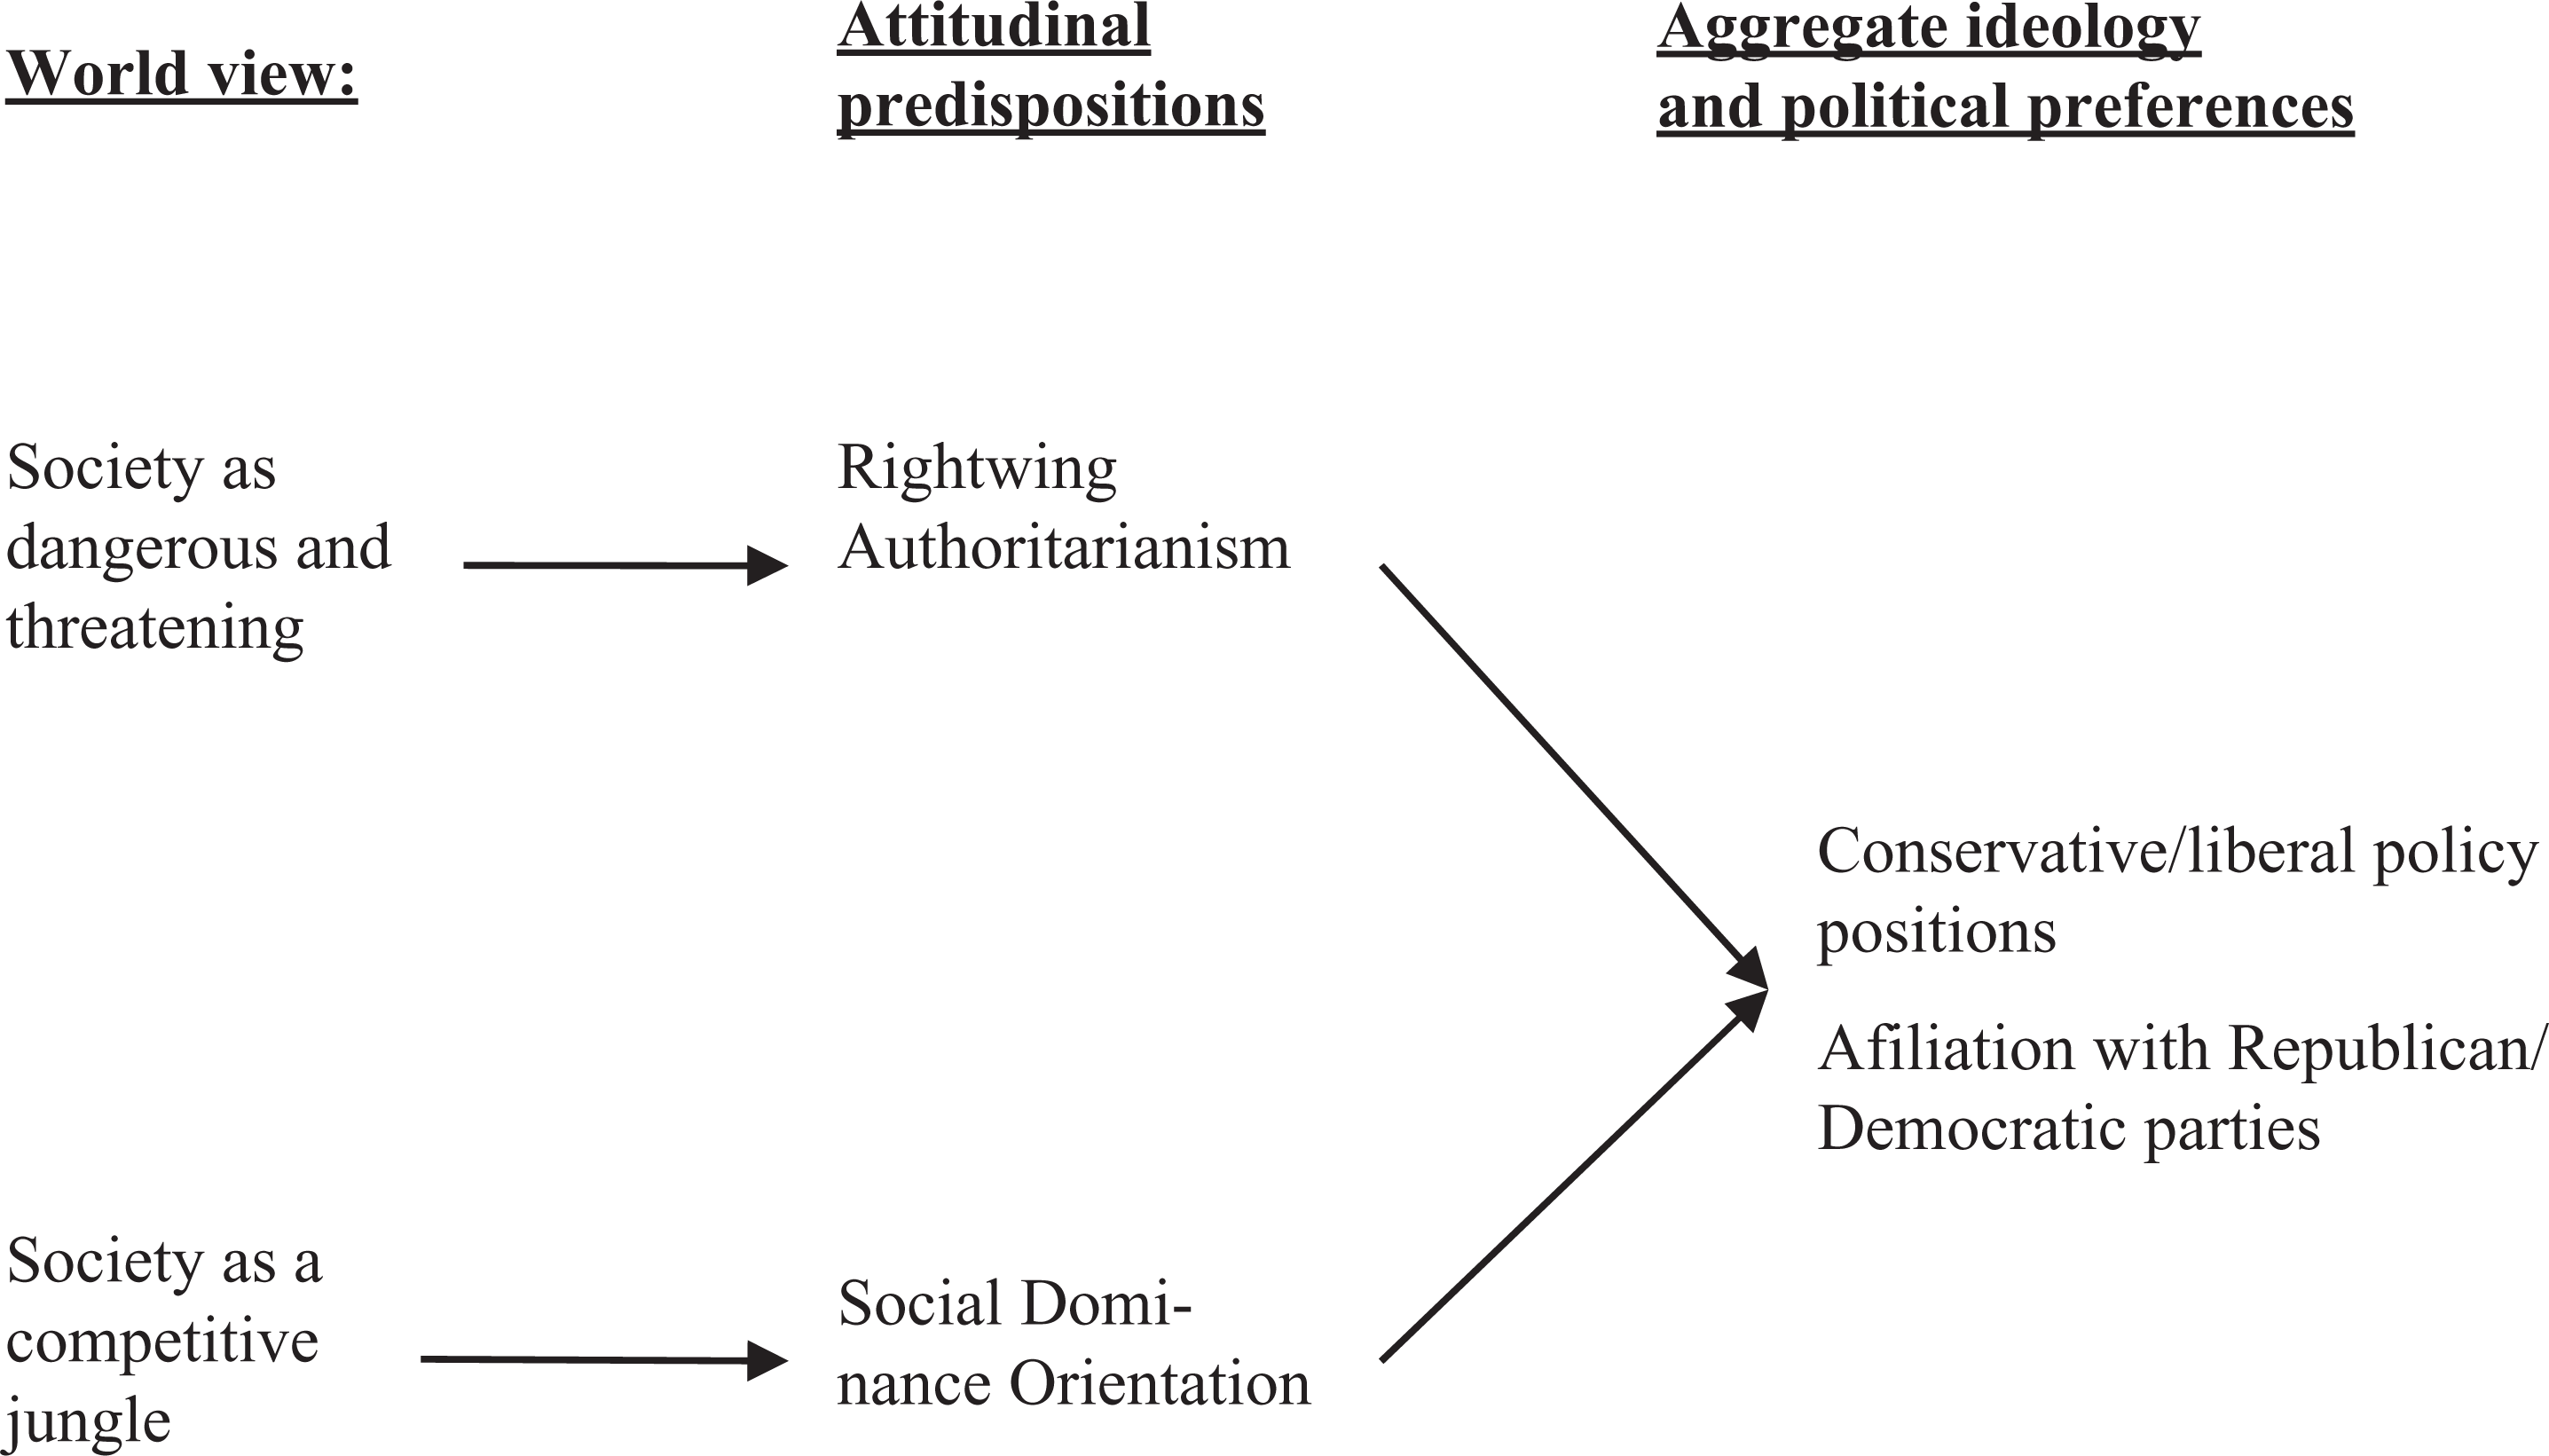
Dual process motivational model of the relationship between individuals’ worldviews, attitudinal predispositions and aggregate ideology, and political preferences. The model builds on Figure 1 in Duckitt and Sibley (2010, p. 1868).
If a preference for leaders with lower pitched voices is more widespread among individuals high in competitive jungle worldview and SDO, it will be an indication that lower pitched candidate voices are preferred in order to facilitate intergroup dominance and maintain superiority over other groups. We will refer to this as the intergroup dominance prediction. If instead preferences for lower pitched candidate voices are more pronounced among individuals who perceive society as dangerous and threatening—scoring high in RWA—then it will be an indication that lower pitched candidate voices are preferred for defensive reasons of protection against threats to intragroup cohesion such as for instance nonsubmission and violations against norms and moral codes. We will refer to this as the intragroup protection prediction.
Overview of Studies
We test these three predictions in three experimental studies where subjects choose between lower and higher pitched versions of the same voices. In Studies 1 and 2, we exploit existing data sources that have been used to establish the preference for lower pitched voices in the aggregate (Klofstad, 2013; Klofstad, Anderson, & Nowicki, n.d.). To test the conservative Republican prediction, we reanalyzed these data sources to assess whether there is variation in this preference across subjects’ party affiliation (Studies 1 and 2) and political ideology (only Study 2). Study 3 was designed to test the intergroup dominance prediction and the intragroup protection prediction, and in doing so explore which more distinct psychological construct drives the preferences for leaders with lower pitched voices. More specifically, Study 3 measured subjects’ SDO, RWA, and worldview beliefs of society as competitive jungle and dangerous. In Studies 1 and 2, party affiliation and ideological predispositions serve as proxies of these more specific psychological differences. Thus, we can expect the results in Studies 1 and 2 to be less clear than the results in Study 3 simply because they constitute more noisy measures of the relevant psychological construct of interest.
Study 1: 2012 Qualtrics Experiment
Material and Method
Five men and five women were recorded speaking the sentence, “I urge you to vote for me this November,” a politically relevant, partisan-neutral statement. The women ranged in age from 21 to 38 years (x̄ = 26 years) and the men from 20 to 41 years (x̄ = 28 years). Voices were recorded as .wav files.
The recordings were manipulated to yield a higher and lower pitched version of each. Following previous studies on voice pitch perception (Jones, Feinberg, DeBruine, Little, & Vukovic, 2008), each recording was altered ± .5 equivalent rectangular bandwidths (ERBs). The relationship between absolute and perceived pitch in humans is logarithmic (Stevens, 1998), and the manipulation by ERB accounts for this, as it produces a constant perceivable gap between the manipulated sound files regardless of the baseline pitch of the original recording (Stevens, 1998).
The pitch of the unaltered female and male voices ranges from 189 to 207 Hz (x̄ = 199 Hz) and 91 to 116 Hz (x̄ = 107 Hz), respectively. The pitch of the higher and lower pitched female sound files ranges from 214 to 233 Hz (x̄ = 224 Hz) and 170 to 190 Hz (x̄ = 181 Hz), respectively. The pitch of the higher and lower pitched male sound files ranges from 110 to 136 Hz (x̄ = 127 Hz) and 81 to 98 Hz (x̄ = 91 Hz), respectively. Previous studies verified that voters can perceive which voice of each pair used in this experiment is higher in pitch (Anderson & Klofstad, 2012; Klofstad et al., 2012). Here, due to space constraints on the study questionnaire, only a subset of the stimuli used by Klofstad, Anderson, and Peters (2012) and Anderson and Klofstad (2012) were used. An extended description of the voice pitch manipulation is available in Supplementary Material S1.
Participants and Procedures
Approval to conduct this study was granted by the Duke University (Durham, NC) institutional review board on October 7, 2013 (Protocol B0948). The study was administered online to 803 subjects (400 men and 403 women) by Qualtrics. For this study, Qualtrics partnered with Sample Strategies to recruit a general population sample of participants from across the United States. Participants ranged in age from 18 to 78 years (x̄ = 49 years, SD = 13.7 years), and received a cash incentive after participating (US$1.25). They were invited to participate in studies by e-mail and through messages on their Sample Strategies account home page.
Participants were randomly assigned to listen to either the pairs of male (n = 201 male and 202 female voters) or female (n = 199 male and 201 female voters) voices. Voters chose whether to use computer speakers (n = 676) or headphones (n = 127). Existing research shows that online voice pitch studies produce results that are comparable to laboratory studies (Jones et al., 2008; an extended description of the sample and procedures is available in Supplementary Material S1).
Method of Analysis
The participant is the unit of analysis. Each participant listened to five sets of male or female voices consisting of a lower pitched and a higher pitched version of the same voice. For each of these voice pairs participants chose their preferred voice. These vote choices were coded 1 if the participant selected the lower voice and 0 if the higher voice was selected. Based on the five choices we calculate an average score, which yields a summary preference ratio ranging from 0 to 1, reflecting minimal and maximum preference for lower pitched voices, respectively.
Study 1 also included measures of subjects’ feelings toward the Democratic and the Republican parties, respectively, on 0–100 feeling thermometers (where 0 and 100 indicate coldest and warmest feelings, respectively), and we use these measures to test the conservative Republican prediction. Based on these scales, we calculate subjects’ relative feelings toward the two parties—Relative Affiliation—as the feeling difference toward the Republican and Democratic parties, respectively. The Relative Affiliation score is recoded to a 0–1 scale with 0 and 1 representing relatively warmest feelings toward the Democrats and Republicans, respectively (x̄ = 0.455; SD = 0.292). Finally, existing research often compares groups of individuals who affiliate strongly with the ideological left/Democratic party or the ideological right/Republican party when investigating basic differences in preferences, behavior, and physiological reactions (Oxley et al., 2008). Following this approach, we also perform a quartile split of the Relative Affiliation score such that we can compare the quartile of subjects who hold the most positive feelings toward Republican and least positive feelings toward the Democrats to the quartile of subjects who hold the most positive toward the Democrats and the least positive feelings toward the Republicans. We refer to the former as Pure Republicans (n = 166) and the latter as Pure Democrats (n = 168). 1
We use linear regression to investigate the relationship between subjects’ preferences for lower pitched voices and their party affiliation and to account for the possibility that listening to the vocal stimuli through different devices could affect how it was perceived we control for type of playback device (i.e., computer speakers vs. headphones). We report results from these analyses using the Relative Affiliation score and the comparison between Pure Republicans and Pure Democrats, respectively. We also report results for preferences of male and female candidate voices separately.
Results
As shown in Klofstad, Anderson, and Nowicki (n.d.), a two-tailed one-sample t-test analysis of the proportion of votes cast for lower voices (comparison value = .50) shows that male and female subjects preferred to vote for male and female candidates with lower pitched voices (p < .001). Additionally, an analysis of variance (ANOVA) in the proportion of votes cast for the lower pitched voices with participant sex, speaker sex, and the interaction of the two as the factors, shows that this preference was significantly stronger when subjects judged female candidates (F 1,788 = 30.78, p < .001).
Using first the Relative Affiliation score, our conservative Republican prediction will be supported if there is a positive relationship between the Relative Affiliation score and the preference for lower pitched voices. The results show a positive trend between the Relative Affiliation score and preferences for lower pitched male candidate voices, such that the warmer the feelings toward the Republican party relative to the feelings toward the Democratic party the stronger the preference for lower pitched male voices (b = 0.065, p = .200). For female candidate voices, no such trend was revealed (b = −0.014, p = .781).
Next, we turn to the comparison between Pure Republicans and Pure Democrats. The key test of our conservative Republican prediction is whether Pure Republicans exhibit a stronger preference for lower pitched voices than Pure Democrats. For male candidate voices, a significant difference between Pure Republicans and Pure Democrats is revealed, such that the former exhibits a stronger preference for lower pitched male voices (b = 0.093, p = .028). In comparison, no such difference between Pure Democrats and Pure Republicans is found for female candidate voices (b = −0.018, p = .672). 2 Figure 2 illustrates this pattern and shows the separate preference scores for lower pitched male and female voices for Pure Democrats and Pure Republicans, separately.

Study 1 Qualtrics election experiment results by subjects’ party affiliation categories and sex of candidate voice. Bars represent proportion of votes cast for the lower pitched version of male and female candidate voices and dashed lines are 95% confidence intervals. A value of .50 indicates no discernible preference for either higher or lower pitched voices. P-values are from t-tests (two-sided) between Pure Democrats’ and Pure Republicans’ preference ratios.
Figure 2 shows that Pure Republicans in Study 1 had a stronger preference for male candidates with lower pitched voices than did the Pure Democrats. A similar difference is not, however, found with respect to preferences for female candidate voices (full models for all analyses are provided in Supplementary Material S2). Altogether, Study 1 provides initial support for our prediction with respect to male candidate voices. In Study 2 below, we explore whether this result replicates among subjects who registered as Democrats or Republicans for the 2012 U.S. national elections.
Study 2: 2012 Cooperative Congressional Election Study (CCES) Experiment
Material and Method
The same treatments from Study 1 were used in this study.
Participants and Procedures
The study included a total of 804 participants (393 men and 411 women) in the 2012 CCES preelection survey (Ansolabehere, 2012; Mann, 2012) conducted online by YouGov between October 1 and November 5, 2012. Participants ranged in age from 18 to 90 years (x̄ = 49 years, SD = 16.4 years). The sample was matched by YouGov to a representative target sampling frame of U.S. citizens based on the following variables: sex, age, race, years of education, interest in politics, employment status, Evangelical/born-again Christian status, marital status, partisanship, and ideology (more details on the matched sampling process for Study 2 [the 2012 CCES] is available in Supplementary Material S1.A).
Due to limited space on the questionnaire, study participants were randomly assigned to listen to either the five pairs of male voices (n = 198 male and 224 female subjects) or the five pairs of female voices (n = 195 male and 187 female subjects). Voters chose whether to use computer speakers (n = 717) or headphones (n = 87). After listening to each pair of voices, voters were asked which candidate they would vote for. The order of the pairs of voices, and whether the higher or lower pitched version of each voice was presented first, was randomized.
Method of Analysis
The individual subject is the unit of analysis. Vote choices were coded 1 if the voter selected the lower voice and 0 if the higher voice was selected. Following the procedure described in Study 1, we calculated the average for these choices, which yields a summary preference ratio ranging from 0 to 1, reflecting minimal and maximal preference for lower pitched voices, respectively. Study 2 includes several measures of relevance for testing the conservative Republican prediction. First, subjects’ voter registration as Democrats (289) or Republicans (242) was collected. 3 Second, subjects reported their party affiliation on a 7-point scale ranging from 0 strong Democrat to 1 strong Republican (x̄ = 0.449; SD = 0.376). Finally, Study 2 also includes subjects’ ideological self-placement on a 7-point scale ranging from 0 very liberal to 1 very conservative (x̄ = 0.534; SD = 0.311). Analyses apply linear regression and control for the type of playback device, and we report results for preferences of male and female candidate voices separately.
Results
As shown in Klofstad (2013), two-tailed one-sample t-test analysis of the proportion of votes cast for lower voices (comparison value = .50) shows that male and female subjects preferred to vote for male and female candidates with lower pitched voices (p < .01). Additionally, an ANOVA of the proportion of votes cast for the lower pitched voice with participant sex, speaker sex, and the interaction of the two as the factors, shows that this preference was significantly stronger when subjects judged female candidates (F 1,799 = 51.20, p < .001).
To test the conservative Republican prediction we use party registration, party affiliation score, and self-placed ideology as predictor variables of subjects’ preferences for lower pitched candidate voices. In parallel to the findings in Study 1, we find that registered Republicans have a significantly stronger preference for lower pitched male voices than do registered Democrats (b = 0.093, p = .004). No such difference is found between registered Republicans and Democrats with respect to preferences for female voices (b = 0.020, p = .519). 4 Figure 3 illustrates subjects’ preferences for candidate voices depending on subject party registration and candidate voice sex.

Study 2 Cooperative Congressional Election Study (CCES) election experiment results by party registration of voter and sex of candidate. Bars represent proportion of votes cast for the lower pitched version of male and female candidate voices and dashed lines are 95% confidence intervals. A value of .50 indicates no discernible preference for either higher or lower pitched voices. P-values are from t-tests (two-sided) between registered Democrats’ and registered Republicans’ preference ratios.
This result replicates using the 7-point scale for subjects’ party affiliation; the more subjects affiliate with the Republican Party, the stronger are their preferences for lower pitched male candidate voices (b = 0.088, p = .013), whereas no such relationship exists between party affiliation and preferences for lower pitched female candidate voices (b = 0. 023, p = .518).
Finally, we use subjects’ self-reported political ideology to predict preferences for lower pitched candidate voices. If our prediction is supported, we should see that preferences for lower pitched candidate voices increase with conservatism. With respect to male voices a positive relationship approaching statistical significance is found (b = 0.061, p = .166). Yet, ideology does not relate to preferences female candidate voices in any systematic way (b = 0.017, p = .695; full models for all analyses from Study 2 are provided in Supplementary Material S3).
In sum, Studies 1 and 2 provide tentative initial evidence for our prediction on the basis of existing data sources: affiliation with the Republican party and conservative political predispositions positively predict preferences for lower pitched male but not female candidate voices. Yet, these results do not speak to the more specific psychological predisposition driving this preferential difference between liberal Democrats and conservative Republicans. In Study 3, we explore this by testing the intergroup dominance prediction and the intragroup protection prediction on original data.
Study 3: MTurk Experiment
Material and Method
For sake of comparability, the same vocal stimuli from Studies 1 and 2 were used in this study.
Participants and Procedures
The study was administered online via Amazon’s MTurk platform and included a total of 754 American subjects (372 men and 382 women) who participated in an online survey conducted early January 2015. 5 Participants ranged in age from 18 to 79 years (x̄ = 38 years, SD = 13.2 years) and received a cash incentive after participating (US$0.60).
Study participants were randomly assigned to listen to either the five pairs of male voices (n = 196 male and 185 female subjects) or the five pairs of female voices (n = 176 male and 197 female subjects). Voters chose whether to use computer speakers (n = 459) or headphones (n = 295). After listening to each pair of voices, voters were asked which candidate they would vote for. The order of the pairs of voices, and whether the higher or lower pitched version of each voice was presented first, was randomized.
Method of Analysis
The subject is the unit of analysis. Vote choices were coded 1 if the voter selected the lower voice and 0 if the higher voice was selected. Following the procedure described for Study 1, we calculate the average for these choices, which yields a summary preference ratio ranging from 0 to 1, reflecting minimal and maximum preference for lower pitched voices, respectively.
Study 3 included a range of party affiliation variables and measures of ideological differences to track what drives the preference for lower pitched candidate voices more specifically. In the following, all of these measures are recoded to 0–1 scales on which the end point 0 reflects the most left-leaning/liberal positions, whereas the end point 1 represents the most right-leaning/conservative positions. First, we asked subjects if they “identify more with the Democratic party or the Republican party.” Democratic identifiers were coded 0 and Republican identifiers were coded 1 (don’t’ know answers are not included in the analyses). Next, feeling thermometer ratings of the Democratic and the Republican parties were obtained following the procedure described in Study 1 (x̄ = 0.405; SD = 0.237). Second, subjects’ ideology was measured using a 11-point self-placement scale from left (0) to right (1) (x̄ = 0.414, SD = 0.272), and following the measure used in Study 2 we also asked subjects to indicate their ideology on a 7-point scale from extremely liberal (0) to extremely conservative (1) (x̄ = 0.406, SD = 0.279). Third, we measured subjects’ preferences for group-based dominance captured by SDO (α = 0.901, x̄ = 0.275, SD = 0.215; based on Ho et al., 2012). Fourth, subjects’ authoritarian values were measured using 8 items capturing RWA (α = 0.890, x̄ = 0.365, SD = 0.226; based on Zakrisson, 2005). Finally, we measured subjects’ tendencies to perceive the social world as a competitive jungle (α = 0.855; x̄ = 0.280, SD = 0.167) and as a dangerous and threatening place (α = 0.871; x̄ = 0.483, SD = 0.203), respectively, based on scales from Duckitt, Wagner, du Plessis, and Birum (2002; see also Duckitt & Sibley, 2010). All four scales (SDO, RWA, and the two worldview measures) consist of a set of 8 balanced items (4 items reversed coded). See Supplementary Material S4 for the exact wordings of the used items.
Analyses apply linear regression and control for type of playback device. 6 We report separate results for preferences of male and female candidate voices.
Results
Replicating the central finding from previous studies (see Klofstad et al., n.d.; Klofstad et al., 2012), subjects preferred both lower pitched male (t = 2.960, p = .003) and female voices (t = 9.114, p < .001), and this preference was stronger when judging female candidates (t = 4.045, p < .001).
The results of Study 3 also yield further support for the conservative Republican prediction. First, a trend suggest that subjects who identify as Republicans exhibit a stronger preference for lower pitched male candidate voices than subjects identifying as Democrats (b = 0.038, p = .153). No such trend of party identification relating to preferences for lower pitched female voices is found (b = 0.010, p = .681). 7 Using subjects’ self-placed ideology on the 11-point scale from left (0) to right (1) as predictor of their voice pitch preferences, we find a marginally significant effect for choices of male candidate voices, such that lower pitched voices are increasingly preferred the more rightwing the subject (b = 0.076, p = .071). Yet, subjects’ ideology does not relate to preferences for lower pitched female voices (b = −0.026, p = .515). 8
We conducted two sets of analyses to test whether the results described above, and in Studies 1 and 2, are caused by preferences for group dominance (as suggested by the intergroup dominance prediction) or by preferences for group protection (as suggested by the intragroup protection prediction). First, we predict subjects’ preferences for lower pitched candidate voices from general attitudinal predispositions related to authoritarianism and group-based dominance as measured by SDO and RWA. This reveals a positive marginally significant effect of SDO (b = 0.104, p = .087) but no effect of RWA (b = 0.034, p = .544) on preferences for lower pitched male candidate voices. Because RWA and SDO are highly correlated (r = .436, p < .001), any model that includes both predictors likely suffers from some degree of multicollinearity. Therefore, we also estimate models with just one of the measures. These models reveal a clearly significant effect of SDO (b = 0.120, p = .025) but not of RWA (b = 0.081, p = .103), reinforcing the support for the effect of SDO on preferences for lower pitched voices in political candidates. When predicting preferences for lower pitched female candidate voices neither SDO (b = 0.011, p = .834) nor RWA (b = −0.062, p = .242) turns out to be significantly related to the subjects’ voice pitch preferences. This does not change when including the measures separately (SDO: b = −0.014, p = .784; RWA: b = −0.057, p = .236). Panel A in Figure 4 illustrates the predictive power of SDO and RWA on preferences for male and female, respectively.
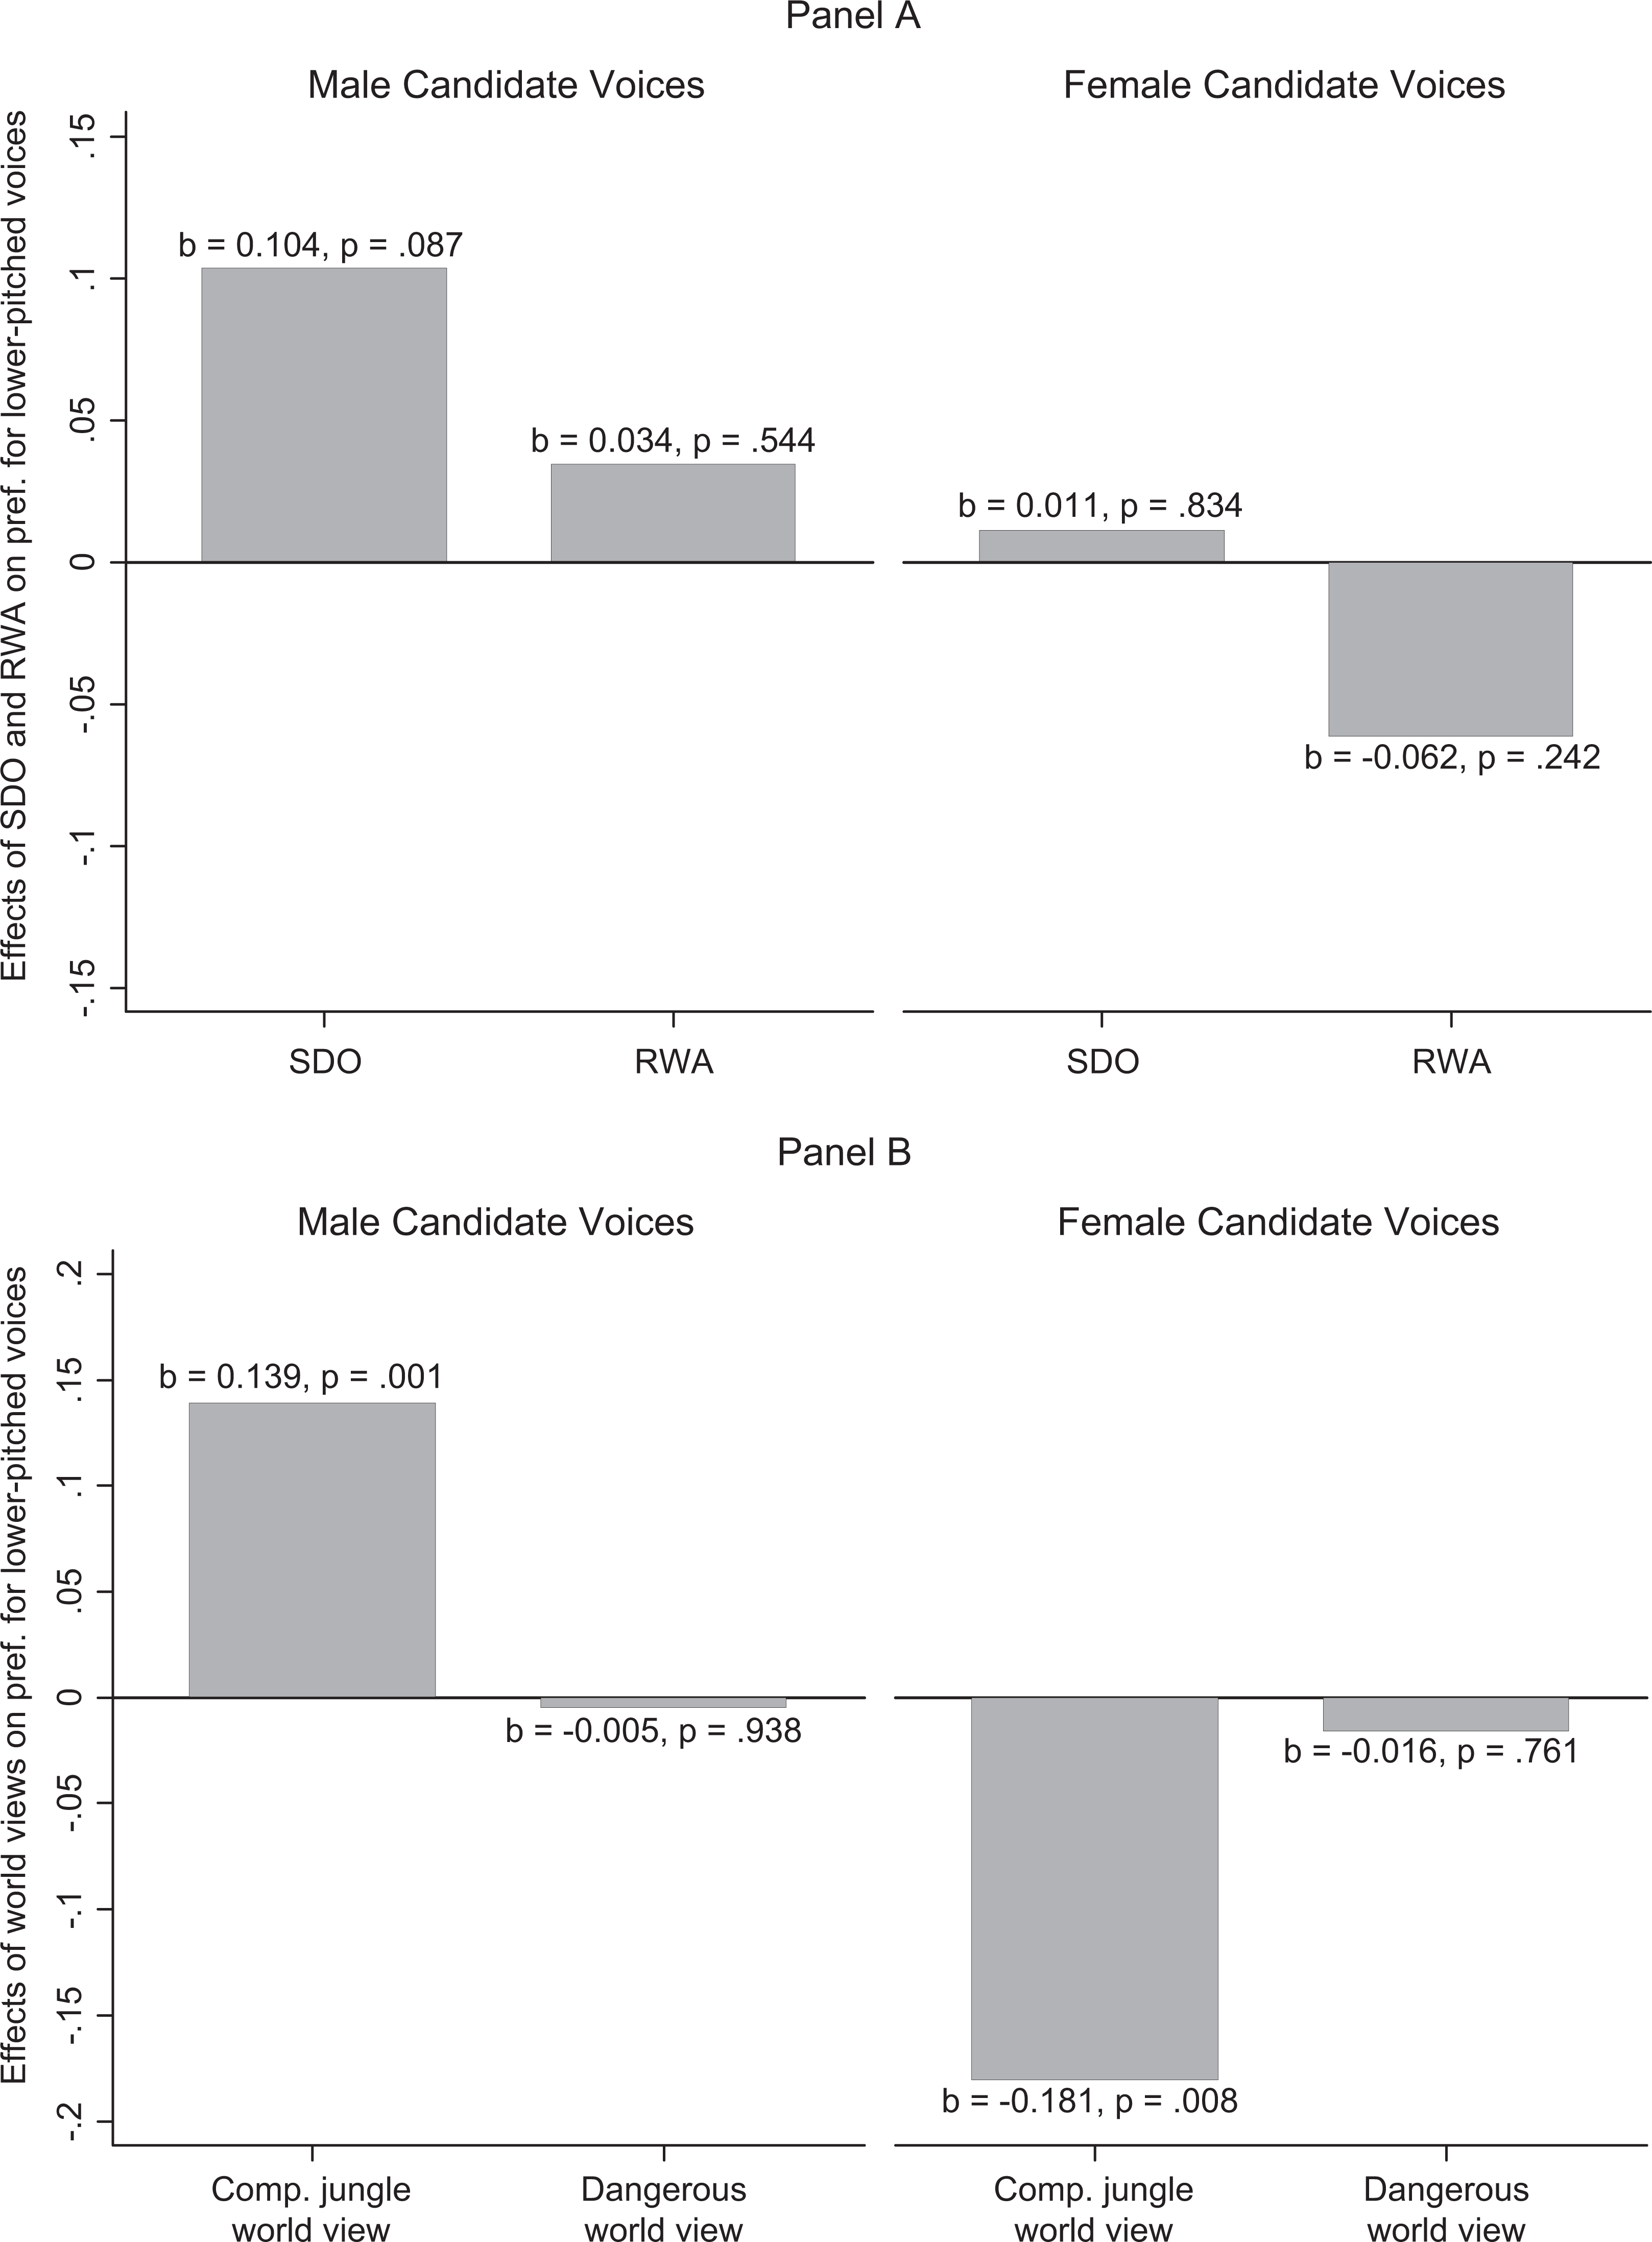
Study 3 MTurk Experiment results by explanatory variable and sex of candidate voice. Bars are regression coefficients of predictions of subjects’ preference ratio score for lower pitched male and female voices, respectively. Panel A shows regression coefficients for social dominance orientation (SDO) and right-wing authoritarianism (RWA), and Panel B shows regression coefficients for competitive jungle worldview and dangerous worldview. All models control for type of playback device (headphones vs. computer speakers). P-values are from two-tailed tests of significance.
Next, we use subjects’ views of society as a competitive jungle and a dangerous place as predictors of voice pitch preferences. For preferences of lower pitched male candidate voices perceptions of society as a competitive jungle is a positive and significant predictor (b = 0.139, p = .001). This is not the case for perceptions of society as dangerous and threatening (b = −0.005, p = .938). Including the two different worldviews as individual predictors leads to the same conclusion (competitive jungle worldview: b = 0.138, p = .035; dangerous worldview: b = 0.022, p = .697). For preferences for female candidate voices, a view of society as a competitive jungle negatively and significantly predicts preferences for lower pitched female voices (b = −0.181, p = .008), whereas perceptions of society as a dangerous and threatening place is unrelated to this outcome measure (b = −0.016, p = .761). Again, the same conclusions are reached including the two worldviews in separate models (competitive jungle worldview: b = −0.185, p = .006; dangerous worldview: b = −0.046, p = .381). Panel B in Figure 4 illustrates the effects of beliefs about society as a competitive jungle and as a dangerous place, respectively, on preferences for male and female candidate voices (full models for all analyses presented from Study 3 are provided in Supplementary Material S5).
In sum, Figure 4 provides support for the intergroup dominance prediction and not the intragroup protection prediction. From Panel A, it is clear that subjects’ preferences for lower pitched male candidate voices are driven by SDO and beliefs about the social world as a competitive jungle rather than by RWA and perceptions of the social world as dangerous and threatening. This finding gives us a greater understanding of the finding across Studies 1, 2, and 3 that Republicans/conservatives more than Democrats/liberals prefer lower pitched male candidate voices. When it comes to female candidate voices, Panel B shows that only perceptions of society as a competitive jungle is a significant but negative predictor of preferences for lower pitched female voices. This runs counter to the general pattern of no differences between liberals and conservatives and Democrats and Republicans on preferences for female candidate voices across Studies 1, 2, and 3. 9
Discussion
Past research suggests that people have a general preference for leaders with low-pitched (i.e. dominant) voices (Anderson & Klofstad, 2012; Gregory & Gallagher, 2002; Klofstad, 2013; Klofstad et al., 2012; Tigue et al., 2012). Other research on alternative physical cues of dominance in would-be leaders (in particular facial masculinity), however, has demonstrated that preferences for dominance vary across contexts and individuals. In particular, preferences for masculine and dominant-looking leader candidates have been found to be higher among individuals’ with a conservative worldview (Laustsen & Petersen, 2015).
In this article, we have integrated these findings in variation in preferences for dominant leaders into the literatures on voice pitch and voting behavior. Adaptationist accounts predict that different cues to the same behavior within a certain domain would trigger the corresponding psychological system in similar ways (Feinberg, 2008). Just as facial cues related to dominance in would-be leaders have been demonstrated to be conditionally preferred in order to promote the most competent leader relative to the problems confronting the group (Laustsen & Petersen, 2015; Little et al., 2007; Spisak, Homan, et al., 2012b), we predicted that vocal cues related to dominance are conditionally preferred in a similar way. Rather than a general preference for deep, dominant voices, we argued that this preference should be strongest among Republican and conservative individuals who, more than Democratic and liberal individuals, view the social world as more competitive and dangerous. Moreover, we investigated if the preference for lower pitched voices is more closely connected to perceptions of society as competitive or dangerous, as these fundamental worldviews are linked to conservatism and right-wing ideologies through distinct and separate causal paths (Duckitt & Sibley, 2010; Duckitt, Wagner, du Plessis, & Birum, 2002).
Consistent with the overall prediction—that lower pitched candidate voices would be preferred more among right-wing than among left-wing individuals—the results across Studies 1, 2, and 3 show that individuals affiliated with the Republican party tend to prefer lower pitched male candidate voices more than individuals affiliated with the Democratic party. This preference for lower pitched male candidate voices was also found to increase with ideological conservatism. Finally, Study 3 show that preferences for deep male candidate voices are driven by differences in preferences for group-based dominance as measured by SDO and perceptions of the social world as a competitive jungle rather than by subscription to authoritarian values and worldview beliefs of society as dangerous and threatening. Importantly, these findings only relate to preferences for male and not to preferences for female candidate voices. Below, we speculate about the potential reasons for this sex difference.
These results add significantly to prior studies of preferences for lower pitched candidate voices. Prior research has established preferences for lower pitched voices in the aggregate. However, it has remained unclear what specifically is causing preferences for candidate voices. In this article, we provide some initial answers to this question in two ways. First, we build on the growing line of research, suggesting that humans possess a psychological system of followership—a compilation of mechanisms regulating choices of leaders in correspondence to perceptions of problems facing one’s group—and argue that this followership psychology should take in vocal cues to problem-specific leadership competences just as it is shown to take in and respond to visual cues of leadership competence (Laustsen & Petersen 2015; Spisak, Dekker, et al., 2012a; Spisak, Homan, et al., 2012b; van Vugt, 2006; van Vugt & Ahuja, 2010). That is, in parallel to the finding that conservative individuals prefer leaders and candidates who look masculine and dominant (Laustsen & Petersen, 2015), we should expect that conservative individuals will also prefer candidates that sound masculine and dominant. Across the three studies this is exactly what we find.
Second, Study 3 expands existing knowledge about the causes of the preference for lower pitched candidate voices. Based on the “Dual-Process Motivational Model” for political ideology (see Duckitt & Sibley, 2010), we find that Republicans’ and conservatives’ preferences for lower pitched male voices are driven by deep-seated psychological differences in preferences for group-based dominance as captured by SDO and perceptions of the social world as a competitive jungle. This suggests that preferences for lower pitched candidate voices reflect preferences for a leader capable of ensuring that the group increases its position in the hierarchy vis-à-vis other groups rather than a leader capable of ensuring the stability of the hierarchy within the group. Based on this, preferences for lower pitched candidate voices could be at least partially taken to reflect that voters are voting for aggressive and conflict-oriented leadership when they are attracted to and select deeper male voices.
As noted throughout the result section party affiliation, ideology, SDO, and competitive jungle worldview only consistently predict preferences for male and not female candidate voices. Given that prior research has established that lower pitched voices are preferred in the aggregate for both male and female candidates, this difference related to candidate sex is puzzling. We suspect that one reason individual differences in the preference for leaders with lower voices are only related to the perception of male voices is that lower pitched voices in general are associated with a range of different attributes. Therefore, it is possible that lower pitched male and female candidate voices are preferred for different reasons and are perceived as signals of qualitatively different leadership traits for males and females. Previously lower pitched voices have been linked to traits such as dominance, attractiveness, and ability to provide leadership but also to trustworthiness, honesty, and intelligence (Tigue et al., 2012). Furthermore, strong evidence exists for a relationship between testosterone and deeper voices and dominant behavior for males in particular (Archer, 1991; Bruckert, Liénard, Lacroix, Kreutzer, & Leboucher, 2006; Dabbs & Mallinger, 1999; Evans et al., 2008; Feinberg et al., 2005; Mazur & Booth, 1998; Puts, Apicella, & Cárdenas, 2012). This suggests that lower pitched voices are utilized as a cue for dominant, aggressive behavior, and leadership in males more than in females. Accordingly, future research should look into the particular trait inferences that drive preferences for low-pitched voices in female leaders.
We conclude by noting how these results also speak to more general debates on the rationality of the public in times of elections. Research shows how factors such as polling location, the success of local sports teams, and national disasters like hurricanes and shark attacks can significantly affect the public mood and voting behavior (Achen & Bartels, 2004; Healy, Malhotra, & Mo, 2010; Rutchick, 2010), thereby painting a picture of an irrational public. From a standard social science perspective, it is easy to interpret the effects of political candidates’ physiological features (such as faces and voice pitches) in a similar way. Yet, according to the present research, such inferences might be ill founded. Voters are seemingly not motivated by ignorance and irrationality when they let the voice pitch of candidates guide their vote choices. Rather, voters use voice pitch cues to match their candidate preferences and their perceptions of the social world in adaptive ways. Essentially, the use of voice pitch cues reflects a motivation to align oneself with the better leader.
Footnotes
Declaration of Conflicting Interests
The author(s) declared no potential conflicts of interest with respect to the research, authorship, and/or publication of this article.
Funding
The author(s) received no financial support for the research, authorship, and/or publication of this article.