
Abstract
Although the art historical canon has been the subject of fierce debate, it remains an essential construct, shaping textbooks and survey courses. Visual representations of the canon often illustrate these narratives. Students encounter diagrams in their studies and it is important to make them aware of the illusion of scientific objectivity. This paper proposes the use of the computer ontology, as a modeling tool with which students can make translations of existing diagrams. This forces them to reconsider the modeling decisions underlying traditional representations. The article takes as its case study the translation of Alfred Barr’s diagram of Modern Art, using the free tool Protégé. An analysis of this process allows us to consider the ambiguous meanings of nodes, relationships and dimensions of the model. Asking students to actively recreate this network of information is shown to be a valuable addition to traditional survey courses on Modern Art.
Introduction
The art historical canon has, in recent decades, been the subject of fierce debate. Implicit biases and the historically uneven distribution of power have resulted in overrepresentation of certain groups of artists and works and underrepresentation or even complete silencing of others. Since the 1980s, scholars from fields such as Feminist Studies, Postcolonial Studies and Gender Studies have considered this problem and have tried to remedy it. In doing so, the focus has been mainly on the content of the various canons, as they are found in textbooks, survey courses and exhibition collections (Brzyski, 2007: 2). In this article, I will focus on a different perspective: the way we model and visualize this information in the schematic representations that accompany the books, courses and exhibitions that students encounter in their studies.
There is a long tradition of visually representing art historical canons, mostly in hand-drawn diagrams and visual overviews. Methods used to create these representations were adopted from the natural sciences and have become popular, especially in contemporary textbooks, because they allow readers to take in a wealth of information and relationships at a glance. The use of diagrams in art history is indicative of a desire for scientific, ‘objective’ knowledge of the kind produced in the natural sciences. In art history, however, these diagrams are highly subjective and modelling decisions often reflect specific views on the history of art. It is therefore important to discuss the subjective nature of these diagrams with students, in order to create a more nuanced understanding of the canon and its origins.
In recent decades, (visual) modelling techniques for art historical data have been extended to include digital tools, alongside the hand drawn, static diagrams of textbooks. These tools significantly increase modelling strength and functionality. As such, they could be used to help provide insight into the very problem caused by the seemingly neutral, traditional models. Network analysis is already used in art history to represent and study the canon; a notable example is the dynamic model constructed for the 2015 exhibition Inventing Abstraction, at The Museum of Modern Art, New York (2012). The usefulness of such models is debatable, however (Kienle, 2017; Lincoln, 2018). In this article, I am therefore not interested in finding a perfect system of representing the canon, but in developing educational methods for the discussion of the problematic nature of that canon. I propose the use of digital tools to draw students’ attention to the artificial nature of the static models they are presented with. Actively using these tools allows for a better understanding of the way in which canons are structured. By asking students to produce their own models of the information, they are forced to consider the various modelling decisions that have gone into traditional diagrams, from categorization and labelling to visualization and layout.
This article is based on my teaching practice as an art historian. In discussing the concept of the canon in my methods courses on art historical research, I introduce various influential art historical diagrams and have students think about the implications of these representations. I then ask them to translate existing models into new representations, using digital tools. In this article I will discuss the most valuable lessons drawn from this process of translation. I have chosen ontological modelling as the preferred method (for reasons explained below), but different kinds of digital modelling methods can be used to help deconstruct the canon. Note that the use of the word ‘ontology’ here should not be confused with its use in the field of philosophy; in computer science it denotes a modelling technique, related to the database.
To illustrate the potential of this modelling method, we will look at an important case study I use with the students: the famous diagram of Modern art by Alfred H. Barr Jr, drawn up for the catalogue of the 1936 MoMA exhibition Cubism and Abstract Art. The drawing visualizes the development of Modern art from 1890 to 1935, starting with the four artists who have become known as the pioneers of Modern art – Van Gogh, Gauguin, Cézanne and Seurat – and ending in the division between non-geometrical and geometrical abstract art. As explained in the catalogue, Barr saw the history of this period as a continuous dialogue between art movements, culminating in the development of two forms of abstract art. Both the diagram and the catalogue text have been highly influential in shaping the art historical narrative of the Modern period, in the minds of both scholars and students (Brennan, 2007: 179-180; Mitchell, 1994: 231; Rosenblum, 1986: 1; Schmidt Burkhardt, 2000: 387-388). Considering the various modelling decisions necessary for translating the diagram into a digital ontological model will allow us to study the fundamental assumptions of the represented narrative.
This study is an open-ended project; it does not offer a novel, elaborate ontological model of either the canon at large or Barr’s diagram in particular. Instead, it focuses on a discussion of the method and its possibilities as a starting point for the conception of such models. As I am writing, my students are at work designing small ontologies and visual representations of the art historical knowledge they have encountered during their studies. While these projects are unlikely to result in solutions to amend our battered and bruised canons, they will provide the students with valuable knowledge of how the structuring of information influences our understanding of that information. Improving our art historical canons can start with creating an awareness in our students of the subjective nature of these seemingly objective selections and narratives.
Before taking a closer look at the process of translating Barr’s diagram, the relevance of ontological modelling in relation to the problems of the canon in general will be discussed, in section one. This is followed, in section two, by a brief introduction of Barr’s diagram and its particular characteristics. The remaining sections discuss aspects of the diagram’s translation into an ontological model, which raise questions about the nature of the canon represented in Barr’s diagram. A close look at the nodes, in section three, helps students consider the role of the artist’s identity in the canon. Translating the relationships between those nodes allows them to analyze the meaning of ‘influence’, as discussed in section four. And finally, in section five, a comparison of the dimensionalities of narrative, diagram and ontology provides insight into the expressive powers of the different mediums and the ways in which they steer our understanding of art history.
From canon to ontology
Critiques of the canon have come in various forms (Brzyski, 2007; Camille, 2019; Grenier, 2013; Nochlin and Reilly, 2015; Onians, 1996; Pollock, 1988, 1999). Some target the problematic and biased selections and aim to make the canon more inclusive, while others focus on the underlying structure of the phenomenon. In her discussion of the underrepresentation of women in art, Cynthia Freeland (2003: 90) labels these two strategies ‘add women and stir’ and ‘down with hierarchy,’ respectively. The first is an attempt to actively look for underappreciated or forgotten artists and add them into our art historical overviews. The Guerilla Girls artist collective, for instance, has been a strong and successful proponent of this method for decades. The second method concerns itself with the underlying structure of the canon and the hidden assumptions, which make it fundamentally challenging for some to enter the canon. Griselda Pollock’s discussion of the spaces of femininity in the art historical developments of Modernity (1988: 50-90) can be seen as an example of this perspective (other examples are provided by Barzman, 1994; Nochlin and Reilly, 2015; Van Wyck, 1994).
These two approaches are not mutually exclusive. Both are in essence concerned with the process of selection underlying the canon. While the first tries to expand the selection of admitted artists in order to widen the field, the second proposes a reconsideration of the selection criteria. The structure of the canon has historically relied on definitions of art and genius (Brzyski, 2007; Freeland, 2003), which have introduced a distinction between art worthy of canonization and art of the periphery, resulting in a powerful but rigid selection. Without going into the difficulties of truly defining the canon, it is clear that the aspect of selection will form the basis of any definition of this fickle concept. Attempts to radically open up the canon to include an ever-wider range of art therefore seem not only to be futile but, moreover, to go against the very essence of what constitutes the canon. The power and authority of the structure are derived directly from the distinction between inclusion and exclusion. Christopher Steiner (1996: 214) puts it well when he writes:
“Seeking piecemeal admittance for one type of putatively undervalued art or another does little to challenge the fundamental structures of inequity and hierarchy which are inherent in the canonical order. If anything, in fact, such practices function merely to validate the canon system.”
In discussing the intricacies and flaws of the canon with students, it is important to go beyond a pointing out of excluded identities and subjects. It is the structure itself that needs deeper understanding. The canon is essentially performative, engaged in a constant process of reaffirmation and recreation, or as Steiner (1996: 217) described it, “[it] is not, in Bourdieu’s language, a “structured structure” into which art and artists must simply be made to fit; rather, it is a structuring structure which is in a continuous process of reproducing itself.” Rather than passively studying a fixed canon, students can be trained to actively engage with and shape future canons.
It is here that ontological modelling can help us. This modelling technique has gained importance in the field of computer science over the last several decades (for instance playing an important role in the semantic web) and is already occasionally applied in studies of art history and heritage (Moraitou and Kavakli, 2018; Szabo, 2012; Tibaut et al., 2018). It is described by Thomas Gruber (1993: 1) as a representation of “the objects, concepts, and other entities that are presumed to exist in some area of interest and the relationships that hold among them.” In other words, the ontology makes explicit a network of relationships of various kinds, between entities in a domain or system, be it a business structure, an online encyclopedia, or a field of academic knowledge. In this respect, it resembles the more traditional database, but there are significant differences (Sir et al., 2015), which makes the ontology particularly suitable for modelling the art historical canon.
In a database, the structure of the data is meaningless in itself – meaning only exists in the relationships between the data elements that fill the structure. In the ontology, on the other hand, the structure of the modelled data set is meaningful even without actual elements filling the structure. For example, both database and ontology can represent the categories artist and artwork, but only in the ontology the meaningful relationship between the two – artists create artworks – is embedded in the structure of the model itself and can therefore be read and ‘understood’ by the computer handling the model. While databases are primarily used to represent data, ontologies are used to represent relations of meaning, with the individual data entries taking on meaning within the meaningful structure of the model. As a result of these differences, databases and ontologies serve different research purposes; databases are most effectively used for data storage and ordering, while ontologies have a stronger focus on analytical research, allowing for new insights to be inferred from the implemented data.
This is a far cry from the basic functionality used by the students in creating their models and many of the resulting models could have been created as databases as well, but the architecture of the ontology resembles that of the canon more closely than the database does and therefore serves as a better tool for discussion with the students. In addition, interested students can continue their work and benefit from the complete functionality of the modelling system. The focus on the structure and its inherent meaning provides a good starting point for an examination of the canon and its implicit assumptions and biases. It allows us to reevaluate the very structure of the canon, following the ‘down with hierarchy’ strategy described by Freeland (2003: 90). Students representing the canon in ontological models have to concern themselves first and foremost with structural questions, since an ontological model exists and is meaningful even without and before implementing concrete data (such as actual artworks and artists).
While ontological models can be highly complex and allow for advanced functionalities like computer reasoning, the basics of constructing a model are relatively simple and easy to grasp for students of art history. I will outline the fundamentals here, to create a context for the analysis below, but the functionality of the method far exceeds the uses of it in this project and a wealth of tools and documentation can be found (Horridge, 2011; Keet, 2018). With my students, I use the freely available tool Protégé, an ontology editor which can be used in web-based or downloaded form (Musen, 2015; Protégé). The website provide links to elaborate tutorials, instructions and documentation. In the following, I will therefore use the terminology found in Protégé.
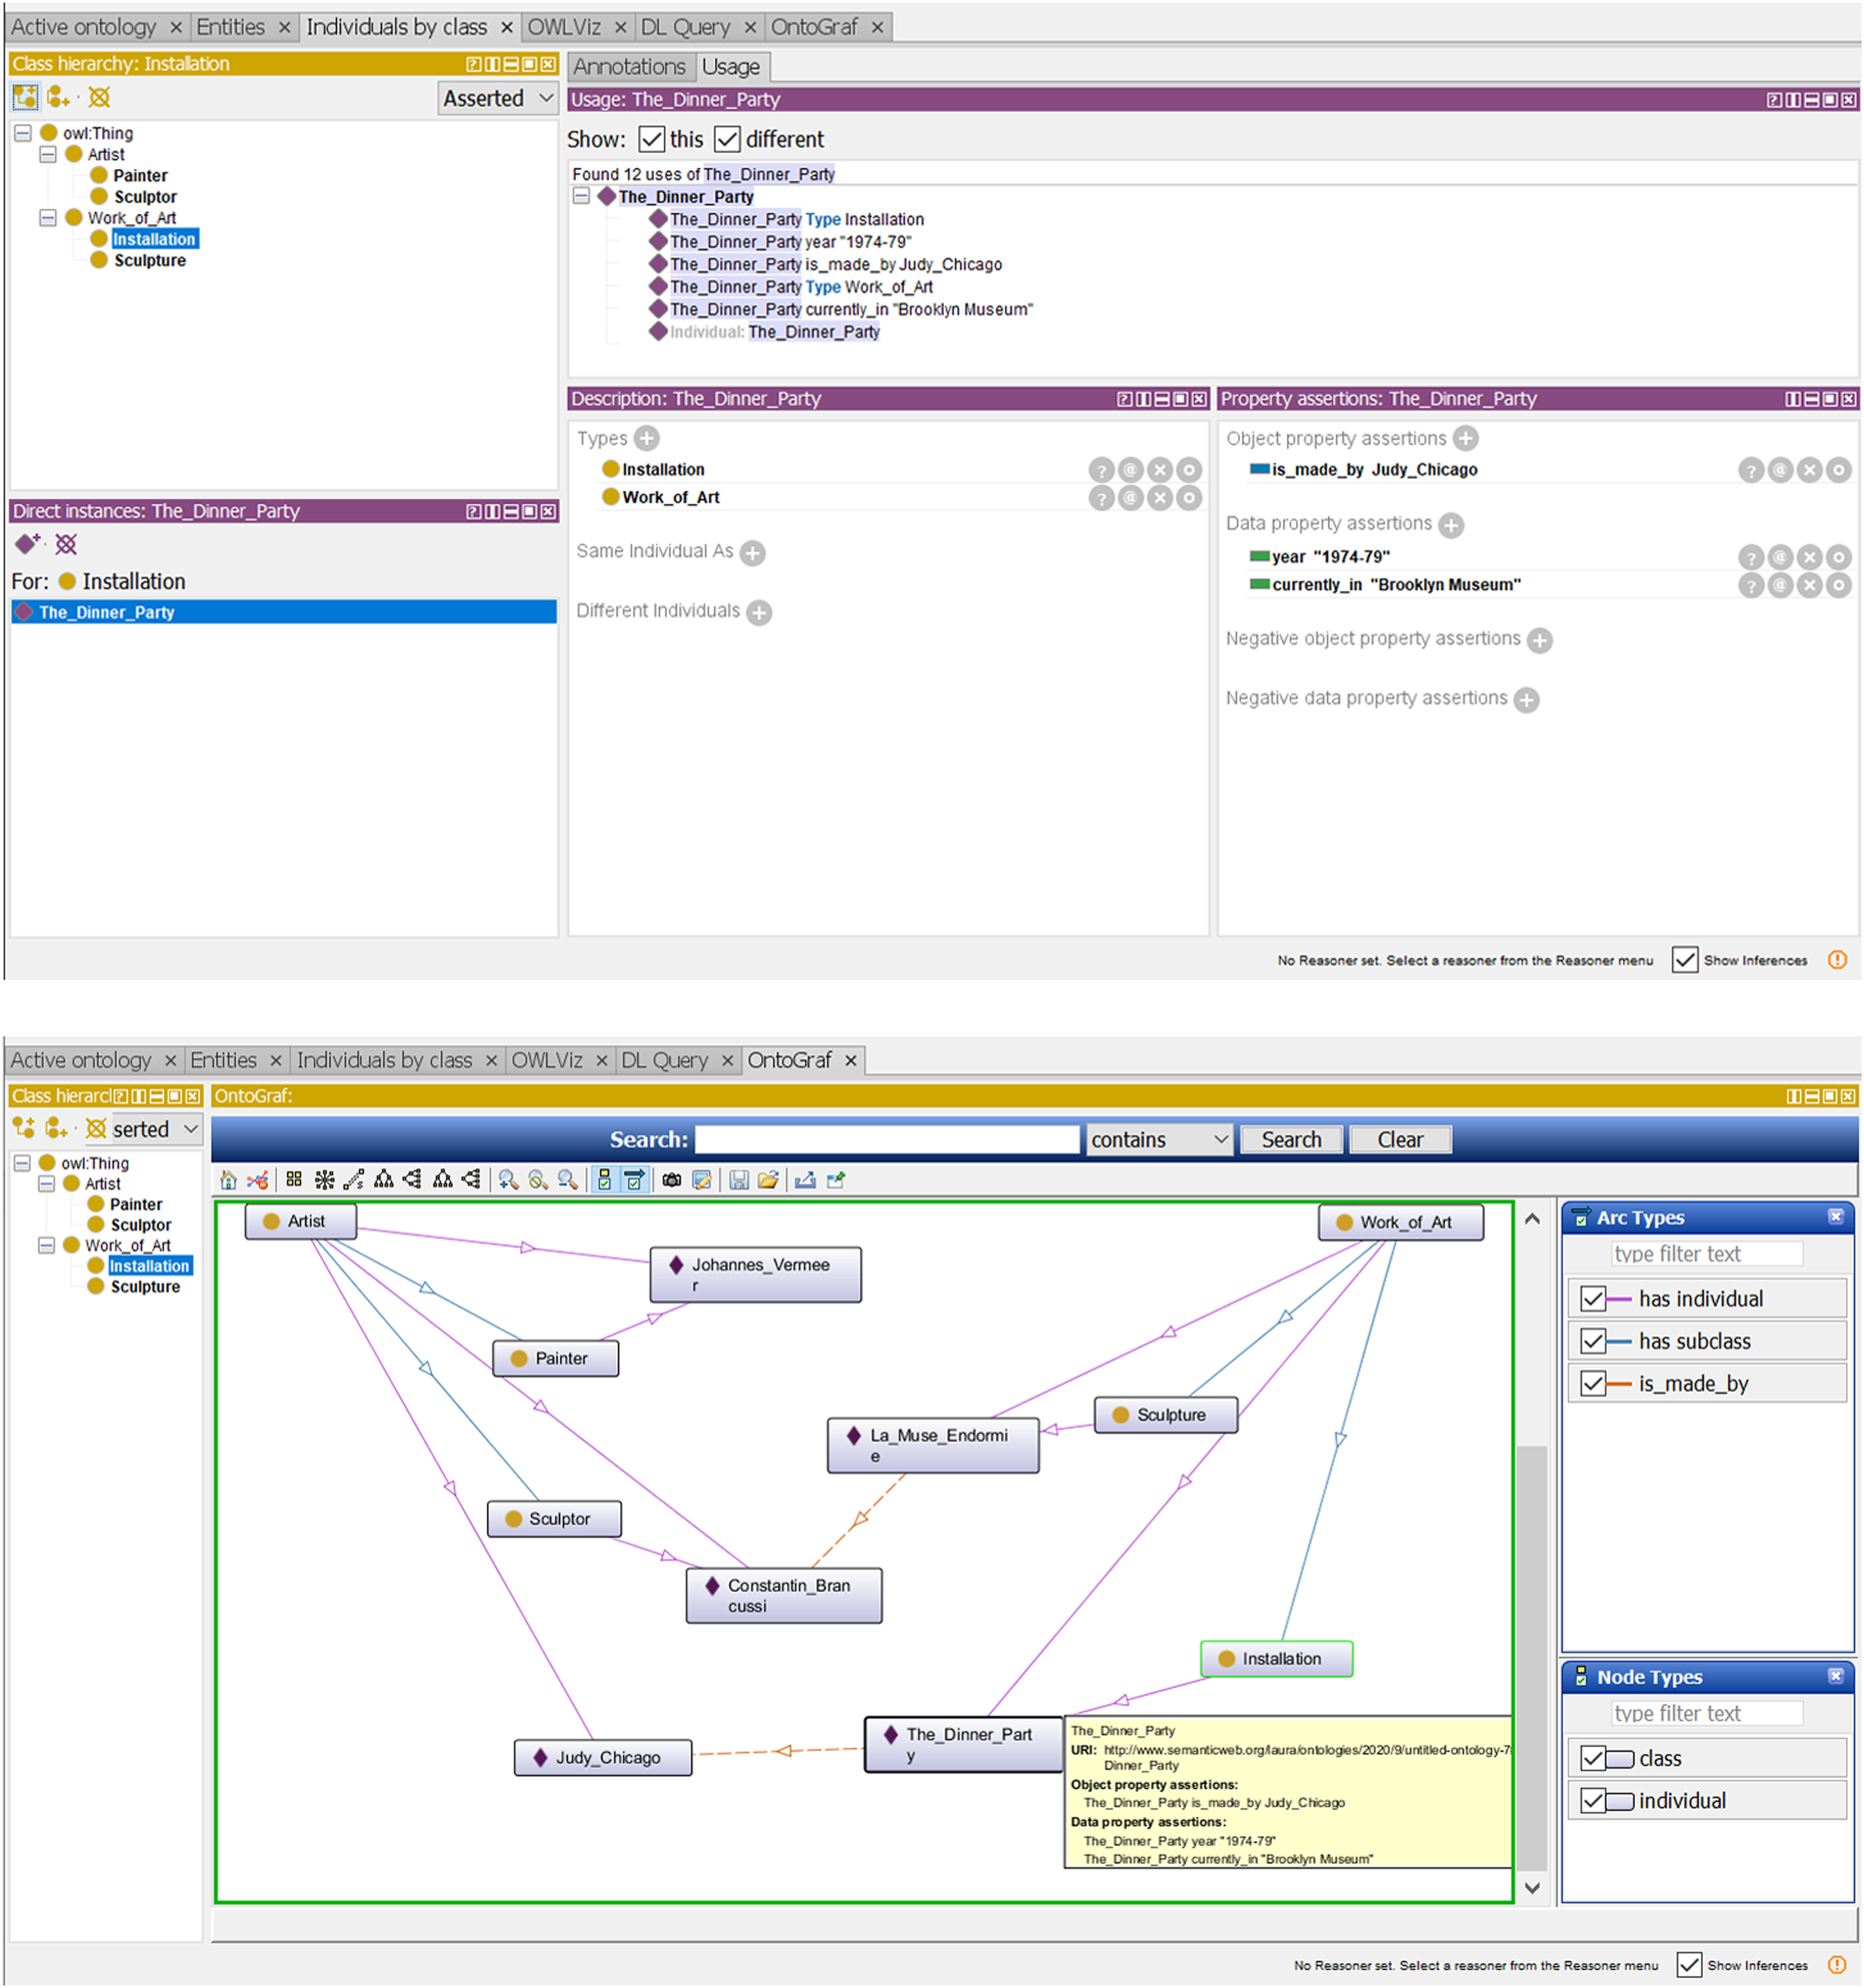
In the ontology, classes are formulated for specific categories of data, in the case of the art historical canon for instance ‘Artist’, and ‘Artwork’. The classes can possess subclasses: for ‘Artist’ the subclasses ‘Painter’ and ‘Sculptor’ could be added. The specific data (in databases represented by the rows in the relations) are included in the model by attaching individuals to the classes. The class ‘Artist’ might therefore contain the individuals ‘Johannes_Vermeer’ and ‘Constantin_Brancusi’, within the subclasses ‘Painter’ and ‘Sculptor’, respectively, as well as ‘Judy_Chicago’ directly within the class ‘Artist’ itself. To specify traits of classes and instances, properties are connected to them. These can be of the type object property or data property. Object properties connect instances in the ontology to each other to indicate relationships, such as ‘is_made_by’, which connects an artwork to its artist(s). Subclasses are always related to their parent class by the object property ‘IS_A’. Data properties, on the other hand, connect an element to a specific (numerical, textual, etc.) value, such as ‘date_of_birth’. Figure 1 shows a schematic drawing of such an ontological structure, while Figure 2 shows two screen dumps of the same data modeled as an ontology in Protégé. An example of the structure of a possible ontology, here drawn manually. Classes are indicated in red (with outline), subclasses in yellow (without), data properties are underlined in solid green and object properties in dotted blue; ‘dob’ indicates the year of birth and ‘dod’ the year of death. The ontology of the network presented in figure 1, here constructed in Protégé. The screen dump above shows the list of (sub)classes under ‘Class hierarchy’ (top left), the list of instances that are part of the class ‘Installation’ under ‘Direct Instances’ (bottom left), and the various attributes and properties of the instance ‘The_Dinner_Party’ in the three windows on the right. The screen dump below shows a visualization of this model, using the Protégé plugin OntoGraf. The tool allows the user to position the nodes manually, as has been done for this screen dump, or to use a range of automatically rendered configurations (such as radial, tree or spring). In the windows on the right the arc and node types are specified. Hovering the mouse over the instance. ‘The_Dinner_Party’ results in the pop-up, in yellow, providing the properties of the instance.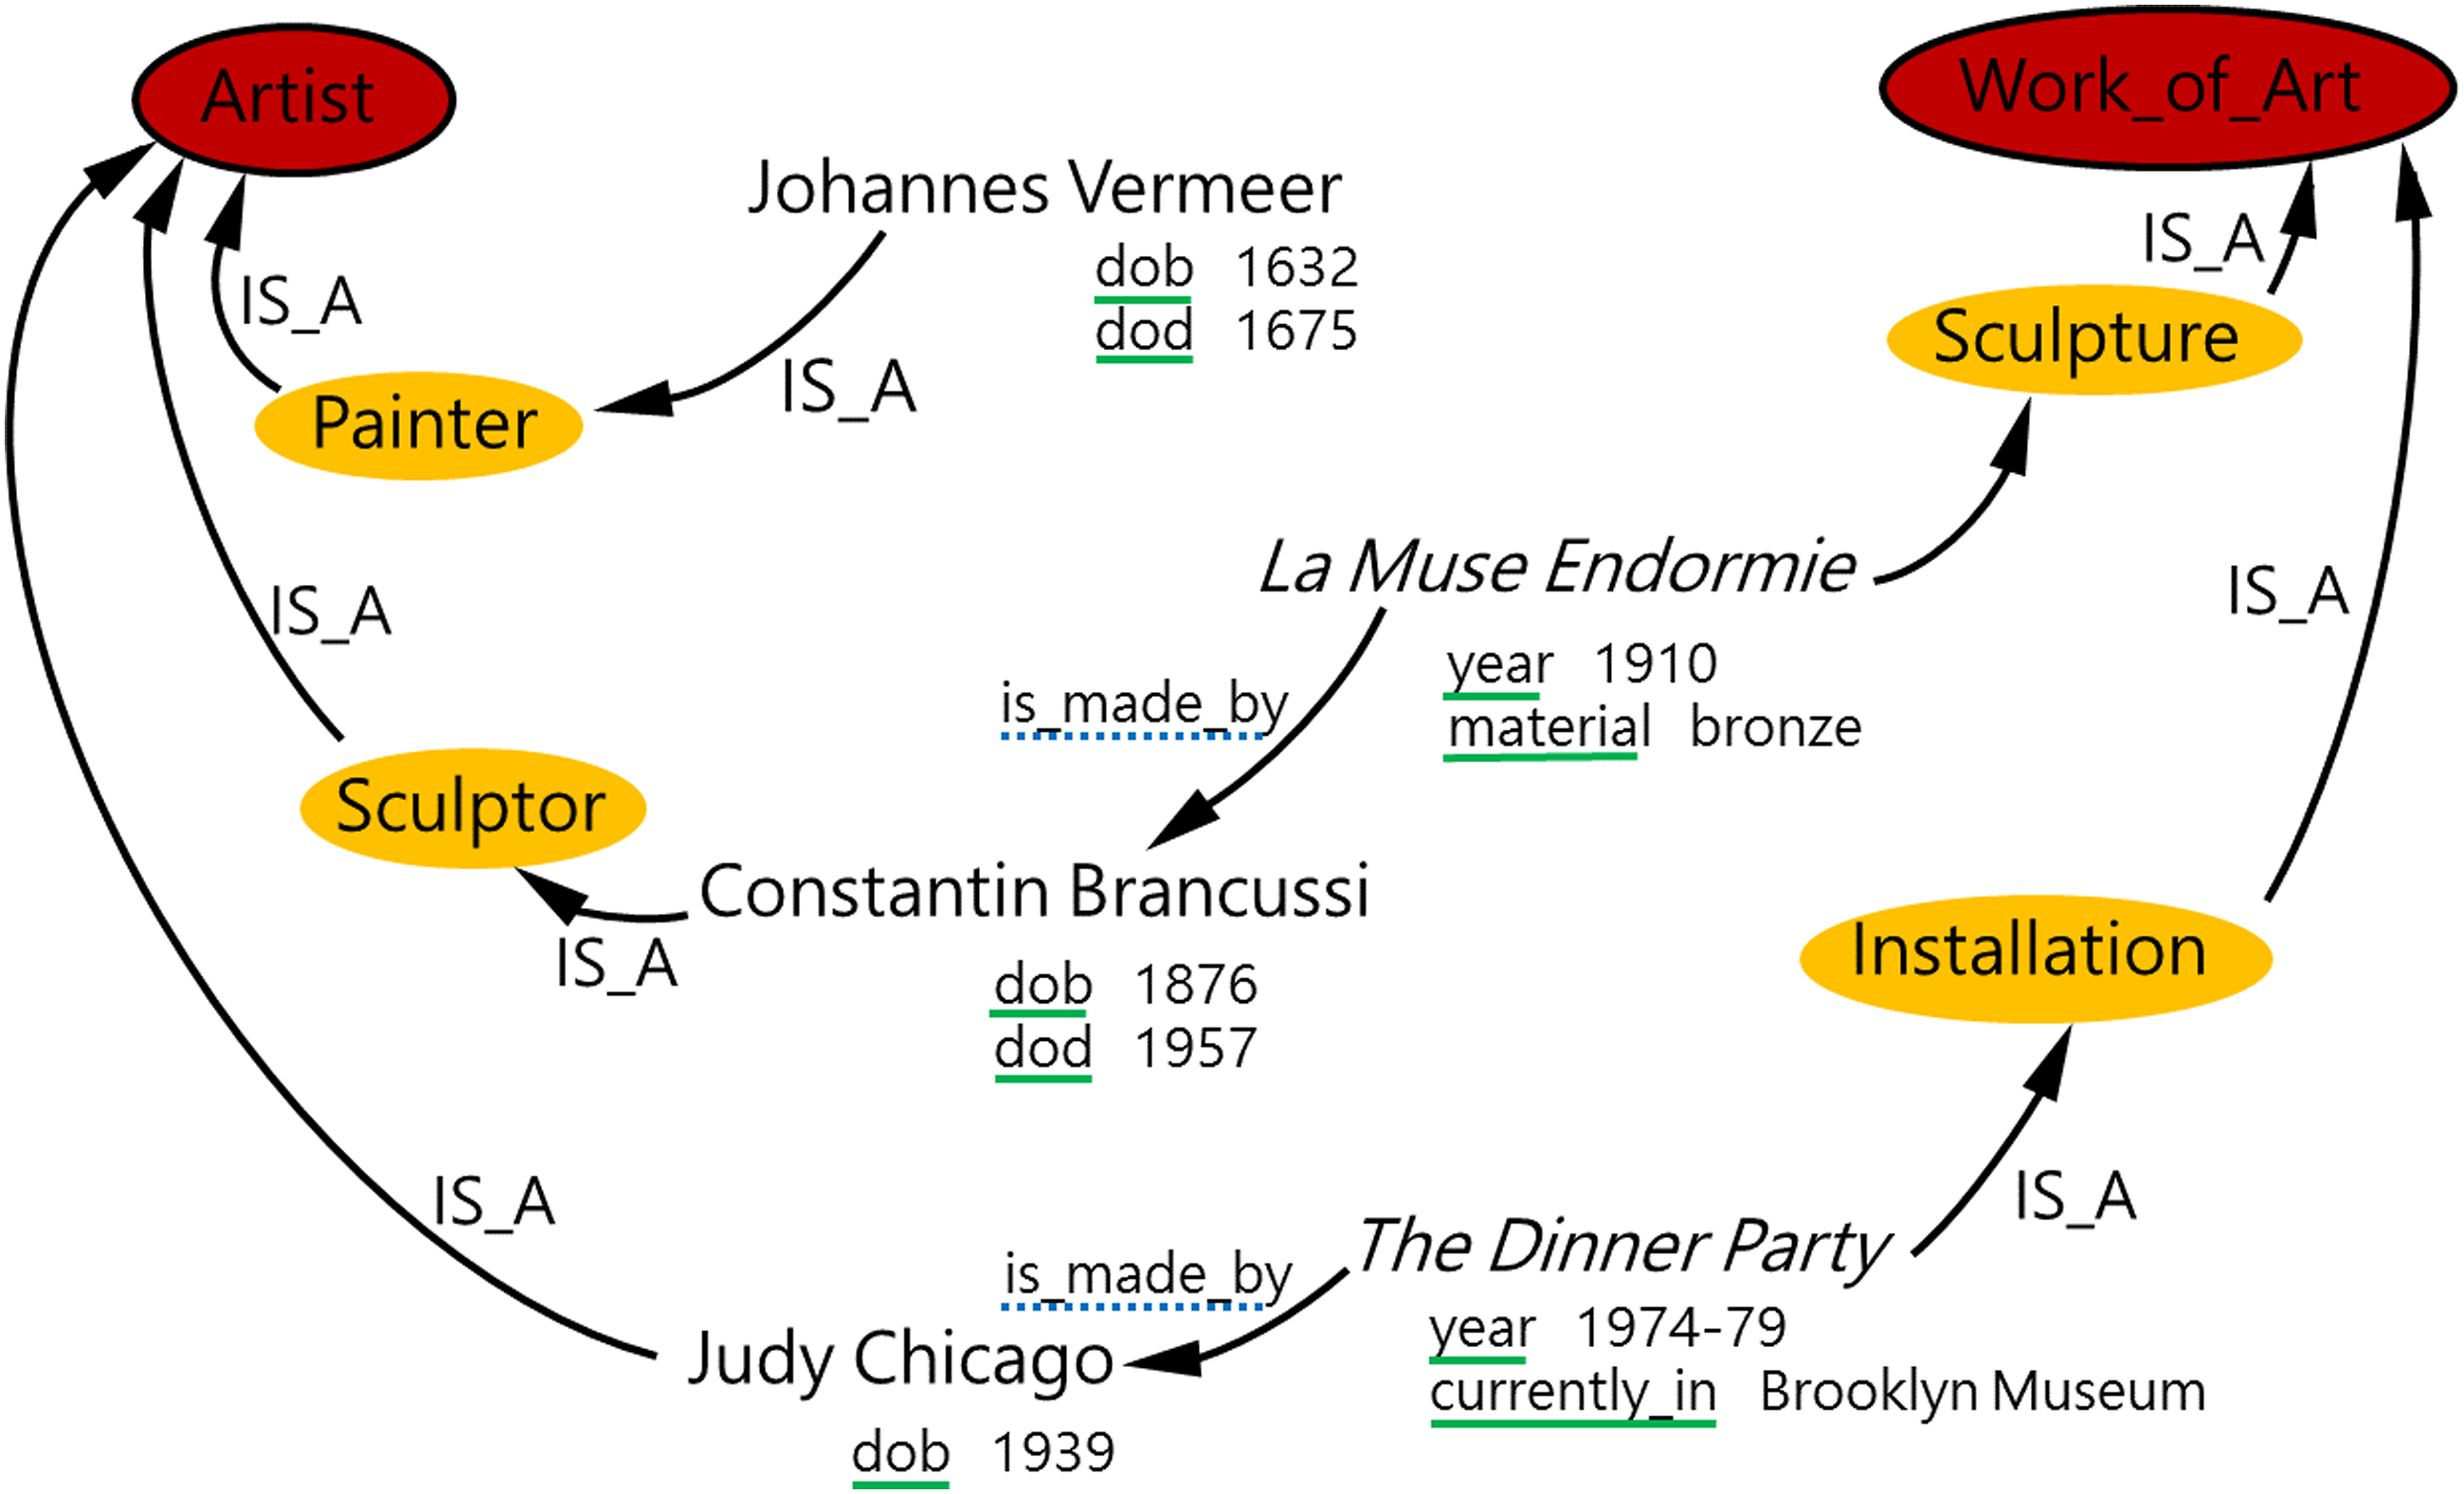
The described aspects of ontological modelling represent only the very basics and most ontological models are far more complex, but for the present purposes these features form a good starting point. They allow students to analyze existing models as well as textbook overviews and create simple translations of these which bring to light complexities of the modelled canons. The diagram by Alfred Barr presents a good case study and will be used in the following sections to illustrate the most important lessons taken from these experiments.
Alfred Barr and the visualization of art history
Barr’s flow chart is part of a long tradition of diagrams used in art history. Early on in the 19th century, schematic overviews of chronological and geographical development started being introduced in art historical textbooks (Nelson, 1997; Schmidt Burkhardt, 2005a, 2017). Examples of these diagrams often took the tree as a metaphor for art historical development, reflecting a general understanding of the pre-Modern canon, in which relationships of artistic influence between artists (mostly masters and students) were seen to determine art historical progress. External influences and simultaneous, but independent, events (for instance in other parts of the world) could not easily be taken into account in such models.
In the Modern period, it is not merely art itself in which the focus shifts from figurative to abstract forms; a similar shift can also be observed in the diagrams its scholars used to visualize the canon, away from tree diagrams and towards more abstract and complex representations (Schmidt Burkhardt, 2005b: 114-119, 2017: 22-24; Vere, 2010: 258). Of these diagrams, the most well-known is undoubtedly the model which Barr designed for the catalogue of the 1936 exhibition Cubism and Abstract Art, shown in Figure 3. It is an example of a flow chart, presenting the modelled artists and movements as steps in the process of artistic development. Although resembling earlier tree diagrams in its modelling of time as the vertical axis, it is no longer limited to the use of bifurcations in the representation of relationships. Flowchart designed by Alfred H. Barr Jr. for the cover of the catalogue accompanying the exhibition. Cubism and Abstract Art (1936), published by the Museum of Modern Art, New York. Image reproduced from https://assets.moma.org/documents/moma_catalogue_2748_300086869.pdf.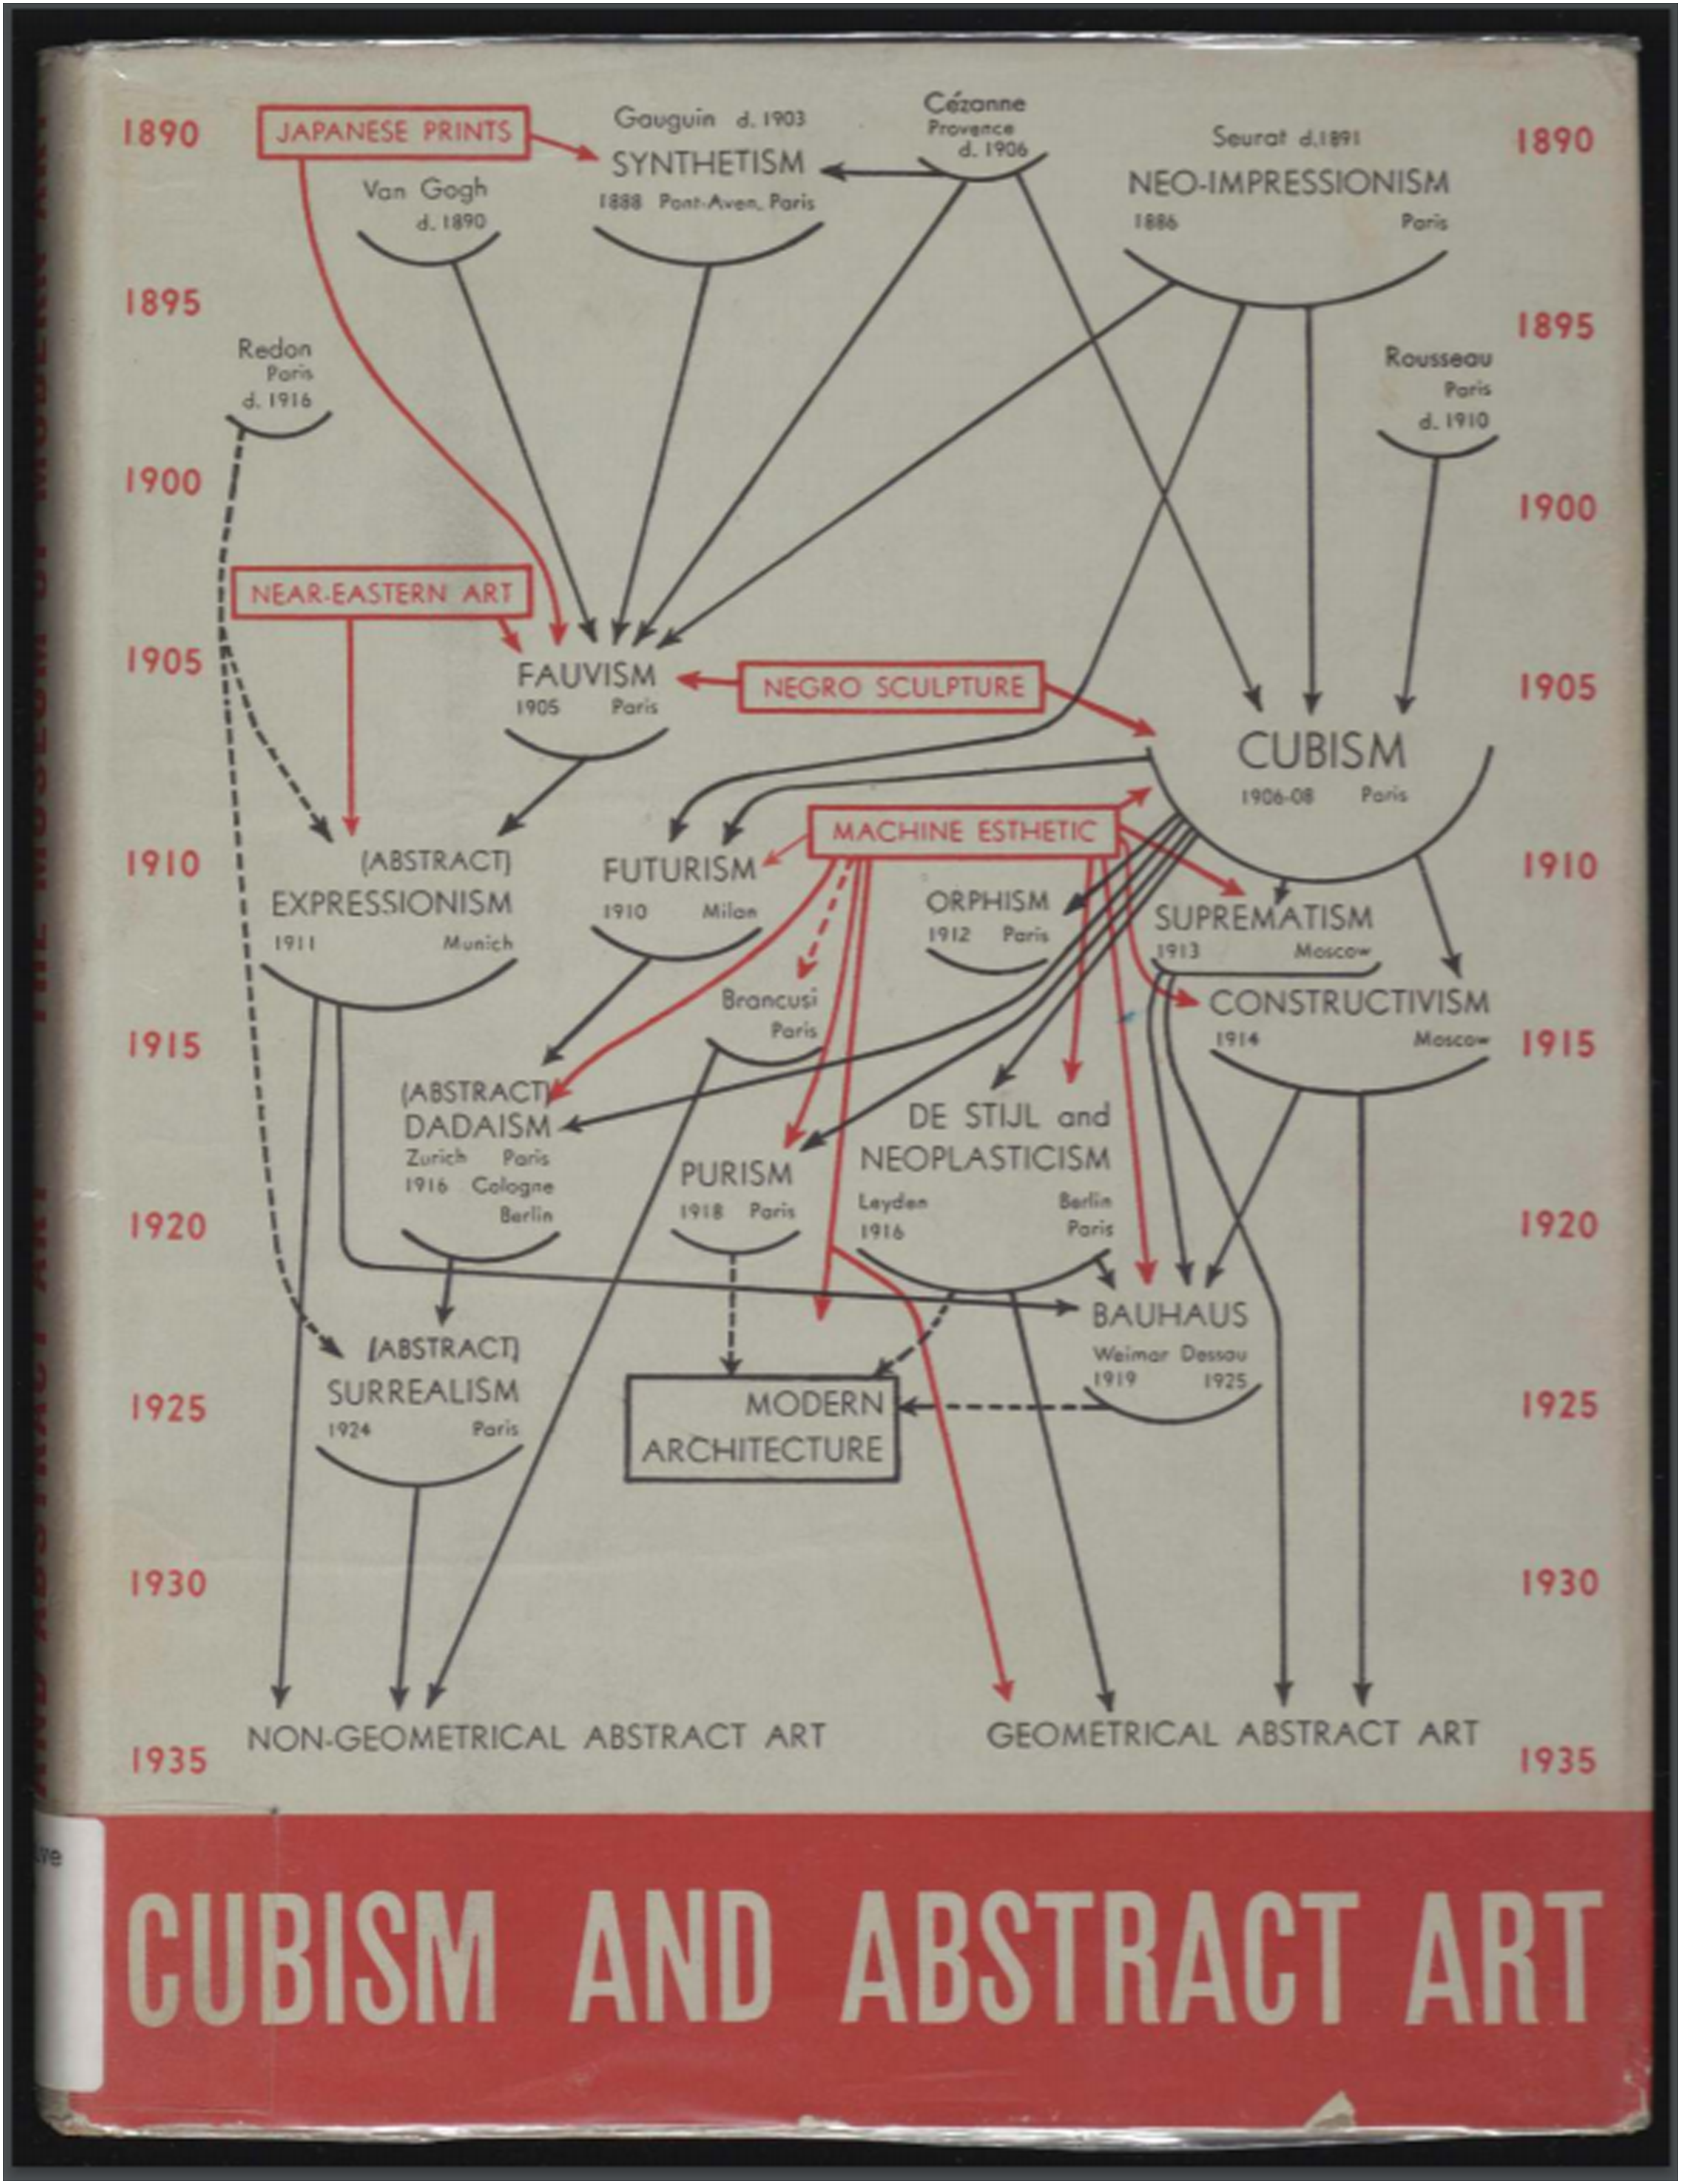
Whereas tree diagrams force new artistic events to ‘branch off’ nodes directly preceding them, Barr’s chart allows more freedom by describing art historical developments in terms of streams and rivers, as illustrated by his own elegant descriptions (1936: 19):
“The first and more important current finds its sources in the art and theories of Cézanne and Seurat, passes through the widening stream of Cubism and finds its delta in the various geometrical and Constructivist movements which developed in Russia and Holland during the War and have since spread throughout the World.”
Streams in the diagram could separate, converge and even run underground for extended periods of time, only to reappear at later stages (Barr, 1936: 19). Using a flow chart allowed Barr to visually represent the art historical narrative set out in the exhibition.
The catalogue has been authoritative in the way it explains the progress of Modern art. The Avant Garde movements are shown to propel themselves forward by a mixture of active resistance against the past and incorporation of influences taken from that past. Each new movement retains artistic elements of its predecessors, but at the same time finds fault with previous ideas, resulting in a style, radical enough to give rise to a new movement. Schmidt-Burkhardt (2000: 393) describes how “[the avant-garde] repeatedly forces its way forward in his diagram like raiding parties who advance into new territories of art. (…) The arrows coming from different stylistic camps mark the impact with which they make a breach in convention.”
In Barr’s account (1936: 11), the move towards abstraction is to be understood as a formalist reaction against the imitation of nature: “The more adventurous and original artists had grown bored with painting facts. By a common and powerful impulse they were driven to abandon the imitation of natural appearance.” Barr saw the movements as logical steps in an essentially closed-off story of art, each movement logically following its predecessors. Although political motivations are seen to play a role for some of the isms, most notably Futurism, and Surrealism (associated in the catalogue text with fascism and communism respectively; 1936: 16), on the whole the history of Modern art is explained as an internal process, detached from social influences. The diagram reflects this: while various external factors, such as ‘Japanese Prints’ and ‘Near-Eastern Art’, are included in the drawing, these outside influences remain of secondary importance, acting merely as context, and the art movements seem to exist in a realm of their own, governed by the artistic geniuses of Modern art.
The logic and clarity of Barr’s argument were widely praised, for instance by Robert Rosenblum, who wrote the foreword of the catalogue’s 1986 edition and described it as “the Bible of modern art” and “a rockbottom foundation for all my subsequent studies of 20th century art” (Rosenblum, 1986: 1). William J.T. Mitchell described the text in similar terms as a “a highly compelling myth” and “a kind of exoteric, publicly accessible crystallization of theory, one that can be codified easily for classroom presentations” (1994: 231). However, the simplifying narrative that presents art as existing in its own sphere, independent from external factors, also led to criticism (Schmidt Burkhardt, 2000: 395-398; Vere, 2010: 259). Meyer Schapiro, for instance, questioned the omission of social and political context and described Barr’s conception of abstract art as “essentially unhistorical”, summing it up as a “theory of exhaustion and reaction” (1973: 79). Likewise, Griselda Pollock (1988: 50) criticized the almost self-evidently gendered nature of the construction of Modernism in Barr’s narrative.
Although Schapiro’s understanding of Barr’s ideas does not do justice to the more complex explanation provided in the catalogue, the diagram – printed so prominently on the cover – does indeed suggest a simplification of this kind. The black arrows indicate straightforward relationships, all of the same nature, except perhaps for the dotted line between Redon and Expressionism. Read by Schmidt-Burkhardt as “impact” (2000: 393) and by Schapiro as reactions to artistic exhaustion, these symbols evoke a sense of scientific accuracy that hides a complex historical context. And by presenting this artistic evolution as pure and distinct from social concerns, the resulting canon becomes seen as politically and socially neutral.
It is this deceptive simplicity, which sells constructed myth as objective fact, that I want my students to become aware of. At first glance, the model seems scientific and self-explanatory, with its neutral use of arrows, boxes and semi-circles. On closer inspection, however, the modelling decisions reflect assumptions about the history of art that separate the canonical from the non-canonical. A detailed look at the translation of these elements will make this clear.
A canon of artists
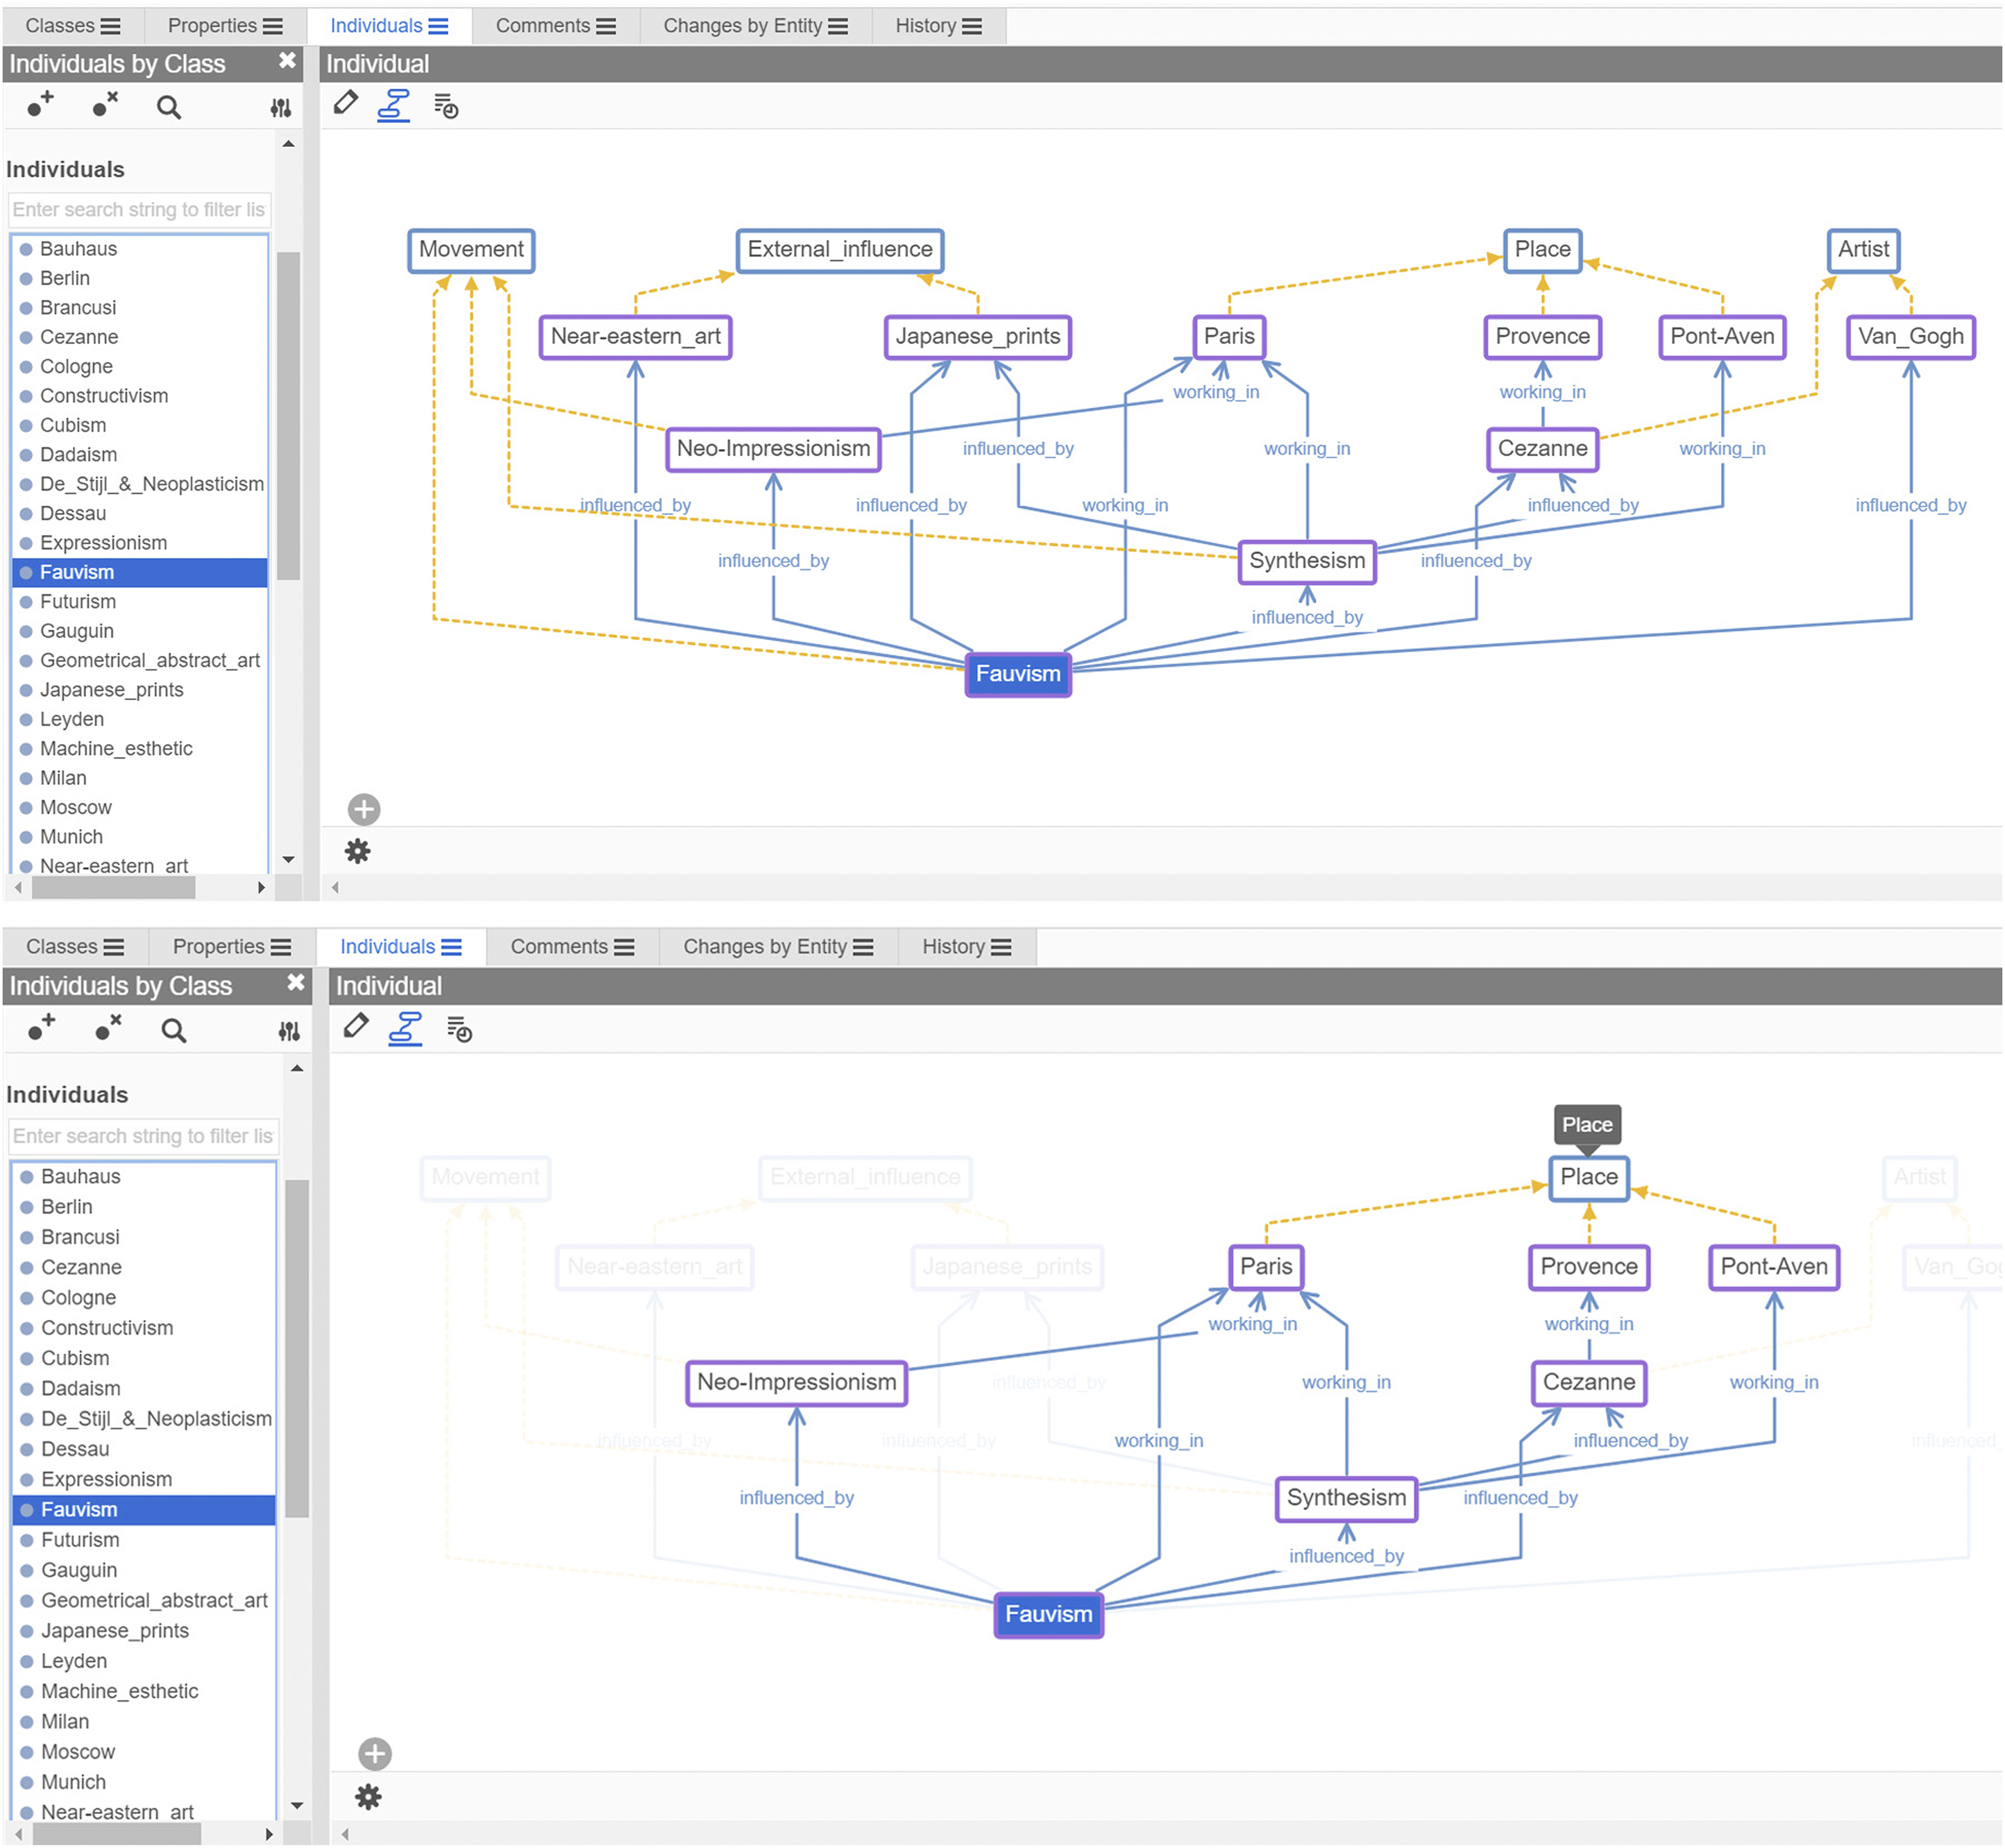
When setting my students the task of reconstructing Barr’s diagram as an ontology, the biggest challenge is the definition of classes and properties. Actors in the diagram need to be translated into classes and subclasses, while the relationships modeled by Barr are turned into properties. This section will take a closer look at the characteristics of Barr’s nodes and the modelling decisions needed to convert these into (sub)classes. The next section will discuss the translation of the relationships in the diagram, into properties between these nodes. Figures 4 and 5 show screen dumps of an ontology directly translated from Barr’s diagram (using only the information present in the diagram). In workshops, I introduce the students to this basic model to illustrate ontological modelling tools. They subsequently construct their own models, which take into account the more complex aspects of Barr’s diagram, discussed in this and the next sections. Alfred Barr’s diagram modeled as an ontology, constructed in Protégé. The screen dump above shows the list of (sub)classes under ‘Class hierarchy’ (top left), the list of instances that are part of the class. ‘Movement’ under ‘Direct Instances’ (bottom left), and the various attributes and properties of the instances. ‘Fauvism’ and ‘Paris’ in the three windows on the right. The screen dump below shows a visualization (using OntoGraf) of the relationships of the instance. ‘Fauvism’, ordered automatically by OntoGraf, using the option ‘spring.’ The same ontological model as shown in Figure 4, here opened and visualized in the web-based version of Protégé. While the functionality is the same, the visualization is slightly different. Above, the relationships of the instance. ‘Fauvism’ are visualized. When hovering the mouse over an element in this visualization, all indirect relationships recede into the background and the direct relationships stand out; in the screen dump below, the mouse has been placed over ‘Paris.’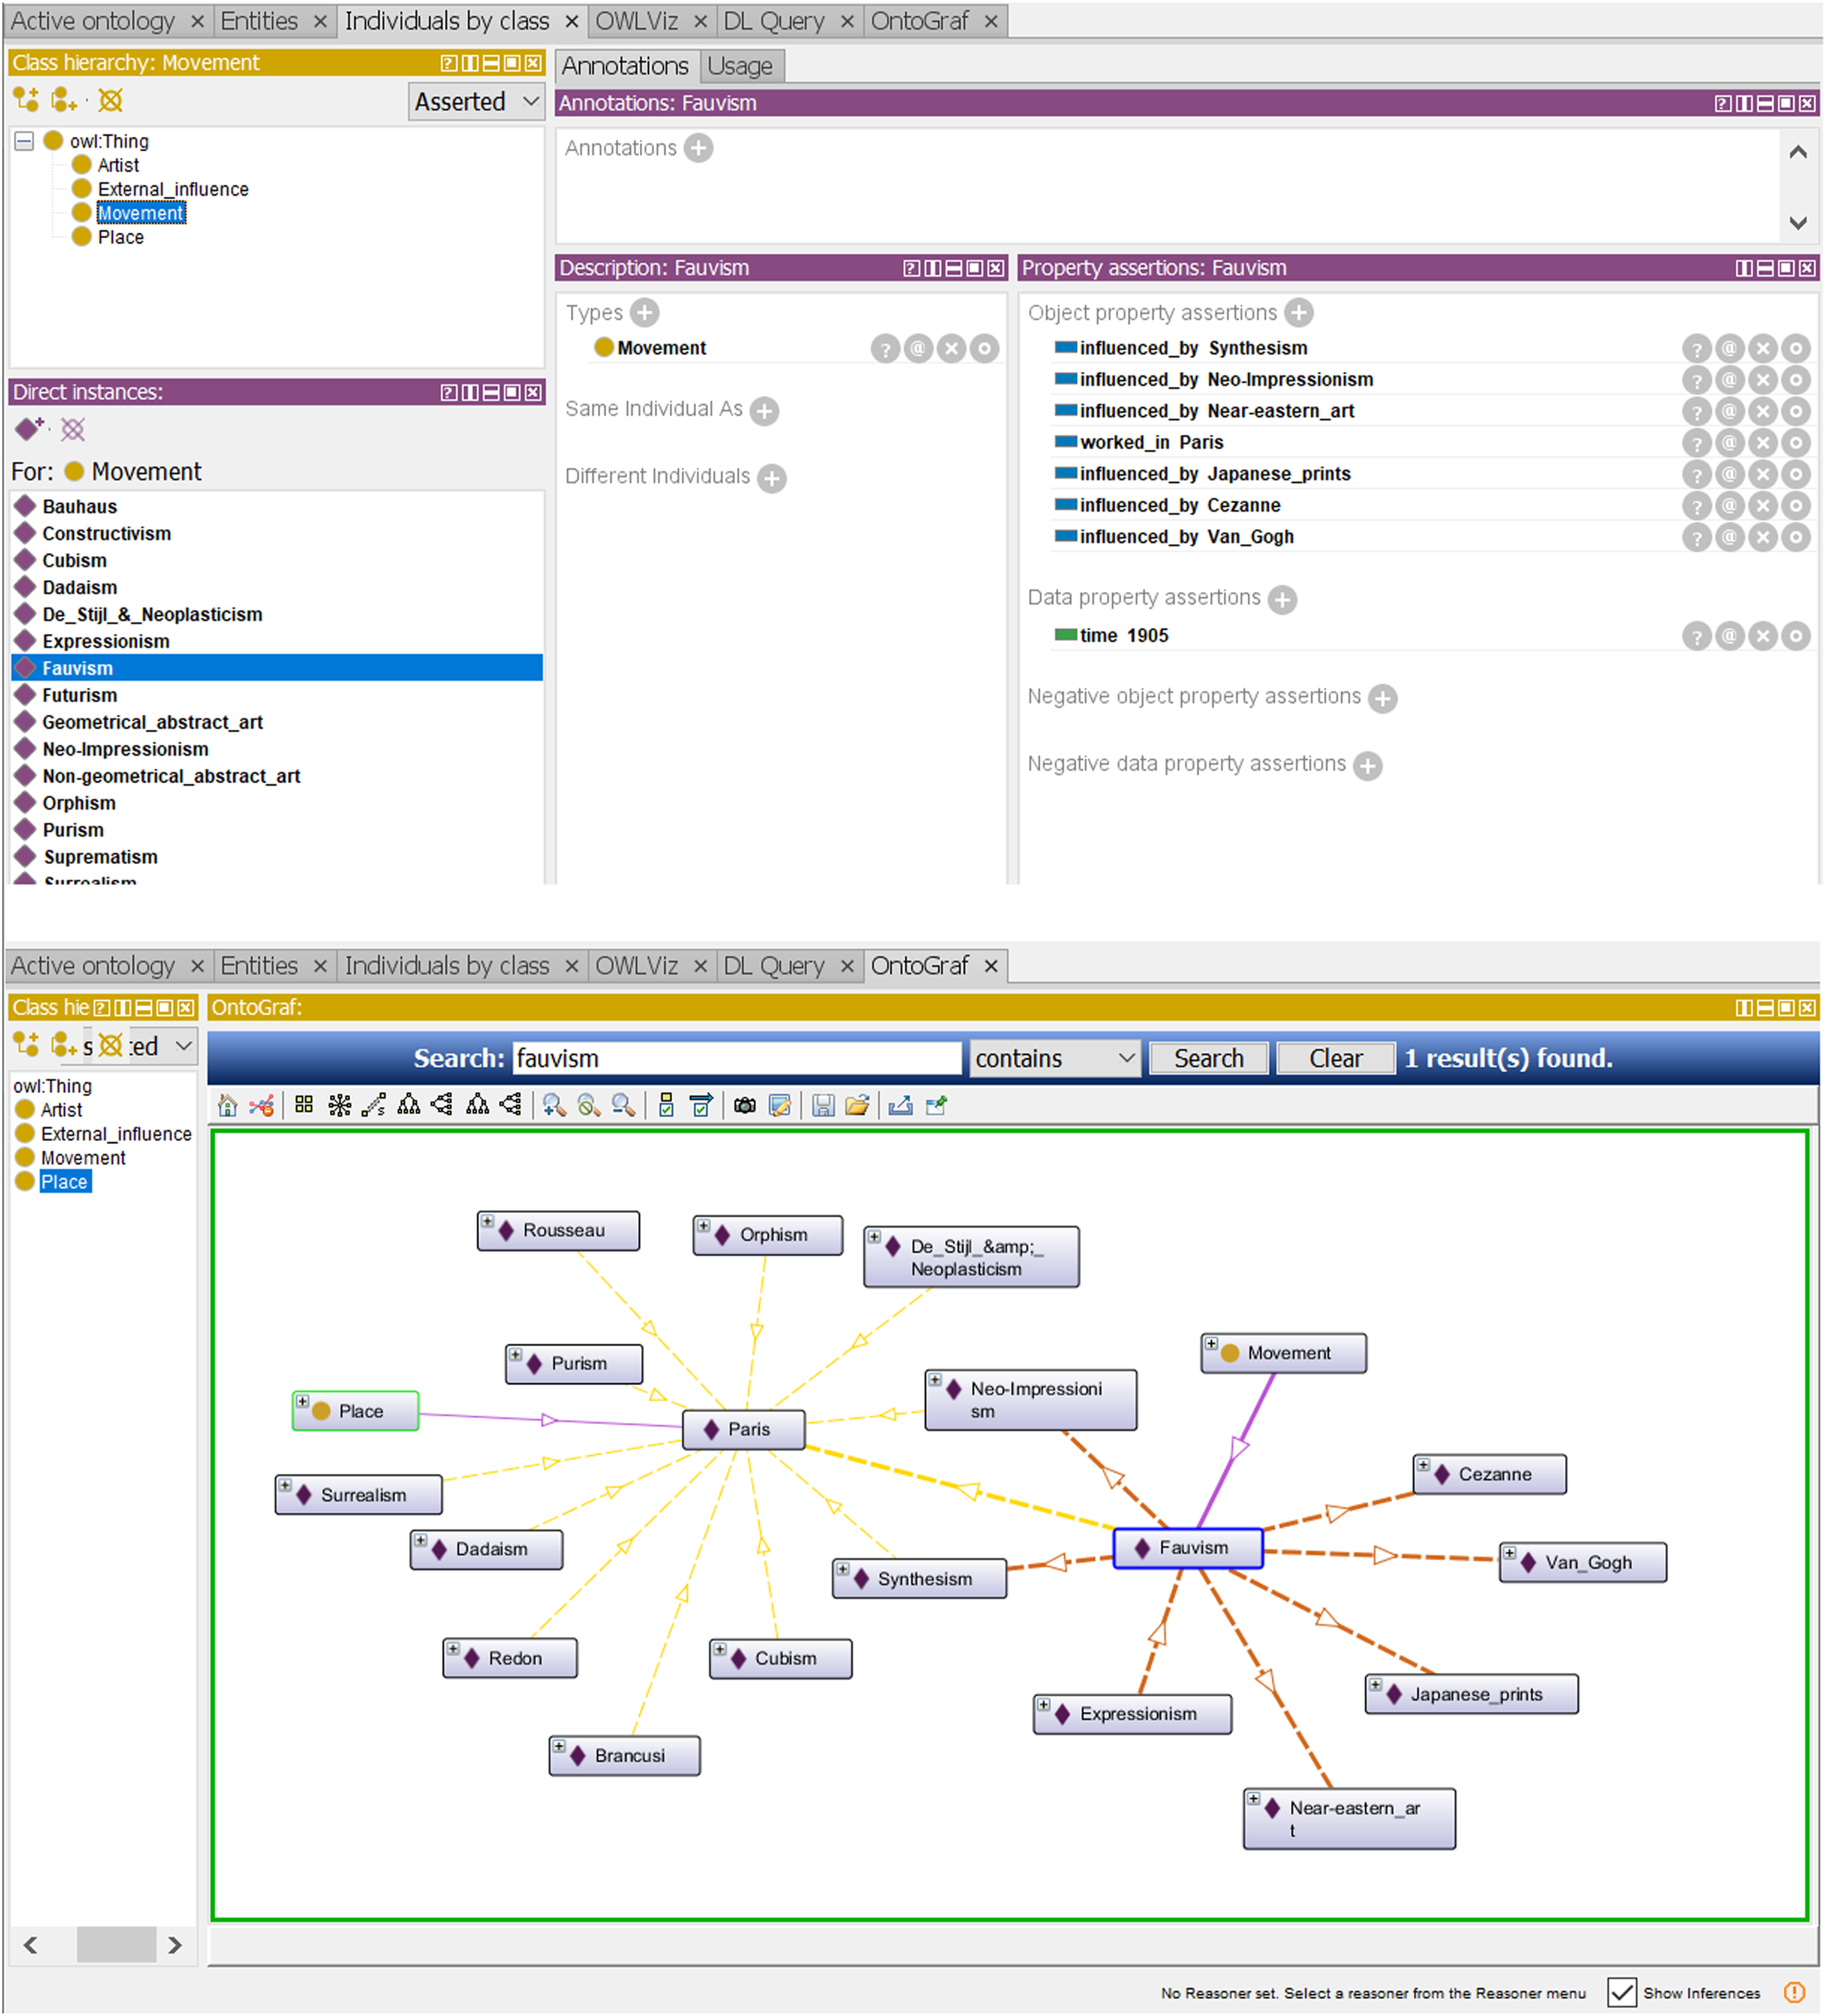
The instances in Barr’s diagram are of three types: art movements (predominantly ‘isms’), individual artists and external influences. It is clear from the start that the identities of artists and movements take precedence over the artworks they have produced. No artworks are mentioned in the diagram and the names of artists and movements come to stand, as metonyms, for their bodies of work. A canon of art is thus represented in a diagram of artists. This focus on the artist is evident in most textbooks, where chapters on different regions and time periods are organized around small narratives of the most important artists and artist groups, illustrated with their most significant artworks. It follows a traditional interest in the life of the artist.
The relevance of artists in organizing art history is intuitive, but adds to the continuing myth of artistic genius. Although biographies of artists such as Andy Warhol or Joseph Beuys contextualize their works, this attention for biographical detail can perpetuate the sense that art lives in a realm of its own and deemphasize the effects of the larger socio-historical context. It reduces artistic evolution to a series of formalistic responses by individuals whose identities fit stereotypical notions of genius (Schapiro, 1973: 79-80). As such, it can inadvertently exclude artists who do not correspond to the expected pattern. Foregrounding the identity of the artist highlights aspects of gender, class and race, in turn allowing entrance into the canon to be based largely on the identity of the artist, as opposed to the significance of the work.
How would our understanding of Lee Krasner’s works change, for instance, if she were not identified by her relationship to Jackson Pollock? While Pollock is discussed in his own right (instead of being described as Krasner’s husband), the description of her work starts as follows in the 2016 edition of Gardner’s art through the ages (2016: 955): “Lee Krasner. A towering figure in 20th-century art, Pollock tragically died in a car accident at age 44, cutting short the development of his innovative artistic vision. Surviving him was his wife, Lee Krasner…”
Early editions of textbooks like Janson’s History of art (1962) did not feature female artists at all; in fact, Janson’s text used to have a chapter called “The artist and his public” (Freeland, 2003: 91). Historical expectations of the artist’s identity have thus created inequalities which can hardly be overcome if we stay focused on the individual. Actively adding female artists to the canon will all too easily lead us to understanding their art as inherently female, again foregrounding the artists’ identities.
This focus on the artist points to the complex nature of the canon – do we think of it as a collection of works or of artists? Students are quick to notice the absence of artworks in Barr’s diagram and, when asked to make a general canon of their own, often start by creating ontological classes for both artworks and artists. While a static, spatially limited diagram cannot incorporate a variety of organizing categories, the ontology can. Representing artists and artworks separately (instead of ‘hiding’ the artworks behind their creators) allows different visualizations of the data, in which different categories become foregrounded. In visualizing the ontology one can show artworks and their properties, while moving artists to the background. Figure 6 illustrates this by showing a different visualization of our earlier example canon, focused on the artworks. The ontology presented in Figure 3, visualized with a focus on the artworks. While this is a very small example, the principle applies to larger and more complex ontologies as well.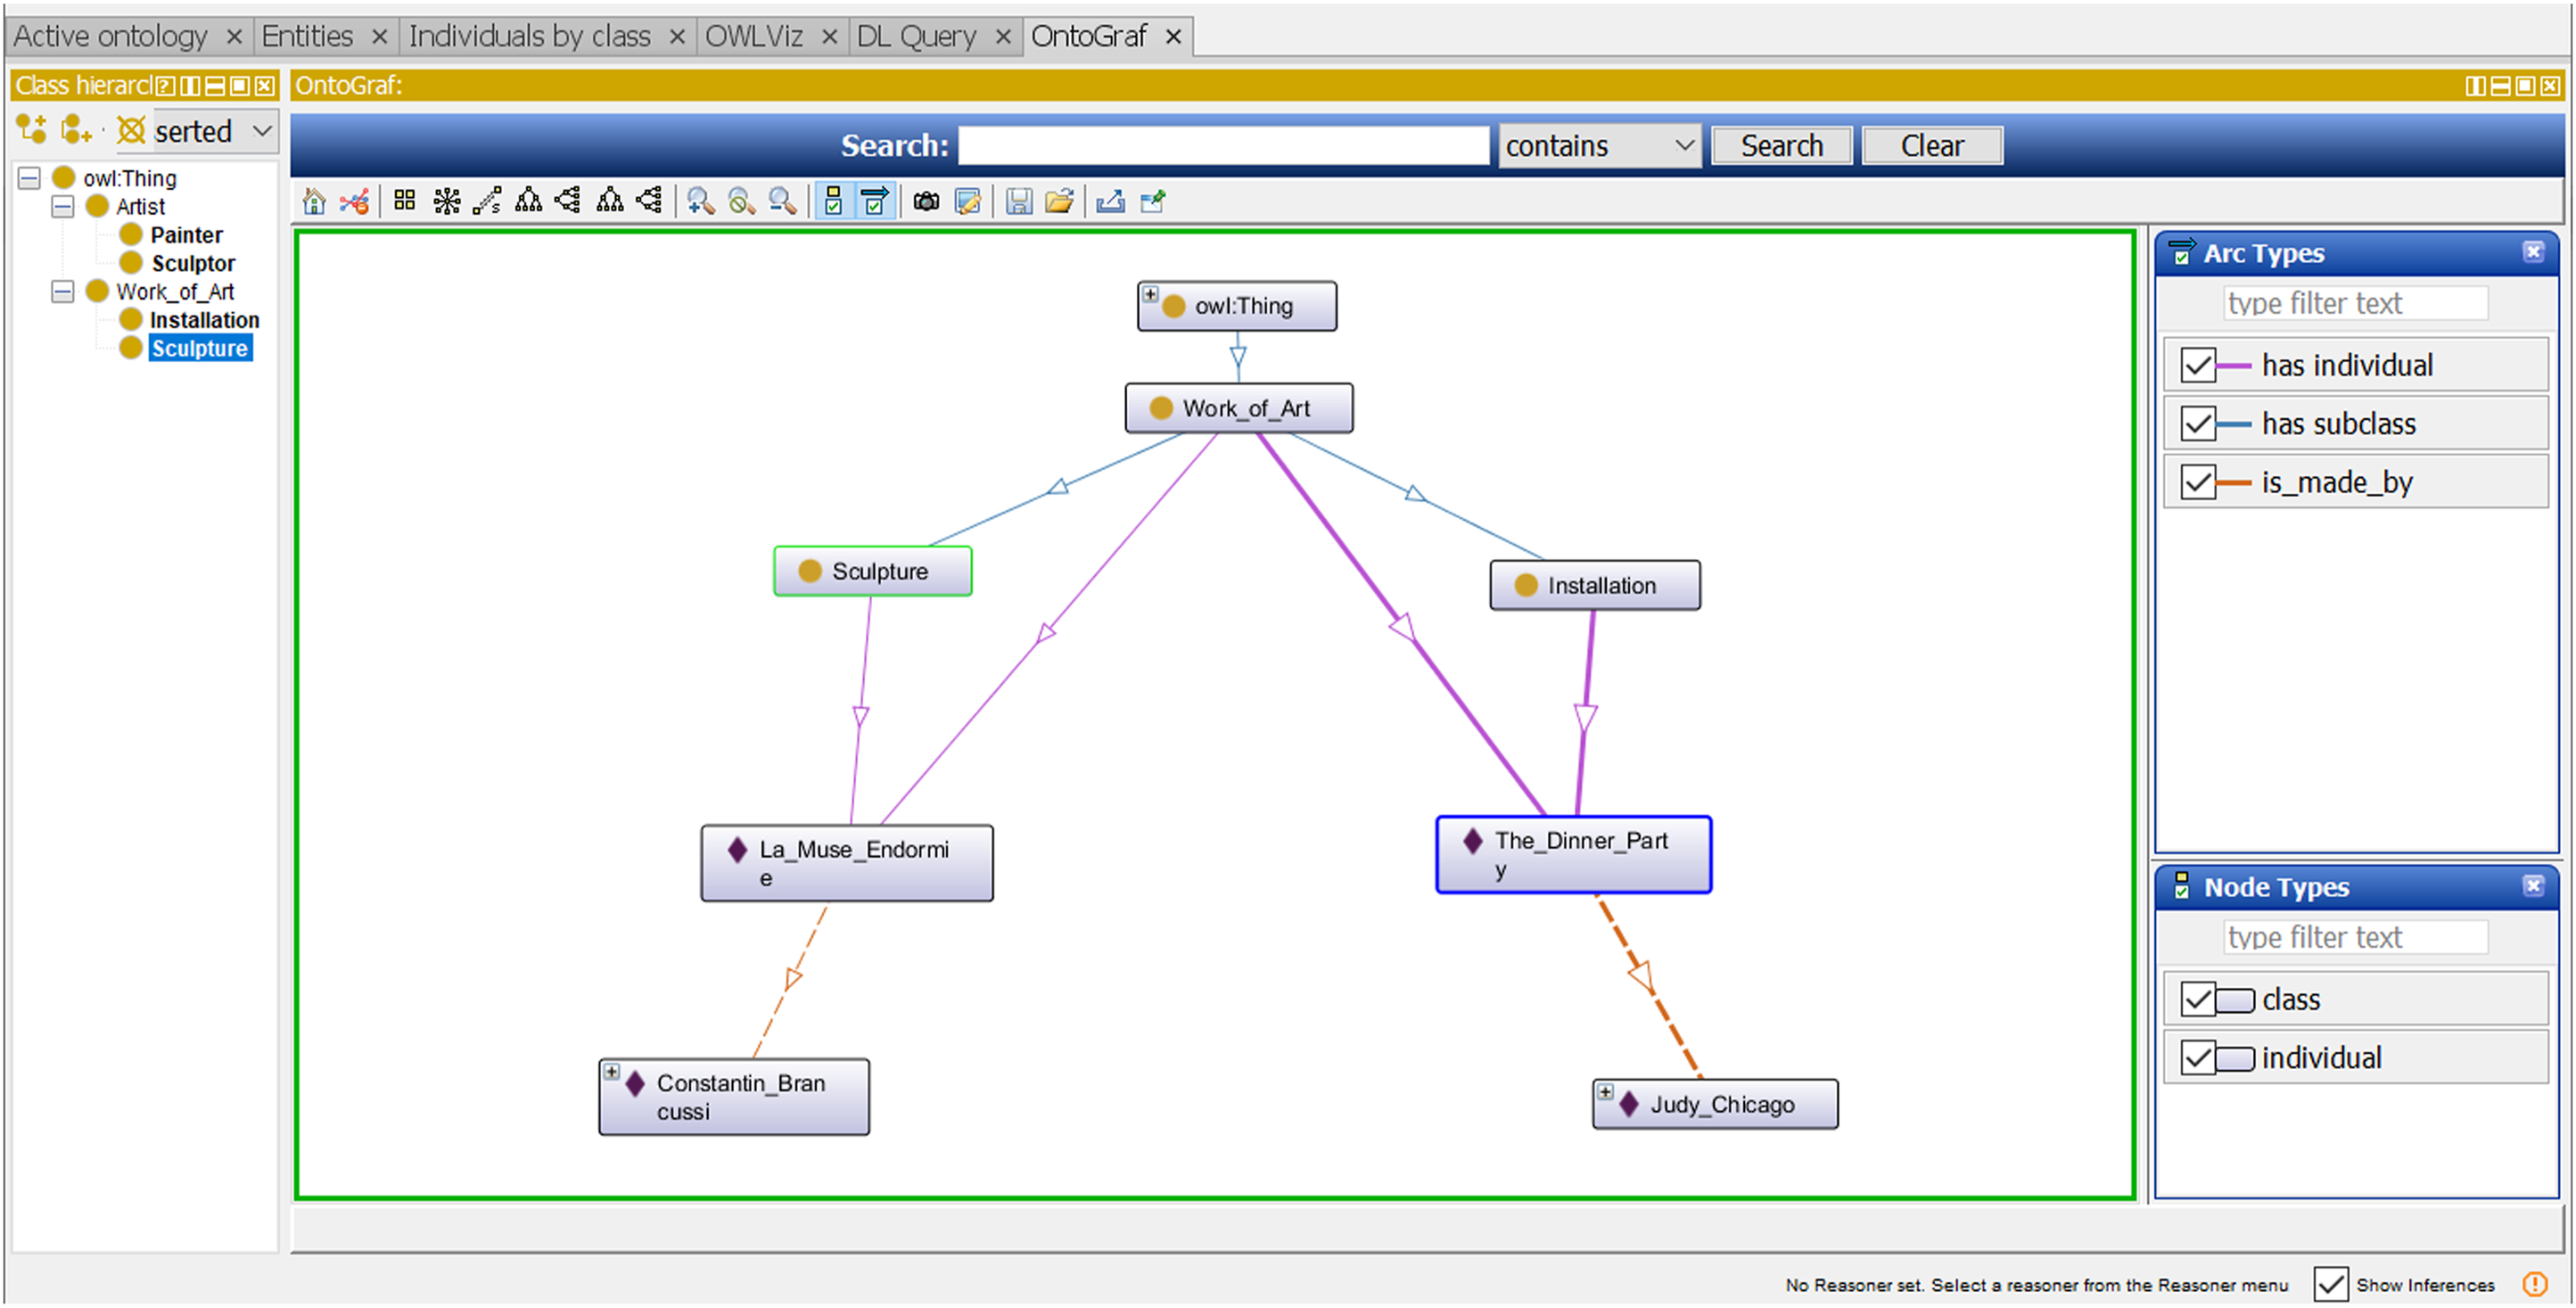
A canon structured around artworks presents a different understanding of the relationships and the timeline. Artworks by the same artist might be part of separate art movements and historical periods. Having the students approach the canon on the level of the works instead of their creators provides them with new insights into the network of art historical relationships. As for the modeled artists, relevant aspects of their (cultural) identities and lives can be modeled as data properties, allowing a user of the ontology to make selections of the modeled artworks and artists based on aspects of the artists’ identity, such as gender, nationality, ethnicity etc. In this way a canon of for instance women could be lifted out of the larger data set and visualized separately or as part of a larger selection. Creating such ‘sub-canons’ can also help students gain insight into the role that identity plays in our perception of the canon.
As mentioned above, Barr’s diagram includes only a few names of individuals, representing most artists in the form of art movements. This reflects the rising importance of the Modern ‘isms’, as described by Hans Arp and El Lissitzky in Die Kunstismen (1925). Barr’s choice to use movements and leave out names of their members is a conscious one, as can be seen from the existence of preliminary versions of the diagram in which individual names had been included (Schmidt Burkhardt, 2000: 389-391). It is not lack of space that has prompted the author to simplify the narrative, but active design. Only seven individuals appear in the drawing, most notably the four ‘patriarchs’ of Modern art – Van Gogh, Gauguin, Cézanne and Seurat – described by Schmidt-Burkhardt “as a powerful generation of forefathers”, who “outshine their spiritual sons, since these appear only collectively” (2000: 388). The decision to include these artists separately indicates that Barr’s design is driven by interpretation as much as by facts.
While the static nature of Barr’s visualization forces him to make a choice, the ontological modelling of these same data allows students to model both movements and individual artists within these movements. Classes can be created for movements and individuals introduced as separate instances. In this way, artists can be related to movements through properties, such as “affiliated_with” or “member_of”, thereby also distinguishing between stylistic resemblance and active membership. They can, however, also exist on their own in the model, unattached to any movements, but still clearly present in the canon. Artists can be part of different movements in separate or even overlapping periods of time. Moreover, artworks themselves can be classified as belonging to movements, even without considering the involvement of the artist, important when visualizing the canon as a network of art instead of artists, as discussed above.
Constructing the syntax of the ontological model presents a range of didactic challenges for the students. In formulating and naming the relationships between classes, subclasses and instances, the students are made to realize the extent to which textbooks, survey courses and schematic representations are forced to simplify the art historical narrative. What does it mean when Frida Kahlo is discussed in a textbook as part of the section on Surrealism but has resisted a classification as such? How best to qualify the relationship between Van Gogh, not part of a movement himself, and the various groups of Expressionists who were influenced by him? In textbooks, movements become separated and artists are for the most part considered to belong to one specific movement. These groups seem consistent over time and the joining and leaving of particular members at different moments is largely ignored. The easy association of a movement with two or three of its most prominent members pushes other artists to the background, to be labelled as illustrating but not defining the movement.
In this simplified narrative of the rise and decline of isms, the focus is often on those artists who best fit the historical simplification. Artists who develop eclectic styles or refuse to be classified are more likely to be left out. This is of course a generalization and counter examples can be found – Frida Kahlo features in most textbooks and Odilon Redon is present in Barr’s diagram – but it takes considerable success to find oneself added as an individual to a canon structured around coherent and immutable isms. A mere extension of Barr’s diagram, akin to the strategy ‘Add women and stir’, does not resolve the structural assumptions but instead puts whole groups of artists, not representative of clear-cut stylistic movements, at a disadvantage.
A diagram of ambiguous arrows
In addition to translating the nodes in the diagram – into (sub)classes and instances – the arrows between the nodes need to be interpreted and translated. The ontology requires its users to define properties by naming them, forcing students to consider the different types of relationships brought together in the arrows of Barr’s diagram. This is an important exercise, since it is at this point that the representation becomes increasingly confusing. What is the exact meaning of the arrows? In its broadest definition, the symbol seems to signify ‘influence’, but the nature of this influence remains ambiguous and can quickly lead to heated debates when I discuss this with the students.
In studying art history, simplified narratives and diagrams provide a quick overview of the general timelines. Barr’s diagram helps students memorize the narrative of the represented period and it is undoubtedly this elegant simplicity of the drawing that has resulted in its overwhelming success. As Kostelanetz writes in his collection of alternative forms of representation from 1975 (5): “Though necessarily simplifying, a chart offers the compensating advantage of vividly documenting the entire picture - a concise image of the whole that reveals contrasts and connections that would not be apparent if spread over many pages of prose.” This is certainly true for Barr’s diagram and it is for this reason that it is still often used in teaching. There is, however, a danger in taking the syntax of the diagram for granted and skipping over the exact meanings of for instance the arrows. Translating this diagram with students helps ensure that they get the benefit of simplified representations, important in survey courses, while being aware of the dangers and biases inherently present in them.
The arrows in Barr’s chart are best translated to object properties in the ontology. These can connect instances to other instances or to (sub)classes, or can connect (sub)classes to each other. The arrows between artists and movements (e.g. between Van Gogh and Fauvism) and directly between movements (e.g. Futurism and Dadaism) can be translated in this way. In the ontology, the properties require names and this helps students realize that Barr’s simple arrows cover a complex range of relationships, many of which can be modelled separately with object properties. These properties can, moreover, be hierarchically structured, akin to the classes and subclasses discussed in the previous section. The general meaning of the arrows is often translated by the students as a property equivocally named ‘influenced_by’ or ‘related_to’. Subproperties are then created to specify particular relationships, such as ‘reacts_against’ or ‘takes_stylistic_elements_from’ or even ‘works_together_with’. Creating these subproperties as hierarchically belonging to the property ‘influenced_by’ ensures that all relationships modelled with subproperties are automatically modelled as ‘influenced_by’ as well. The resulting representation therefore functions on different levels of complexity and allows one to conceptually zoom in and out, from the general level of ‘influence’ to the most detailed level of specification.
In addition to this, multiple relationships can be modelled between nodes. This allows the students to break down a general notion of influence between two nodes into separate elements, such as the complex balance between taking inspiration from and actively resisting against, so typical of the Avant Garde movements. It also allows influence to move in both directions. Barr represents the development of isms as moving singularly in one direction; each new movement is a logical result of influence from prior movements and in turn will only influence movements which are yet to come. Diagrams modelling cause and effect are abundant in both the sciences and the humanities and in my experience, students often take Barr’s assumption of causality for granted. However, it ignores the fact that many artist groups worked simultaneously and influenced each other in a reciprocal way during the overlapping existence of their collaborations.
Together, the nodes and arrows produce a narrative, framed by the two dimensions of the diagram and accompanied by the catalogue text. Narrative and diagram are by no means neutral frameworks and rather than passively representing the art historical canon, they can be said to actively construct it. The dimensionality of the two methods plays an important role in this construction, by introducing expectations as well as limitations. In the next section we will turn our attention to this aspect.
The dimensions of narrative, diagram and ontology
In presenting the art historical canon to students through survey courses and textbooks, the timeline is often taken as the basic organizing structure and different sections discuss the linear narratives of different regions, resulting in multiple, overlapping art histories. When multiple narratives are told, this is usually done by presenting them one after the other. Events that take place in different parts of the world at the same time are therefore not easily woven together and are often discussed separately. Additionally, relations of influence that exist across fast time spans are hard to include in a linear overview.
The history of Helen Gardner’s influential textbook Art through the ages (1926), illustrates this difficult relationship between art history and narrative. In the third edition, from 1948, Gardner introduced a revolutionary novel ordering, in which timelines of different regions were not strictly separated but were almost entirely brought together in one overarching timeline (Jaffee, 2007: 213-215). In the section on Medieval art we find the header “European and Near Eastern Art” which brings together, amongst others, chapters on Early Christian and Byzantine art, Muhammadan Art, and Romanesque art. And in the section on Modern Art, the chapter about painting combines entries on European painting, Mexican painting, and South American and Caribbean painting. Moving away from the strict focus on the singular, chronological narratives of different regions meant that interactions and relationships between those regions could be foregrounded (Kader, 2000: 174). Despite the progressive nature of Gardner’s new approach, the next edition – published after her death – was heavily revised and brought back to its original ‘vertical’ structure. Subsequent editions have continued this framing (Jaffee, 2007: 219).
A potential danger of dividing art history into separate linear narratives for each of the regions, is the ease with which students can neglect entire continents and focus solely on art from Europe and the U.S. Our BA program uses the latest edition of Gardner’s textbook, but sadly many of the chapters on the Global South are hardly ever opened by our students. Alternatively, texts about the Global South can come to serve as mere context for the ‘main’ narrative, of art from the Global North. The 1962 version of Janson’s History of Art (546) made this hierarchy explicit:
“We have, accordingly, discussed in this book only those elements outside Europe and America that have contributed to the growth of the Western artistic tradition.”
Although written over half a century ago, this and similar textbooks continue to exert influence over the way we structure the art historical narrative.
To help bring timelines together into a coherent whole, many books and exhibition catalogues therefore use diagrams. These two-dimensional overviews present a combination of diachronic and synchronic connections, by adding a second dimension to the representation. Likewise, in Barr’s catalogue, the diagram illustrates a narrative that did not follow one clear timeline, but instead reflected the chaotic diversification of Modern art. In the words of Schmidt Burckhardt (2000: 393), “Barr’s train of modernism does not move on a single track, but on several parallel tracks.” What better way to visualize this divergence than by using a diagram, representing the different tracks in one compact, two-dimensional overview?
While the second dimension – along the horizontal axis – increases the model’s expressive power, its exact meaning is hard to deduce. In similar charts, which Barr produced for the exhibition Italian Masters (Barr, 1940: catalogue jacket), the horizontal axis indicated geographical space; the diagram Italian painting and sculpture, 1300-1800, for instance, moves from Venice and Northern Italy on the left to Florence and Central Italy in the middle, followed by Rome and, on the far right, Naples. Here, artists from different regions and time periods are seen to influence each other and a narrative can be traced that runs through both time and Italy’s geography. In Barr’s diagram of Modern art, however, no such geographical division can be found and the horizontal axis seems to represent a formalist gradient instead. On the far right we find movements with a strong analytical focus, interested foremost with space and volume, such as Cubism and Bauhaus. On the left, movements like Surrealism and Expressionism are concerned with inner psychology and expression. This division culminates in the categories non-geometrical and geometrical abstract art, suggesting that the horizontal axis represents the interaction between the two opposites.
Although the second dimension increases the complexity that can be modeled, it remains rather crude and confusing – the flow chart is not far removed from the textbook in its expressive power. The computer model, on the other hand, opens up possibilities beyond the restrictions of both the narrative and the diagram. It is not hampered by the limited dimensionality of these printed media. While both narrative and diagram focus predominantly on the linear unfolding – through time – of events and data, the computer model is truly rhizomatic and relies less on chronology and causality, although it can incorporate them. As such, it seems a promising medium to represent multiple, coexisting narratives simultaneously and without the (immediate) need for hierarchy.
The idiosyncrasies of the digital model, as well as its impact on our representations of the world, have led scholars like Lev Manovich and Ed Folsom to consider this the most recent in a string of dominant models of representation, the “new symbolic form of the computer age” (Manovich, 2001: 219). While Manovich sees narrative and database as “natural enemies” (2001: 225), other scholars take a more nuanced position. Katherine Hayles suggests that “[r]ather than natural enemies, narrative and database are more appropriately seen as natural symbionts” (2007: 1603). Digital models – ontologies in particular – are powerful tools when it comes to bringing large sets of data objects together in a structured network of relationships. They are better equipped to structure and manage continually growing and changing sets of data than the narrative.
The two forms of representation complement each other. Where narratives present us with a linear unfolding of events through time, emphasizing the temporal dimension, digital models like ontologies are structured first and foremost in a spatial dimension. A narrative can be created by lifting a set of instances out of a spatially organized model and ordering it in a linear, sequential way. It is this quality that makes the ontology (and the digital model in general) an interesting method for representing the art historical canon. A vast ontological dataset of artworks and artists, provided with context through data and object properties, can form the basis for the construction of diverse art histories and canons. Selections of small datasets from the same model can be clustered and visualized according to chronology, geography, formalism, societal factors, biographical details etcetera. Allowing students to experiment with this process brings home the importance of recognizing multiple art histories and canons.
The ontology’s freedom from chronological constraints is best illustrated with two examples of less traditional perspectives on art historical chronology, introduced by Robert Rosenblum (1975) and Georges Didi-Hubermann (2003). In Modern painting and the Northern tradition, Rosenblum proposes an “alternate reading of the history of modern art” (1975: 7), in which he draws connections between artists from 19th-century Romanticism and modern art of the 20th century. In traditional representations of art history, which foreground chronology, such a relationship would be hard to include. How, for instance, could it be modeled in Barr’s diagram without lengthening the vertical axis to such an extent as to render the whole diagram illegible? The ontology, on the other hand, has no difficulty in including a link between for instance Mark Rothko and Caspar David Friedrich (one of Rosenblum’s examples, 1975: 10). This is due to the fact that, unlike the diagram, the ontology can be constructed and used in a meaningful way without needing to be visualized. When looking up Mark Rothko in an ontology which includes Rosenblum’s theory, we will find the link to Friedrich listed along the properties.
Georges Didi-Huberman shows a similar interest in unconventional art histories and his theory on anachronism can be said to form a counterpart to Rosenblum. Both scholars look at comparisons between artworks so far removed in time that no direct connection can be argued to exist. While Rosenblum looks at the impact of old works on our understanding of modern art, Didi-Huberman looks at the way modern art shapes our understanding of older art, using works by Jackson Pollock and Fra Angelico as examples. A present-day understanding of the latter is influenced by knowledge of modern art in a way that the Renaissance artist could not have foreseen. While this influence is usually rejected as anachronistic, by the “historian with time phobia” (2003: 38), Didi-Huberman urges us to embrace it.
Again, a connection such as the one proposed by Didi-Huberman would be hard to include in a textbook or diagram. How to describe the impact of Pollock’s works on our art historical narrative in a chapter on the Italian Renaissance? Or how to clarify the difference between this modeled relationship and a relationship between Fra Angelico and Giotto, in a simplified visual diagram using arrows to indicate ‘influence’? The ontology allows one to model links in both chronological directions and to specify the nature of these connections in far greater detail. In Didi-Huberman’s example, the similarities between the works are entirely superficial and are indeed described by the author as a case of pseudomorphosis, a merely coincidental. Even this aspect of the relationship can be included in an ontological model, allowing a user to extract from the data set a canon based on visual similarities throughout art history.
Compared to the narrative and the database, the ontology stands apart in its ability to model data along multiple dimensions at the same time. As soon as they are constructed, the textbook and the diagram become fixed along one or two dimensions. The static narrative is presented to students to passively take up. The ontology, on the other hand, allows students to actively relate data instances to each other from multiple perspectives at the same time and to continuously add to and amend the data, the relationships and the modeled dimensions. The multiple art histories that can be modeled in this way emphasize the fact that there is no one universal and objective metanarrative of art history. When I teach my first-level survey course on the history of modern art it is hard to get away from a traditional, linear telling of this narrative without confusing the students; including a workshop in which they are asked to model and explore this narrative is a valuable addition to the course.
Conclusion
While diagrams and digital models may seem to merely represent the information they contain, they are in fact interpretations of this information. They are constructed as schematic visualizations of facts, but function equally as mind maps and visual theories. Alfred Barr’s diagram of Modern art illustrates this dual nature. The selective inclusion of artists and movements, as well as the structuring of these into the two ‘main streams’ in the chart convey a scientific, but teleological perspective on the development of Modern art. It is this semiotic complexity of the graph that prompts W.J.T. Mitchell to describe it as “a religious icon and yet a scientific graph; a figure of ancient, traditional privilege and yet an image of chemical processes and Darwinian selection; an emblem of complex variety reducible to binary polarities converging in a single origin” (1994: 232).
In all its complexity, it serves as an excellent case study for students of art history, examining the intricacies of the canon. Translating the chart into an ontological model forces the students to recognize and reconsider the various assumptions they accept whenever they study textbooks or attend survey courses on the history of art. Although I am uncertain about the usefulness of any models that may result from this process, the exercise of deconstructing and reconstructing this bastion of traditional art history has proven highly valuable. The hands-on approach allows the students to formulate questions and encounter biases on their own. The active learning experience complements the passive attendance of lectures on the same topic.
In discussing the various steps needed to translate Barr’s diagram, I have had to limit myself to the essentials. Working one’s way through the chart introduces a wide range of additional questions. What, for instance, to make of the external factors, such as the prominently placed, but enigmatic concept “Machine Esthetic” (Vere, 2010)? Is the positioning along the horizontal axis of these external factors meaningful, or merely practical? Or how to interpret the years mentioned with each movement? In addition to these questions concerning the graph, there is more to say about the expressive power of the ontology. Formulating queries allows the user to select unexpected subsets of art historical data. And using computer reasoning enables one to infer new knowledge from the dataset that has not been actively modeled, which in turn might help uncover unidentified biases.
The canon is a work in progress. Although it is continuously criticized and amended, it seems we cannot do without it. This is nothing new and a final solution to the problem of this troublesome construct is unlikely to present itself any time soon. The best we can do is to cultivate an awareness of its subjective and flexible nature. A series of letters exchanged in 1976, by Quentin Bell and Ernst Gombrich, describes our position. On July 30th, Bell wrote: “I think it boils down to this: what does one mean by a canon, and what does one do with it when one has it?” (Gombrich and Bell, 1976: 407).
To this Gombrich responded, in a letter from November 14th: ‘I do not regard my garden as a sacred and closed precinct. I often like to stroll beyond its fence, though when I feel I am losing my way, I am glad to return to my familiar grounds. I would not even consider the fence immovable. We can all go and test a post here and there, and even move it a little, if we find that it “gives”’ (Gombrich and Bell, 1976: 408-409).
Footnotes
Declaration of conflicting interests
The author(s) declared no potential conflicts of interest with respect to the research, authorship, and/or publication of this article.
Funding
The author(s) disclosed receipt of the following financial support for the research, authorship, and/or publication of this article: This work was conducted using the Protégé resource, which is supported by grant GM10331601 from the National Institute of General Medical Sciences of the United States National Institutes of Health.