
Abstract
Exploratory data analysis of high-dimensional datasets is a crucial task for which visual analytics can be especially useful. However, the ad hoc nature of exploratory analysis can also lead users to draw incorrect causal inferences. Previous studies have demonstrated this risk and shown that integrating counterfactual concepts within visual analytics systems can improve users’ understanding of visualized data. However, effectively leveraging counterfactual concepts can be challenging, with only bespoke implementations found in prior work. Moreover, it can require expertise in both counterfactual subset analysis and visualization to implement the functionalities practically. This paper aims to help address these challenges in two ways. First, we propose an operator-based conceptual model for the use of counterfactuals that is informed by prior work in visualization research. Second, we contribute the Co-op library, an open and extensible reference implementation of this model that can support the integration of counterfactual-based subset computation with visualization systems. To evaluate the effectiveness and generalizability of Co-op, the library was used to construct two different visual analytics systems each supporting a distinct user workflow. In addition, expert interviews were conducted with professional visual analytics researchers and engineers to gain more insights regarding how Co-op could be leveraged. Finally, informed in part by these evaluation results, we distil a set of key design implications for effectively leveraging counterfactuals in future visualization systems.
Introduction
Visual analytics systems have had a significant impact across numerous application domains, ranging from healthcare 1 to event sequence analysis 2 to decision-making. 3 Building on the rich history of visualization and exploratory data analysis,4,5 a primary goal of many visual analytics systems is the exploration of data to facilitate pattern discovery and generate new insights. Such systems aim to enable users to quickly generate new views of data and to explore the relationships between variables in ad hoc ways. This can result in many different visualizations of various data subsets, each quickly created as part of the exploratory analysis process.6–8 Users view these visual depictions in an attempt to identify and interpret meaningful signals within the data. This last step can be challenging, however, as it can be difficult to distinguish between visual patterns that are consequential for a given task from those that might result only from noise or spurious correlations.
This challenge becomes even more difficult with the increasing complexity of large-scale datasets and visual designs which can make it even more difficult for users to properly comprehend and interpret the views created within visualizations and visual analytics systems.9–11 Substantial efforts from visualization researchers have thus been made to find new approaches that can aid people in better understanding data and avoiding false findings.12,13 These efforts include research that has studied how people draw potentially unsupported causal conclusions about visualized data relationships, along with proposed methods to mitigate this effect.2,14 Despite these efforts, however, the creation of visualization tools that can support the reliable identification of causal relationships remains a significant and critical challenge. 15
This challenge is closely related to the topic of causal inference as studied within the statistics community. One core theory in this area of statistics is counterfactual reasoning, 16 an approach to thinking about causation from the perspective of considering hypothetical scenarios (i.e. counterfactual scenarios) in which alternative conditions that differ from an original observation were to have occurred. For example, an analysis of data related to students’ academic performance without adequate sleep might consider the counterfactual scenario in which similar students had in fact slept the fully recommended amount of time. This approach provides the conceptual basis for analysts to reason about causal relationships between factors by isolating and examining “what-if” conditions for specific variables.
Counterfactual approaches have been more broadly adopted beyond the statistics community in recent years as data-driven applications have become more ubiquitous. One such domain is the burgeoning machine learning community, which has demonstrated several useful applications of counterfactual concepts including model fairness 17 and evaluations. 18
Within the visualization community, recent studies have assessed the impact of visualization on the quality of causal inferences14,19 and shown that integrating counterfactuals with visualizations and visual analytics systems can improve users’ understanding of causal relationships and overall data interpretation.6,20–22 These approaches have shown great promise in studies of users’ analytical behavior. However, they have depended upon bespoke implementations and proof-of-concept prototypes that make wider adoption of these techniques more difficult. 23 Specifically, adopting counterfactual techniques is reliant on developers to design the data model, workflows, and algorithmic modules required to integrate these concepts within an exploratory visualization environment. 23
Motivated by lessons learned from prior studies of counterfactual visualizations such as CoFact, 6 this paper derives a set of general design motivations and introduces a formal model of counterfactual operators. This model is designed to provide a deeper conceptual foundation for the use of counterfactual reasoning via subset computations within the context of visualization and visual analytics. At the core of this approach is a data subset-based mathematical computation model and a classification of counterfactual operators that reflect a range of key concepts important to the use of counterfactuals within visualization systems.6,22 These operators transform or derive values from the underlying sets in various ways which, when used in combination, can support a range of counterfactual-based visualization workflows. This generalized approach to a counterfactual-based subset computation model can be leveraged by a range of visualization designs even beyond those from the prior work that informed its design.
As an instantiation of the proposed model, this paper also presents the Co-op library. Co-op implements the core counterfactual operators and corresponding set-based data structures proposed in our model. This library enables accelerated development of new counterfactual-based visualizations, and provides an extensible framework via which developers can apply and extend the core set of operators introduced in this paper. With Co-op, developers can easily design and implement visualizations integrating counterfactual subsets.
The effectiveness and versatility of Co-op is demonstrated through the development of two visualization systems, along with expert interviews. The first system is a re-implementation of the CoFact system 6 created using Co-op operators in place of the system’s original computational methods. This workflow of CoFact, however, only uses a portion of the capabilities offered by the Co-op library. A second novel exploratory visual analysis system, CoExplorer, was created by utilizing a wider range of Co-op’s functionality to facilitate a new exploratory workflow incorporating counterfactual visualization that has not been reported in prior work. Further, we conducted an interview with six visual analytics researchers and professional engineers. They provided valuable feedback on the design goals, Co-op model, as well as potential benefits and drawbacks of practical aspects of the library.
Together, these two systems—developed with the same Co-op library at their core—and the expert interview help demonstrate the versatility of the counterfactual operator model. They also showcase the utility of the Co-op library itself as a tool for creating a diverse range of counterfactual visualizations that provide a variety of interactive functions and support various data types.
Finally, this paper offers general guidance on the effective usage of Co-op. This guidance distils key design implications that can aid researchers and practitioners in the visualization community in developing improved counterfactual-based visual analytics systems.
Related work
The counterfactual operators model introduced in this paper builds on prior research developed in several areas of related work. This includes foundational work that has developed the theory of counterfactual reasoning to support causal inference, causal inference visualizations, and how mathematical models can contribute to visualization.
Counterfactuals in causal inference
Causal inference techniques aim to support the understanding of relationships of cause and effect between factors in a system. Pearl 16 established a three-level causal inference hierarchy that describes progressively more powerful – and more difficult to attain – levels of understanding: association, intervention, and counterfactual.
Within this hierarchy each level builds upon the previous, with counterfactuals (providing the highest level of evidence for causation) as the apex. Counterfactuals enable the exploration of “what if” scenarios given changes to variables, and reasoning about “why” changes in the expected outcomes occur in response. In this way, counterfactuals offer a window to imagine hypothetical situations that did not necessarily occur in reality.
Take, for instance, a students poor performance on assessments after a sleepless night. A counterfactual analysis might probe scenarios where the student had adequate sleep, helping examine if lack of sleep is indeed a causal factor in poor assessment performance. There are many methods for estimating and computing counterfactuals in causal modeling such as instrumental variables, 24 machine learning approaches, 25 and matching methods.26–28 For a more comprehensive overview of counterfactual-based causal inference, we refer the reader to Glymour et al. 29
Counterfactual analyses, through the identification and/or simulation of unobserved scenarios, enhance our exploration of how certain factors may influence outcomes, enabling the examination of possible causal links, including those that were not directly observed within the data.
Visualization for causal inference
Understanding causal relations from complex data has long been an important goal for the visual analysis community. 30 Counterfactuals are emerging as a promising approach toward achieving this analytical need. 23
Past efforts have often centered around the use of graphical causal models, for example, domain knowledge-enhanced visual exploration,31,32 algorithm interpretation, 33 and DAG-based causal representation. 34 Visualizations using graphical models have been designed for specific application scenarios, such as supporting decision-making workflows, 35 urban time series exploration, 36 and event sequence analysis. 2
Most relevant, Kaul et al. 6 introduced CoFact, the first use of counterfactuals in the context of general-purpose exploratory visual analysis scenarios with high-dimensional datasets. It includes a filter-constraint-based counterfactual computation method to dynamically create ad hoc comparator groups for improved user inference of causal relationships. Wang et al. 22 explored the use of counterfactuals in static visualizations and found that it helped users better infer relationships in datasets. These studies demonstrate the utility of visualizing counterfactuals, but have limited flexibility to extend beyond their proposed application scenarios and make no attempt to define a more generalizable framework that could enable the broader adoption of this type of approach. 23
Inspired by these early steps, this paper proposes a formal operator-based model that provides a generalized approach to counterfactual computations that can support a unified approach to a wide range of visual analysis system designs.
Mathematical computation models in visualization
Mathematical computation models play a crucial role in enhancing the understanding and effectiveness of visualizations. 37 Widely-employed mathematical models in visualizations including discrete mathematics, such as network centrality measures38,39 and graph-theoretic measures,40,41 and statistical methods, such as dimensionality reduction42,43 and Bayesian modeling.44,45 Further, mathematical models have been applied to describe general visualization frameworks. For example, concepts and measurements from information theory such as entropy can be employed to qualify visual information 46 algebraic mathematical structures can help characterize data and encodings in visualization design, 47 and visualization tasks can be generalized into computational operations and pipelines. 48 By leveraging mathematical concepts, these models provide generalizable approaches based on theoretical foundations that can offer easier computation of data characteristics and enable more effective representations in visualizations. In a similar manner, our operator-based conceptual model and reference implementation are designed to enable more efficient and effective counterfactual-based visualization.
Counterfactual subset
The basic process of counterfactual-based analysis is built upon a foundation of sets, set manipulation, and set comparison. This section introduces core set-related concepts and essential terminology that form the basis for the design of the Co-op model described later in this paper.
Data subset selection
In high-dimensional datasets, processing or visualizing the entire dataset can be challenging, and generating data subsets becomes crucial to provide users with at-a-glance information. 49 Similarly, data subset selection methods are widely employed in various machine learning tasks, including enhancing model robustness 50 and reducing the size of training data. 51 Meanwhile, in exploratory data analysis, analysts often manually create subsets by filtering data based on specific drill-down choices. 52 For instance, assuming a user chooses a constraint such as brand = Ford in a car model dataset, a subset can be created and visualized by filtering all data points that correspond to Ford cars.
As the usage scenarios above highlight, the subset selection process is typically used to identify a smaller, more focused, subset of data from a larger data collection. The selection criteria for this process are often referred to as inclusion criteria, and we refer to the resulting subset (the data points that fit the inclusion criteria) as the included subset,
Critically, the selection process implicitly creates a second complementary subset that contains the remaining data points: the portion of the dataset that did not meet the inclusion criteria. We refer to this as the excluded subset,
Mathematically,

where

Throughout a user’s exploratory analysis session, the values for
Counterfactual subset filtering
In many visual analytics systems, data from
In exploratory analysis settings, the subset
For both manual exploration and semi-automated approaches, the choices for
Counterfactuals can provide a mechanism for more effectively contextualizing the correlations discovered in traditional exploratory analysis. As demonstrated in earlier work, comparing the data from
Mathematically,

where Similar (x, SINCL)denotes the computational process of determining if
We note that this definition partitions

The relationships between
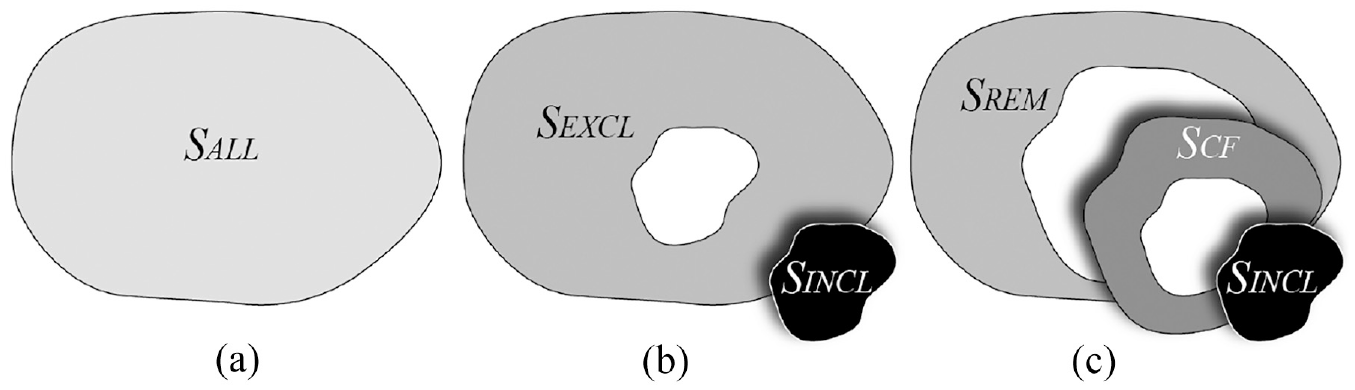
The subsets
This definition of
In this paper, instead of making a fool-hardy attempt to explicitly solve this problem by introducing “the right metric” for all cases, we define similarity flexibly based on an extensible set of measures that can describe the relations between data points and subsets. These can then be used individually or in combination to express more sophisticated concepts of similarity as appropriate for specific scenarios.
Design motivation
To highlight the various ways in which visualization developers can leverage counterfactual reasoning, we introduce a series of usage scenarios and discuss the key design considerations that those scenarios raise. We then outline a set of design goals for our work based on those considerations.
Usage scenarios
To help illustrate the wide variety of ways in which counterfactuals can be useful within the context of visualization, we describe four different usage scenarios. For each scenario, a number of key design considerations drawn from previous work are highlighted in
Algorithm Explanation with Visual Analytic Effective graphical inference is an important consideration for the design of explanatory visualizations as it is crucial that such systems help users draw valid conclusions from their data exploration and analytical focus.10,62 In model explanation, which is the most widely applied counterfactual usage scenario for model developers, counterfactuals have been incorporated with visual analytics systems to provide improved graphical inference.20,21,63,64 These analytic systems leverage counterfactuals to provide intuitive explanations for model decisions by creating synthetic or modified data points that demonstrate how small alterations in input features affect a model’s predictions, enabling users to better understand the inner workings of machine learning models, including which features had the most influence on a specific prediction.
63
Therefore, such applications require counterfactual computation to exhibiting the following: (i)
Visual Data Splitting and Cleaning For developers, data splitting and cleaning are crucial in evaluating and improving the performance of machine learning and statistics models.
65
Moreover, previous research has found that visualization can provide benefits during this process.
66
This task requires examining the entirety of, random portions of, or specific data samples from a dataset, and selecting points of interest (i.e. the
Guided Exploratory Data Analysis Existing studies suggest that counterfactual information can help people reason about data within visual analytics systems.6,20,21 However, relatively little work has focused on the use of counterfactuals as the basis for offering guidance to users performing exploratory data analysis. For example, counterfactual information could serve as an artificial agent
3
to inform users’ exploration strategy and help support decision-making. By providing a unified framework for generating counterfactual scenarios, a counterfactual computation model could reduce the development requirements in such systems. It would also help developers easily integrate counterfactual reasoning into their existing visualization systems without requiring extensive domain knowledge. Specifically, the system should be able to support (i)
Visualization Recommendation Counterfactuals have been used within NLP algorithms
18
and recommender systems,
68
to improve explainability and model performance. However, existing visualization recommendation algorithms, have given limited attention to the counterfactual approach. For example, prior research has employed existing design theories,
69
behavioral models,
70
or content-based insights
71
as the basis for recommendations. Counterfactuals could be useful to help find causal relations between different data variables,6,16 and therefore visualizations revealing these relations. A counterfactual computation model could lower the barrier for using counterfactuals within such visualization recommendation systems, and should support: (i)
Design goals
Based in part on the considerations introduced in the above usage scenarios, we derived a set of practical design goals to help shape the design of the operator-based counterfactual model presented in The Co-op Model. These include efficiency, transparency, comprehensibility, flexibility, and compatibility.
At the same time, the motivation to follow an operator-based approach in the first place is informed by previous studies47,48,72 which demonstrate the benefits of mathematical and algebraic frameworks for efficiently representing complex and diverse concepts in a formal way that can be translated to practical implementations for developers. The operator-based model that we propose provides a unified way of representing a diverse set of operators and measures that can support core design considerations such as
Efficiency: The proposed model should be scalable and efficient to handle large and complex datasets.
73
It supports the consideration of
Transparency: The proposed model should be transparent and explainable to show the processes of underlying mechanisms,
74
that is, how counterfactual subsets are generated and why they are relevant or interesting. It is crucial to enable
Comprehensibility: The proposed model should be easy to understand and use by developers with different levels of expertise and background knowledge.
75
Good comprehensibility can benefit building
Flexibility: The proposed model should be generalizable and flexible enough to handle different types of data and visualization tasks.
76
High flexibility could be able to support
Compatibility: The proposed model should be compatible and interoperable with existing visualization tools and frameworks.
77
This is necessary for
The Co-op model
This section introduces Co-op, an operator-based model for counterfactuals that is designed for exploratory visual analytics workflows. Building upon the set-based concepts introduced in the previous section, Co-op formalizes the computational model for counterfactuals using two broad categories of algorithmic building blocks: measures and operators. Within the Co-op model, operators represent logical units that take one or more sets as input and return one or more sets as output. Measures, in contrast, represent functions which map input data points and/or sets to a scalar value. For some operators, measures can be provided as additional inputs to control how the operator performs. The model described in this section provides a formal framework for the general-purpose counterfactual software library described in Co-op as A Library. Table 1 summarizes all symbols and notations.
A summary of the notation used throughout this paper.
Measures
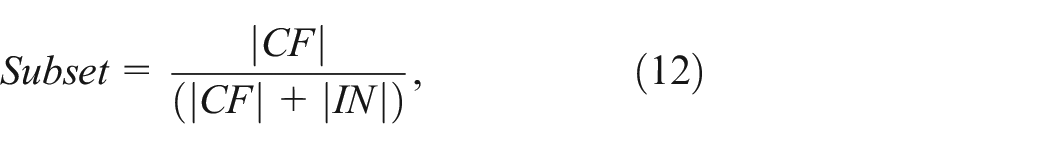
As described in sec-subsets, the identification of the counterfactual subset
The Co-op model supports these types of calculations with measures. At its most generic, a measure is a function of some input that resolves to a scalar value. Different types of measures can be used to quantify various properties of the input data, and measures can be broadly classified based on the types of input to which they can be applied. Co-op specifies four categories of measures including point-to-point, point-to-subset, subset-to-subset, and intra-subset. This section defines these measurement classes and provides examples of common measures in each category.
Point-to-Point Measures Point-to-point (P2P) measures describe relations between two individual data points. In this way, P2P measures represent the finest granularity of measurement in the Co-op model. Two specific variants of P2P measures are included in the model: point distance and weighted point distance.
Point distance: Similarity assessments are often framed as a distance calculation between pairs of points. Reflecting this basic framing of data similarity, the first P2P measure in Co-op is a point distance measure, noted as
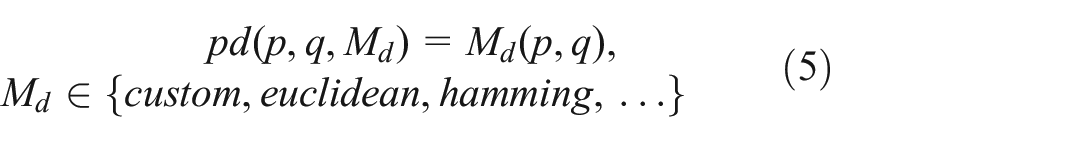
This basic
For example, the reference software implementation of the Co-op model is described in as A Library. In that Co-op software library, the default for
In the Co-op library,
Weighted point distance: In many real-world usage scenarios, the impact and significance of different dimensions and variables can vary widely. 61 Moreover, this variance can occur by application, analysis task/topic, or time.
For example, in a survey dataset about a large population of people, an analysis of financial status would likely place more importance on variables related to income when compared to variables about weight or height. In such a scenario, measurements of similarity would want to give more weight to financial variables when determining which people can serve as counterfactual examples. An analysis of health outcomes from the same data, however, would likely result in a very different notion of what it means to be similar.
Reflecting this notion of relative importance assigned to individual variables, the Weighted Point Distance
Point-to-Subset Measures Point-to-Subset (P2S) measures describe relations between a single data point
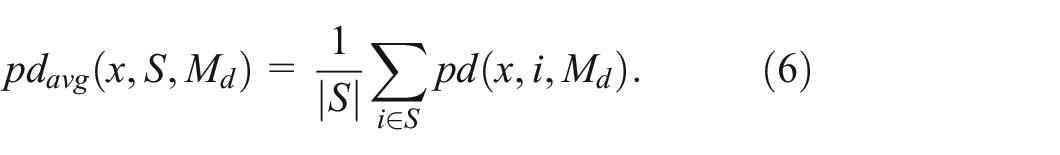
The overall assessment can utilize a variety of aggregation functions such as maximum, minimum, or average. Reflecting the most common usage scenario in the counterfactual workflow, measures defined below introduce two variants based on an average distance calculation.
Average distance: We extend the definition of point distance (see equation (5)) to fit the point-to-subset relation. The average distance
Weighted average distance: Similarly, the weighted average distance
Subset-to-Subset Measure Subset-to-Subset (S2S) measures describe relations between two sets of data points. For example, this type of measure can capture the overall similarity between two subsets of data (e.g.
Subset distance: The most basic S2S measure, subset distance, is an extension of the original point distance measure defined in equation (5). For two data subset
Connecting this formulation with prior work, this measure is mathematically equivalent to the set similarity measure adopted in the CoFact system 6 except for the normalization factor which makes the distance comparable across subsets of different sizes.
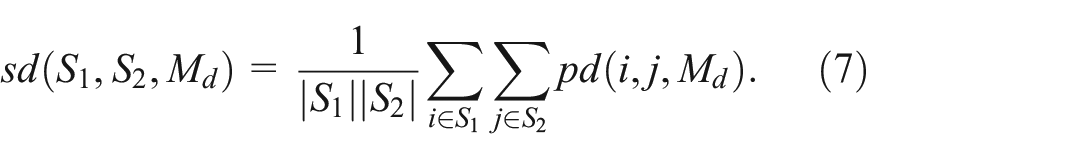
Entropy-based similarity: An alternative S2S similarity measure builds on the information theory concept of entropy, commonly used in many machine learning and statistical applications. Following the canonical entropy formulation proposed by Shannon,
82
we first define the entropy of a given subset
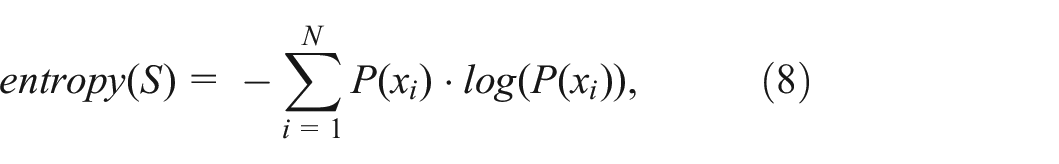
where
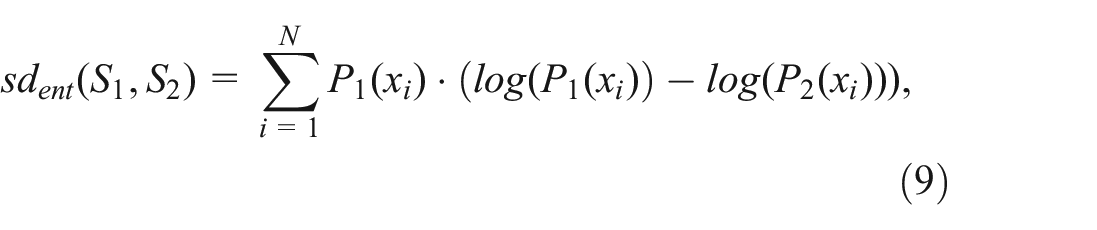
where
Weighted subset-to-subset similarity: As in the P2P and P2S measures, weighted versions of these measures enable the assignment of importance to different variables based on the application context. This leads to a weighted subset distance measure
Intra-Subset Measure Intra-Subset (IS) measures are the final category required for the counterfactual-based approach described in Counterfactual Subset. IS measures describe relations between points within a single subset.
Variance: The variance IS measure is constructed using the traditional variance statistic and captures the expected deviation from the mean for a typical data point
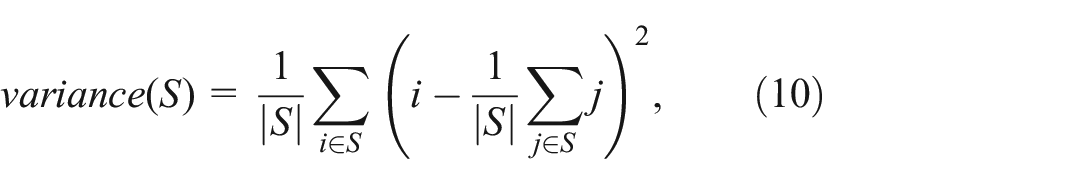

Entropy: Similar to the S2S measures, we further introduced the entropy IS measure. Compared to variance, entropy has an obvious advantage that its value is independent of the scale of data variables and is only associated with the probability of data points (as shown in equation (8)). Thus it could be easier to capture the impact of variables with smaller value ranges for computing counterfactual subsets. Just as entropy was used as the basis for an S2S measure in Subset-to-Subset Measure, a similar approach can be taken for assessing the disorder within a single set. In fact, the entropy equation introduced in equation (8) (first introduced as a building block for
Weighted variance and entropy: As with the other measure types, weighted versions of the IS measures can be defined to account for differing importance for each variable given a particular application context. This is reflected in weighted formulations of the variance and entropy measures:
Operators
Operators are logical units that take one or more sets as input and return one or more sets as output. Many operators include additional inputs beyond sets, such as measures, which help determine how the operator behaves. Prior mathematical models of visualizations exhibit operators with different capabilities, including operators that apply constraints to produce data subsets, 85 specific operators tailored to achieve the model’s core features, 86 and more generic dyadic set operators. 48 In a similar way, we use three general categories of operators that comprise the Co-op model: constraint operators, counterfactual operators, and functional operators.
Constraint Operators Constraint operators are used to manipulate the data points included within a given subset based on the inclusion or organizational criteria. These operators would typically be used in response to user interaction to manipulate
Filter: The most basic constraint operator, Filter, enables users to apply one or more constraints as inclusion criteria. The Filter operator produces as output a revised
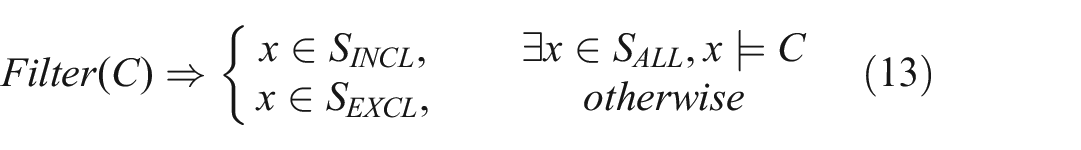

where
GroupBy: Similar to Filter, the GroupBy operator manipulates a set of data points based on criteria defined over one or more dimensions. However, rather than filtering to determine included and excluded subsets, the GroupBy operator turns a set into one or more subsets (i.e. groups) as determined by the criteria. Each of these can then be processed by further operators to identify per-group counterfactual subsets, for example. The
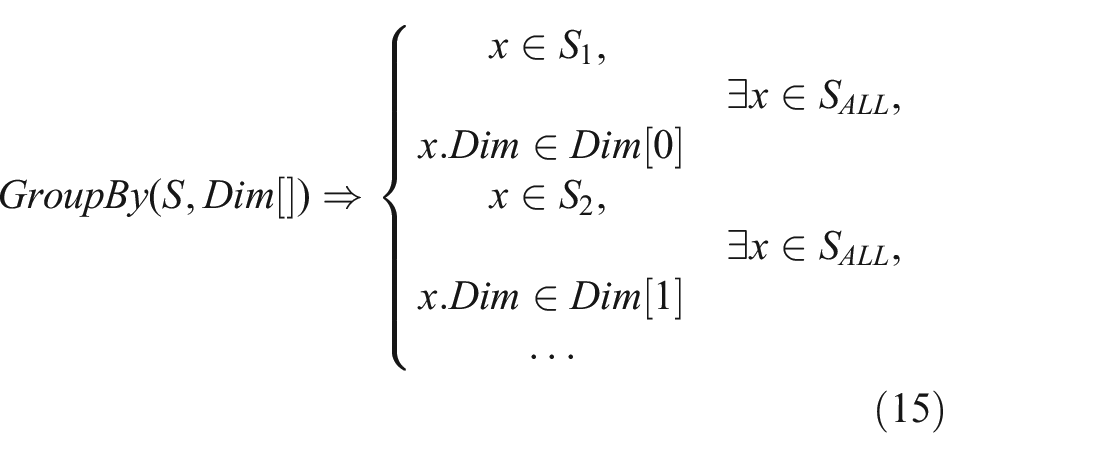
where
Counterfactual Operators Counterfactual operators are used to identify the points in an excluded subset that best serve as counterfactuals for a given included subset. More formally, counterfactual operators derive a
Counterfactual: The Counterfactual operator is the most critical in the Co-op model as it is responsible for the core feature of identifying the
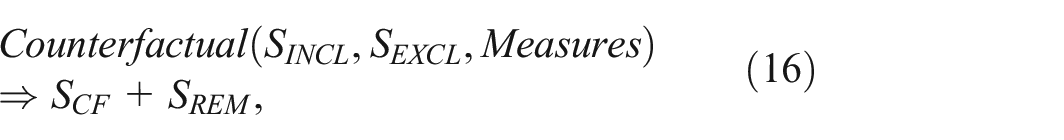

where
Resize: The Resize operator enables users to modify an existing counterfactual subset by increasing or decreasing the number of data points. For example, when a small
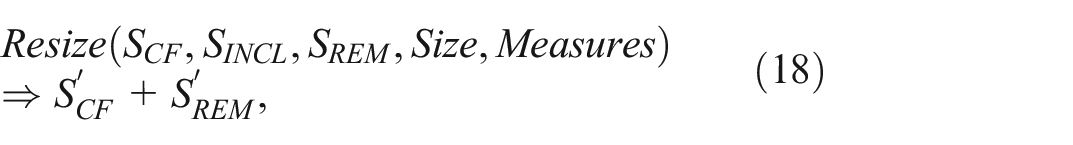
where
Functional Operators The final group of operators are functional operators. These are designed to support dyadic set operations 87 and provide basic set manipulation capabilities. Previous studies have demonstrated the effectiveness of dyadic operations in visual analytic system design, 48 and the concept of sets is a foundational element in the counterfactual workflow. The Co-op model therefore adopts the three most common dyadic set operations: union, intersection, and difference. Other set operators, such as complement or symmetric difference, can be constructed as a combination of these as needed.
Union: The Union of two subsets

where
Intersection: The Intersection of two subsets

Difference: The Difference of two subsets

Co-op as a library
The Co-op model of measures and operators provides a formal foundation for counterfactual-based workflows within visual analytics systems. Building on this model, we have developed a general-purpose software library for counterfactual-based exploratory visual analysis.
Implementation
Given the widespread use of Python for statistical computing and data science, the initial core version of the Co-op library has been implemented as a Python library and is available as open-source software. The library implements all measures and operators following algorithms described in The Co-op Model-operators and provides an extensible API that enables the easy integration of custom components such as special measures for a given application domain. The library builds on the widely-used NumPy 88 and SciPy 79 packages for measures, along with Pandas 89 operators. The default input data structure is the Pandas DataFrame. The Co-op library is organized around two packages: measure and operator. These packages are further organized as modules that reflect the groupings outlined in The Co-op Model (P2P, P2S, S2S, and IS measures; constraint, counterfactual, and functional operators). The source code is available at https://github.com/VACLab/Co-op.
Parameter settings
Defaults are provided for all measures and operators as suggested by a previous study 6 and other empirical guidance of measure computation. 4 See Choosing proper parameter settings for more detailed discussions and implications of parameter settings. However, developers can modify the default behaviors by implementing their own components. In particular, measures and distance functions are abstracted from the design as outlined in the model. This enables custom new parameters of measure or distance implementations which can be “plugged in” to the library to customize the behavior for a given application. When adding plugins, developers can first implement new measures in the measures package, which should output a condensed distance matrix, like pdist from SciPy, 79 and then simply input the desired new measure or measures into the Measures parameter of the Counterfactual operator from the operators package as introduced in Counterfactual Operators.
Demonstration
The Co-op model and corresponding library have several potential uses, as outlined in the previous section. However, the motivation for developing this approach and the primary usage scenario for the library is in support of counterfactual visualizations within the exploratory visual analysis process as a mechanism for improving users’ inferences from visualized data. To demonstrate how the Co-op model provides a flexible set of general-purpose capabilities, this section describes the workflows of two visual analytics systems built using the Co-op library, along with expert interviews regarding the library.
Re-implementing CoFact
As a first demonstration of utility, we used the Co-op library to re-implement an existing counterfactual-guided visual analytics system that had been created as a bespoke application. For this effort, we re-implemented CoFact 6 and its counterfactual-based workflow for improving the accuracy of users’ causal inferences from charts.
CoExplorer: using additional Co-op features
The re-implemented CoFact system, like the original design, uses only a small portion of Co-op’s expressive power. To help validate a broader range of features of the library, we developed a new exploratory visual analysis platform called CoExplorer which leverages source code from the Voyager system.8,90
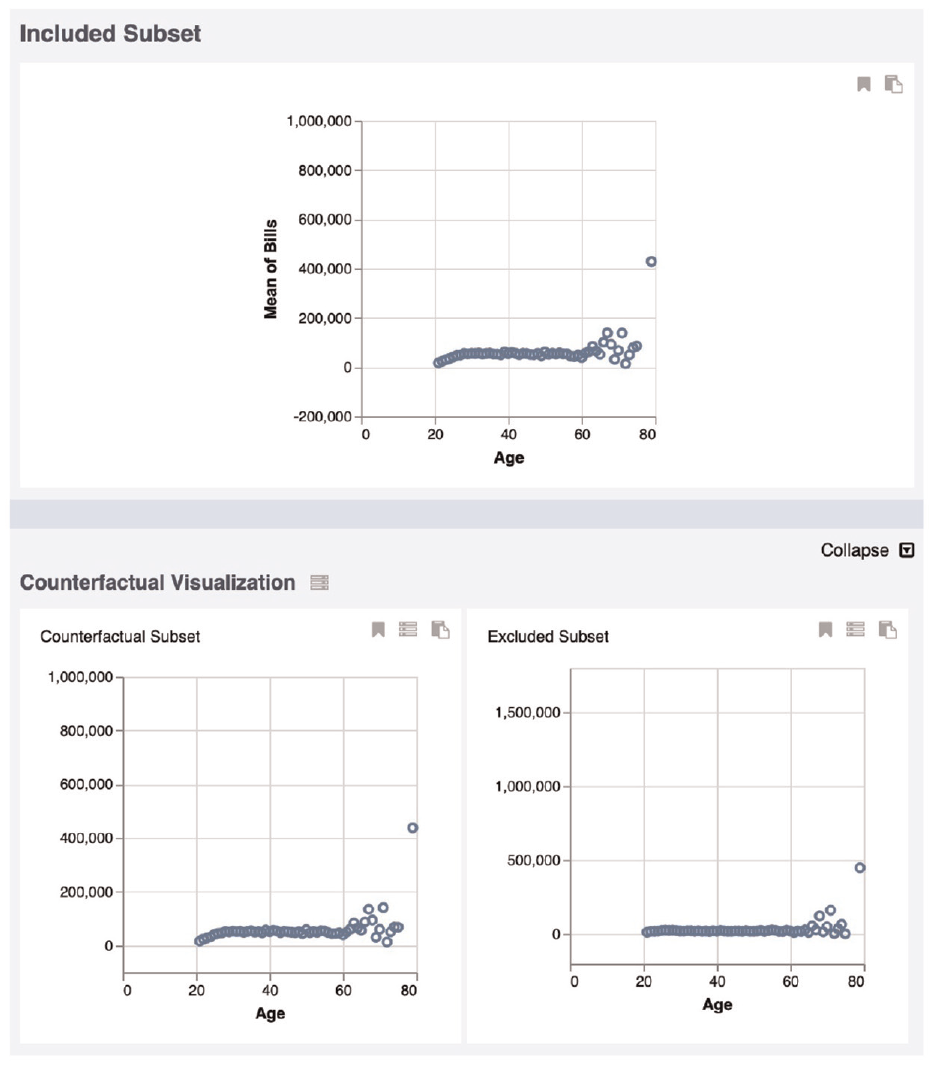
A screenshot from CoExplorer. The top panel shows
Performance analysis
We present the results of a preliminary performance analysis of the two prototype systems.
CoFact Analysis We evaluated the performance of computing counterfactuals between the original CoFact’s algorithm (from the CoFact source code) and the new Co-op-supported approach. We tested the system’s performance on 12 high-dimensional datasets applied in the previous study6, such as House Price and College Majors datasets. To normalize performance times across datasets of different sizes and complexity in our performance analysis, we computed the relative ratio of time required by the two systems (original CoFact, and our re-implementation). The relative ratio is defined as
Figure 3(a) illustrates the relative ratios for computation time when creating counterfactual subsets within the original CoFact and the Co-op-supported re-implementation of CoFact. The overall results show that the average relative ratio is about 0.79, which means Co-op achieves 20% better performance on average in computing counterfactuals compared to the original CoFact’s computation method.
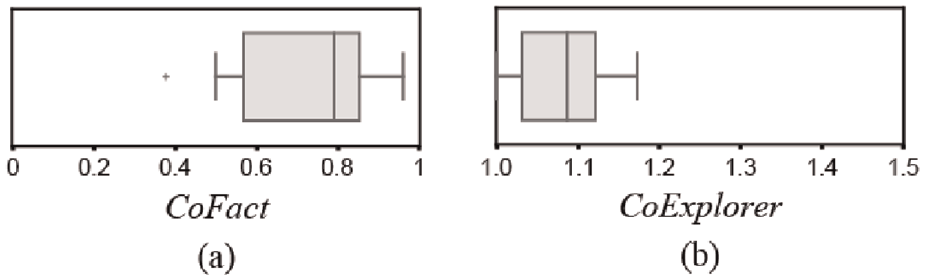
(a) When comparing computation times between Co-op and the previously published CoFact system, Co-op was faster as evidenced by relative ratios below one. (b) In the new CoExplorer prototype, comparing computation times with and without Co-op’s counterfactual computation enabled shows a relatively small performance overhead for that capability.
CoExplorer Analysis To better understand the time required to compute counterfactual subsets using Co-op, we compared the performance of CoExplorer in two modes: (a) with counterfactual subset calculations and (b) without. Using the same datasets used in the performance evaluation for CoFact (see section), we employed a similar relative ratio measure to evaluate the computational resources required in the two modes.
Figure 3(b) shows the resulting relative ratios across the 12 datasets with and without counterfactual computations. The data shows that including the counterfactual computations using Co-op introduces about 9% additional compute time on average, and no >20% for the tested datasets.
Limitations of Performance Analysis While the computational overhead in these examples shows a relatively modest overhead in compute time, however, since our demonstrations mainly focused on showing the functionality of Co-op, this preliminary-level analysis is inadequate to provide further insights into the source of the performance advantage or deficit. Therefore, it is not clear how these delays in responsiveness would impact users’ experience in analysis tasks and broader exploratory usage scenarios and whether the performance gain is due to which specific measures or operators in the model. In addition, the compute time is dependent on dataset size as well as available computational resources. A deeper performance analysis that more systematically studies these parameters is an important topic for future work.
Additionally, existing user interfaces provided advanced abilities such as layered or faceted views, 7 future work should focus on employing Co-op to those advanced functionalities.
Expert interviews
To demonstrate the usability of Co-op to visualization developers, we conducted 30-min qualitative interviews with six experts. These experts comprised three visualization researchers (denoted as R1–R3) and three data visualization engineers (denoted as E1–E3). R1 and R2 had prior experience in creating counterfactual visual analytics systems.
We first provided a brief introduction of counterfactual visualizations using examples from prior studies.6,22,92 Then we asked them to think about what their requirements would be to incorporate a counterfactual library into their own visualization systems. Further, we introduced and provided the details and workflows of our model and prototypes, and asked for their opinions on the benefits and limitations of this model, and to what extent it would meet their demands.
Here we revisit the set of design goals (presented in Design Goals) after considering the two prototype systems and experts’ responses.
Efficiency: All experts agreed that the library in Python would be able to provide higher computational capability through efficient Python statistical libraries in computational tasks. R1 and R2 specifically talked about the drawback in JavaScript that they needed to implement distance and subset computations manually when using counterfactuals in their systems. E1 appreciated that we primarily provided a Python library which is the most common for analysts. Our preliminary performance analyses (see Performance Analysis) also suggest that the computational efficiency of Co-op outperformed an existing algorithm 6 and added relatively little overhead to a non-counterfactual-based system. However, further studies of performance and issues of scale are still needed and the computational capacity at scale must be further studied to improve efficiency.
Transparency: R1 and R3 agreed that the mathematical formulations of the model and the open-source software for the library make the operation of the software quite transparent to developers and system designers. R2 said the JavaScript appendix would be able to help people without Python knowledge see how the model computes counterfactuals. In addition, E3 pointed out concerns about entropy which they felt was a concept that might not be general knowledge for many data visualization software engineers. This implies that the entropy measure may require additional effort to learn before it can be used effectively.
Comprehensibility: The operator-based model that underpins the Co-op library provides a relatively logical organization of the library’s capabilities and behaviors. All three engineers agreed that the provided examples make it easy to understand counterfactuals, and the definitions of measures and operators should be easy for people with an engineering background to understand. However, this paper did not focus on evaluating human cognition of counterfactual visualizations or developer understanding of the library’s API. Additional studies are required to help answer these questions.
Flexibility: The proposed prototypes demonstrate that Co-op can work with multiple kinds of data (e.g. categorical, continuous, time-series), visualization types, and exploratory workflows. However, E2 mentioned that presenting counterfactuals in spatial data may provide great value for causal inference as well, providing an example that viewing counterfactuals may help easily find the poison pump in John Snow’s broad street pump map of the 1854 cholera outbreak, 93 however Co-op currently does not directly support spatial data.
Compatibility: The CoExplorer prototype shows that Co-op can be integrated with pre-existing code from the Voyager system. 8 In addition, we used Co-op to implement the CoFact system. 6 These examples show that the library is interoperable in a practical way to provide capabilities for a variety of existing systems. R1 appreciated our reimplementation of CoFact which maintained the functionalities while significantly reducing the programing workload of creating counterfactual-supported visual systems. E3 mentioned that counterfactual computations in Co-op can be regarded as an advanced step of data filtering, thus the computation flow is obviously generalizable and compatible with most visual analytics systems.
Lowering Implementation Barriers The experts offered insights into how Co-op can help overcome or mitigate implementation barriers when creating new counterfactual-based visualization systems. First, providing robust implementations of core capabilities within an open-source library naturally makes technologies easier to use by eliminating the need for others to re-implement algorithms or design new computational models. For this reason, leveraging reliable libraries where they exist is a recognized best practice. 94 All experts agreed that Co-op can ease the implementation burden for developers who want to add counterfactual computations into visualizations, since they would not need to learn the details of complex counterfactual concepts or design a new calculation pipeline. Further, data visualization engineers E1-E3 concurred that the functions that comprise the API for Co-op are simple and easy to understand, even for junior-level developers. Specifically, R1, based on her own experience working without the benefits of Co-op, pointed out that she spent a long time determining parameters and measures when computing counterfactuals. In contrast, Co-op offers a range of choices of established measures that can typically provide good results and adhere to best practices, often using default parameters. However, R1 also mentioned that there is no magic solution for all situations. That is to say, to achieve the best comparison of counterfactual subsets, developers still need to understand and compare the parameters across different measures. This suggests that additional work to better characterize how subset distributions are impacted by different parameter settings could be a valuable addition in the future development of Co-op. Another concern was raised from R2 that Co-op did not provide a visualization configuration panel, which could make it more difficult for developers to easily compare the results of different parameters.
Discussion
The operator-based model and corresponding Co-op library provide application developers with a rich set of capabilities for developing counterfactual-based visual analytics systems. As shown by Demonstration, the library can be leveraged in different ways to support a variety of user experiences. This section presents some reflections regarding the design considerations outlined earlier in this paper, discusses implications for system developers, highlights key limitations, and identifies opportunities for future work.
General discussion
Co-op and visualization As discussed in the expert interviews, Co-op abstracts the complexities of implementing counterfactual computations, which in turn enables visualization developers to focus on design and user experience rather than low-level technical details. In this way Co-op can accelerate visualization development and ease the integration of counterfactual-based capabilities in a manner similar to other libraries designed to support the development of visualization software. Its open-source nature encourages collaboration and engagement with real-world use cases. This can help in soliciting feedback from the community to advance its development, including the contribution of new operators, sharing best practices, and collectively advancing its capabilities. 94
Choosing proper parameter settings To maintain the structures and provide proper framing of
Prior studies also suggest that counterfactual sets should have low variance to minimize bias.
96
Other related prior work focused on financial and commodity applications also suggests benefits from lower entropy.
97
We therefore suggest using measures of variance and entropy to validate the computed
Adding interactions with Co-op-supported systems Interaction plays a fundamental role in visualization and has the potential, when correctly designed, to improve the quality of analytics systems.
98
Researchers have defined a number of interaction types in information visualization.
98
Though the prototypes in this paper exercise only a small number of examples of possible interactions, CoExplorer can still provide more exploratory ability than CoFact by simply clicking on
Fitting with the user’s goals, data types, tasks, and preferences In real-world usage scenarios, varying tasks and user demands require different types of outputs and insights99,100 and result in different levels of comprehension. 11 A task-aware approach to data communication and exploratory visualization design is required to maximize the utility of a given system.15,35,99 Therefore, the prototype applications in this paper are simply exemplars of possible counterfactual workflows. Co-op should be used in the context of designers’ specific application objectives to best support user performance.
Limitations
Though the Co-op model and library can enable a wide range of counterfactual-based visualization usage scenarios, there remain some limitations that pose challenges. For instance, while the Co-op library provides default settings and we recommend certain best practices for creating
The current model also does not make any attempt to unify the various measures into a comprehensive framework which could be the basis for automation. Usage of Co-op as currently described therefore still requires manual configuration and design to yield the best results. Moreover, the prototypes presented as examples of Co-op-enabled applications both adopted existing visualization designs without any attempt to improve or optimize how the counterfactual information is presented to users. Therefore this paper does not make suggestions for how to best visualize counterfactuals in an intuitive and effective way.
Finally, while we preliminarily measured the performance of the prototypes, no analysis was done to study how the library works at scale. The performance of the system as datasets grow very large, along with the impacts of potentially slow computations on user experience, remains unstudied.
Future work
In future work, we aim to address a number of the limitations outlined above. First, we aim to extend Co-op to support spatial data and the potential for other additional data types. We also hope to conduct broader user studies to help build an evidence base for best practices when designing counterfactual-based visual analysis systems. This includes a better understanding of users’ ability to interpret counterfactual information and preferences for how that information is displayed.
Improving computational performance and scalability, as well as providing a richer set of measures and operators for specific contexts is also an important future direction. Related to this goal, we aim to expand and promote the usage of counterfactuals in a wider variety of visualization algorithms and designs, such as using counterfactuals to guide visualization recommendations and data subset selection in dashboard design. By expanding the variety of applications and domains in which these approaches are used, the community will more quickly overcome limitations and learn about best practices.
Conclusion
This paper presented an operator-based model to enable counterfactual-based subset computation in visual analysis. The model included a variety of measures and operators that combine to support a counterfactual workflow which has been shown to improve users’ inferences from visualized data. This model was instantiated within the Co-op library, an open-source Python library for bringing general counterfactual-based subset computation algorithms to exploratory visualization workflows. Co-op can be used by developers to easily incorporate counterfactual workflows into their visual analytics systems, and the library’s design enables developers to extend and customize its behavior to meet application needs. The general utility of the model was demonstrated through its use in two prototype systems with different workflows, including both a re-implementation of an existing system and a new exploratory one, and an interview for experts in visualization research and engineering. Informed by these experiences, the paper concluded with a discussion of implications on system design, limitations, and areas for future work.
Supplemental Material
sj-7z-1-ivi-10.1177_14738716241265120 – Supplemental material for A framework to improve causal inferences from visualizations using counterfactual operators
Supplemental material, sj-7z-1-ivi-10.1177_14738716241265120 for A framework to improve causal inferences from visualizations using counterfactual operators by Arran Zeyu Wang, David Borland and David Gotz in Information Visualization
Footnotes
Funding
The author(s) disclosed receipt of the following financial support for the research, authorship, and/or publication of this article: This work is supported in part by Award #2211845 from the National Science Foundation.
Supplemental material
Supplemental material for this article is available online.
References
Supplementary Material
Please find the following supplemental material available below.
For Open Access articles published under a Creative Commons License, all supplemental material carries the same license as the article it is associated with.
For non-Open Access articles published, all supplemental material carries a non-exclusive license, and permission requests for re-use of supplemental material or any part of supplemental material shall be sent directly to the copyright owner as specified in the copyright notice associated with the article.