
Abstract
How are the advantage relations between a set of agents playing a game organized and how do they reflect the structure of the game? In this paper, we illustrate ‘Principal Trade-off Analysis’ (PTA), a decomposition method that embeds games into a low-dimensional feature space. We argue that the embeddings are more revealing than previously demonstrated by developing an analogy to Principal Component Analysis (PCA). PTA represents an arbitrary two-player zero-sum game as linear combination of simple games via the projection of policy profiles into orthogonal 2D feature planes. We show that the feature planes represent unique strategic trade-offs and truncation of the sequence provides insightful model reduction and visualization. We demonstrate the validity of PTA on a quartet of games (Kuhn poker, RPS + 2, Blotto and Pokemon). In Kuhn poker, PTA clearly identifies the trade-off between bluffing and calling. In Blotto, PTA identifies game symmetries and specifies strategic trade-offs associated with distinct win conditions. These symmetries reveal limitations of PTA unaddressed in previous work. For Pokemon, PTA recovers clusters that naturally correspond to Pokemon types, correctly identifies the designed trade-off between those types, and discovers a rock-paper-scissor (RPS) cycle in the Pokemon generation type – all absent any specific information except game outcomes.
Keywords
Introduction
In recent years algorithms have achieved superhuman performance in a number of complex games such as Chess, Go, Shogi, Poker and Starcraft.1–4 Despite impressive game play, enhanced understanding of the game is typically only achieved by additional analysis of the algorithm’s play post facto. 5 Current work emphasizes the ‘policy problem’, developing strong agents, despite growing demand for a task theory which addresses the ‘problem problem’, that is, what games are worth study and play.6,7 A task theory requires a language that characterizes and categorizes games, namely, a toolset of measures and visualization techniques that evaluate and illustrate game structure. Summary visuals and measures are especially important for complex games where direct analysis is intractable. In this vein, tournaments are used to sample the game and to empirically evaluate agents. The empirical analysis of tournaments has a long history, in sports analytics,8,9 ecology and animal behaviour10,11 and biology.12,13 While the primary interest in these cases is typically in ranking agents/players, tournaments also reveal significant information about the nature of the underlying game. 14 This paper describes mathematical techniques for extracting useful information about the underlying game structure directly from tournament data. While these methods can be applied to the various contexts in which tournaments are already employed in machine learning (e.g. population based training), they open up a range of new research questions regarding the characterization of natural games, synthesis of artificial games (cf. Omidshafiei et al. 6 ), game approximation via simplified dynamics, and the strategic perturbation of games.
Note that our objectives are as empirical as they are game theoretic. Empirical game theory, the study of games from actual game play data (e.g. sports analytics), studies games as they are played by a particular population, rather than by an idealized player. Thus, empirical game theory has its own, valid, objectives beyond finding equilibria or optimal players. Exclusive focus on optima ignores the global structure of a game as it is experienced by the majority of participants. What decision dilemmas do they face? What game dynamics do they experience? What game space must they navigate in the process of optimization? How should they exploit a chosen opponent, population, or form teams? All of these questions are more easily addressed given a simplified global representation that isolates each important independent aspect of a game. PTA offers such a summary.
PTA represents structural characteristics of a tournament by a low dimensional embeddings that maps competitive relationships to embedded geometry. We review and expand on methods introduced by Balduzzi et al., 15 who proposed a series of maps that describe a sample tournament in terms of a sum of simple games, namely, disc games.
Our contribution follows. First, we compare PCA 16 to disc game embedding, and show that disc game embeddings inherit the key algebraic properties responsible for the success of PCA. Based on this analogy, we propose PTA as a general technique for visualizing data arising from competitive tasks or pairwise choice tasks. Indeed, while we focus on games for their charisma, any data set representing a skew-symmetric comparison of objects is amenable to PTA. Via a series of examples, we show that PTA provides a much richer framework for analysing trade-offs in games than previously demonstrated. Our examples exhibit a wide variety of strategic trade-offs that can be clearly visualized with PTA. Unlike existing work, we focus on the relation between embedding coordinates, which represent performance relations, and underlying agent attributes, to elucidate the principal trade-offs responsible for cyclic competition. Moreover, we consider the full information content of PTA by analysing multiple leading disc games and the decay in their importance. Important strategic trade-offs can arise in later disc games, so previous empirical work’s focus on the leading disc game is myopic. These examples also raise conceptual limitations not addressed in previous work, thus outline future directions for development.
Related work
Our work builds directly on Balduzzi et al., 15 which used the embedding approach to introduce a comprehensive agent evaluation scheme. Their scheme uses the real Schur form (PTA) in conjunction with the Hodge decomposition to overcome deficiencies in standard ranking models. 17 Our work also compliments efforts to explore cyclic structures in competitive systems,18,19 economics,20,21 and tangentially as multi-class classification problems.22,23 Cycles challenge traditional gradient methods and can slow training.6,24 Accordingly, highly cyclic games, such as iterated rock-paper-scissors, are useful as benchmark tasks for mulit-agent reinforcement learning. 25 Moreover, cyclic structures in games are often intricate and difficult to disentangle, particularly among intermediate competitors. Games of skill frequently exhibit this ‘spinning top geometry’. 26 By summarizing cyclic structures, PTA helps identify areas of the strategy space that cause difficulty during training, or should be targeted for diverse team design.27,28 Here, we show that PTA can identify fundamental trade-offs that summarize otherwise opaque cyclic structure. Trade-offs play an important role in decision tasks and evolutionary processes outside of games, so general tools that isolate and reify trade-offs are of generic utility.6,14 In that sense, our attempt to visualize game structure is in line with generic data visualization efforts, which aim to convert complicated data into elucidating graphics (cf. Garnelo et al. 28 and Healy 29 ).
Background
Functional form games
A two-player zero-sum functional form game, is defined by an attribute space
Disc games
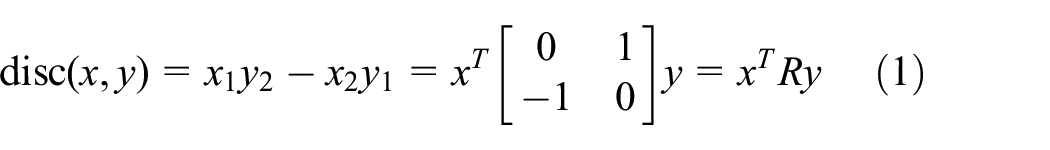
The cyclic component of a tournament can be visualized using a combination of simple cyclic games.15,27 The simplest cyclic functional form game is a disc game, which acts as a continuous analogue to rock-paper-scissors (RPS) in two-dimensional attribute spaces. The disc game evaluation function is the cross product between competitor’s embedded attributes,
where
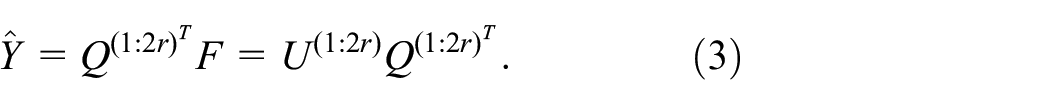
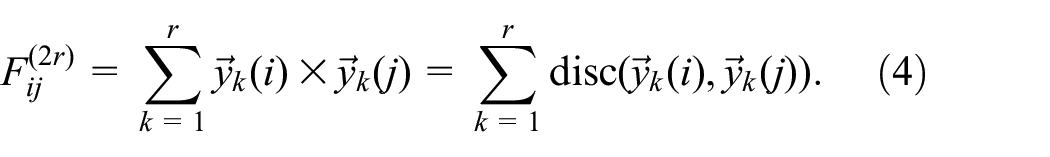
Any evaluation matrix can be represented with a sum of pointwise embeddings into a sequence of disc games. The necessary construction follows.
Principal trade-off analysis (PTA)
PTA decomposes an arbitrary performance matrix
Any real,
When

As in PCA, we consider a low-rank approximation of
and scale each pair of embedding coordinates by the associated eigenvalue so
A user interested in the transitive and cyclic components of
Note that the Schur decomposition is only unique up to rotation within each feature plane, since complex conjugate pairs of eigenvectors of
The evaluation
Thus, restricted to each embedding
This decomposition is useful for two reasons. First, it depends on a spectral decomposition of
Second, disc games encode performance in geometry. Given coordinates
Experiments
Here, we illustrate the graphical power of PTA via Kuhn poker, RPS + 2, Blotto, and Pokemon. All four exhibit interesting cyclic structures that are explained well by PTA. Kuhn is chosen to clearly illustrate the interpretation of each disc game as a trade-off, RPS + 2 to show that the disc games can encode more complex trade-offs through the embedded geometry, Blotto to illustrate potential limitations of PTA arising from symmetries as well as the elegance of the trade-off representation when decomposing interlocked cyclic structures, and Pokemon to illustrate the diversity of possible trade-offs that can be recovered via PTA. In each case, we emphasize the interpretation of the principal trade-off to show that PTA reveals diverse, fine-grained game structures based only on empirical game data.
Kuhn Poker
Kuhn poker is a simplified, two-player poker game played with an
The game tree for Kuhn poker is illustrated in Figure 1. Given a particular pair of hands, the game tree includes four decision points. After a call, both hands are revealed, and the player with the higher card wins. Using an
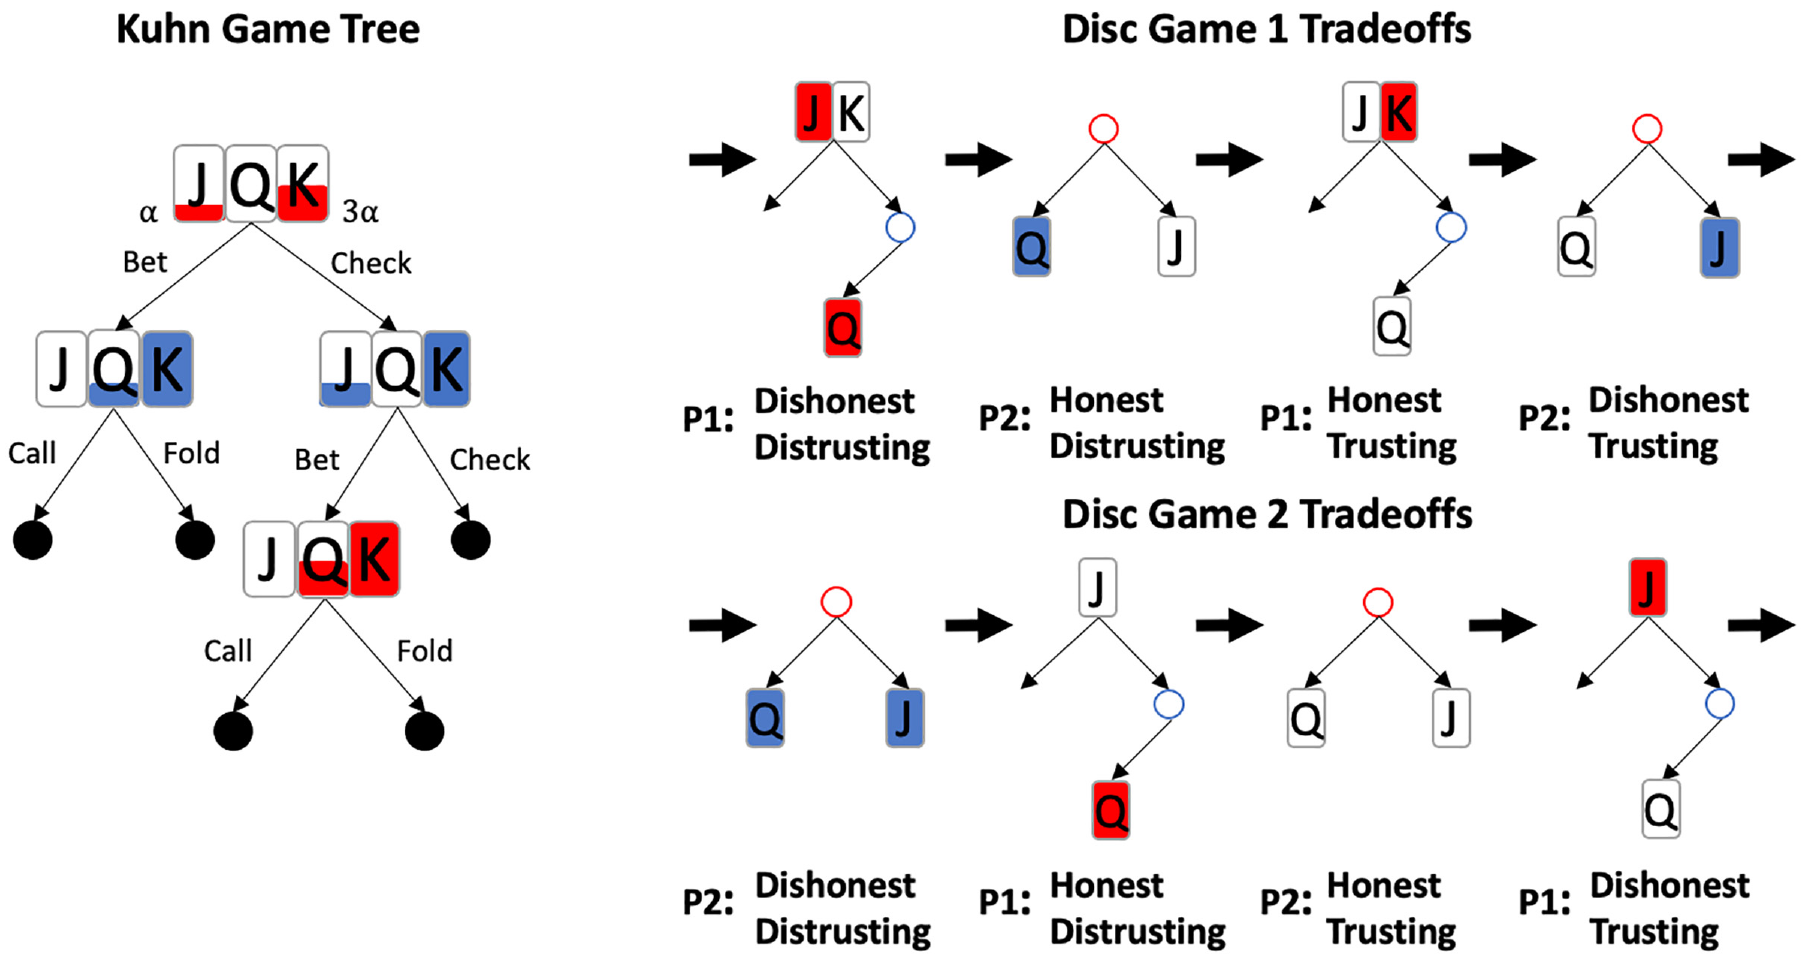
Left: The full 3 card Kuhn game tree. The height of each coloured bar in a card indicates the probability a player with that card takes the more aggressive action. The frequencies shown are a Nash equilibrium for the Bet/Call actions. For example, at the first node, a player holding a queen should always check. Black circles are leaf nodes. Right: The tradeoffs in each disc game come from a subset of the game tree. Arrows point in the direction of advantage. Strategies that lead to tradeoffs are given labels below each reduced tree.
Given two agents, we measure the advantage one possesses over the other as their expected winnings if they are equally likely to bet first or second. Since no information set ever appears twice along the same path through the game tree, and no player ever makes more than two decisions per game, the payout function is a cubic, multilinear, skew-symmetric polynomial in the policies.
The Nash Equilibrium policies (NE) for the three-card game are shown in Figure 1. Note that, at the NE, some decision probabilities are set to zero or one. These correspond to decisions for which only one action is rational. For example, it is never rational to fold when holding the strongest card or to call when holding the weakest. These decision probabilities lie at the boundary of the simplex of allowed policies and are subject to strong selection. We call the boundary containing the NE the rational boundary.
Restricted to the rational boundary, the performance function
Nevertheless, policies lying off the NE on the rational boundary may be exploited by other strategies on the rational boundary. For example, when trained under optimal self-play, policies on the rational boundary circulate about the NE. These dynamics are directed by the self-play gradient vector field,
These considerations recommend Kuhn poker for PTA. We aim to recover, and rank by importance, the trade-offs that arise on the rational boundary using PTA. Unlike extant work, we target visualization and strategic feature extraction.
To generate agents we used the Neural fictitious self-play (NFSP) algorithm2 implemented using the Open Spiel software package. 44 We used a simple feed-forward neural network with a single hidden layer of size 64 for both the policy and critic networks. We ran the algorithm until convergence, minimizing exploitability – the best your opponent could do if they knew your policy. Near the NE, the exploitability will tend towards 0. To extract a policy representation we compute the decision probabilities from the converged policy network.
Given the converged agent, we identify particular policies that lie on or very near to the boundary of the allowed policy space. If the corresponding component of the self-play gradient points outward against the boundary, then we treat that policy as constrained to the boundary. Then, to generate a relevant population, we sample an ensemble of random agents near the converged policy, constrained to the rational boundary. Next, we evaluate performance between all pairs of agents in the population and apply PTA to embed them.
To extract the underlying trade-offs, we seek an interpretable mapping between policies and embedding coordinates. Since 3 card Kuhn poker is bilinear once constrained to the rational boundary, the map from policy to embedding coordinates is linear. For larger deck sizes, the performance function can be approximated by a quadratic polynomial provided the sampled agents are sufficiently close to the converged agent. Then, as in the 3 card case, the realized embeddings are near to linear functions of the agent policies. 45
We recover that map by fitting the embedded agent coordinates to a linear function of their policies. The linear map into each disc game is a scaled projection onto a hyperplane in policy space. We identify the trade-offs by isolating the sparsest possible basis vectors for each hyperplane.
We repeated this numerical experiment for decks of sizes 3–13.
Even though the game tree grows quadratically in
Disc Game Importance in Kuhn Poker
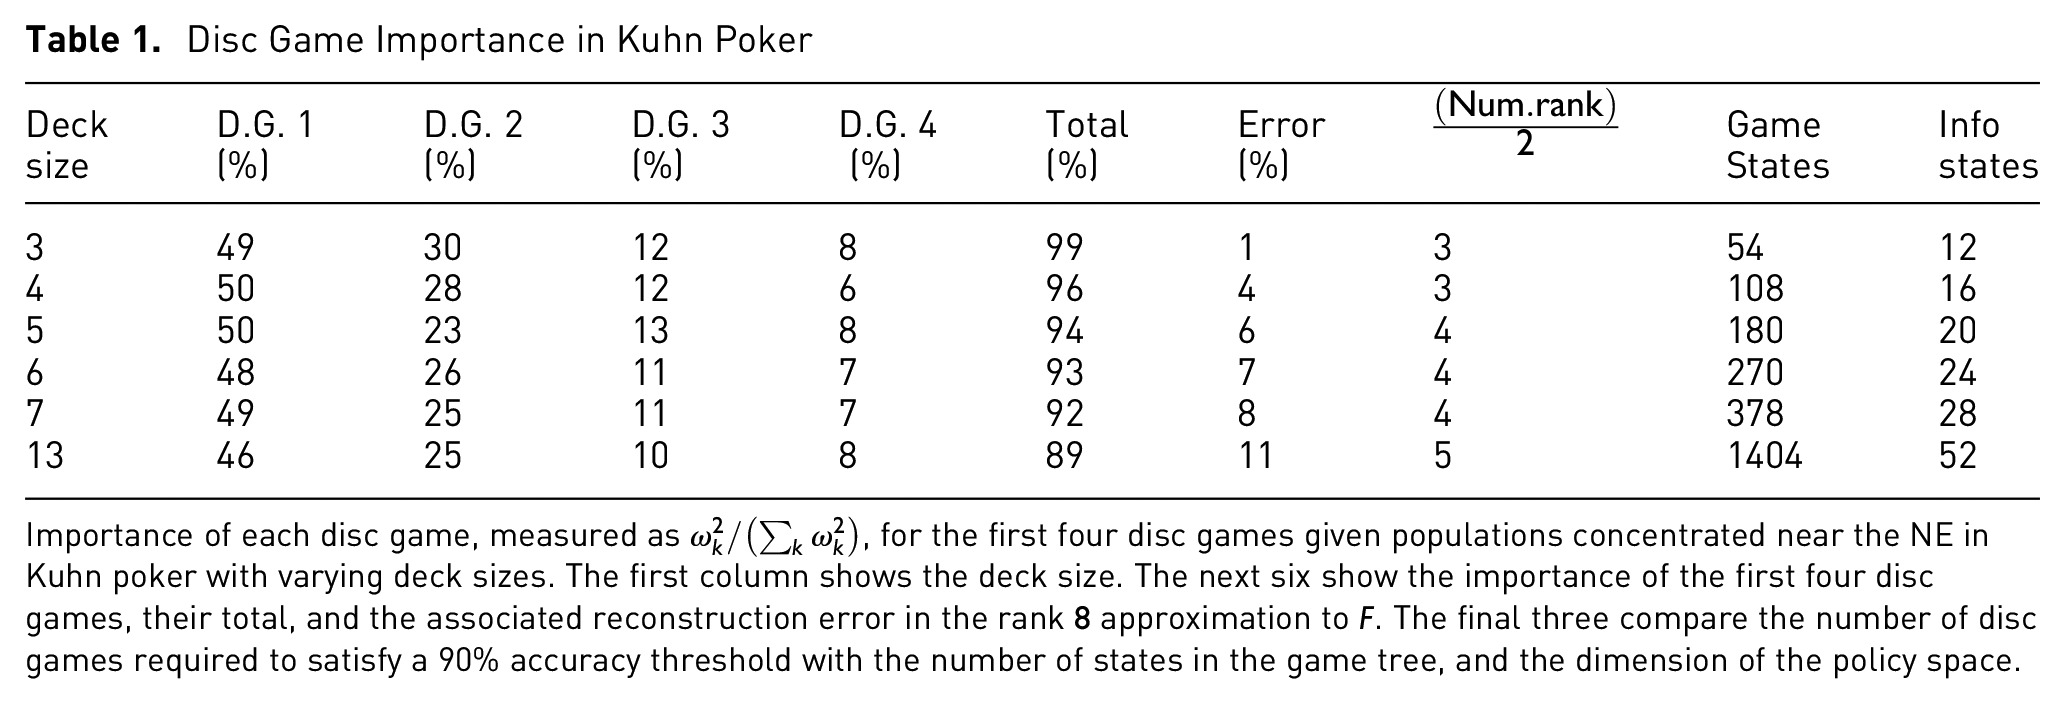
Importance of each disc game, measured as
Figure 2 illustrates the trade-offs produced by the first two disc games when
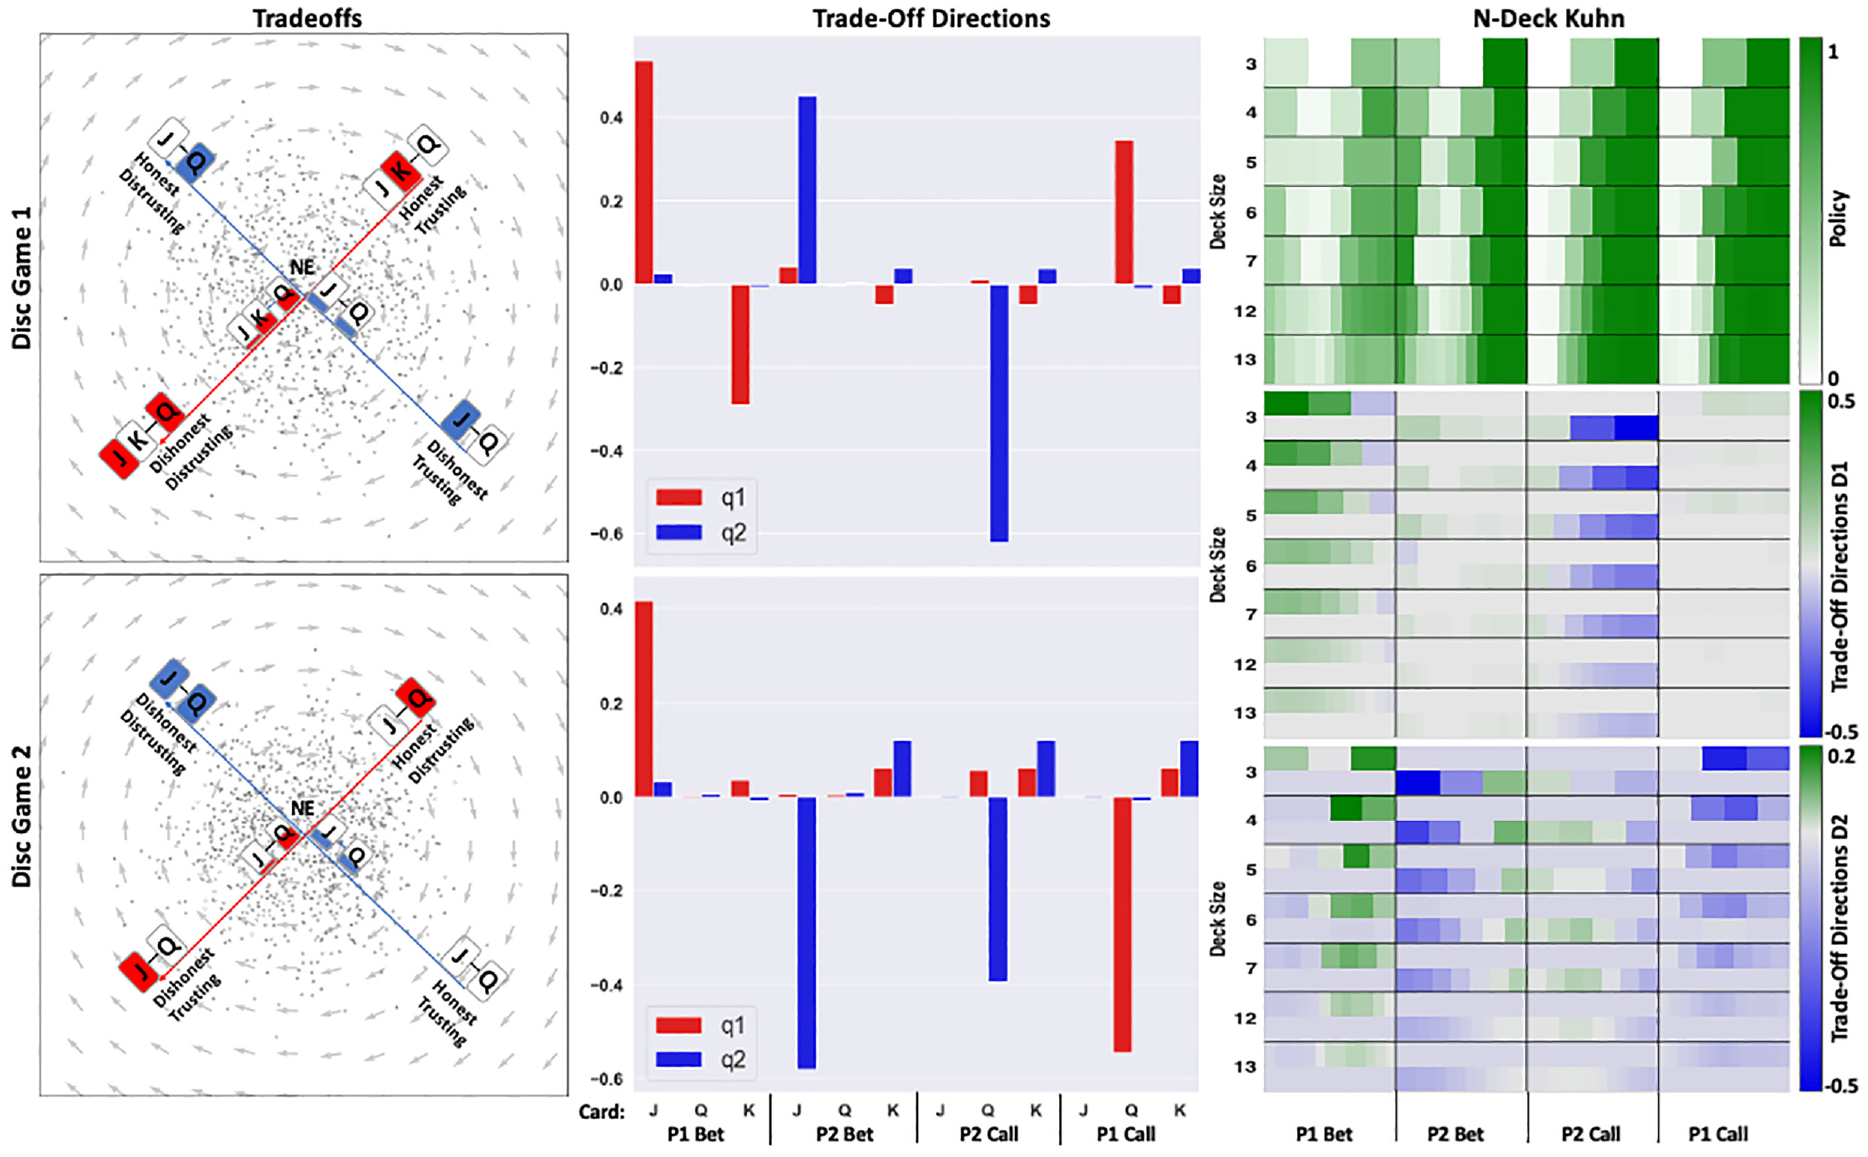
Left: The first two disc games with 4 marked axes representing the associated strategic trade-off about the NE. Middle: The weighting of the linear fit from policy to embedding is shown for each axis of the disc game. The
In practical settings, many of the entries of
Rock paper scissors + 2
Next, consider an extended example of the popular rock-paper-scissors (RPS) game, chosen to show that the geometry of the point cloud formed by the embedded agents can embody the structure of a game. Unlike the Kuhn example, we do not focus on a direct analysis of the mapping from strategy space to disc game space. Instead we aim to show that the point clouds’ shape naturally represents the game. We consider rock-paper-scissor-lizard-spock (RPS + 2). The utility matrix for (RPS + 2) is the circulant matrix generated by the row
First, we generate a population of agents using fictitious self play (FSP). Each agent in the population is defined by a vector of length 5 representing a mixed strategy. We start with an initial random agent and generate best response agents using FSP. Each best response agent is added to the population. We then create
What embedding should we expect? All mixed strategies are an interpolation of the five pure strategies, and the game is bilinear in the action probabilities, so the embedding map must be approximately linear. Thus, each mixed strategy should be contained inside the convex hull of a polygon formed by embedding the pure strategies. The utility matrix is invariant under cyclic permutations, so the polygon must be regular and centred at the origin. Therefore, the pure strategies must be the vertices of a regular, centred, pentagon.
The full game includes two, equally important, interlocking cyclic relations among the pure strategies. These are, rock ≻ paper ≻ scissors ≻ lizard ≻ spock ≻ rock, and rock ≻ lizard ≻ paper ≻ spock ≻ scissors ≻ rock, where ≻ denotes loses to. Both cycles contribute equally to the utility matrix as they are equivalent under a relabelling. Namely, the utility matrix is unchanged under a permutation that rearranges the strategy labels so that rock is followed by lizard, then paper, then spock, then scissors.
These two cycles are represented by a pair of disc games, as shown in Figure 3. In both, the pure strategies are vertices of a regular pentagon centred at the origin. The ‘Inferred Graph’ in the rightmost column plots a representative point for each of the pure strategies. Advantage relations that are not accounted for in the first disc game are represented in the second. In the first disc game, the sequence of pure strategies, Rock, Paper, Scissor, Lizard, Spock, are spaced by
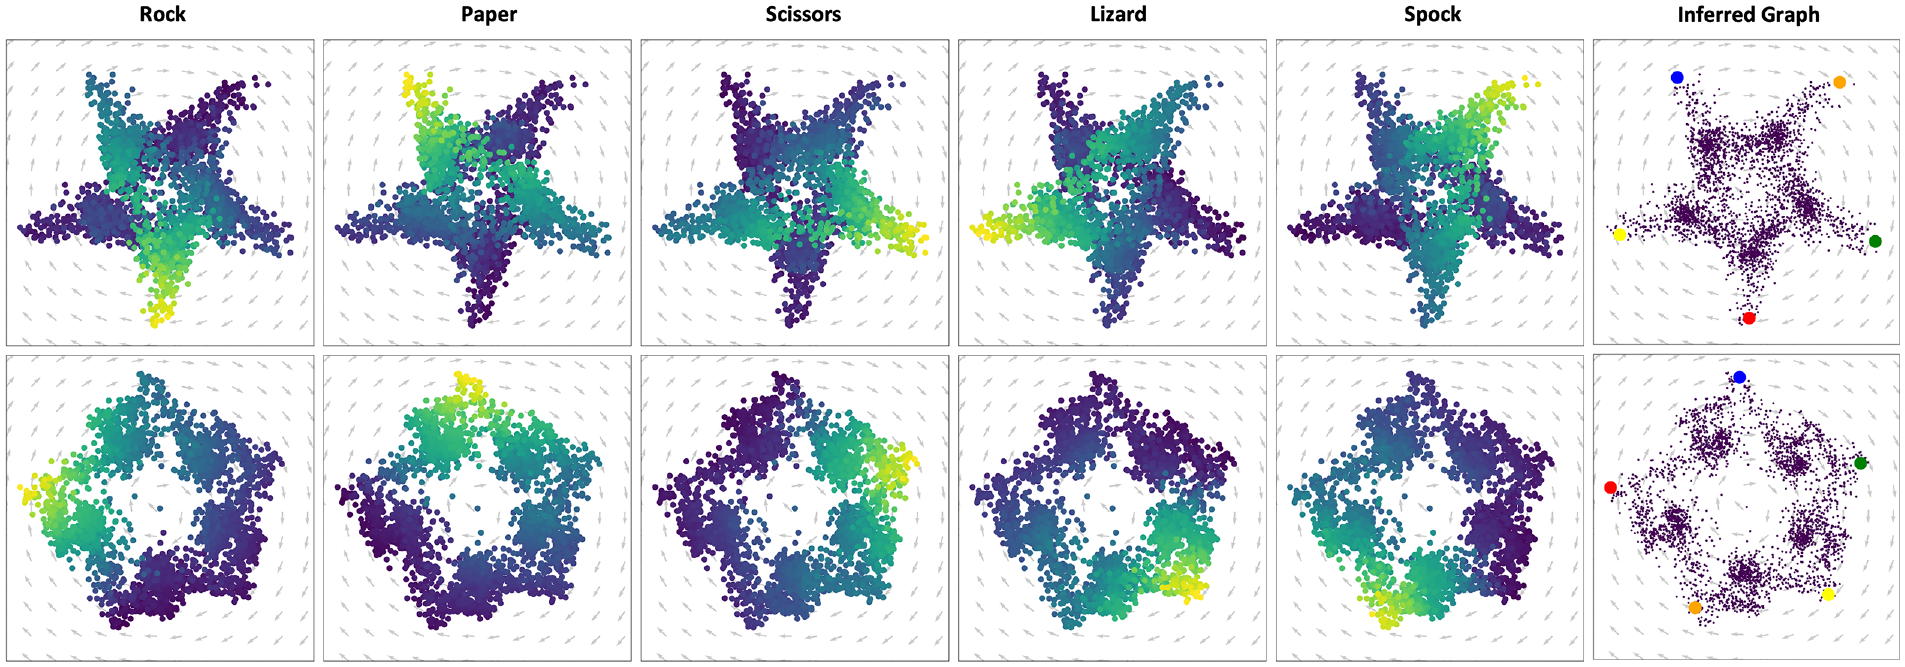
The two disc games that represent RPS + 2 are shown. Starting from the first column the points are coloured by the label for that column. The graph on the left shows a reduced representation of the game by using representative points for each strategy (red for rock, blue for paper, green for scissors, yellow for lizard, orange for spock).
As in Kuhn poker, the patterns uncovered by PTA repeat for larger RPS games, whose embedded point clouds form regular, centred polygons with as many vertices as pure strategies, as many disc games as cycles in the utility matrix, and whose vertex orders are related by the permutations which exchange cycles in the utility matrix. As before, the embeddings can be stably recovered from a small fraction of
Colonel Blotto
Colonel Blotto is a zero-sum, simultaneous action, two-player resource allocation game.
46
Each player possesses
At simplest, the payouts are uniform across zones, so the player who conquers the most zones wins the game. Unweighted Blotto is a highly cyclic game since there is no dominating strategy. Every strategy admits a counter. Unless
We consider each unique strategy as a separate ‘agent’, parameterized by the corresponding allotment. We generate agents by randomly sampling over the strategy space using a Dirichlet distribution with the support equal to the number of zones. After sampling, we compare each pair of strategies in the population. Each match-up is deterministic and results in a win, loss or tie, which we assign scores (0.5,0,−0.5). We construct the associated evaluation matrix by setting
PTA allows elegant visualization of relevant game structure by reducing a game to a small set of key trade-offs. We start by looking at the
Principal trade-offs.
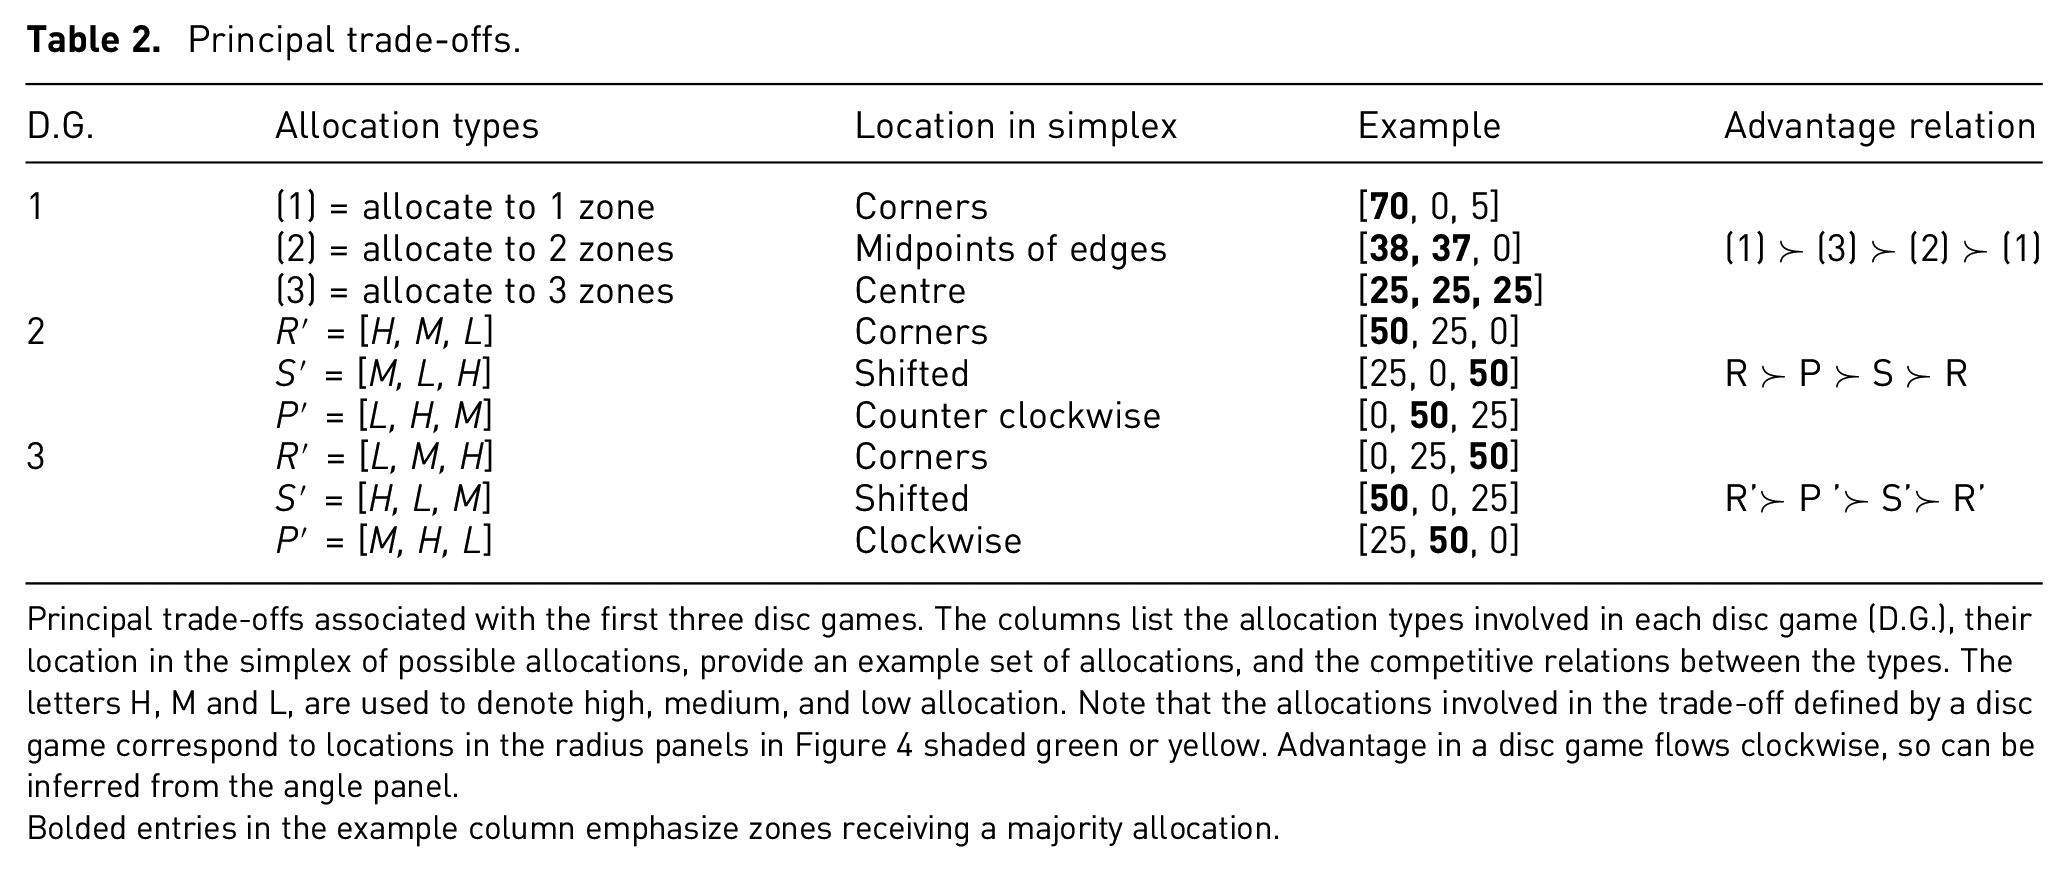
Principal trade-offs associated with the first three disc games. The columns list the allocation types involved in each disc game (D.G.), their location in the simplex of possible allocations, provide an example set of allocations, and the competitive relations between the types. The letters H, M and L, are used to denote high, medium, and low allocation. Note that the allocations involved in the trade-off defined by a disc game correspond to locations in the radius panels in Figure 4 shaded green or yellow. Advantage in a disc game flows clockwise, so can be inferred from the angle panel.
Bolded entries in the example column emphasize zones receiving a majority allocation.
In general, the number of distinct allotments in a
The exchange symmetry of the zones is apparent in the sequence of eigenvalues,
When
We analyse the three leading disc games to identify the most important allocation trade-offs. Figure 4 shows the first three disc games coloured by rating, allocation to the three zones, and the mapping to angle and radius in each disc game as a function of allocation. Each share the same eigenvalue, so are equally important and could be mixed. Nevertheless, these three disc games represent distinct trade-offs in allocations that can be easily explained.
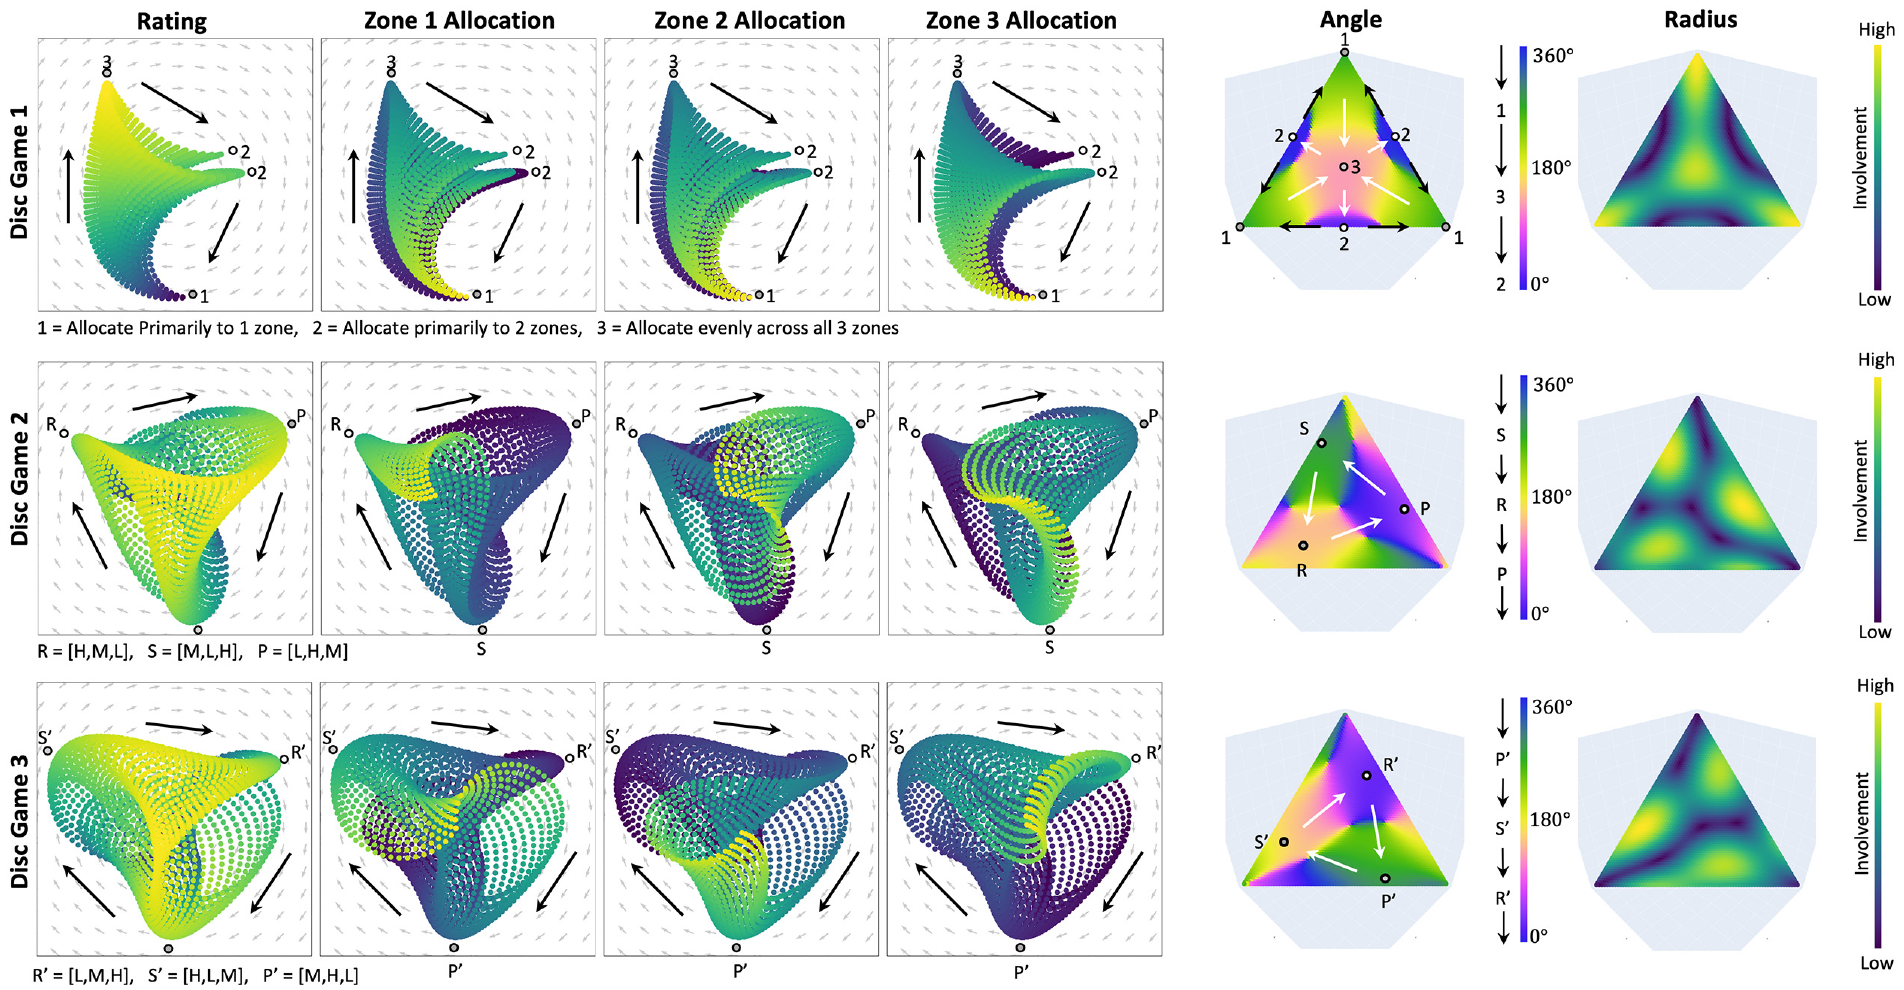
Disc games 1–3 of Blotto [1,1,1] game with
The specific trade-offs can be identified directly from the disc games when coloured by allocation. Consider the points labelled 1, 2 and 3 in the first disc game. Each maximize the radius of the scatter cloud while moving along its boundary, so represent the allocations most involved in the cycle. The low rated points at the bottom of the scatter allocate primarily to one zone (yellow in panels 2–4).
Moving clockwise, the next extrema occurs at the top of the scatter. It is high rated, and has nearly equal allocation across all three zones (coloured green in panels 2–4). Uniform allocations are rated highly since they perform well against most randomly sampled allocations, particularly those lying along a line connecting a corner of the simplex to its centre. This induces a transitive trend among the bulk of the allocations moving from allocations that prioritize one zone, to allocations that treat the zones equally. This transitive trend is represented by the general shift of the disc game leftward off the origin. This subset of allocations compete transitively, producing the regular gradient from purple to yellow in rating when moving clockwise from the bottom to the top in the scatter.
Not all allocations satisfy this transitive trend. Allocations that prioritize two zones counter the uniform strategy, and are countered by allocations that prioritize a single zone. For example, allocation [70,0,5] defeats [38,37,0]. Thus, allocations lying on the midpoints of an edge of the simplex lose to allocations near either neighbouring endpoint. These counters close the cycle, and are represented by the rightmost pair of corners labelled 2 in disc game 1. Panels 2–4 show that each such corner receives an intermediate allocation in two zones (green), but little to none in the third (dark blue).
Similar visual analysis identifies the RPS cycles among cyclic permutations of allocations [H,M,L] and [L,M,H] shown in disc games 2 and 3. For example, the leftmost corner of the scatter cloud shown in disc game 2 receives a high allocation in zone 1 (teal), an intermediate allocation in zone 2 (blue-green), and a low allocation in zone 3 (dark blue). Walking from R to P to S, the allocation patterns shifts cyclically. The same analysis applies to disc game 3, starting from [L,M,H].
Figure 5 shows the angle and radius assigned to each allocation in the simplex. Strikingly, subsequent disc games imitate the disc game 1–3 trade-offs, only at higher frequency on a smaller spatial scale in allocation. This suggests that the disc games may act like Fourier modes, where early disc games capture low frequency, global trade-offs, and later disc games capture high frequency, local trade-offs. It also suggests that orthogonality may not be the appropriate notion of independence for trade-offs. A sharper notion of equivalency is needed. Methods like nonnegative matrix factorization, which address similar issues among PCA features, 47 suggest an avenue for further development. An example that produces explicit sine series is discussed in the Appendix.
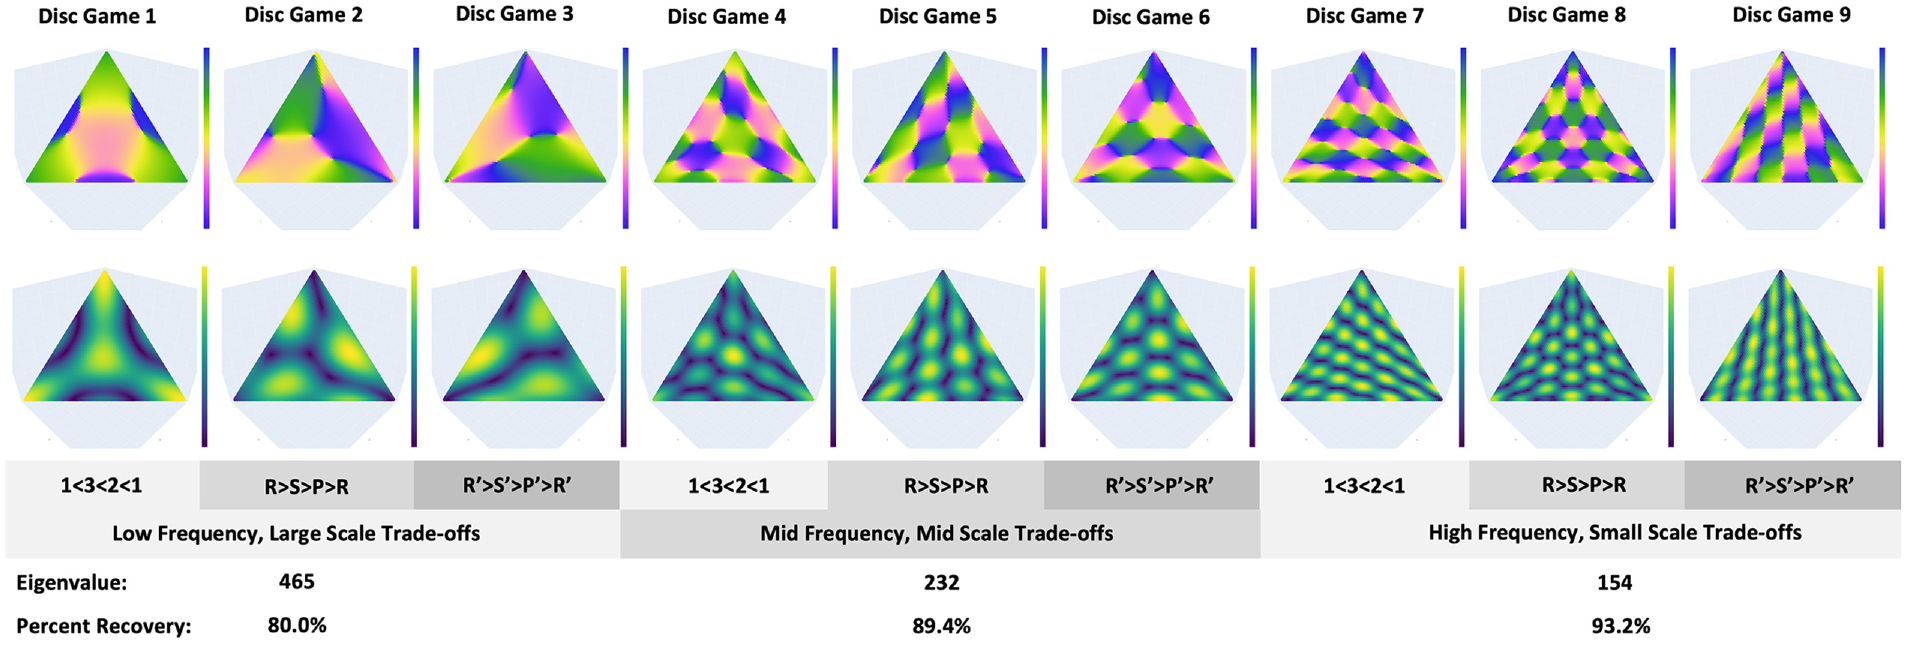
The first nine disc games of the
Pokemon
We conclude by analysing Pokemon. Pokemon originated from the Nintendo Game Boy console, but has since been played on a variety of mediums including playing cards. Pokemon is of considerable interest from a game design perspective since the creators must design certain trade-offs to keep the game balanced and engaging. The game is made up of creatures, called Pokemon, which come in many varieties. Players are rewarded for collecting diverse teams. Thus, each Pokemon has a different type, and each type has its own set of strengths and weaknesses. These different types satisfy interlocking cyclic relationships.
The data used in this analysis comes from an open-source Kaggle data set. 48 The original data has 800 Pokemon, but we removed the 65 ‘legendary’ Pokemon to simplify the analysis. The data consists of battle outcomes and Pokemon attributes. Battle outcomes were converted into an evaluation matrix by logistic regression (see Appendix).
Figure 6 shows three of the first four disc games, chosen for their significance. The first disc game is the most important, and is clearly transitive since all points fall on a curve that does not enclose the origin. Position along the curve is closely correlated with speed, so speed determines rating. We query by attribute to interpret the remaining disc games. To start, consider the ‘type’ attribute. The second disc game is clearly clustered by type (see Figure 6). A variety of RPS relationships are apparent among the type clusters. Any loop of clusters containing the origin corresponds to a cycle of type advantage. The intensity of the corresponding cycle (curl) is proportional to its area. Focus on the large clusters most involved in the trade-off, that is, furthest from the origin. Figure 7 summarizes the RPS relations between these clusters. First, notice the highlighted triangle formed by the Water-Fire-Grass clusters. The disc game shows the expected advantage cycle since the triangle contains the origin. Thus, PTA identifies known game structures without domain-specific knowledge.
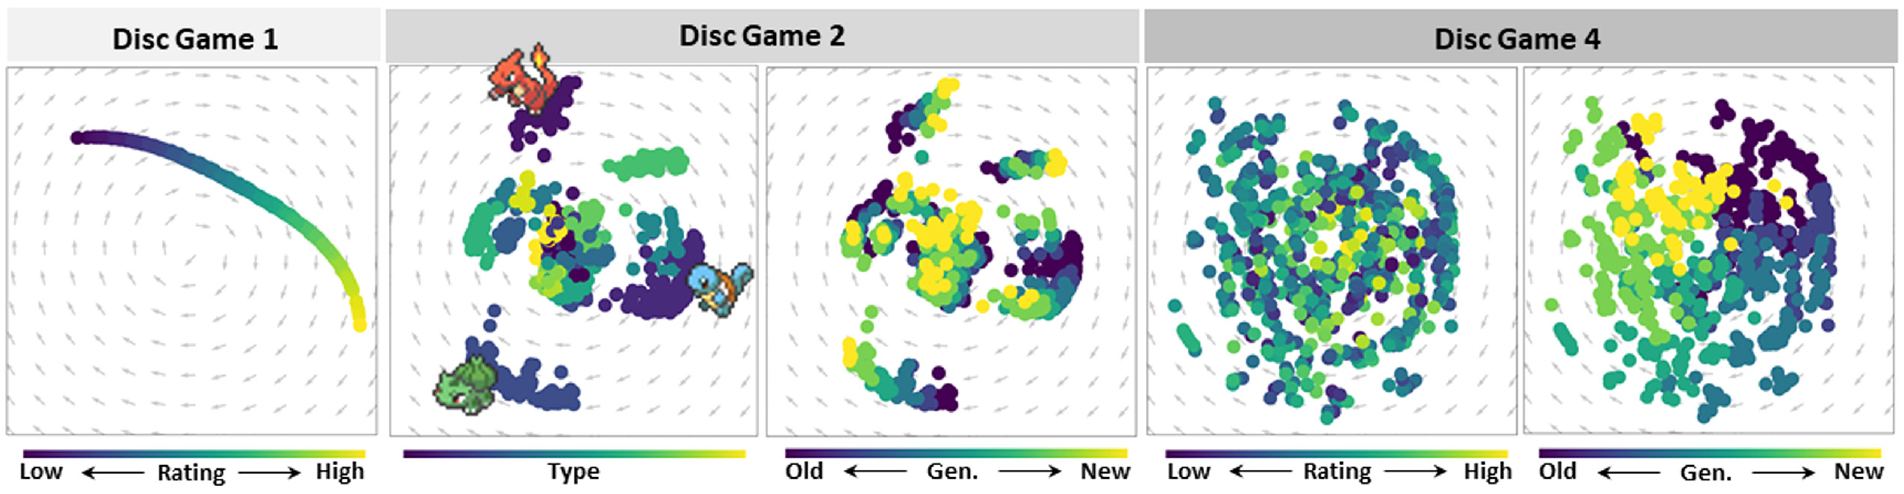
Disc games 1, 2 and 4 for pokemon. Disc game one is coloured by rating. Disc game 2 is coloured by type, then generation. Disc game four is coloured by rating, then generation.
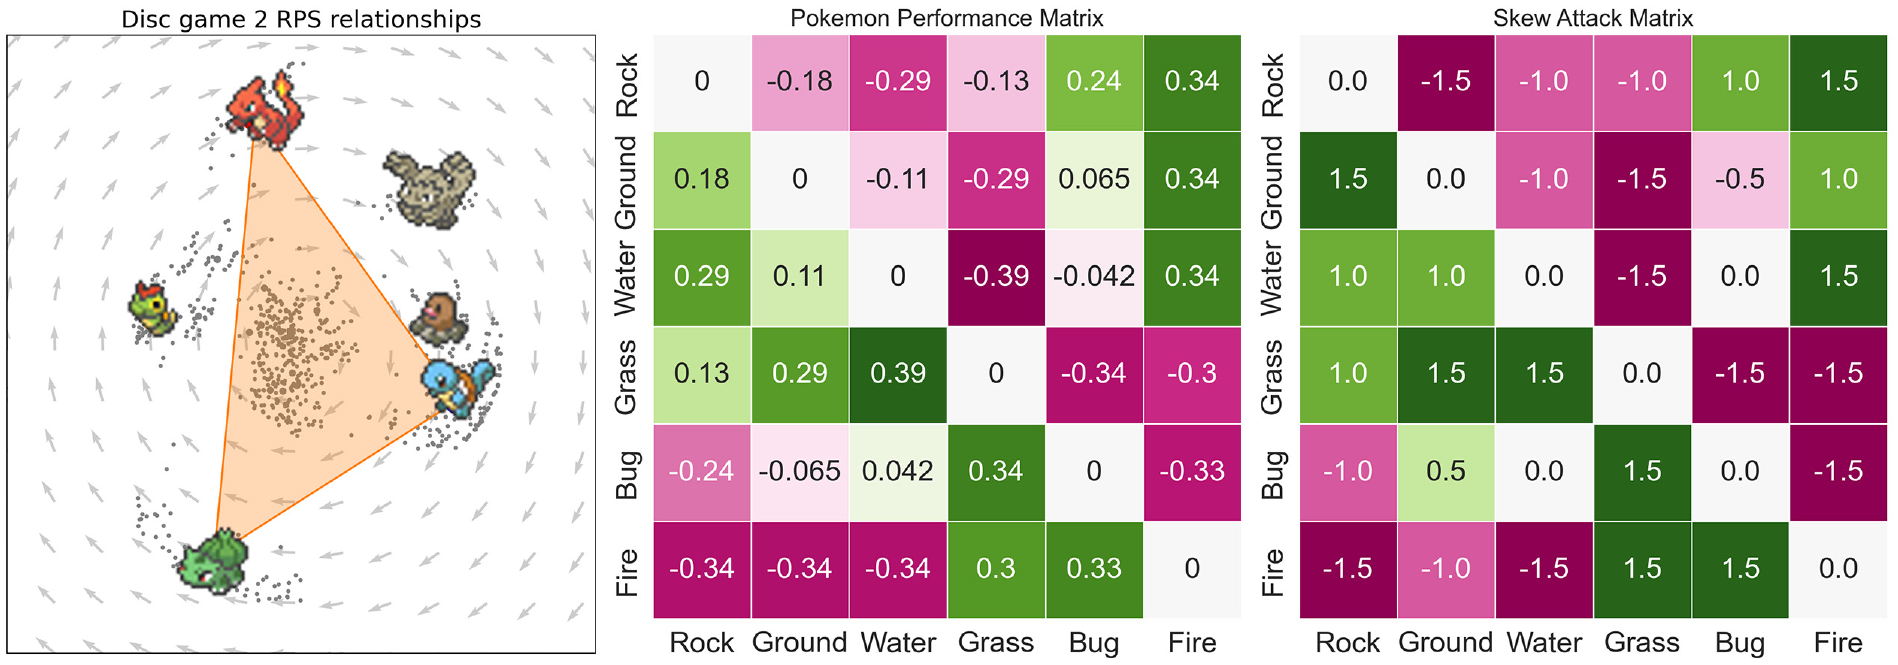
Left: RPS sub-game discovery. Each cluster type is represented by a matching pokemon, Middle: Empirical performance matrix, Right: Performance matrix derived from Pokemon Database. 49
Additional clusters on the outer ring are more intricately related. The other three types are ‘bug’, ‘rock’ and ‘ground’. To summarize these relations we construct a coarse-grained evaluation matrix,
We compared these relations with available game design matrices known as ‘attack matrices’, which list the advantage of one Pokemon type over the other. We use the attack matrix from Pokemon Database.
49
An attack matrix is written in terms of multiples, so Pokemon that are evenly matched have a
The coarse grained summary
Colouring the disc games by ‘generation’, that is, pokemon release date, reveals design choices. The game is frequently updated by the addition of new Pokemon. Updates present a design challenge. Game designers must introduce desirable new Pokemon without upsetting the game balance. The fourth disc game, shown in the far right plot of Figure 6, is balanced in that rating does not predict angle, and instead correlates with radius. Strong and weak Pokemon are closer to the origin, while Pokemon of intermediate rating are more involved in the trade-off. This reveals a spinning top structure characteristic of many games. 26 Rather, generation predicts angle. Each generation possesses an advantage over its predecessor, as illustrated by the fade from purple to yellow. Balance is retained since generational advantage is periodic. The same clockwise generation shift reappears in the second disc game. Within type, new beats old. For example, the bottom-most cluster (grass) clearly trends old to young. Cross type relations are largely unchanged.
Unlike Kuhn poker or extended RPS, the Pokemon embeddings require most of
Conclusion
Following Balduzzi et al., 15 we have demonstrated that all evaluation matrices admit an expansion onto a sum of disc game embeddings. We suggest the name PTA based on the close analogy with PCA. Through examples, we have demonstrated that embeddings produced by PTA can reveal a surprising variety of competitive structures from incomplete outcome data alone through direct visual inspection. Future work could provide more general methods for finding embeddings, such as a functional theory connecting performance with attribute space either, or could seek a sparser representation via extensions of sparse PCA. 50 Future work should also investigate automated methods that summarize the trade-offs identified by PTA without the need for visual inspection, and that leverage the representation for game classification, construction, and exploration.
Supplemental Material
sj-pdf-1-ivi-10.1177_14738716241239018 – Supplemental material for Principal trade-off analysis
Supplemental material, sj-pdf-1-ivi-10.1177_14738716241239018 for Principal trade-off analysis by Alexander Strang, David Sewell, Alexander Kim, Kevin Alcedo and David Rosenbluth in Information Visualization
Footnotes
Funding
The author(s) disclosed receipt of the following financial support for the research, authorship, and/or publication of this article: This work is supported by the Defense Advanced Research Projects Agency grant no. HR00112090075.
Supplemental material
Supplemental material for this article is available online.
References
Supplementary Material
Please find the following supplemental material available below.
For Open Access articles published under a Creative Commons License, all supplemental material carries the same license as the article it is associated with.
For non-Open Access articles published, all supplemental material carries a non-exclusive license, and permission requests for re-use of supplemental material or any part of supplemental material shall be sent directly to the copyright owner as specified in the copyright notice associated with the article.