
Abstract
The performance of soccer players is commonly rated by soccer experts for each match as well as over a tournament or during a season/year. However, these ratings are mostly subjective. We instead propose a visual analytics approach for a more objective, data-driven analysis of soccer players’ performances. We introduce data-driven ratings for various aspects, which can be combined by interactively assigning weights to compute an overall score as well as individual scores for passes, duels, and shots. Our tool supports comparative visualizations at a global level that can be adapted to different analysis tasks as well as in-detail analyses of individual events of the game. We apply our approach to data gathered during the 2020 UEFA European Football Championship and perform in-detail analyses of individual players in selected matches.
Introduction
Soccer is one of the most popular sports in the world. While being a team sport, public interest often targets individual players like Cristiano Ronaldo, Lionel Messi, or Robert Lewandowski. The interest does not only become apparent on social media or in economic aspects like merchandising but also in private and public media discussions after soccer games. For example, after each match day of the German soccer league, several German magazines like kicker, Sport Bild, or Spox publish ratings of the players.1–5 However, these ratings are based on the subjective opinions of experts and do not use objective measures, which may lead to quite some variance in the ratings. Also, the most prestigious awards for individual players – the Ballon D’Or and the FIFA World Player of the Year – are awarded based on subjective ratings of committees consisting of coaches, soccer players, and journalists. Various approaches exist for the analysis of the growing amounts of data collected for soccer games, but none of them target data-driven ratings of individual players within a flexible user-centric analysis process. In practice, the importance of criteria differs depending on the players’ position. For example, the German soccer journal “kicker” uses a range of statistical performance values, but primarily shows information on duels, ball contacts, and passes for defensive players, 6 while, for offensive players, information on shots on the goal, assists thereof, and passes are shown. 7 Therefore, users should be able to adapt the weights for the ratings based on the analysis task.
We propose an interactive tool that helps coaches, scouts, and journalists to more objectively rate the performance of soccer players based on different aspects extracted from game data. We first identified a set of tasks that our approach should support. To allow for a data-driven analysis, we then propose a set of objective ratings. The various ratings can be interactively combined by the user to an overall score as well as individual scores for passes, duels, and shots. For the in-detail visual analysis of these scores down to the level of investigating individual events, we present our visualization tool Soccersight Visualiza. It supports the analysis of the performance of all players individually as well as in comparison to other players. To demonstrate the application of our approach, we apply it to the analysis of Cristiano Ronaldo’s performance of passes, duels, and shots in the match Portugal versus Hungary in the 2020 UEFA European Football Championship and investigate the passing behavior of Toni Kroos within the same tournament. Our main contributions can be summarized as proposing objective, data-driven ratings to quantify the performance of soccer players and embedding those ratings into a visual analytics tool Soccersight Visualiza. It allows for a detailed, interactive analysis of individual players’ performances, where the user can change the weights of the different ratings to adapt it to different player positions or different analysis goals. Our tool provides a wide range of opportunities to analyze and compare different players based on user-defined key aspects.
Related work
Visual analysis is nowadays common in many sports.8–10 The general popularity of soccer led to various approaches which focus on different aspects of the game, including passing behavior11,12 and formations. 13 Other approaches focus on a subset of aspects of the game like dynamics of different zones 14 or trajectory visualization.15–17 While the intuitive notion of pressure is relatively clear, different approaches have been proposed to quantify and analyze this aspect.18–21
One common analysis goal is the analysis of single players. While Ryoo et al. 22 propose a system to investigate the impact of single players on the team, SoccerMetrics 23 is a visualization system for predicting the individual as well as team performance. SoccerStories 24 allows for visually analyzing different phases of the game. While it supports the analysis of single players in these situations, this visual analysis approach does not target the task of ranking the players. Bkviz 25 can be used for the analysis of individual players in basketball games using accumulations like heatmaps and visualizations of the player performance. Janetzko et al. 26 include some aspects of single player analysis but use it for segmentation of the match in different phases. There are also some commercial tools available like Impect, 27 which mainly builds on packing as a measure. Schultze and Wellbrock 28 introduced a plus/minus metric that adds points to all players on the field when a goal was scored and subtracts points of all players that were on the field when they conceded a goal from the opposing team. The metric also takes into account the importance of a goal as well as how strong the opponent team is. Hvattum 29 provides an overview of plus/minus ratings in different competitive team sports. While applicable to all players, these metrics do not capture the actual circumstances that led to the goal. None of the presented approaches provides a wide set of rankings that capture different aspects and can be combined in a user-centric analysis process like we propose in this work.
Rusu et al. 30 rate a player based on the categories execution mechanics, tactical utility, and frequent mistakes in execution, but they do not include more detailed visualizations for the analysis of single situations. The temporal evolution of rankings for teams can be visualized using a novel gap chart, 31 but they do not perform more detailed analysis on different aspects of performance. A recent approach presents a visual analytics system to include user preferences for rankings, 32 which is related to our interactive adjustment of weights. However, they do not focus on the application to soccer and thus do not consider the specifics of soccer games.
Overall, the discussed approaches lack a comprehensive set of ratings together with a detailed analysis of the individual game situations. Therefore, we present such an approach that allows for a combination of the main aspects for rating a player’s performance based on a user-defined weighting and in-depth comparative analysis supporting the tasks presented in the next section.
Task analysis
We analyze the performance of soccer players based on soccer event data combined with tracking data. In this work, we use data of the 2020 UEFA European Football Championship provided by StatsBomb. 33 This dataset contains meta data, event data, and tracking data. The tracking data, however, do not cover the entire games, but are limited to event situations. For some statistical processing (regression model, normalization), we also use two games provided by Metrica Sports, 34 where more detailed tracking data are available. Note that our approach is generalizable to other datasets as long as they provide event data as well as (at least event-related) tracking data.
We identified coaches, scouts, and journalists as main stakeholders that could be interested in using our visual analytics solution. We, therefore, formulated six tasks that we considered to be most relevant for such stakeholders when performing a data-driven analysis of the performance of individual soccer players. The tasks are based on a literature survey from the domain of soccer analysis (see also Table 1) as well as the visual analysis of ratings. 32
Overview of existing approaches that fulfill some of our tasks T1 to T5 . As we considered visual analysis approaches, task T6 is inherently fulfilled by all listed approaches.
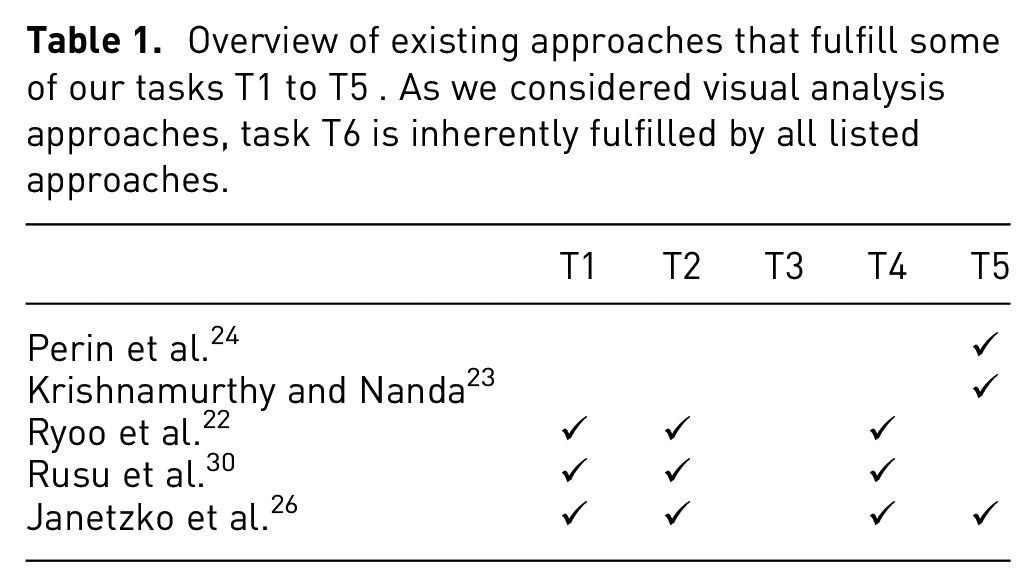
Table 1 shows which of these tasks are addressed by existing approaches. The listed approaches are limited to visual analysis solutions targeted at soccer that address at least one of our tasks. The table reveals that none of the approaches addresses all tasks. Especially task T3 is not addressed by any of the approaches. However, task T3 is indeed important, which is documented by the fact that in popular soccer journals different statistics are shown in different contexts.6,7 Even though all metrics are accessible for all players, the ones shown in the overview (i.e. key performance measures) vary depending on the player positions, which correspond to our weights. Additionally, the importance of user-based ratings was identified by Schmid et al. 32 beyond the scope of soccer analysis. Therefore, we consider it as especially important to include T3 in our approach to close the gap in literature. In the following, we will use this set of tasks to first develop a rating system and then design a visual analytics tool for the analysis of the data that supports a comprehensive analysis.
Data-driven ratings
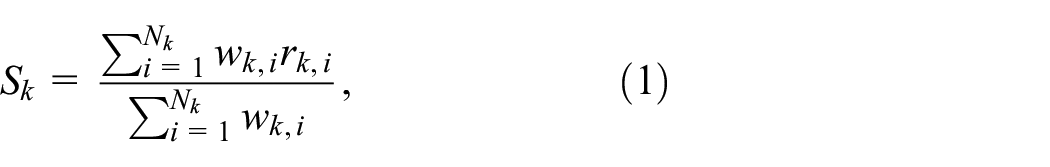
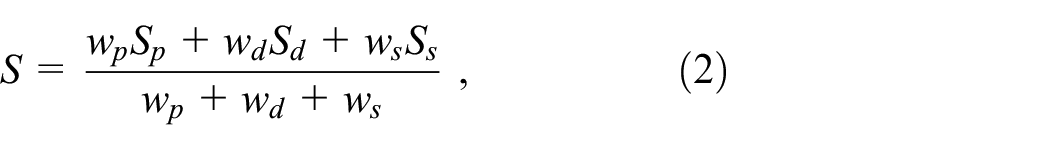
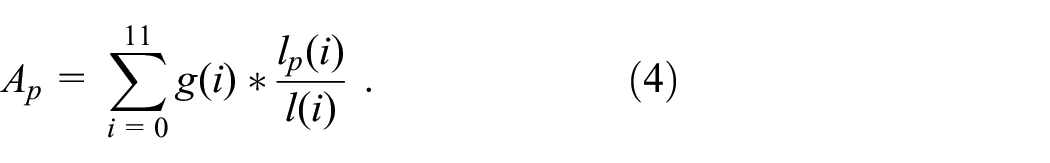
We propose a set of scores for the performance of soccer players that range between 0 and 10, with 10 being best. For each event, we assign ratings in various categories. For each category, all available ratings of the players are averaged over the whole game (task T1). Based on the individual ratings for the categories, we calculate a summary score of the whole game for different kinds of events, namely passes, duels, and shots (task T2). By forming a weighted average of these three scores, we obtain an overall score for the player. The weights for the summary scores as well as for the overall scores can be adapted interactively by the user (task T3). Thus, the overall scores for the individual kinds of events (passes, duels, and shots) can be computed as
where
where
In the following, we will explain in detail how the different ratings are calculated. Our goal here was to assemble a comprehensive set of ratings that capture sufficiently well the many different aspects of a soccer game. Of course, there are different ways on how to define ratings and some may be more relevant than others for judging the player’s performance. However, in the end, it is up to the expert user to decide, which ratings shall be used and how strongly they shall be weighted.
Passes
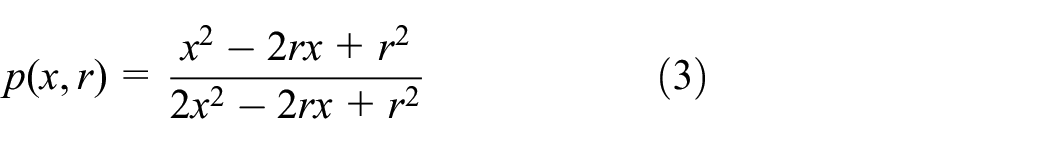
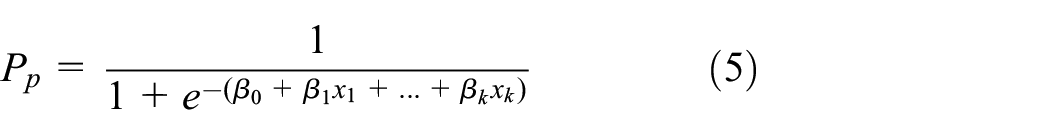
The summary score for a player that rates his/her performance in passing includes measures on the difficulty and the gain of completed passes such as the pressure on the player, the change in pressure, the packing of the opponents, the number of passes until a shot on goal, and the area spanned by the pass. Note that only the successful passes obtain a rating, while the pass accuracy is shown in separate statistics but not included in the ratings. We also compute the expected pass success for each pass by training a regression model on all available pass data.
where
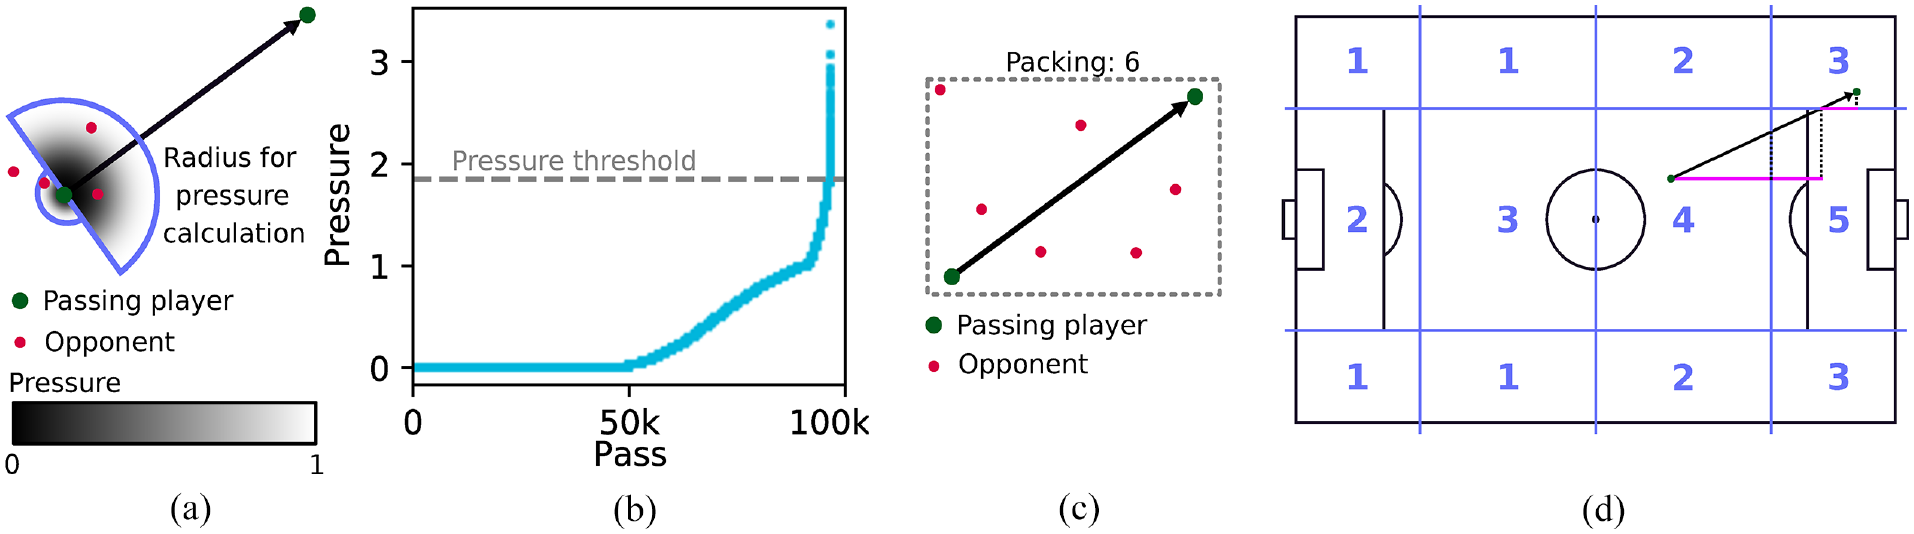
Calculations for the ratings for passes: (a) pressure in passes and shots is modeled by two semicircles, (b) the pressure values are mapped to [0,9] below an elbow threshold and to [9,10] above the threshold, (c) packing is calculated for forward passes by counting the opponents inside the gray rectangle, and (d) Area weights (blue numbers) are multiplied by the fraction of the zone that is traversed by a pass (length of pink lines divided by length of region) to compute area ratings for passes.
To map the pressure values toward a rating between 0 and 10, we perform a rescaling. To avoid a large effect of very good values and to obtain a good distribution of the ratings over the whole range, we choose a piecewise linear scaling. We compute pressure values for all available data as shown in Figure 1(b). Then, we choose the elbow point in the distribution where the gradient strongly increases and map all values above the elbow point linearly to the range
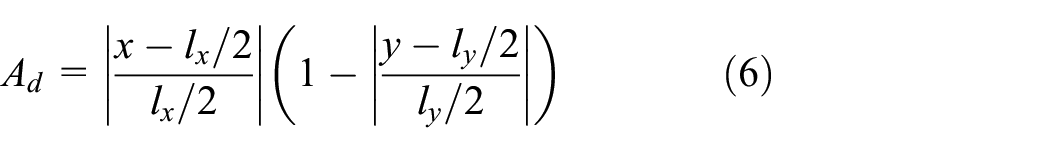
As the area score
where
Duels
The overall rating for the won duels is formed by ratings for the pressure, the passes until shot on goal, an area rating, and again the expected success rate.
where
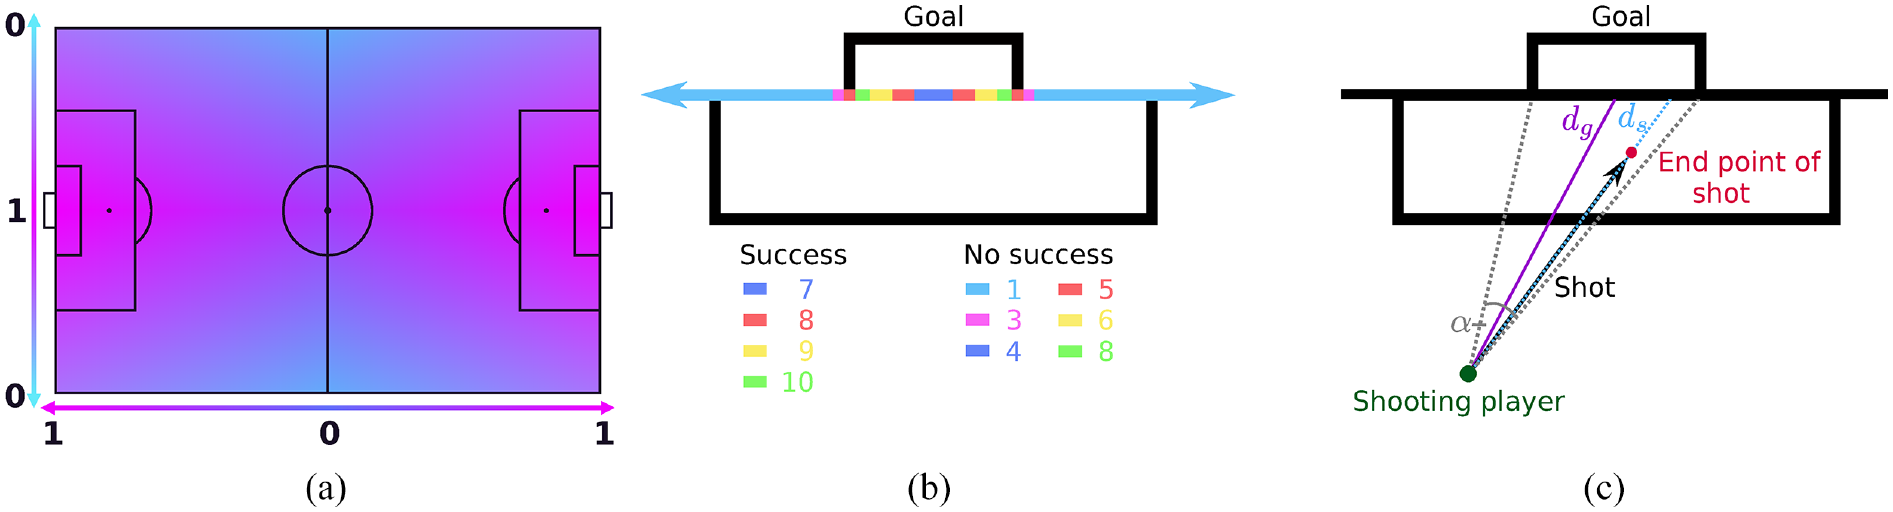
Calculations for duel and shot ratings: (a) heatmap of area weights for duels, (b) ratings for accuracy of shots where the numbers indicate the rating and the colors show the regions to which the rating is applied, and (c) expected goal success depends on angle
Shots
To obtain a rating for shots, we use a weighted average of the pressure and the accuracy. Moreover, the expected success rate for a goal is computed.
Visual design
Following Shneiderman’s mantra of “overview first, […] details on demand,” 36 the application is divided into a score overview and detail visualizations that facilitate the analysis of different qualities of a player on different levels of detail (task T6). These different levels of detail are also represented in the modular structure of the tool. The overview visualization as well as the different aspects for the detailed analysis (passes, shots, duels) each form individual tabs. Therefore, users can interactively switch between the tabs when focusing on different aspects while still keeping any selections in the individual tabs. The tool is developed in Python using Dash and Plotly to provide an easy to use web interface. More time intensive calculations like the fitting of the regression model are precalculated to allow for an interactive exploration of the data during the analysis session. A demonstration of the interactive usage of our tool is included in the Supplemental Video.
Score overview
The scores for passes, duels, and shots are shown in juxtaposed views using a tabular representation, see Figure 3. The explicit numerical representation allows the user to directly read off the exact values. It also facilitates the comparison between the different ratings and is order-independent, while comparing the values in visualizations like bar charts may become difficult for similar values that are not shown close to each other. As the number of individual ratings is relatively small, a comparison in the tabular representation remains feasible. The ratings of all three event types are summarized into a final score that is shown in the general rating view. Additionally, the pass, duels, and shots scores as well as the final score are visualized for all players of the match to provide context, which will be explained in more detail at the end of this section.
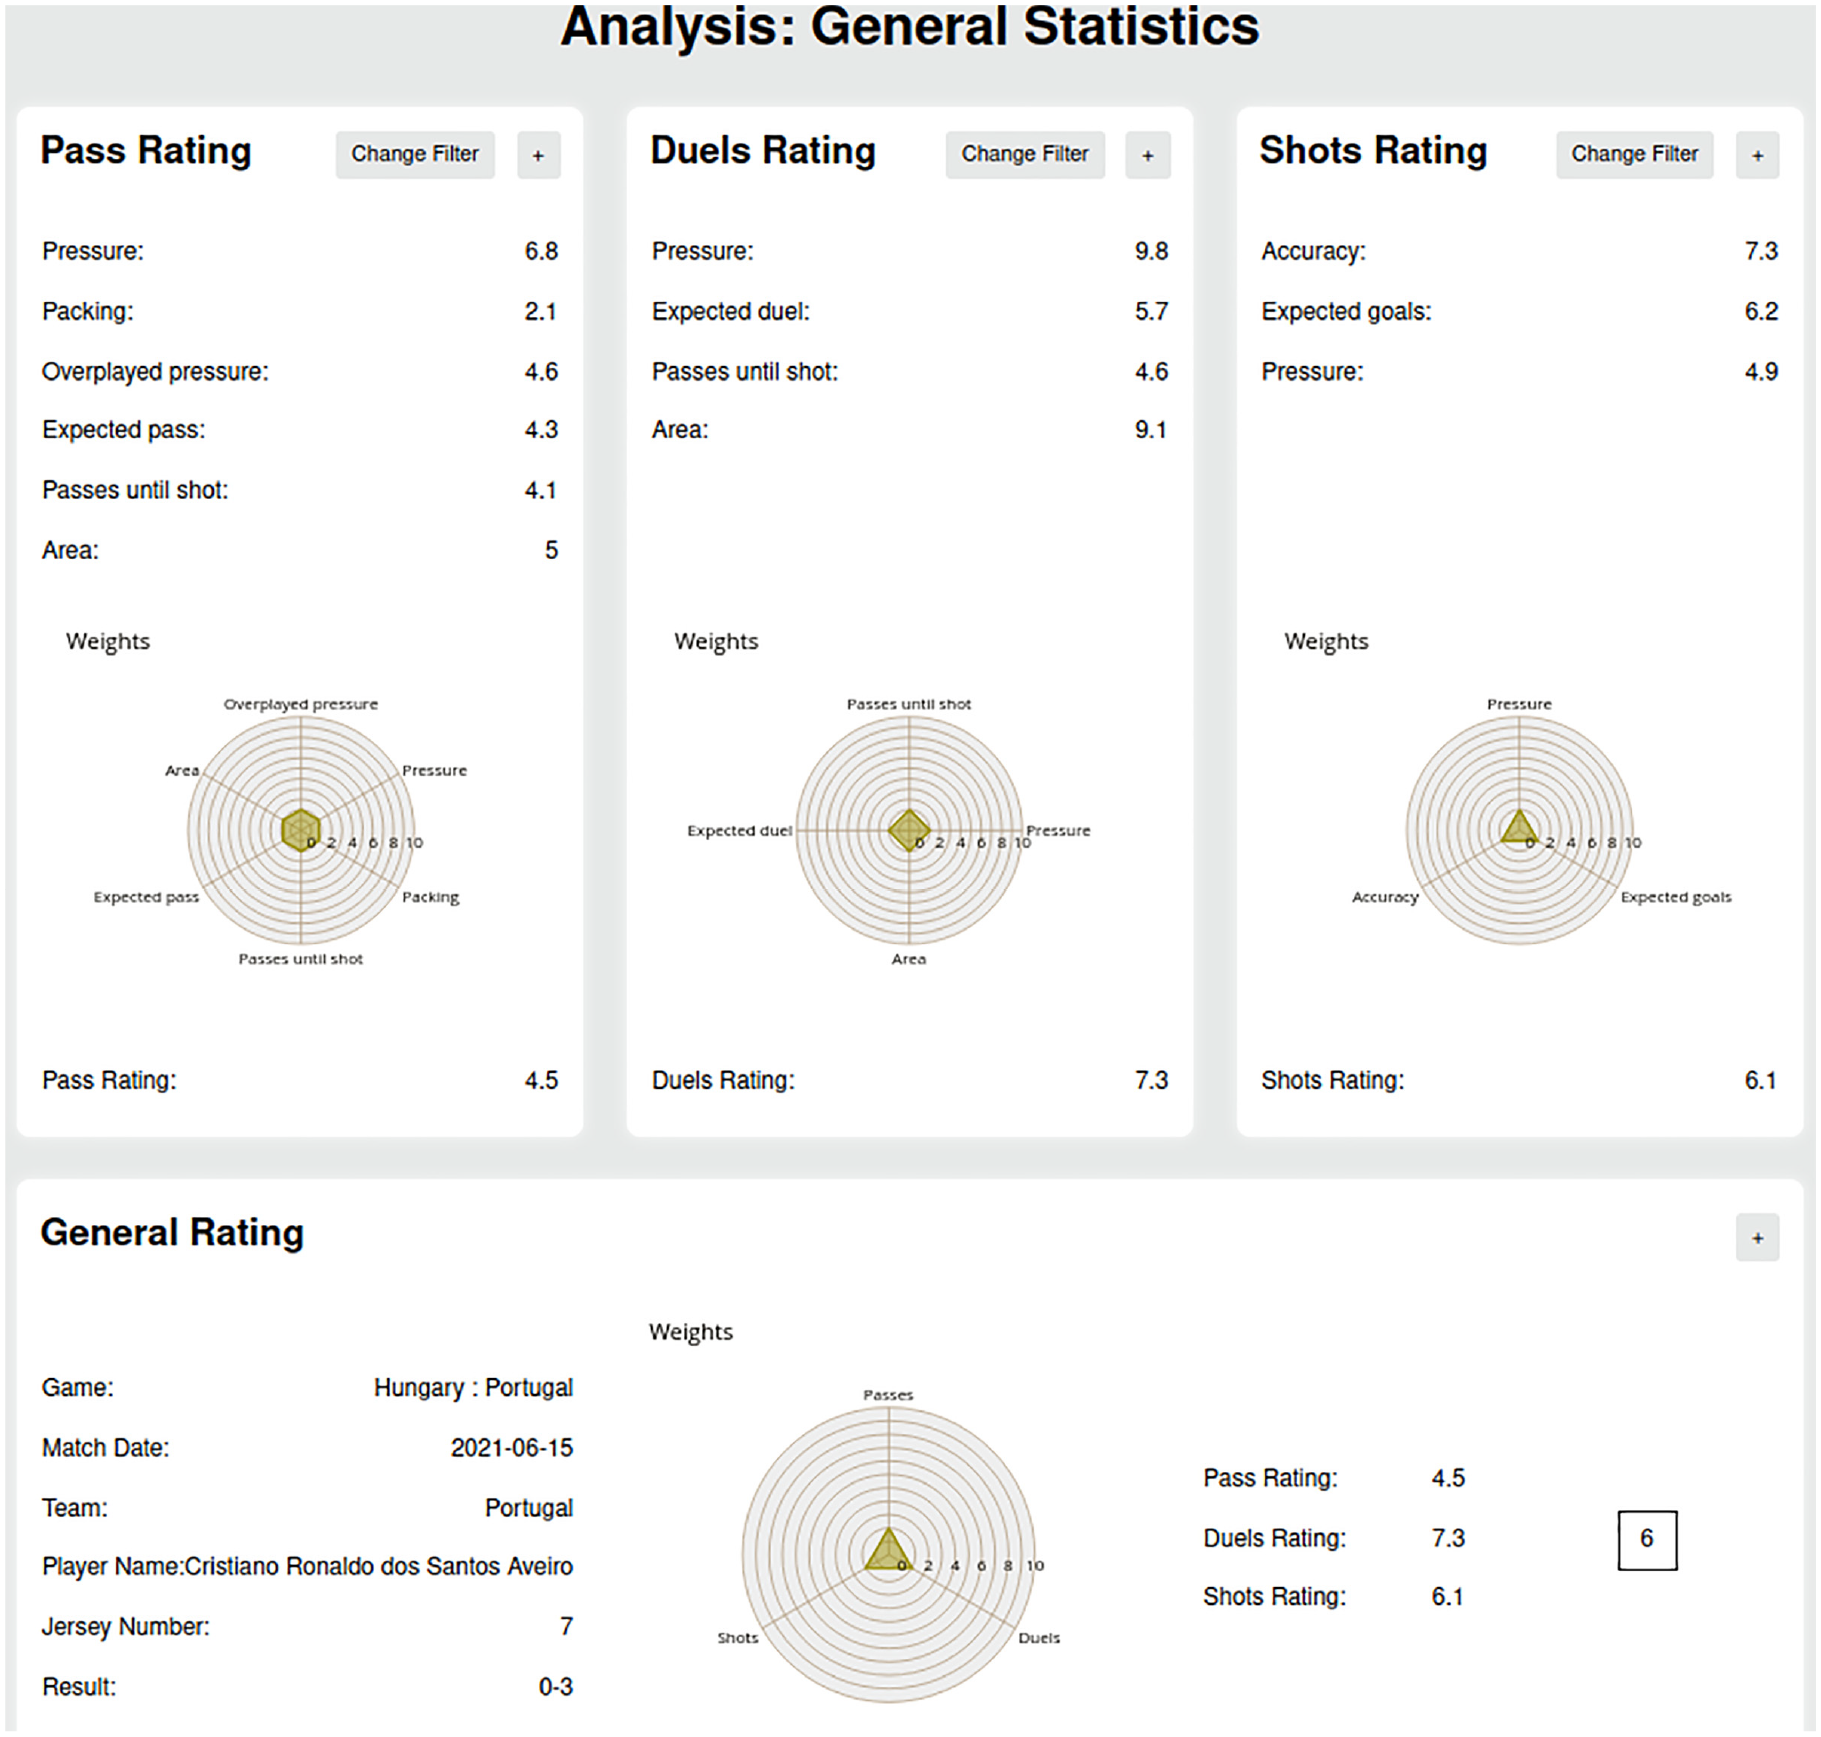
Overview of pass, duels, shots, and overall ratings for Cristiano Ronaldo in the game against Hungary. The radar charts allow the user to interactively adapt the weights of the individual scores for different analysis tasks.
Depending on the player’s position and the specific analysis tasks some individual ratings might be more important than others (task T3). Therefore, the user can interactively assign weights to the different ratings. To change the weights, we propose to use a radar chart as a multi-dimensional slider, which is more compact than multiple simple sliders (which resemble bar charts) or parallel coordinates. Additionally, the radar charts with the resulting shapes encode which aspects are weighted as most important. This reflects the previous usage of radar charts to investigate the player’s performance.13,23 We also considered to visualize the different ratings in the radar chart. However, this might lead to confusion between weights and values which could make the analysis more complicated.
In the radar chart, each axis represents a range from 0 to 10. The weights can be adapted interactively by selecting the value on the chosen axis. Based on the selection, the scores are computed as described in equations (1) and (2). As we provide ratings for each of the three event types and, then, combine the ratings for these three event types in the subsequent step, no more than six weights should be set to obtain one of the weighted ratings. As a default, all ratings are weighted equally, which supports the users in changing the weights of individual ratings one by one.
After specifying which attributes are of most interest for the task at hand, the scores of the selected player are shown in comparison to the scores for other players of the match (task T4). For this purpose, we use a bar chart that is sorted in ascending order based on the overall weighted score, see Figure 4. The color coding of the bars encode the team affiliation (yellow for the team of the selected player, green for the opponent team), while the selected player is highlighted in a third color (red) for better differentiation. The representation as a bar chart with sorted values allows for an easy comparison between the scores of players in adjacent bars, while the ordering provides the possibility of quickly identify the ranking of a player when compared to other players of the selected game.
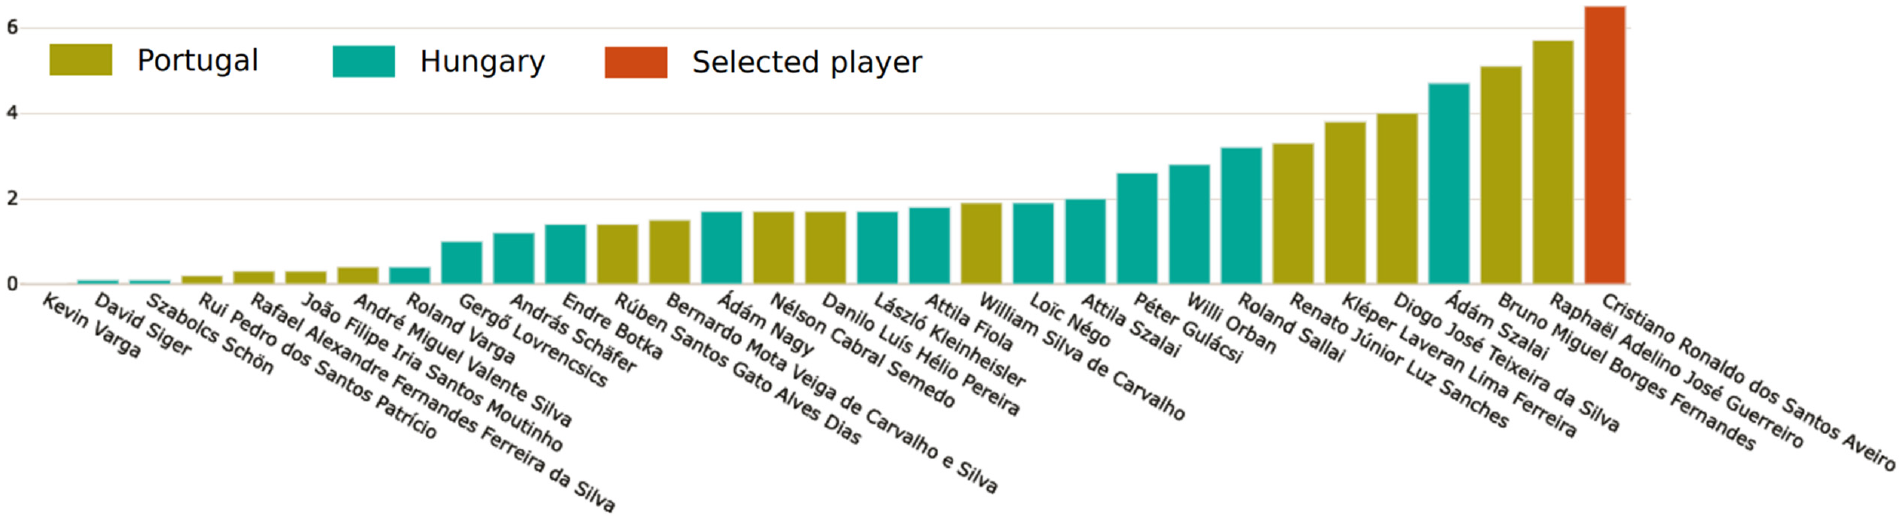
Overall rating of all players in the 2020 UEFA European Football Championship match between Portugal (yellow) and Hungary (green). The selected player (red) Cristiano Ronaldo got the highest score, which agrees with the rating given by the kicker magazine.
Detail visualizations
The scores offer an abstract summarization of the player’s performance. More detailed information for the three event types passes, shots and duels are provided in three separate pages (task T5). Depending on which event type is analyzed, an
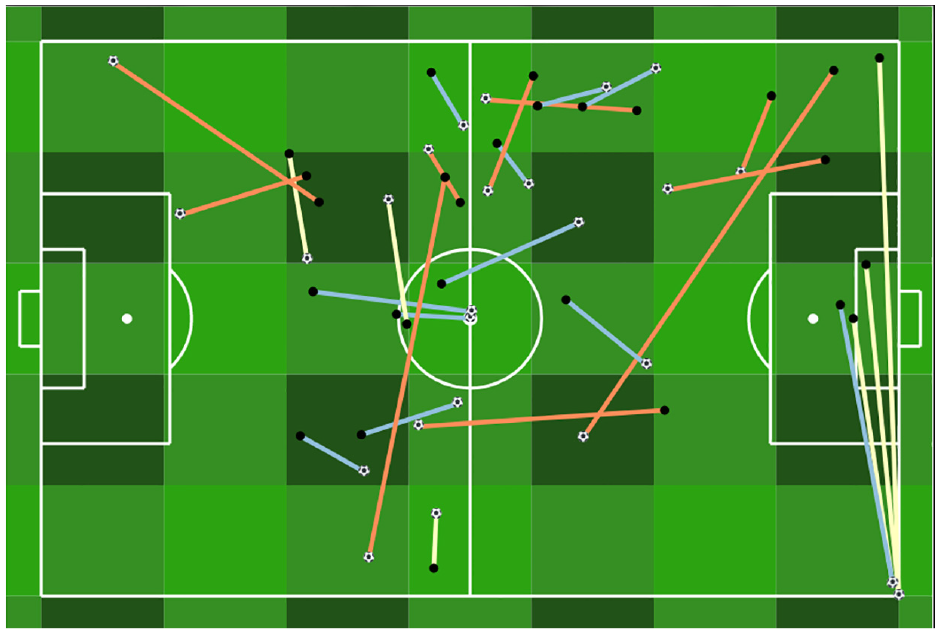
Detail visualization of all passes of a single player for a selected match. Ball icons mark the start point of the pass, while the colored lines classify defensive (blue), neutral (yellow), and offensive (orange) passes.
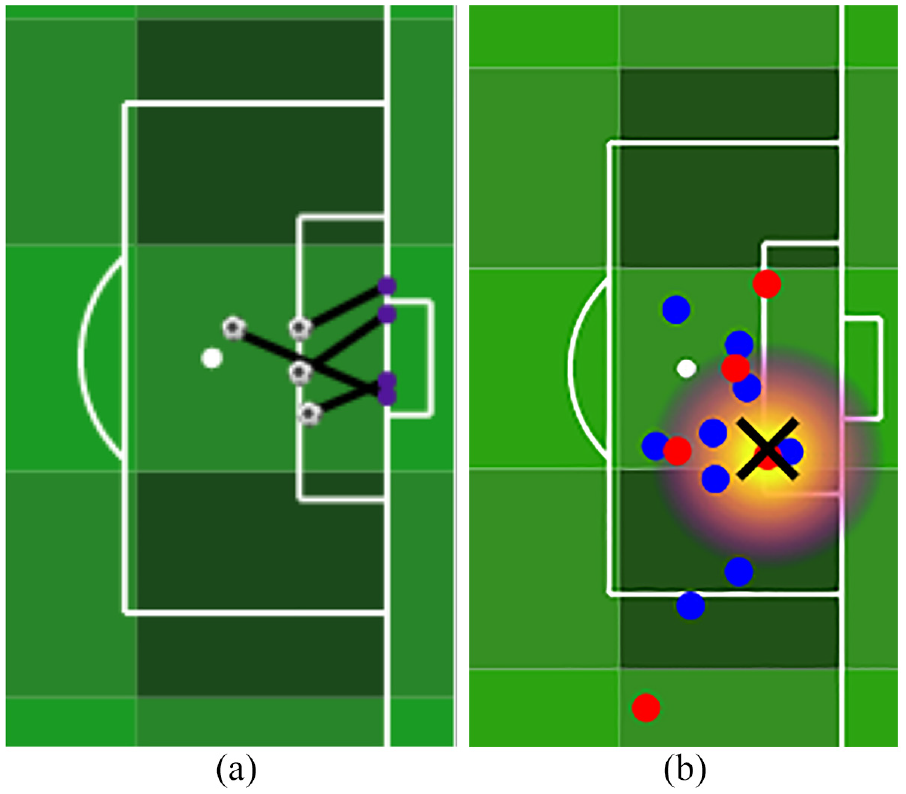
Selection of Cristiano Ronaldo’s shots (left) and duel in the proximity of the opponents goal (right): (a) all shots by Cristiano Ronaldo and (b) high pressure during duel (cross) with four opponents surrounding Cristiano Ronaldo.
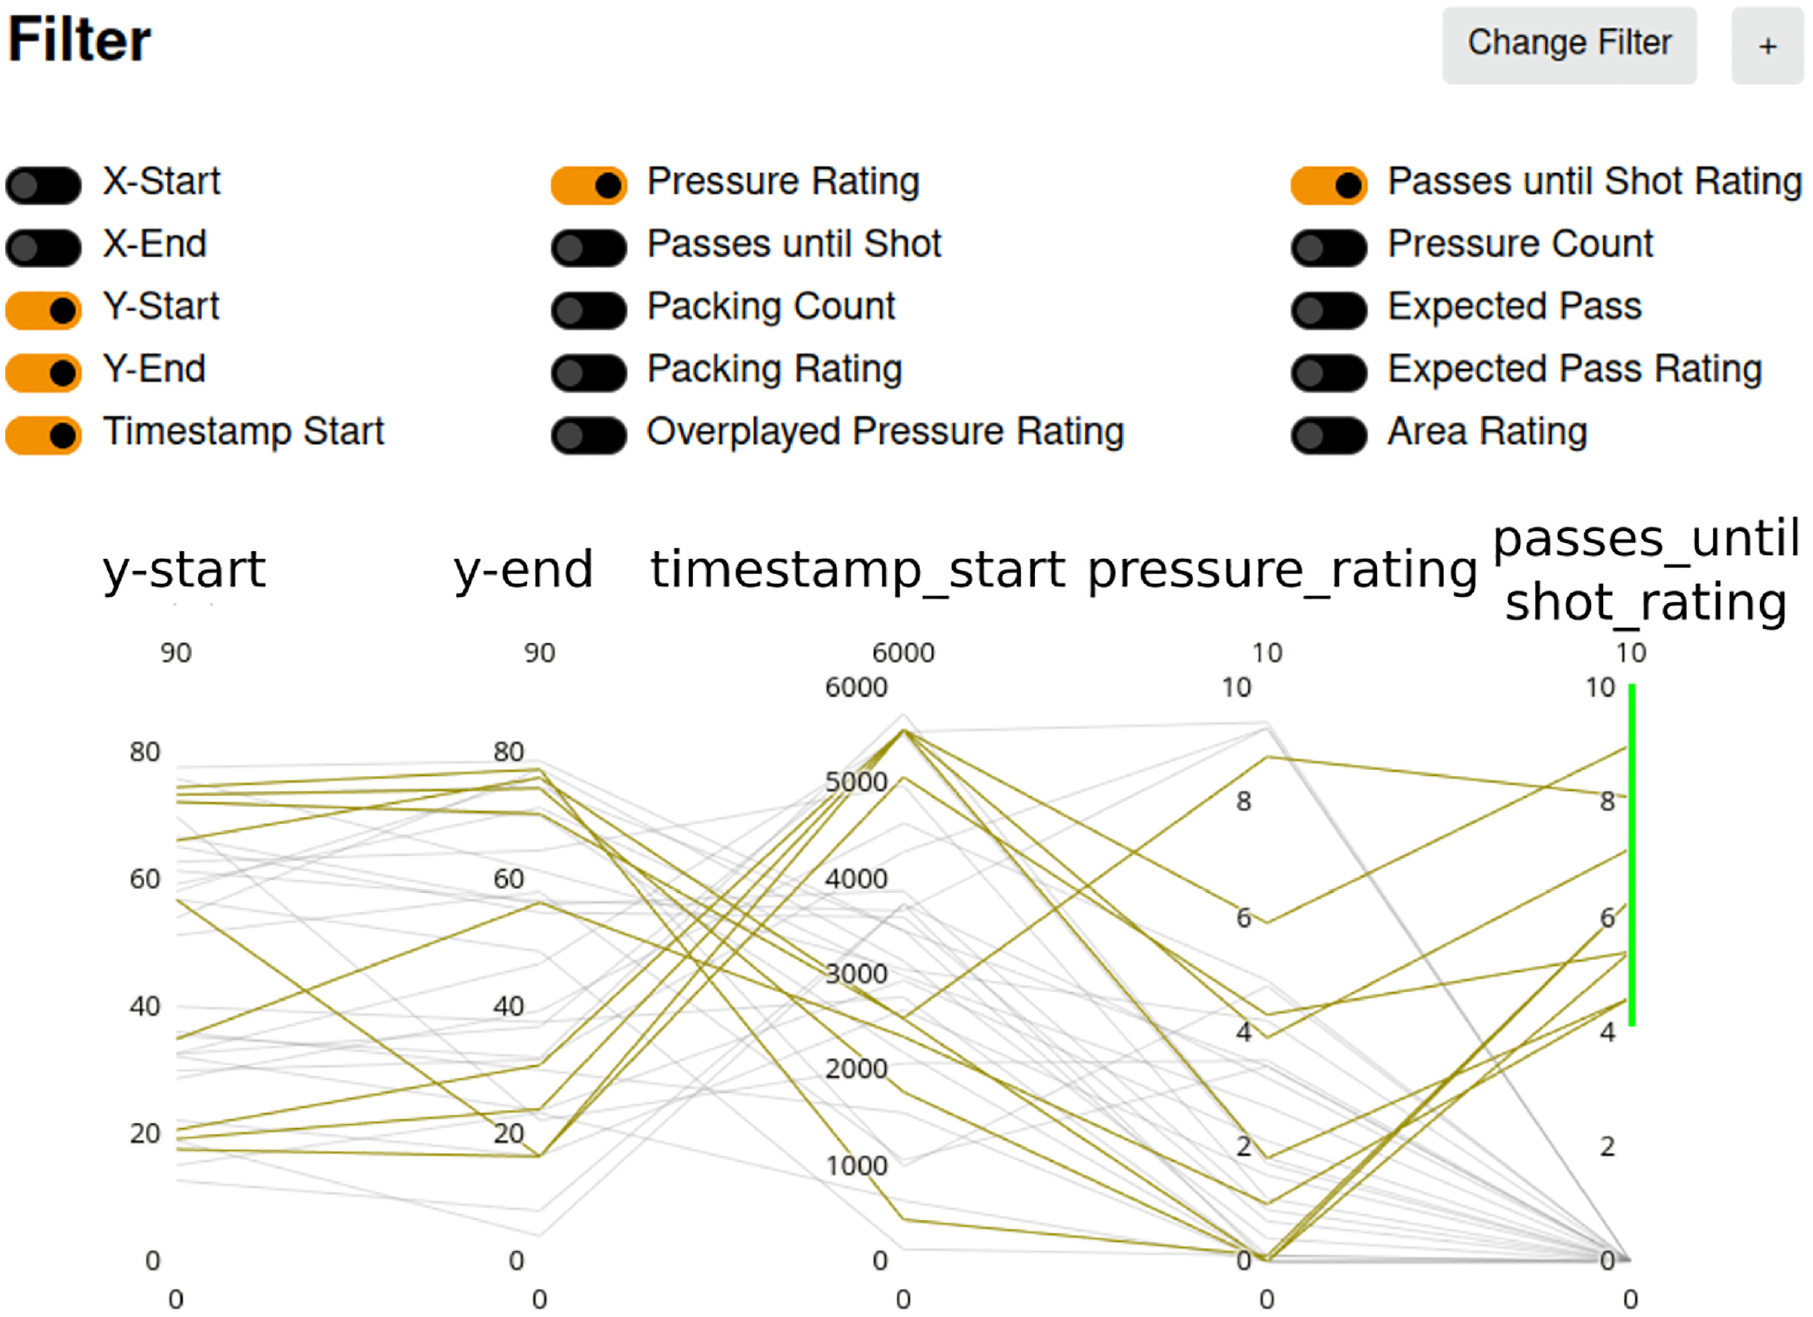
Parallel coordinates to filter passes with a high rating for passes until shot. We observe that those passes have a relatively high pressure rating.
Use cases
In this section, we demonstrate the usage of our tool by performing a detailed analysis of Cristiano Ronaldo’s performance in the Portuguese national team in the 2020 UEFA European Football Championship followed by an analysis of Toni Kroos’ performance, where we investigated whether he really avoids high-risk vertical or diagonal passes in favor of low-risk horizontal passes for what he has been criticized in German media. 38 Note that we use the terms vertical and horizontal passes as soccer jargon, that is, a vertical pass is targeted toward the opponent’s goal, while a horizontal pass is parallel to the centerline.
We chose to use the Statsbomb dataset 33 that contains the required information of all players and matches of the tournament. The Metrica dataset is anonymized and would therefore not allow us to relate the data back to actual players. The fact that we analyze the 2020 UEFA European Football Championship, a very popular event, enables us to additionally compare our ratings to those of kicker, Germany’s leading football magazine. For this magazine, journalists rate players by using grades on a continuous scale between 1 (best) and 6 (worst) that is geared to the German school grade system. Our ratings instead assume values on a continuous scale from 10 (best) to 0 (worst), as we assume this scale to be more intuitive for international users. For each of our ratings the entire dataset is taken into account, which leads to a better comparability between different matches.
Christiano Ronaldo
With 5 goals and 1 assist, Cristiano Ronaldo, an offensive player, was the best scorer of the tournament. He is also one of the top players in the world, as he received 5 out of 13 possible awards since 2008 for the world’s best football player. Hence, it is worth investigating the reasons for his success.
First, we investigate how our rating system compares to an already established grading system by the kicker magazine. We first take a look at a few selected situations to compare our ratings with the grades provided by kicker. In the match Portugal versus France, Cristiano Ronaldo received a very high grade (1.5) by kicker. 2 However, in this match, Cristiano Ronaldo did not win a single duel (duel rating 0.0) and only few passes reached their target (pass rating 3.9). Additionally, no shot could reach the goal apart from two penalty shots that Ronaldo was able to score for the team, leading to a shot rating of 4.3. This results in an overall rating of 2.7. The discrepancy to the kicker grade could be explained by the fact, that our application considers all actions during a match and of all matches. It thus provides a more objective rating than journalists, who might focus more on single events such as successful penalty shots. In the same match, Karim Benzema received the same grade (1.5) from kicker as Cristiano Ronaldo. This time, the grade can be justified by our tool. Benzema required fewer attempts to score his goals, leading to a higher shot rating of 5.9. Additionally, he could win more duels (duel rating 5.3) and hence received an overall rating of 4.5. Although this is a relatively low rating in comparison to the kicker grade, it is still the highest rating in this match. Hence, Benzema was the strongest player, also according to our tool.
In the match against Hungary, however, Cristiano Ronaldo achieved the best overall rating of 6 among all players when using our tool as well as the best grade (2) by kicker. We select this match for a detailed analysis as the match score (3:0 for Portugal) indicates many offensive actions, which should highlight the quality of Cristiano Ronaldo as offensive player. In this particular match, he achieved an average pass rating of 4.5, a high shot rating of 6.1, and a very high duels rating of 7.3, leading to the aforementioned overall score of 6. As we want to analyze his qualities as a striker, which we believe is better expressed by a high duel and shot rating than by pass ratings, we decide to modify the respective weights. Hence, we increase the shots and duels weights to 5 but leave the pass weight untouched, leading to a newly weighted overall score of 6.5. To see how Cristiano Ronaldo compares against all other players in the selected match, we visualize the ranking of all players in Figure 4. Cristiano Ronaldo achieved the highest score in this match with a substantial difference of 0.8 to the second best player, Raphael Guerreiro, who also retrieved the second best grade (2.5) from the kicker magazine.
We first want to investigate Ronaldo’s pass play. In the selected match, he has a pass accuracy of 87.5% which is quite impressive for a striker. Robert Lewandowski, in comparison, achieved an average accuracy of 79.25% in season 21/22 of the German Bundesliga, the highest value of all strikers. 39 Ronaldo’s average ball carrytime is just 1.32 s indicating a throughout fast decision making. At the same time, Ronaldo has a high pressure rating of 6.8. Because his skills as offensive player are well known, opponents try to prevent his passing game by surrounding him and building up pressure. We can use the parallel coordinates to filter for passes that led to shots on goal shortly after, see Figure 7. The parallel coordinates reveal, that the passes with a high rating in this category also have a high rating in pressure. It indicates that the opponents tried to hinder those more offensive passes.
We now interactively select and analyze the pass with the highest rating for passes until shot (pass 34). It was registered in the first minute of overtime. For the whole game, we observe a quite low expected goal success value of
Next, we investigate the duels in which Ronaldo was involved. Given a value of 7.3, he again is the strongest player according to the overall rating for duels in the selected match. However, he could only win 43% of all duels, which is much lower than his average of 59.1%, achieved at Juventus Turin in season 2020/2021. It is noteworthy that Ronaldo’s pressure rating is 9.8 on average and area rating is 9.1, both very close to the maximal possible value. This, most likely, is again due to the opponent pressuring him as much as possible, trying to disturb his play. It is worth mentioning that most of the duels that he could win appear to be in proximity of the opponent’s goal, as indicated by the high average area rating. We utilize parallel coordinates to select only duels that were followed by a goal, from which we select the one closest to the goal (area rating 9.5). We visualize the pressure zone which highlights that there are four opponents gathered around him, leading to the pressure rating of 9.1, see Figure 6(b).
In conclusion, the in-detail analysis could highlight some of the strengths in Cristiano Ronaldo’s play. He reacts very fast, even under high pressure, indicated by the opponents proximity and the ball carrytime. In the investigated match, he sought the proximity to the goal and could successfully transform half of his shots into a goal. Finally, we would like to refer to the Supplemental Video for a better understanding of the interactions that have been performed to achieve these results.
Toni Kroos
Toni Kroos has been given the nickname “Querpass-Toni” in German media, 38 which implies that he majorly plays low-risk horizontal passes with low gain for his team instead of risking vertical or diagonal passes. In the following, we will investigate Kroos’ performance to check if his nickname is justified. Here, we take into account all four games of the German national team within the 2020 UEFA European Football Championship.
In a first step, we adapt the weights of the proposed scores to adapt the scores to midfield players like Toni Kroos. In contrast to the analysis of strikers like Ronaldo, passes and duels are more important than shots, which is why we give them five times the weight of shots. Additionally, the passes until shot are considered less important for midfield players than for strikers, which is why we give them less weight than to the other criteria. While the area rating for passes includes information about the distance traversed by the pass, the area rating for duels is mainly formed by the position. Therefore, we also assign less weight to the duel area rating. The final weights for the different scores are visualized in Figure 8.
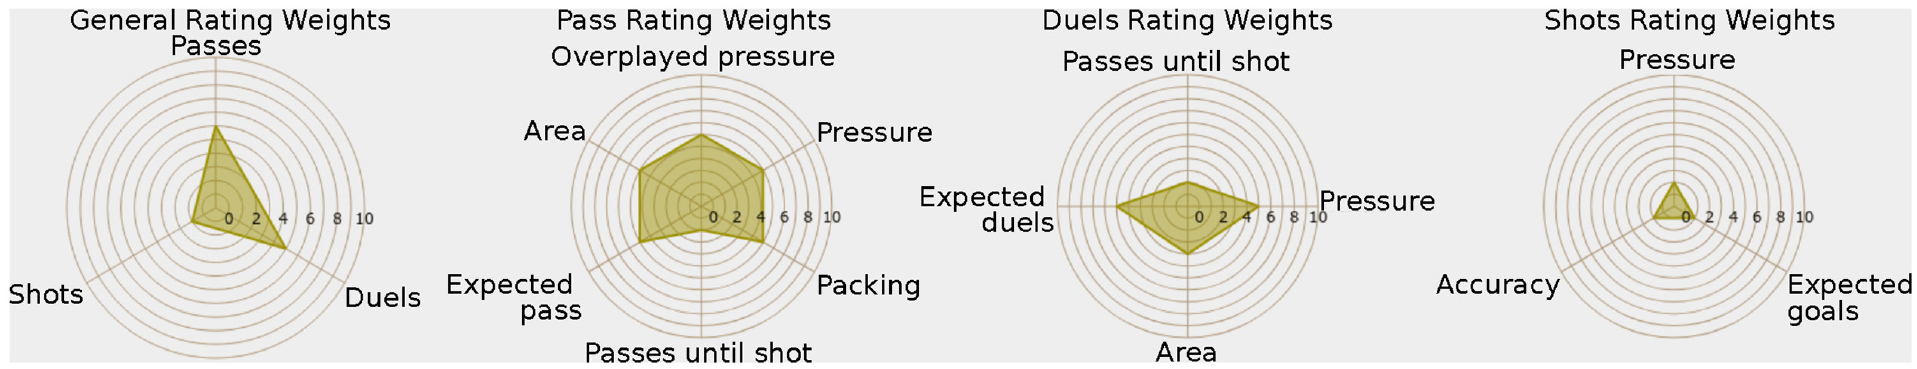
User-defined weights for the analysis of midfield players. In general, the importance of shots was considered significantly lower than those of passes and duels. Additionally, the passes until a shot on goal is considered less important than other passing or duels ratings.
With an overall score between 4 and 4.7 Toni Kroos achieved a ranking close to the average for each of the four games. However, the individual scores reveal that, for three out of four games, he achieved the highest score in passes among all players. The different ratings for the individual games are shown in Figure 9. High numbers of passes between 65 and 102 passes indicate that he has many ball contacts. One first indicator that might explain the name “Querpass-Toni” are the very low ratings for the passes until shot on goal. This rating did not exceed 3.1 for the four games, which indicates that he did not focus on having assists to goals. However, as discussed above, this rating was not considered particularly important for midfielders. On the other hand, we can observe that especially the packing rating as well as the area rating are high, which indicates that he actually tends to play long-distance passes that take out many opponents, which would contradict his nickname.
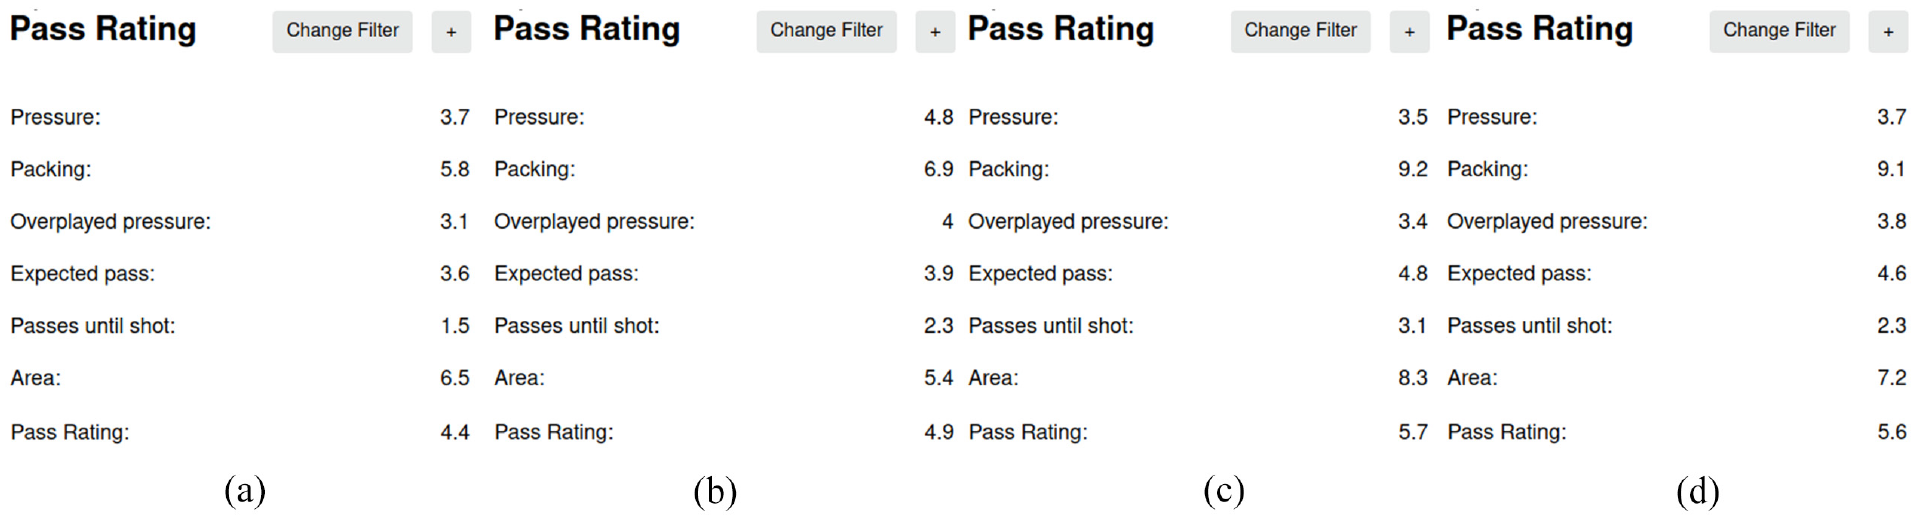
Scores for individual pass ratings of Toni Kroos for the four championship games against Portugal (a), England (b), Hungary (c), and France (d).
To analyze this observation in more detail, we investigate the passes further. The parallel coordinates plots in Figure 10 reveal that the tendency to play vertical forward passes strongly depends on the game. While there are relatively few of them in the game against England, a clear trend toward playing vertical forward passes is visible in the game against Hungary, where the number of passes as well as the pass accuracy was also significantly higher. Overall, one can observe that the nickname might be explained by the passing behavior in some games, but is definitely not justified in general. We also observe that Toni Kroos still ranks relatively high when compared to other players, if the weights are adjusted to account for the different aspects that are important for different positions, which indicates that he is generally doing well in all ratings.
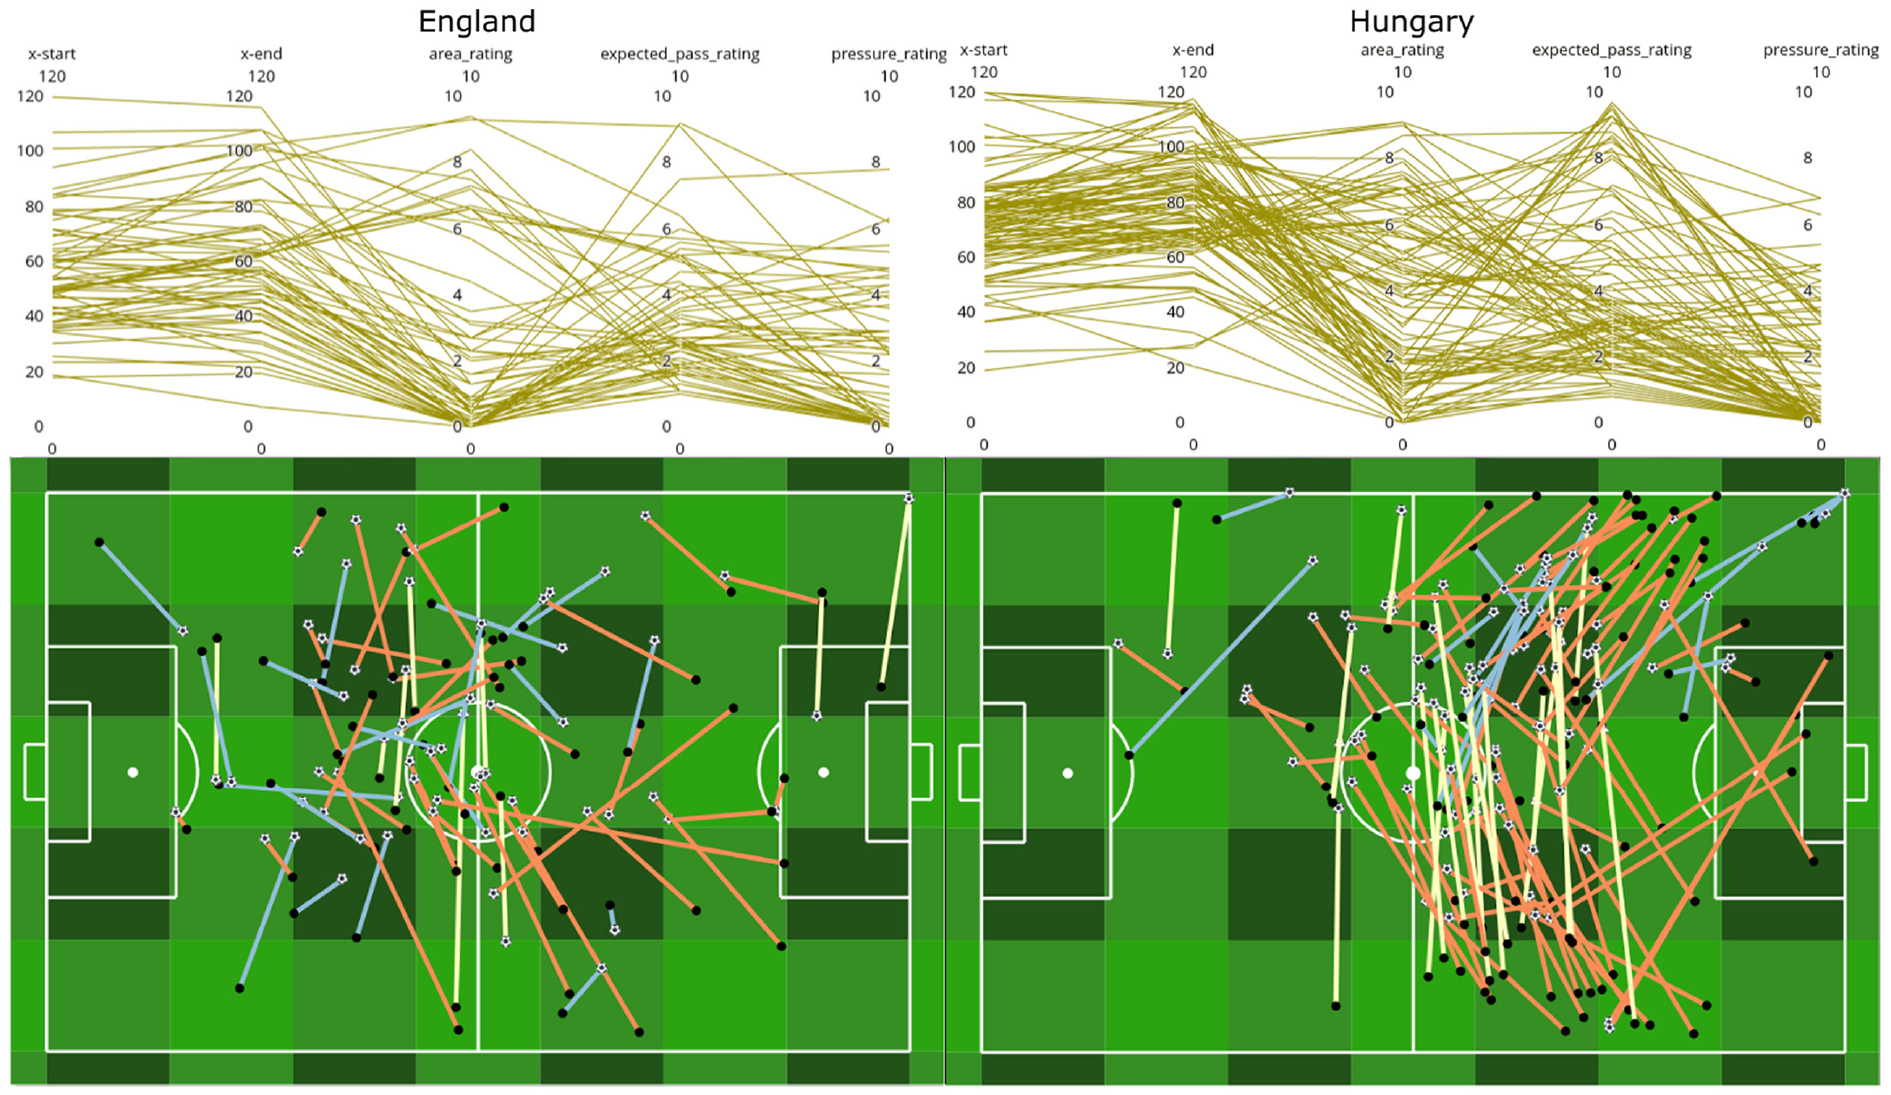
Comparison between the passes of Toni Kroos (Germany) in the game against England (left) and Hungary (right). In both field visualizations, the left goal is that of the German team, while the right goal is that of the opponent. The first observation is that the number of passes in the game against Hungary is higher and closer to the opponent’s goal. Moreover, while the passing direction in the game against England is relatively balanced, the passes in the game against Hungary tend to be played in a forward direction as can also be seen in the more dominant orange color.
Discussion and conclusion
We presented a visual analytics approach for analyzing the performance of soccer players. It is based on a set of objective, data-driven ratings to quantify different aspects of the performance of soccer players. The quantifiable categories are passes, duels, shots and the combination thereof. We embedded the ratings into an interactive visual analytics tool allowing for interactive adjustments of the weights assigned to the ratings, an overview analysis of each of these categories, and detail visualizations for further investigations up to individual events. We demonstrated our system by analyzing the performance of Cristano Ronaldo in the 2020 UEFA European Football Championship and comparing it to ratings by popular magazines as well as studying the passing behavior of Toni Kroos. By analyzing a striker and a midfield player, we showed how our tool can be flexibly adapted to the analysis goals by interactively changing the weights.
Currently, our tool allows the user to identify strengths and weaknesses of a player in a particular match. The general approach could be easily generalized to other team sports, and only single visual encodings need to be adapted, such as the visualization of the pitch. However, several data-driven ratings are specific to soccer, such that specific ratings for other team sports would need to be developed. Generalizing the evaluation of single players to incorporate entire championships is straight forward by aggregating over the games, even though handling all events of an entire championships might become computationally a challenge. It would also be desirable to be able to analyze multiple matches at the same time and how a player’s performance varies between them. Currently, a comparison between different matches and players is only supported by juxtaposing different program sessions. We plan to extend our tool to allow for a direct comparative analysis in the future. Moreover, we plan to conduct a user study and reach out to potential users such as coaches or journalists to evaluate and further improve our tool.
Footnotes
References
Supplementary Material
Please find the following supplemental material available below.
For Open Access articles published under a Creative Commons License, all supplemental material carries the same license as the article it is associated with.
For non-Open Access articles published, all supplemental material carries a non-exclusive license, and permission requests for re-use of supplemental material or any part of supplemental material shall be sent directly to the copyright owner as specified in the copyright notice associated with the article.