
Abstract
The anchoring effect is the over-reliance on an initial piece of information when making decisions. It is one of the most pervasive and robust biases. Recently, literature has focused on knowing how influential the anchoring effect is when applied to information visualization, with studies finding its reproducibility in the field. Despite the extensive literature surrounding the anchoring effect’s robustness, there is still a need for research on which individual differences make people more susceptible. We explore how Locus of Control influences visualization’s ubiquitous and resilient anchoring effect. Locus of Control differentiates individuals who believe their life depends on their behavior or actions from those who blame outside factors such as destiny or luck for their life’s outcomes. We focus on the relationship between Locus of Control and the anchoring effect by exposing subjects to an anchor and analyzing their interaction with a complex visualization. Our results show that the anchoring strategies primed individuals and suggest that the Locus of Control plays a role in the susceptibility to the anchoring effect.
Introduction
Nowadays, people leverage complex interactive visualizations for data analysis purposes in several domains.1–3 The two main contributing factors to a cognitively engaging and complex interactive visualization are exploratory analysis and hypothesis generation/validation. Mental models are internal representations individuals construct when interacting with a visualization,4,5 which allow people to make sense of and understand large quantities of data. 6 However, whenever individuals engage in complex cognitive thinking under uncertainty, their judgments and decisions may rely on heuristics. 7 These heuristics can lead to systematic deviations from rational thinking, referred to as cognitive biases. 8
Since information visualization (InfoVis) aims at supporting complex thinking under uncertainty,9,10 user interaction with information visualization systems is often sensitive to individual differences and cognitive style. Nevertheless, a recent survey 11 reported a small body of knowledge regarding the impact of cognitive biases in InfoVis. Previous research has confirmed the impact of individual differences on the interaction process with a visualization. For instance, Conati and Maclaren 12 showed that an effective way to improve user performance relies on tailoring a visualization selection based on perceptual speed.
Among the studied individual differences factors, there has been some interest surrounding the personality trait Locus of Control (LOC). This trait shapes the degree to which people perceive their life’s control as dependent on their actions or outside factors such as powerful others, luck, or fate. Several studies tackled how LOC may impact effectiveness, performance, preference, and strategies employed in InfoVis (e.g. Brown et al., 13 Ottley et al., 14 and Delgado et al. 15 ). Nevertheless, to the best of our knowledge, no current work in the InfoVis state-of-the-art focuses on analyzing the resiliency of cognitive biases through the lens of Personality Psychology.
We focus on the Anchoring Effect (AE), or the over-reliance on an initial piece of information (the anchor) when making decisions. 16 Several studies have confirmed the presence of the AE in InfoVis, reinforcing its robustness and pervasiveness.17,18 We believe that anchors may act as outside forces while individuals interact with InfoVis. Since LOC captures the degree to which individuals believe that external factors play a significant role in shaping events in their lives, we hypothesize that exposing an individual to anchors may make them more susceptible to consider the anchors and, consequently, be primed. In this light, we decided to study the relationship between LOC and the AE to provide an initial understanding of whether personality may make one more susceptible to systematic deviations of rational thinking.
We prototyped a visualization dashboard that enabled the completion of complex and cognitively engaging tasks to allow the manifestation of the AE in participants. In particular, we employ two priming strategies to trigger the AE. First, we developed video tutorials that prime participants to interact more with a specific visualization view. Second, we used task framing to manipulate the order we presented filtering information to the subjects to focus on the priming objective. Afterward, we conducted experiments with participants N = 69 to understand whether individuals with different LOC scores behaved differently based on their interactions with those anchors. Our work contributes to the literature by providing initial steps regarding the relationship between LOC and the AE. We believe our contributions can provide a further understanding to future studies that leverage personality-aware mechanisms to understand the impacts of AE.
Related work
In this literature review, we present related work, covering how the AE has been studied in InfoVis contexts, as well as how personality constructs can improve the understanding of the use of data visualization systems.
The anchoring effect
The AE has a remarkable influence on human judgment due to its extreme robustness and pervasiveness. 16 As such, it has been a core subject of study over the years in many fields such as general knowledge, 8 legal judgments, 19 negotiations, 20 price estimates, 21 and self-efficacy. 22 In one demonstration of the AE, 8 researchers initially asked people to compare the percentage of African nations in the UN to a randomly generated number. The participant’s task was to indicate whether the percentage of African nations in the UN is higher or lower than this anchor number. After this comparative judgment task, participants received a second absolute task in which they were to give their best estimate of the percentage of African nations in the UN. Findings indicated that specific estimates assimilated toward the anchor provided in the comparative task.
InfoVis literature includes many pieces of research confirming the presence of the AE, as well as several priming triggers. George et al. explored whether the anchoring bias transfers to visual analytics with a simple visual interface regarding house appraisals, priming individuals with the decision-making task of estimating the price of houses. 23 The authors showed each participant an initial value for a house (the anchor) and then several pieces of information, including pictures of the house and prices of houses with similar characteristics. In particular, the anchor could vary between high and low initial values, and results show that the estimates were close to the initial values shown to the participant.
Other researchers attempted priming the user with a specific view 18 of a visualization, leveraging training videos showing the users definitive examples to use the visualization to complete tasks while focusing on a single view, considered the anchor view. Cho et al. 18 used task framing when providing assignments to the users by changing the order of the information in the tasks, given that the initial info was about the anchor view. The authors found that inducing the AE in participants affected their interaction process by leading them to spend more time interacting with the anchor view. Another work leaned toward repeated exposure to a constant visualization. 17 The study focuses on better understanding the temporal effects of repeated exposure to visual stimuli. Valdez et al. 17 defined a set of five studies with visual class separability in scatterplots as a task example. These tasks made humans judge the class separability of the same scatterplot differently depending on the scatterplots they have previously seen. The authors found evidence for the existence of the AE in class separation tasks of bi-variate normally distributed scatterplots. In particular, deciding whether two clusters are separable relies on how far they are apart and how far previously seen groups are apart. With this in mind, the AE establishes itself by playing a relevant role in individuals’ interaction. However, the AE is not the only factor to consider when tackling user interaction in InfoVis as researchers found that outside elements such as the users’ personality factors significantly impact task performance and idiom preference.
Personality factors
Many studies tackled the impact of individual differences in their interaction process. Toker et al. 24 showed that user characteristics correlate with performance using a visualization. Findings revealed that perceptual speed, verbal working memory, visual working memory, and visualization expertise significantly impacted task performance, ease-of-use ratings, and idiom preference ratings. Beyond individual differences, personality factors also became a focus of research (see Liu et al. 25 for a survey). For instance, Brown et al. 13 could infer LOC, extraversion, and neuroticism scores based on user interaction data. More recently, Alves et al. 26 found that neuroticism, openness to experience, agreeableness, several facets from each trait, and the external dimensions from LOC mediate how much individuals prefer certain visualization idioms in hierarchy and evolution contexts. With this in mind, the current body of literature provides an opportunity the study the existing relationship between the users’ personality profile and the AE. In particular, we focus on LOC.
Rotter27,28 defined the LOC based on how individuals develop their own belief in causality between an event and an outcome based on their experience with similar cause-and-effect occurrences. Therefore, LOC explains how people change because they are continually affected by experiences in their lives. More precisely, it involves generalized beliefs about the controllability of the environment that are not limited to specific contexts (e.g. at work) or times (e.g. last week). 29 The LOC model describes the orientations as two different aspects – internal and external –, which differ based on environment reinforcements. Internal LOC is related to internal reinforcement since some event or environment highlights the value of an individual. In contrast, external LOC is linked to external reinforcement because it addresses how some event or environment yields benefit for the group or culture to which the individual belongs to. 30
Research shows that LOC affects the completion times with procedural tasks and the number of insights given. 31 Green and Fisher 31 found that Internals were faster at solving procedural tasks. Moreover, Externals provided more self-reported insights. Recent work by Delgado et al. 15 also showed that the Internal dimension affects performance with visualizations for high-dimensional data. Another relevant body of literature by Ziemkiewicz et al. 32 revealed that Externals were more efficient at using a visualization that used a highly explicit visual metaphor than Internals. Furthermore, Ottley et al. 14 analyzed the search strategies employed by Internals and Externals with two different hierarchical visualizations - indented trees and dendrograms – to investigate how the LOC trait impacts behavioral patterns. Findings proved that Internals are more likely to perform better than Externals when the visualization design is more exploratory and allows them to explore the data freely and according to their mental models without imposing a strategy. Externals in this scenario are likely to give up, needing guidance from the designer. However, Externals are more likely to perform better than Internals in visualization designs that impose specific search strategies and rules since they can adapt better to unknown strict representations.
Personality factors and the anchoring effect
Several personality traits from the Five-Factor Model (FFM) have been shown to regulate how susceptible individuals are to cognitive biases. Eroglu and Croxton 33 found that participants with high conscientiousness and agreeableness and low extraversion are more susceptible to the anchoring effect in forecasting activities. McElroy and Dowd 34 also showed that the anchoring effect influences more likely individuals with high openness to experience individuals while estimating values. Regarding the LOC, prior research shows mixed results. In decision sciences, LOC showed a significant moderating effect in the relationship between investment decisions and the anchoring bias.35,36 In contrast, Eroglu and Croxton 33 reported that LOC has no effect on forecasting biases, including the AE.
We can observe that the state-of-the-art strongly converges on LOC, playing an important role in human interaction with visualizations. We believe that it opens an opportunity to explore if LOC alone can provide a better understanding of the susceptibility to the anchoring bias. Although these studies do not provide a clear-cut effect of LOC on the susceptibility to the anchoring bias, past visualization research shows we can verify the anchoring effect through user interaction logs. 18 We expect that anchoring the participant and cross-referencing the interaction logs with the LOC may provide further insights into what makes an individual susceptible to the anchoring effect when using visualization. Consequently, it may enhance the characterization of the user profile with personality features to regulate the priming effect and promote more rational decision-making.
Methodology
This section introduces the interactive visualization developed for our study and details its possible interactions. We then describe how we are inducing and measuring the AE, ending with a brief overview of the procedure employed in the study.
CrashVis
Past research has replicated the anchoring effect in the laboratory and the field. 37 We ground our experimental design in the best practices of controlled experimental studies to elicit the anchoring bias. In particular, we opted to follow the design principles of Crystal ball 18 to create our apparatus. We implemented an interactive visualization called CrashVis (Figure 1). CrashVis has a Coordinated Multiple Views (CMV) design 38 by employing multiple perspectives to analyze the data and where each complements the other. It provides the flexibility of using different strategies to explore the causes of airplane crashes throughout time and location. We selected this dataset because it has properties amenable to our elicitation techniques. In particular, the user can see each crash event’s date, geographical location, and description. While a plane crash is a familiar concept, the history of plane crashes is unfamiliar to the average participant. We used a public dataset available at Kaggle (https://www.kaggle.com/datasets/saurograndi/airplane-crashes-since-1908 (Last checked at Wed Nov 01 17:10:37 2023.)). Therefore, this choice of dataset allows participants to understand what each item represents while making it likely that the distribution is unknown, prompting an exploration. Since we can study the priming effect through user exploration and interaction logs, we believe that this dataset is adequate to use in our experiment.
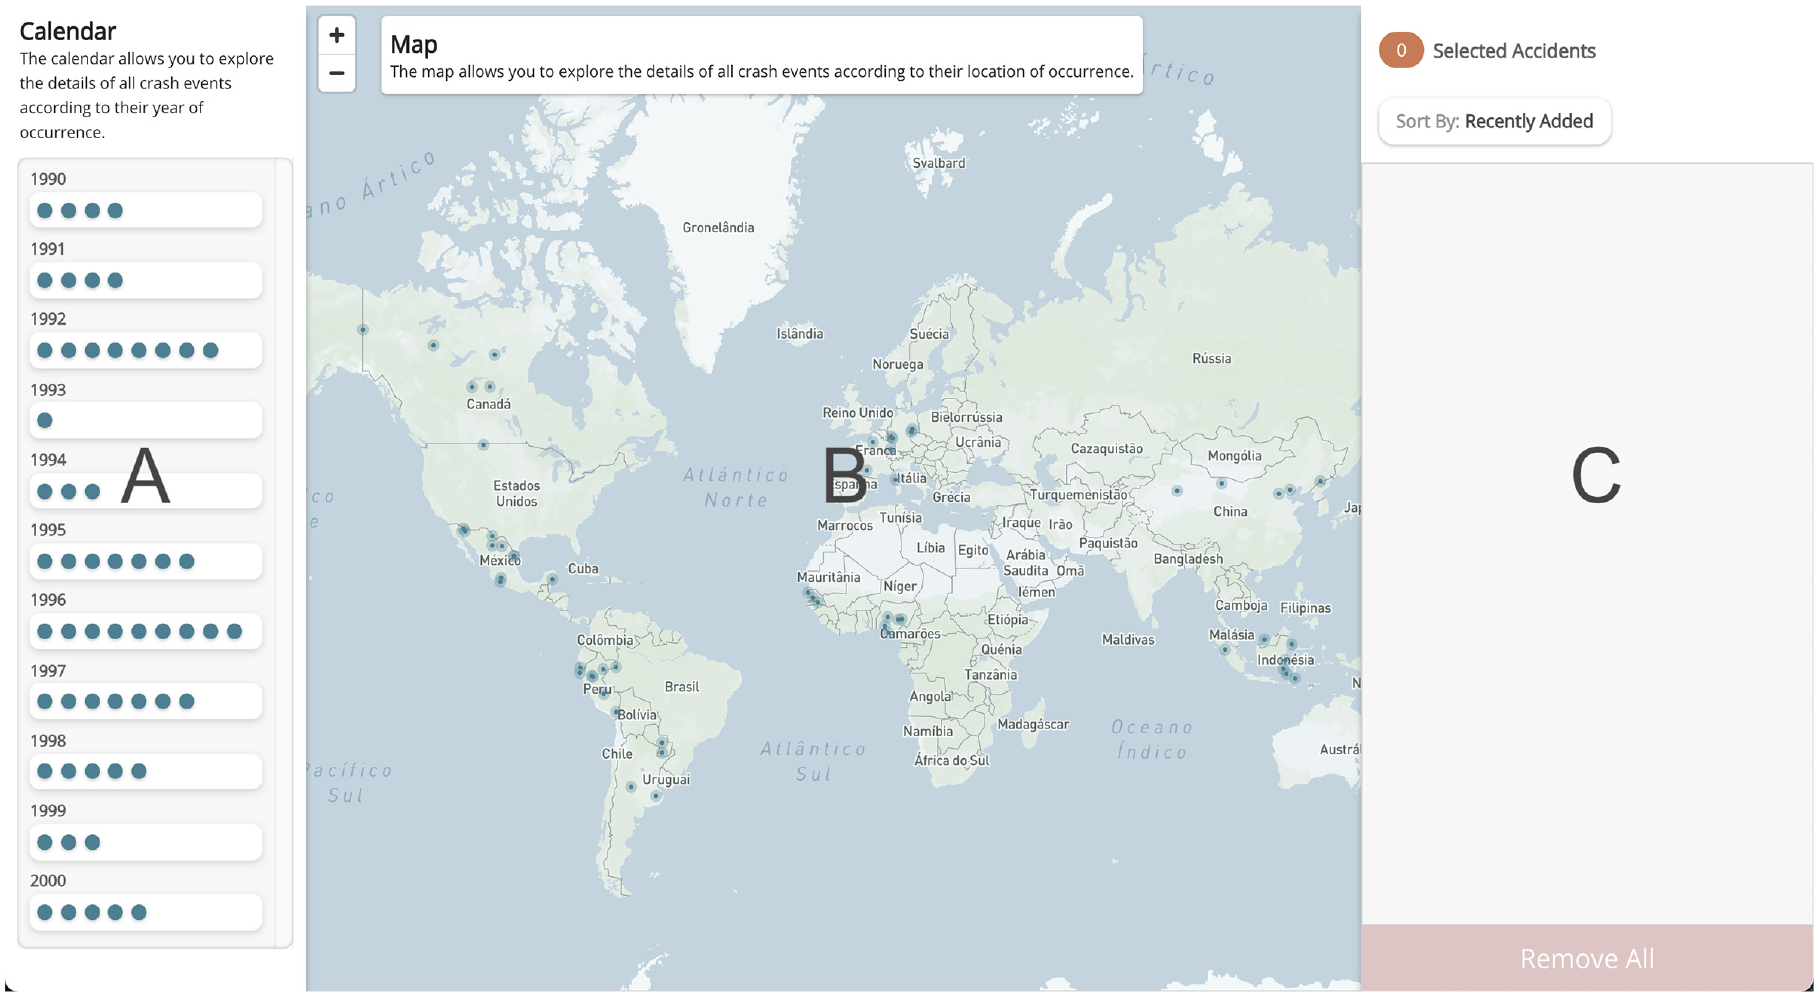
Screenshot of the CrashVis visualization system used in the experiment to study the priming effect. The interface has two views as anchors; while the calendar view (a) displays plane crashes on a time granularity, the map view (b) uses geographical data to present the dataset. There is also an overview tab (c) which acts as a supporting view to allow the user to learn more in-depth about a selection of crashes.
Views and Interactions in the CrashVis Interface CrashVis contains three views: map, calendar, and overview tab. The map view shows airplane crashes as blue circles scattered throughout the world with a geographic location encoded as latitude and longitude (Figure 1(b)). The map lets the user check the location by panning or zooming to show specific crash events in a region of interest. The calendar view also displays the same crash events as blue circles (Figure 1(a)). In ascending order, these circles are grouped by year between 1990 and 2000. The user can hover circles to highlight the corresponding event in the map and calendar view. Hovering a circle triggers the visibility of a container next to the circle with the details of the crash. Clicking on a circle in either view will change its color to orange, and select them to appear in the overview tab (Figure 1(c)). The overview tab contains a list of selected airplane crashes, with detailed information for each one.
Only the map and calendar views are driving views, capable of driving the interaction process for the participants to complete the experiment tasks. The implemented interactions allow users to perform exploratory analysis to support decision-making tasks. In particular, we asked participants to estimate the number of plane crash events in a given period and location. Since the map and calendar views support geo- and time-based analysis, the actions participants take within CrashVis reflect their decision-making process. This design rationale is similar to the one applied by Cho et al. 18 We defined and logged 10 unique user interaction types while participants completed the decision-making tasks (Table 1). CrashVis records all user interaction logs in a database with a timestamp and the participant’s identifier.
User interaction logs.
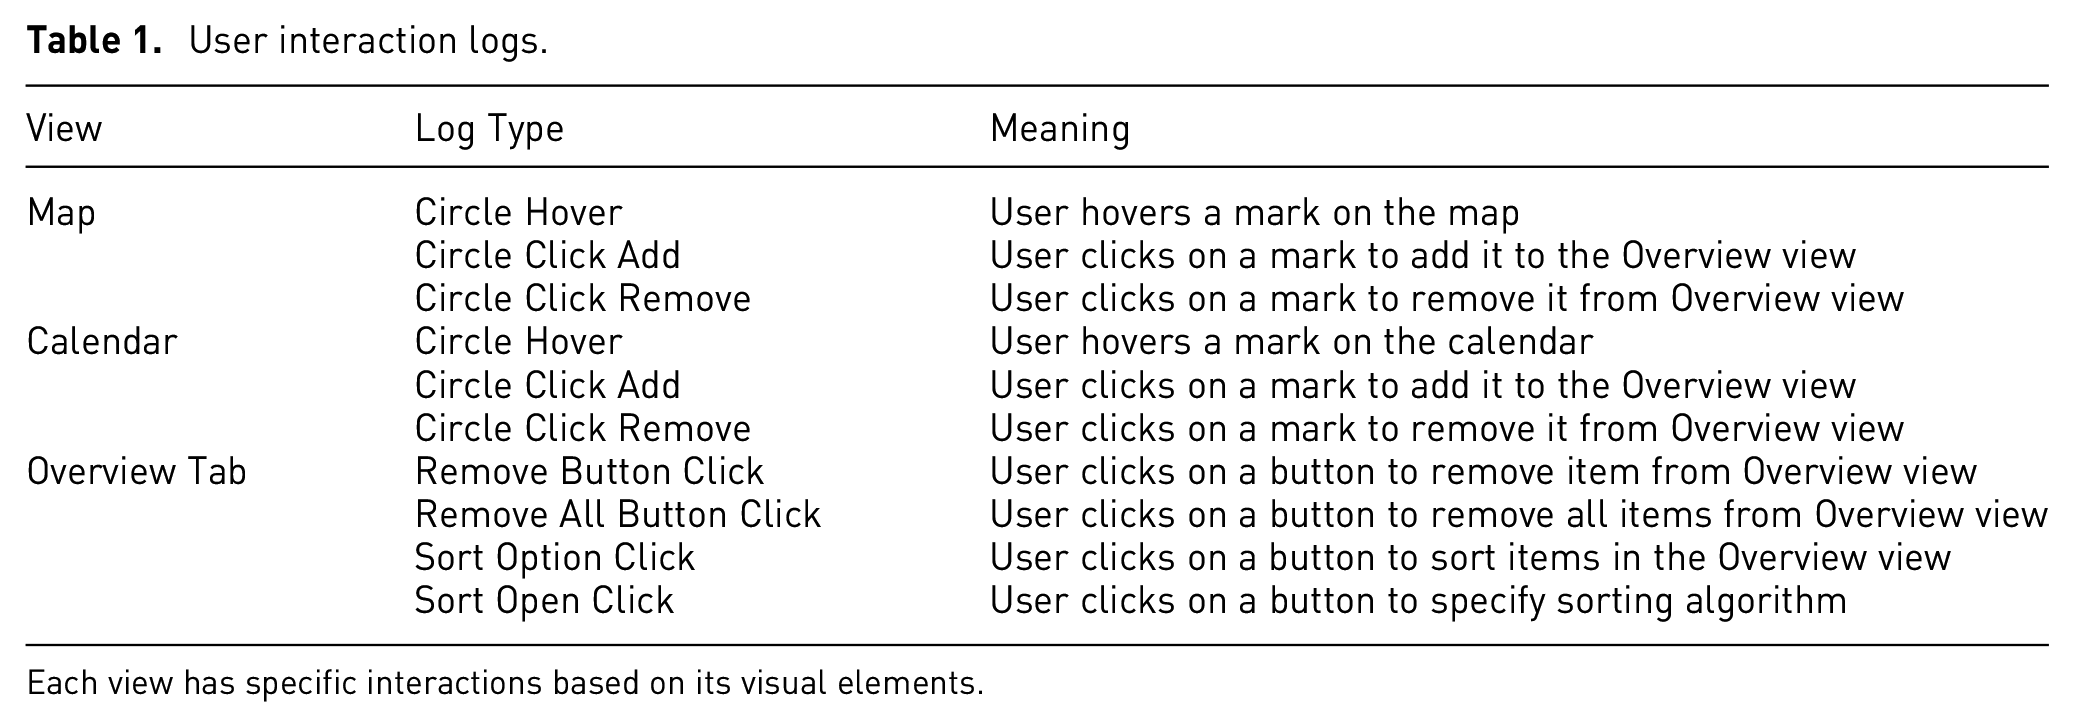
Each view has specific interactions based on its visual elements.
Anchoring strategies
To induce the AE, we directed the participants’ focus toward one of the driving views of the CrashVis interface (map or calendar). Previous work has demonstrated how providing a visual anchor to the users affects the subsequent interaction process by leading them to spend more time interacting with the visual anchor. 18 In that same study, Cho et al. 18 leveraged two visual anchor conditions to compare, each associating the visual anchor with a view from the visualization. Just as Cho et al. 18 used a geo-related view and time-related view as the visual anchors, we leverage the map view and the calendar view as the candidates for priming the users and directing their attention. We want to confirm the presence of the AE across different anchor conditions by verifying that most of the interaction focused on the respective visual anchor. In total, we have three anchor conditions: Map Anchor condition (map view as the visual anchor), Calendar Anchor condition (calendar view as the visual anchor), and No Anchor condition (no visual anchor) serving as a baseline of comparison. Lastly, Cho et al. 18 resorted to two techniques, described below, that attracted the users’ focus to the visual anchor provided, which we will also employ in this study.
Video Training was achieved before instructing the users to interact with CrashVis. We presented a total of two videos to the participant. The first introduces CrashVis by showcasing all possible interactions on the map, calendar, and overview, while the second varied according to the anchor condition. In case the participant was associated with the Map Anchor or to the Calendar Anchor condition, they viewed a video that showed the completion of a specific use case scenario in the CrashVis interface in which a user is completing a task leveraging the visual anchor only, for example, “Estimate the total amount of airplane crashes caused by bad weather, in South America, between 1992 and 1994 (inclusive).” An anchoring mechanism primes the individual to interact with a specific view by focusing mainly on the visual anchor. However, if the participant was not supposed to be biased to any visual anchor, known as the No Anchor condition, we did not provide a second video since we did not want to anchor the user to any specific view.
Task Framing was also leveraged to induce the AE. We designed a set of two tasks to prime the individual to interact with the map view and another two with the calendar view. Cho et al. 18 created four tasks but only provided one task during the interaction process to verify the presence of the AE. In contrast, we decided to use two tasks from the four created during our experiment to check if the AE lingered even after becoming familiar with the visualization after completing the first task.
Each task asks the participant to estimate the count of airplane crashes and satisfies three filters: location, time interval, and cause of the crash. In particular, for the tasks designed to anchor the participants on the map view (T1 and T2), we first mention a specific location and afterward the time range, and vice-versa for the calendar view (T3 and T4). The set of tasks is as follows:
T1 Estimate the total amount of airplane crashes caused by engine failure, in South America, between 1992 and 1994 (inclusive).
T2 Estimate the total amount of airplane crashes caused by fuel outages, in Mexico, between 1994 and 1996 (inclusive).
T3 Estimate the total amount of airplane crashes caused by engine failure between 1992 and 1994 (inclusive) in South America.
T4 Estimate the total amount of airplane crashes caused by fuel outages between 1994 and 1996 (inclusive) in Mexico.
Priming on a visual anchor with the task framing method strategy relies on adjusting the order of the information in the tasks presented to the participants. The information that appears first is the one related to the visual anchor since it proved to be effective in enhancing the AE in InfoVis. 18
Measures
Locus of Control is usually measured with the Rotter Scale. 28 However, further work by Levenson 39 showed that LOC could be analyzed more in-depth by differentiating the external LOC in two scales: Powerful Others and Chance. Consequently, we measure the scores of the LOC dimensions with the European Portuguese version of Levenson’s multi-dimensional IPC scale.40,41 It has 24 items measured with a six-point Likert scale, with eight items for each of the subscales – Internal, Powerful Others, and Chance. The result of each subscale results from adding the numerical answers of the items for that subscale.
Demographic information was also gathered about each participant. We included questions regarding age, gender, and education, whether the participant had normal or corrected-to-normal vision, and if they were colorblind. Regarding InfoVis, we assessed the participants’ familiarity with a CMV design and the data domain of our interactive visualization using Likert scales ranging from 1 (Heavily Unfamiliar) to 7 (Heavily Familiar). These questions allow us to test for prior knowledge surrounding the domain, which could make individuals perceive information on a visualization differently according to their knowledge. 42
User Interaction was a relevant factor to store since it reflects the measurement of the AE. We log each sequence of interactions throughout the participants’ interactive session with our visualization. For each interaction, we record four main attributes: the timestamp of the occurrence, the view where it took place, the type of interaction, and a detailed description of the interaction. We then compute two objective metrics from the interaction logs to measure the AE. The first is the time spent in each driving view (interaction time). We calculate the total time by considering the accumulation of intervals between timestamps of interactions that indicate the transition from one graph to another in the visualization. We added the time difference to the view corresponding to the latter action whenever a change occurred. For example, if a user starts the interaction and clicks on the map view, the time difference is added to the map view. We only record the time spent in both visual anchors since these are the most important for comparing and for which we want to prove that there is a significant change between the visual anchor conditions.
Another measure is the number of interaction events triggered in each view (interaction volume). While interacting with a view, users could trigger hover and click events on each mark. We counted all triggered events throughout the experiment. The last metric we analyze is the path of interactions performed by the participants. 18 To study it, we use weighted directed networks where nodes correspond to interactions and edges are chronological pairs of interactions. The networks allow us to cluster interactions with the community detection algorithm developed by Blondel et al. 43 It unfolds a complete hierarchical community structure for the network by considering the weighted links between nodes. The community-detection algorithm is grounded on a modularity principle. It measures how well a network decomposes into modular communities, where a community is a set of vertices denser inside than out. In addition, the networks also allow for ranking each node according to its importance. We estimate the importance using the Pagerank algorithm. 44 The algorithm assigns probability distributions to each node, denoting its importance. In particular, we believe that the probability distributions are appropriate measures for the importance of the interactions in the driving views of CrashVis as they show “the likelihood of a random surfer in the network to traverse to a specific end node.” 18 We believe this metric can help us understand to which extent the AE strategies primed the individuals. We created the network visualizations with the Gephi tool. 45
Expected findings
The susceptibility to the AE has been a topic of research related to emotions. A previous study indicated that participants in a sad mood were more susceptible to the AE than their counterparts in a neutral or happy mood. Englich and Soder 46 justified their findings based on how people in a sad mood are more engaged in effortful reasoning. This finding aligns with the Selective Accessibility model, which explains the AE in that, by elaborating more thoughtful processes, there is a confirmatory search for information consistent with the anchor.16,47 Moreover, another research found that the External perspective of LOC is inherently associated with a more depressive state of an individual. In particular, there was a link between the Chance dimension of LOC and depression. 48 Prior research on the relationship between LOC and the AE shows mixed results. LOCLOC significantly moderated the relationship between investment decisions and the anchoring bias in decision sciences.35,36 In contrast, Eroglu and Croxton 33 reported that LOC does not affect the priming of the AE.
As mentioned, researchers must explore the relationship between the AE and the LOC in InfoVis settings. We base our research on two primary baselines. First, past visualization research shows we can verify the anchoring effect through user interaction logs. 18 Cho et al. 18 leveraged the Pagerank algorithm 44 to rank interactions and created weighted directed networks to provide visual context to their results. The Pagerank algorithm allowed Cho et al. to confirm visually that most interactions are with the anchor view. After adapting the experimental methodology used by Cho et al., we first validate our approach by replicating their original findings. Therefore, we expect participants to interact more and spend more time with the visual anchor.
Second, comprehensive research on the effect of LOC in InfoVis settings shows that this trait affects the time spent, user strategies, and, in general, behavioral aspects of using interactive visualizations.14,31,32,49,50 This richness allows us to leverage LOC to study cognitive biases in information visualization from a scope of relationships with psychological constructs. Taking into account that the time spent and the frequency of interactions with visualizations are indicators of both the AE priming and LOC profiles, we expect that anchoring the participant and then cross-referencing the interaction logs with the LOC may provide further insights into what makes an individual susceptible to the anchoring effect in the context of visualization use. Therefore, we want to analyze if LOC alone has any impact on swaying Internals and Externals toward particular views by addressing the following research question: Does the locus of control affect the susceptibility to the anchoring effect?
Procedure
We recruited subjects in university settings through direct contact and word of mouth. Our sample includes 69 participants (53 male, 16 female) from 18 to 60 years old
Due to constraints from COVID-19, we conducted each user experiment as a Zoom video meeting with one experimenter. Before each session, we assigned each participant a unique identifier and an anchor condition. Then, subjects completed the LOC survey, followed by an introduction to the experiment. Next, participants provided their consent and filled in the demographic questionnaire.
Afterward, the priming phase of the experiment started. First, we presented a video to the participants to introduce CrashVis by showcasing all possible interactions with equal detail. Then, in case the participant was in the Map Anchor
Data analysis
Our experiment follows a
We conducted an a priori power analysis using the
Results – Analyzing quantitative measures
This section covers the quantitative results of our study. In particular, it tackles both the anchoring effect as well as the susceptibility of LOC to its effect. Pairwise comparisons use Tukey HSD 52 tests and include Bonferroni corrections.
Descriptive statistics
Figure 2 depicts the distribution of the three scales of interest by each study condition and the complete sample. Regarding the LOC scales of the complete sample, the Internal scale has a distribution with higher scores
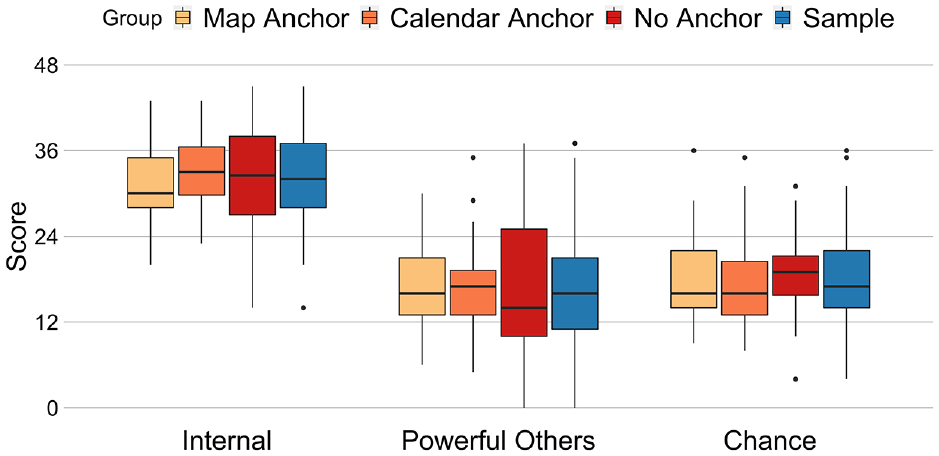
Distribution of the locus of control scales.
Unadjusted quantitative results of the experiment per anchor condition and driving view.
Descriptive statistics of unadjusted and adjusted metrics means and variability for each anchor condition and driving view with the LOC dimensions scores as covariates.
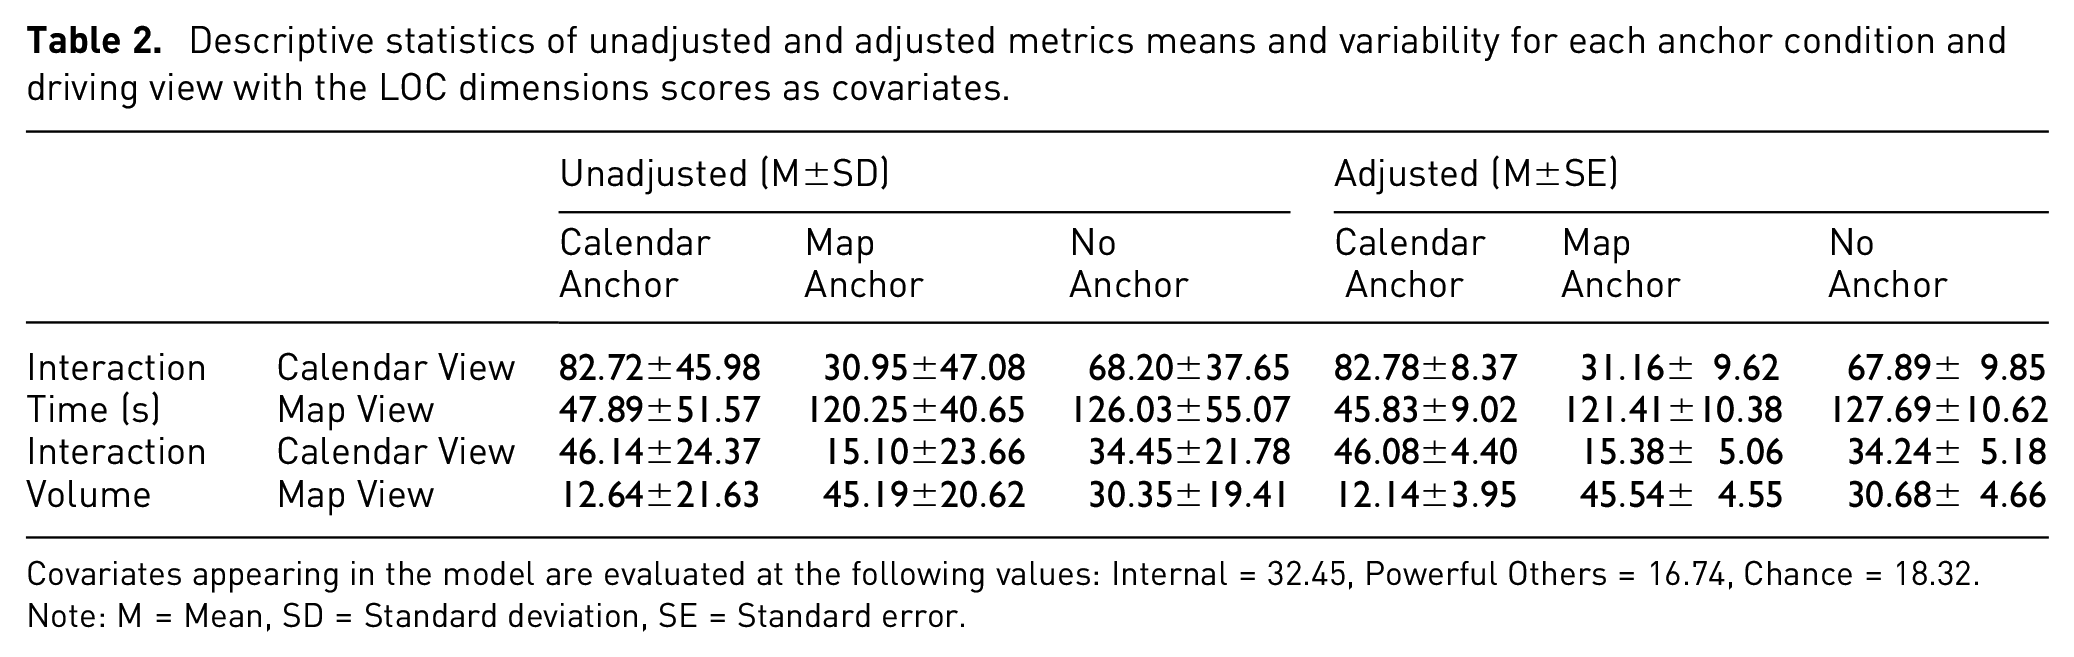
Covariates appearing in the model are evaluated at the following values: Internal = 32.45, Powerful Others = 16.74, Chance = 18.32. Note: M = Mean, SD = Standard deviation, SE = Standard error.
Presence of the anchoring effect
Inspired by prior work, 18 we employed a CMV design in CrashVis, as it has proven to increase the complexity surrounding involved tasks, 38 leading to higher uncertainty, and thus, foster the priming effect. 53 To validate our approach, we start by veryfing if we replicated the original findings of Cho et al. 18 through the interaction time and volume of each user.
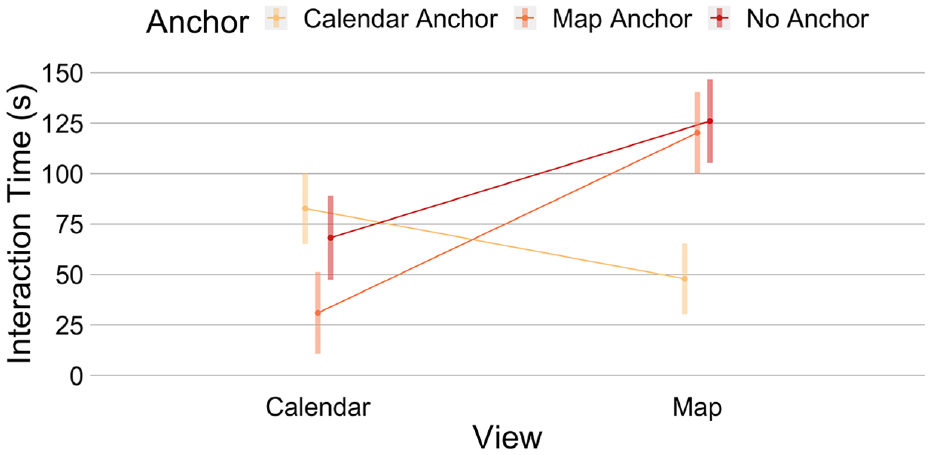
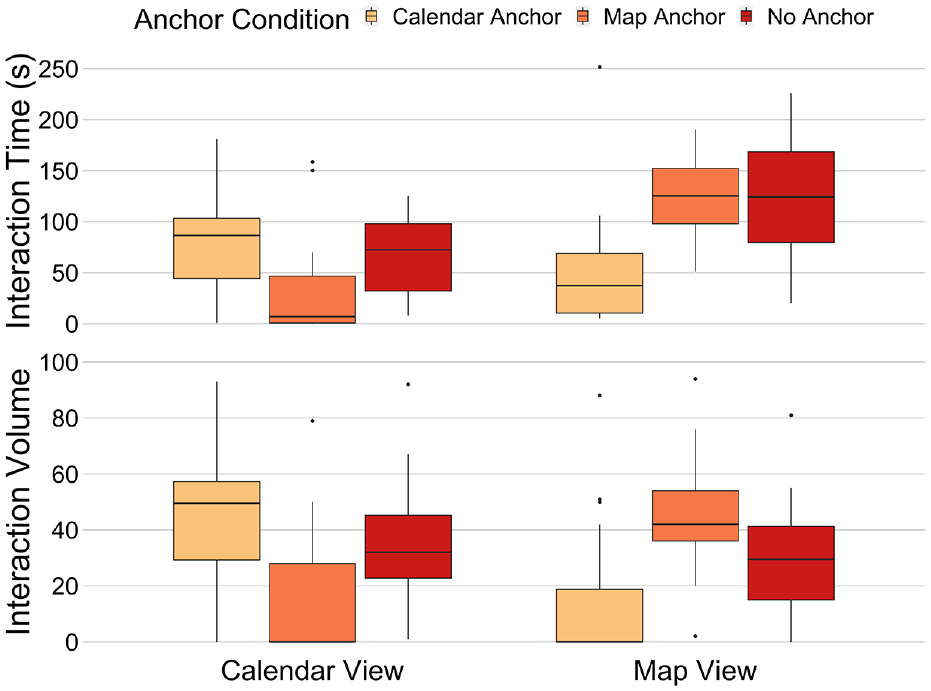
Unadjusted estimated marginal means of the time spent in each driving view across anchoring conditions.
We continued exploring our results by analyzing the main effects. Results show a main effect of the anchor condition on the interaction time,
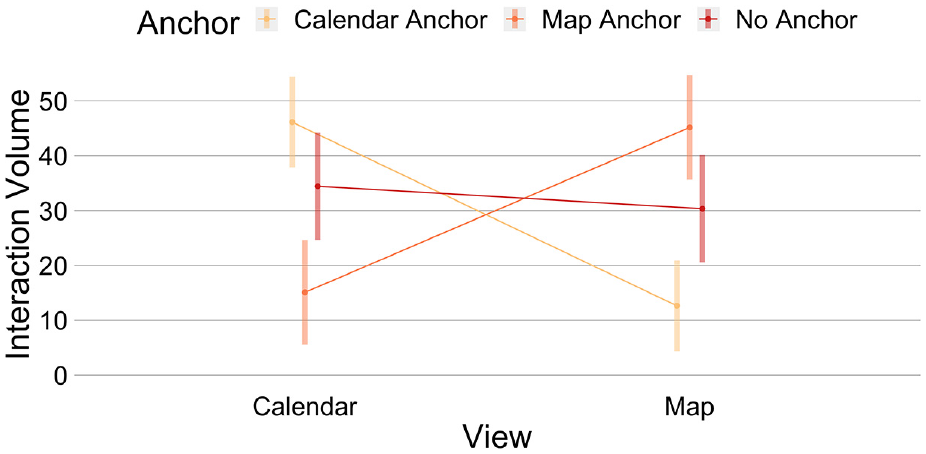
Unadjusted estimated marginal means of the interaction volume in each driving view across anchoring conditions.
Regarding main effects, while controlling for the LOC dimensions, we found neither a main effect from the anchor condition,
Similar to Cho et al., 18 we primed the participants with a visual anchor through training videos and applying task framing. Both methods provide the initial information required to anchor the participants. 16 We can verify the presence of the AE based on the time spent and the interaction volume in each driving view (map and calendar). In particular, participants primed in the Map Condition spent more time and triggered more interaction events in the map. In contrast, the Calendar Condition led users to interact for longer and trigger more events in the calendar view. Looking at participants in the No Anchor condition, we observed that they spend more time in the map view than the calendar. However, they trigger a similar number of interaction events in both views. These findings reinforce the resiliency of the anchoring bias and replicate the original findings of Cho et al. 18 Having established a baseline for our research, we continued by analyzing the influence of the LOC on our experiment.
Influence of locus of control on the anchoring effect
Nevertheless, we found interesting results regarding the external dimensions when we consider the anchor condition (Figure 6). Note that the significance value for each anchor condition is
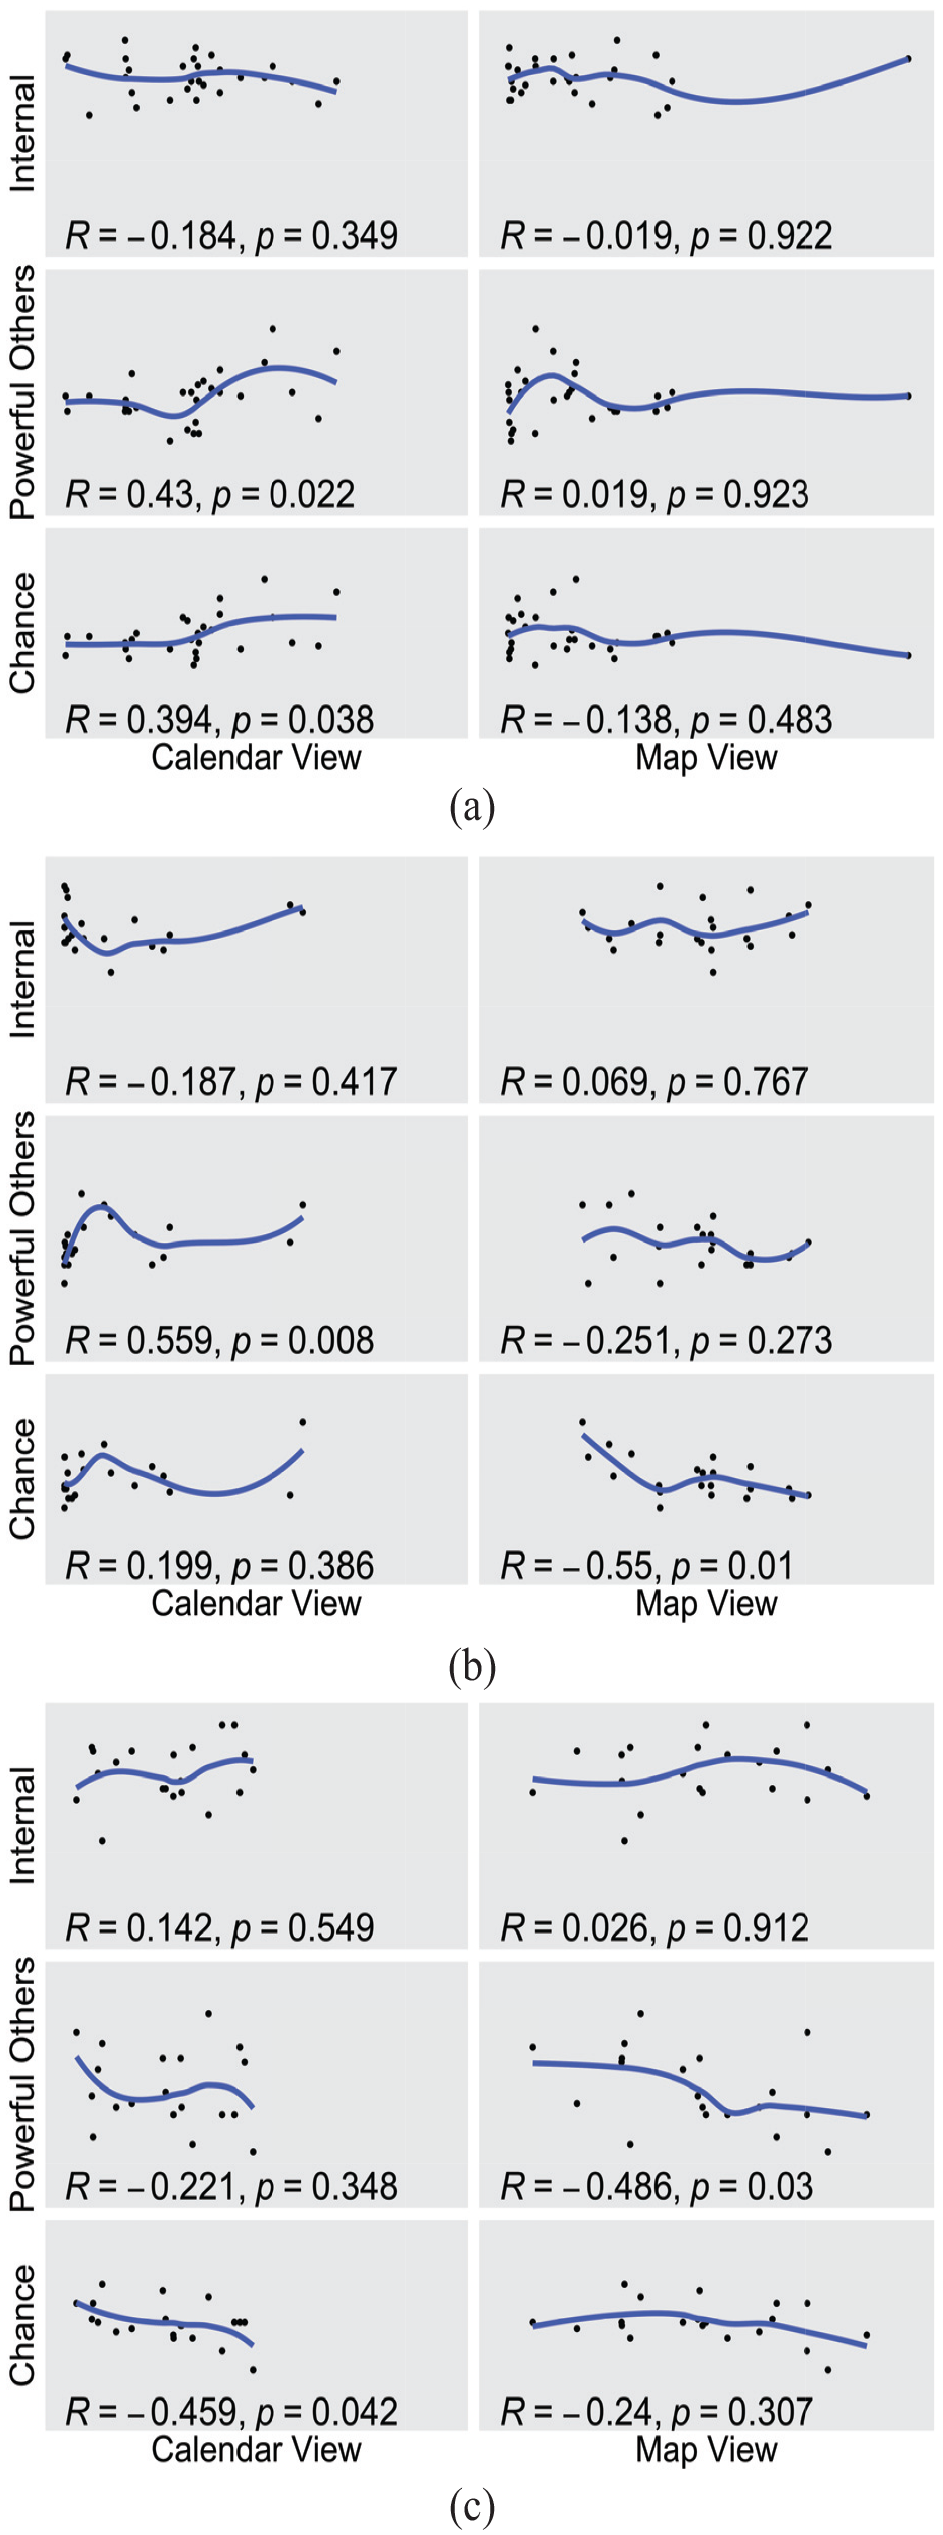
Scatterplots of interaction time per anchor condition and LOC dimension: (a) calendar anchor, (b) map anchor, and (c) no anchor.
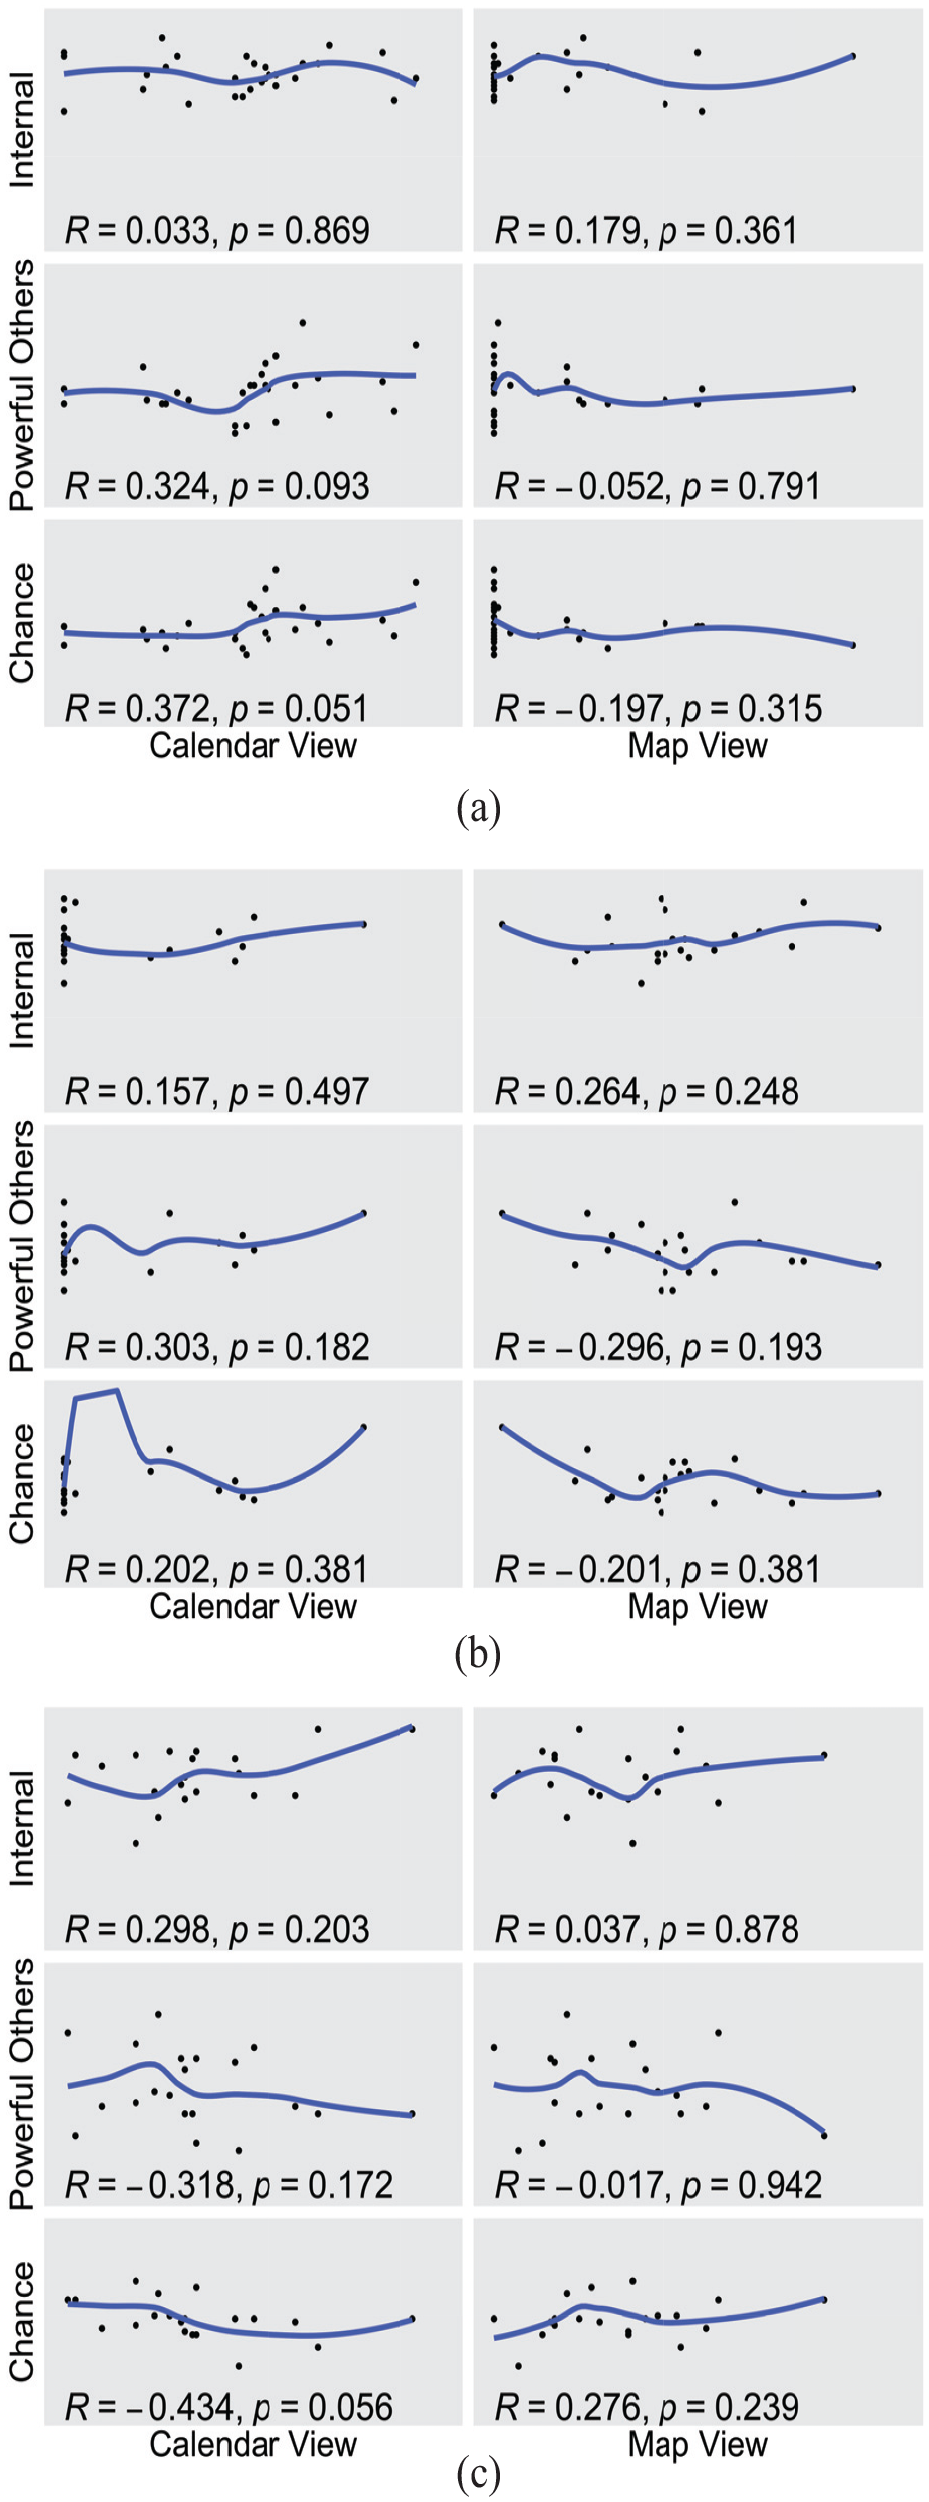
Scatterplots of interaction volume per anchor condition and LOC dimension: (a) calendar anchor, (b) map anchor, and (c) no anchor.
Overall, we could not find measurable effects of a relationship between the LOC dimensions and the anchor conditions. In particular, while controlling for the LOC dimensions, no dimension appears to affect the interaction effect between the anchor conditions and driving views on the interaction time. Results show that being primed is independent of the Internal scale scores since our observed trends were all negligible to moderate positive correlations. The null findings highlight the resilience of the AE to an Internal LOC. We believe that the resiliency may stem from the fact that Internals are less likely to be influenced by external actors. Furthermore, it hints that people with a higher degree of believing they control their lives 40 trigger more events while performing tasks.
In contrast, our results suggest that higher scores in the External dimensions of the LOC may make individuals more susceptible to the AE since there were observable trends regarding the role of the external LOC dimensions. Both external scales showed a moderate to strong correlation between interaction time and volume based on the anchor condition. In particular, we observed that individuals with higher scores in the Powerful Others and Chance scales spent more time interacting with the driving view when we applied priming strategies to them. We also found trends suggesting that individuals with higher Powerful Others and Chance trigger more events while performing tasks. These results suggest that the introduction of an anchor prior to the task completion may act as an external force. Since individuals with high scores in the External dimensions are more prone to attribute higher importance to external forces, we hypothesize that the anchors moderate the user interaction with the dashboard.
Results – Paths of interactions
We compared the weighted directed networks for the Map Anchor, Calendar Anchor, and No Anchor conditions, as seen in Figure 8. We observed that edges between interactions of the same community weighed much more than between interactions of distinct communities, which also happened for all other networks in our work. Moreover, the bond between nodes was stronger between the top-ranked interactions, with the only exception being whenever the user navigated between views. The networks regarding all anchor conditions differed in node count, edges, and weights, allowing us to understand and compare the interactions of participants assigned to the three contrasting anchor conditions through the lens of their respective networks. The main noticeable difference was the node assignment regarding the communities and the most relevant interactions obtained.
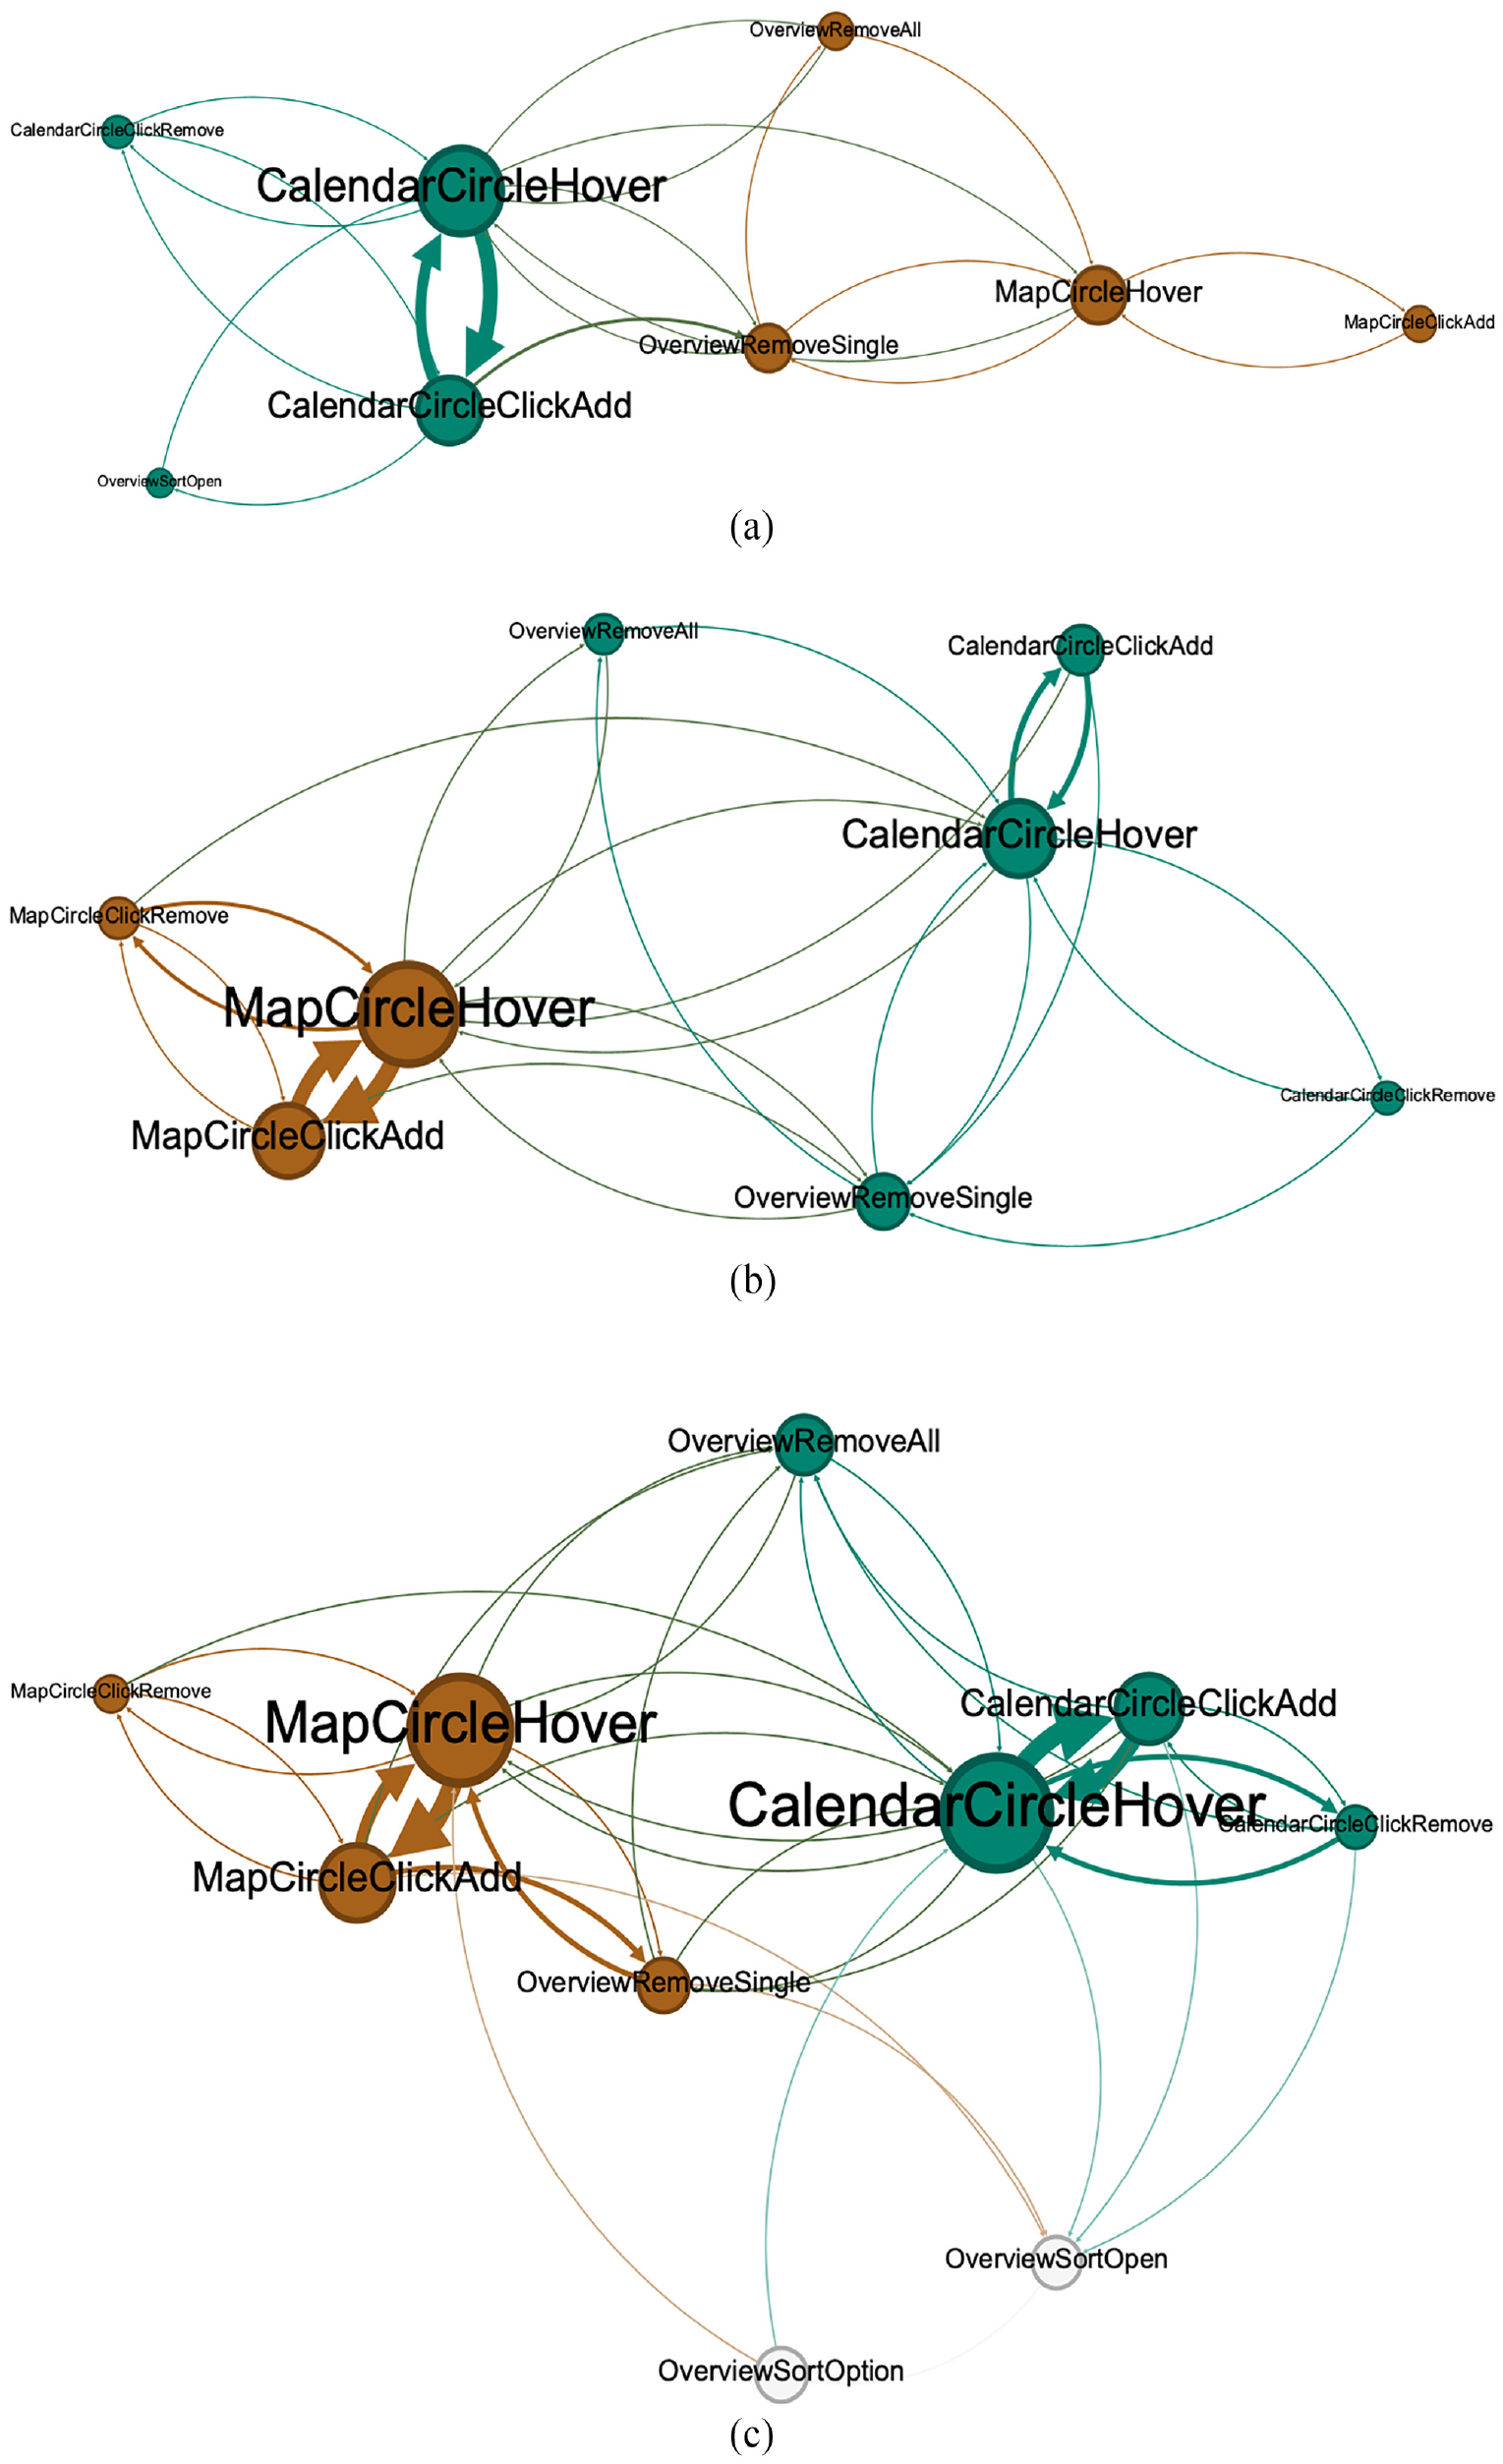
Weighed directed network of the studied conditions. Nodes are interactions and edges are interactions that occur after each other. The size of nodes is proportional to Pagerank values of nodes in each graph, the color of nodes corresponds to the detected community of each node, and the width of each edges corresponds to the weight of that edges: (a) calendar anchor, (b) map anchor, and (c) no anchor.
Both the Map Anchor and Calendar Anchor networks led to two communities in total, distinguished by color and provided by the community detection algorithm developed by Blondel et al. 43 The No Anchor condition revealed a total of three communities, showing a better separation between the interactions of the three views – map, calendar, and overview tab. To rank every interaction according to its relevancy, we leveraged the Pagerank algorithm. 44 Larger nodes equal a higher relevancy score. As we can observe, node size differed between the three networks, with the most relevant interactions and transitions belonging to the visual anchors on the Map Anchor and Calendar Anchor conditions. These results are in line with our previous findings regarding the priming effect on user interaction since individuals interacted more frequently with the driving view of each study condition. In particular, the most frequent interactions under the Calendar Anchor condition were in the calendar view. At the same time, there were more interactions with the map view under the Map Anchor condition.
When considering the No Anchor condition, the nodes from the two primary views – map and calendar – hold an equally distributed relevancy, leading us to confirm the existence of a baseline of comparison in which we observed no particular influence regarding interactions. If we compare its network to the others, we can observe that the lack of an anchor led to similar node and edge sizes which was not the case when we applied the priming techniques. Therefore, the generated graphs provided us with further confirmation of the presence of the AE by showing that the most relevant interactions, computed by the Pagerank algorithm, 44 are those from the view linked to the anchor condition.
Discussion
As a first step toward understanding whether LOC may help to understand the AE, we primed individuals with training videos and task framing in a visualization employed with a CMV design, CrashVis, and then measured how participants interacted with the visualizations. We derived several lessons from our findings to assist future research on this topic:
Enable Anchoring Effect through Coordinated Multiple Views: Researchers are still trying new methods to induce the AE. While some opt for a visualization consisting of only one view,17,54 others leverage multiple views embedded into a visualization. 18 We decided to use a CMV design since it allows for greater flexibility and efficiency 6 when analyzing data. Moreover, leveraging multiple views supports designing experimental apparatus with concurrent views to drive individuals with the anchors and priming strategies. This approach allows us, in turn, to analyze how individuals interact with the driving views based on the study conditions. Besides our findings suggest that future researchers and developers can leverage CMV designs to study the AE, they also point toward the negative impact of doing so. For instance, leveraging multiple views may increase the perceived uncertainty of the apparatus, which is one of the root causes behind cognitive biases. In this light, InfoVis designers should pay attention to how they introduce an individual to the complexity of a visualization system with a CMV design. Focusing too much on a specific view may prime individuals to interact more frequently with that view and disregard the others, which may hinder the exploratory analysis.
Amplify the Anchoring Effect with Training Videos and Task Framing: Inducing the AE can take different methodologies. Inspired by prior work, 18 we leveraged training videos and task framing. Participants reported after the experiment that the training videos influenced most of their interaction behavior. Task framing served only as an additional push to induce the AE since the video training appears to be enough to anchor participants. Moreover, applying task framing leads to a limitation. We were unable to remove the task framing influence on the No Anchor condition due to the required presence of information regarding the anchor in the Map Anchor condition and the Calendar Anchor condition. Therefore, future work should avoid task framing and focus on influencing the participant through training videos by leveraging humans’ main channels for obtaining information – vision and sound. 55
Manage Internals and Externals accordingly: A prior study investigates a customization mechanism allowing one to choose the type and amount of information displayed in a visualization 56 and its correlation with personality constructs, such as LOC. The authors found that Internals who customized gave higher confidence ratings than those who did not, which could be because the ability to customize suits their belief that they can control the events that happen in their life. 28 On the other hand, the exact opposite happened for Externals, who did not gain confidence when customizing due to the belief that they do not have the power to change anything. 28 Therefore, understanding where users stand on the LOC spectrum allows researchers to provide alternatively efficient ways of mitigating the AE. Our findings are in line with this research agenda by highlighting how the LOC dimensions behave in terms of susceptibility to the priming effect. As mentioned, the AE appears resilient to the Internal dimension. In contrast, we found trending effects showing that Externals are more susceptible to the presence of an anchor and will be drawn more frequently to the driving view. Both results suggest that we must manage individuals according to their LOC dimensions. For instance, Internals are more likely to explore and interact with a visualization system than Externals. We believe designers can teach Internals how to interact with the system while exploring it rather than providing a tutorial before the interaction begins. Regarding Externals, their tendency to be more affected by anchors makes it more appealing to introduce a visualization system through an introductory tutorial. However, it is important to consider how we transmit instructions since individuals are more likely to focus their interactions around the view that is the subject of the tutorial.
Limitations and future work
Some relevant factors may provide additional insights regarding the lack of significance observed in a few of our results. First, the experimental setting includes the introduction of new interactive visualization and an online conference platform to perform the tests. For some participants, input delay was sometimes an issue as the internet connection was unstable. Therefore, future studies should be conducted in other settings to verify whether the results hold. It would also help clean unintended interactions or different screen sizes, which we did not clean in this study. Another limitation arose from the random assignment of an anchor condition to each participant. It led to an uneven distribution of participants among all anchor conditions. Therefore, future work should manually distribute the anchor conditions equally across testers to guarantee more precise results.
Second, the calendar view was a straightforward approach. However, contrary to the map view, it needed more interactive feedback due to its simplicity. Therefore, we should explore alternatives that allow us to reach the same goal but offer a higher level of complexity and, thus, contribute to a more accurate AE detection by having more in-depth interaction. Moreover, the map was tied to geographical understanding, benefiting users with higher knowledge. To avoid the occurrence of the curse of knowledge, future researchers should opt for a neutral view that does not leverage information previously known to the user to complete tasks more efficiently. Although the map had a larger area, it depicted the same number of data items. Nevertheless, the difference in size between the map and the calendar may lead users to interact more with a view that commands more screen space. Their positioning in the interface can also introduce some bias since the sample reads from left to right. We should further investigate this confounding factor.
Third, in the No Anchor condition, we could not avoid task framing due to the obligatory presence of geographical and time data on the task. We employed a specific order of information on the first task (map-related or calendar-related information) and then reversed the order on the next assignment. However, future work may overcome this liability by not relying on the task framing method to induce the anchoring effect and focusing on training videos only. Moreover, there was no second tutorial video No Anchor condition, which could lead to a confounding effect of lesser engagement with the apparatus simply due to less content. Future studies should also include a comparable scenario that uses the same number of videos for each condition.
Fourth, it would be interesting to reflect on how personality might impact visualization use and biases in the long term to understand whether the experience is a mitigating factor. Another future direction should study other anchoring bias scenarios in visualization and show null effects for LOC across them. Finally, future studies can explore other anchoring mechanisms and visualization charts. While we only leverage the choice of a visual anchor when there are multiple views in this experiment, there are more approaches to induce the AE.
Conclusion
In this work, we focused on understanding the extent to which LOC mediates one’s susceptibility to the anchoring effect. Our study adds to prior work by Dimara et al. 11 and takes one of the first steps to validate whether individual differences, such as the Locus of Control, transfer their effects on the priming effect to the field of information visualization. Overall, our findings open a discussion toward developing adaptive visualizations based on the locus of control. In particular, in case these systems include decision-making where the anchoring effect is present, designers should consider that externals need an adaptation mechanism to diminish the priming effect. It may foster diversity and inclusion by empowering individuals with tools to diminish the anchoring effect, thus supporting decision-making’s vital role in society. 57
Footnotes
Acknowledgements
The authors would like to thank Catarina Moreira from her insights and discussion, as well as to professor João Relvas for authorizing the use of the IPC scale.
CRediT authorship contribution statement:
Tomás Alves: Conceptualization, Methodology, Formal analysis, Writing – Original Draft, Visualization, Funding acquisition. Ricardo Velhinho: Conceptualization, Methodology, Software, Validation, Formal analysis, Investigation, Writing – Original Draft, Visualization. Joana Henriques-Calado: Methodology, Resources, Writing – Review & Editing, Supervision. Daniel Gonçalves: Methodology, Writing – Review & Editing, Supervision, Project administration, Funding acquisition. Sandra Gama: Methodology, Writing – Review & Editing, Supervision, Funding acquisition
Funding
The author(s) disclosed receipt of the following financial support for the research, authorship, and/or publication of this article: This work was supported by national funds through Fundação para a Ciência e a Tecnologia (FCT) with references SFRH/BD/144798/2019 and UIDB/50021/2020.