
Abstract
Understanding and consuming public budget data is a key issue, helping citizens in gaining insight into their democratic and political systems. The goal of this work is to present Waffster, a user-friendly representation supporting the understanding of such data. The proposed representation enables the browsing, searching, comparing, and presenting of the hierarchically arranged components and quantities in budgets. In this paper, we first conduct a thorough survey of online public budget visualizations. Then, in collaboration with Le Devoir, a Canadian daily newspaper, we propose a novel unit-based hierarchical design based on waffle charts. We evaluate this design using a controlled user study to compare it to a tree-map based layout, and a case study conducted with Le Devoir during the provincial election campaign in Québec of 2018.
Introduction
Public budgets are at the heart of two key democratic processes: yearly budget releases and financial frameworks during electoral campaigns. Understanding the political and economic issues at stake requires a transparent and easy access to the relevant data. Improving these aspects could help to achieve the overall objective of economic literacy, meaning supporting citizens, in their understanding of our political and economic systems. 1 However, public budgets such as government and state budgets often use a wide range of scales, 2 numerous categories, and hierarchical levels that often impede their understanding by laypersons. This also raises a problem for mass media that regularly need to communicate such data in order to inform citizens, who often lack of contextual accounting background. 3
Public organizations usually communicate such data either through extensive documents, including hundreds of numerical tables or, as mass media, using some specific simple charts that usually target a single communication objective. They indeed have to balance their presentation between providing many details, which support better transparency but impede accessibility, or concise summaries which have the opposite effects. In this paper, we first present a thorough survey of online public budget visualizations. We observe that exploration-oriented visualizations of budget data are usually based on hierarchical designs such as tree-maps 4 and bubble charts or circle packings. 5 Despite their popularity, these layouts perform poorly at searching and comparing tasks for instance.
The process of this design study has been conducted in collaboration with Le Devoir, a Canadian French-language independent newspaper with about 50 journalists and one million readers every week. 6 Based on our understanding of its context, and on the many discussions that we conducted with this collaborator, we identified several tasks supporting the general objective of enabling a better understanding of public-budget-related issues. The high-level tasks are to let readers discover and enjoy budget data (so-called data consumption). At a mid to low-level, they boil down to searching, identifying and comparing the following targets: budget item values, hierarchical relations, outliers, features and similarities.7,8 Following Munzner’s data abstraction, public budget data is commonly structured within a tree of budget items of at least a depth of 2. Usually the first-level nodes gather budget departments (or ministries), and the next level in-depth nodes gather departments’ specific programs, or any departments’ budget breakdown. Each node is associated with its allocated funds. In terms of visualization requirements, one has to visually represent budget items holding extreme variation of values contained in a hierarchical structure, not very deep but usually quite large (e.g.55 nodes in the projected budget of Quebec for 2022–2023, whose tree structure depth is 3).
In this paper, we first present a thorough survey of 39 online public budget visualizations. We analyze their design choices and targeted tasks across a custom-made taxonomy. We analyze the structure of this design space and discuss the variety of possible goals (next section). We then propose Waffster, a visualization that enables an easier and deeper exploration and understanding of public budget public budget data and public policy issues (see Figure 1). Waffster uses a unit-based design combined with a focus-plus-context approach. It was designed to help perform a variety of actions such as identifying, comparing, and searching. We present the design considerations that have guided the design process, the proposed interactions and some implementation details (Section “Proposed Design”). Finally, we demonstrate that Waffster is able to support complex budget exploration for casual users such as mass media readers. We first conduct a controlled user study, involving 74 readers of Le Devoir. Based on several quantitative (estimation errors, response time) and qualitative (comprehension, preference, and satisfaction level) measures, we evaluate the performance of the proposed visualization compared to a tree-map which is commonly used to visualize budget items. We also showcase the application of Waffster by a case study conducted at Le Devoir during the 2018 Quebec electoral campaign (Section “Evaluation”).
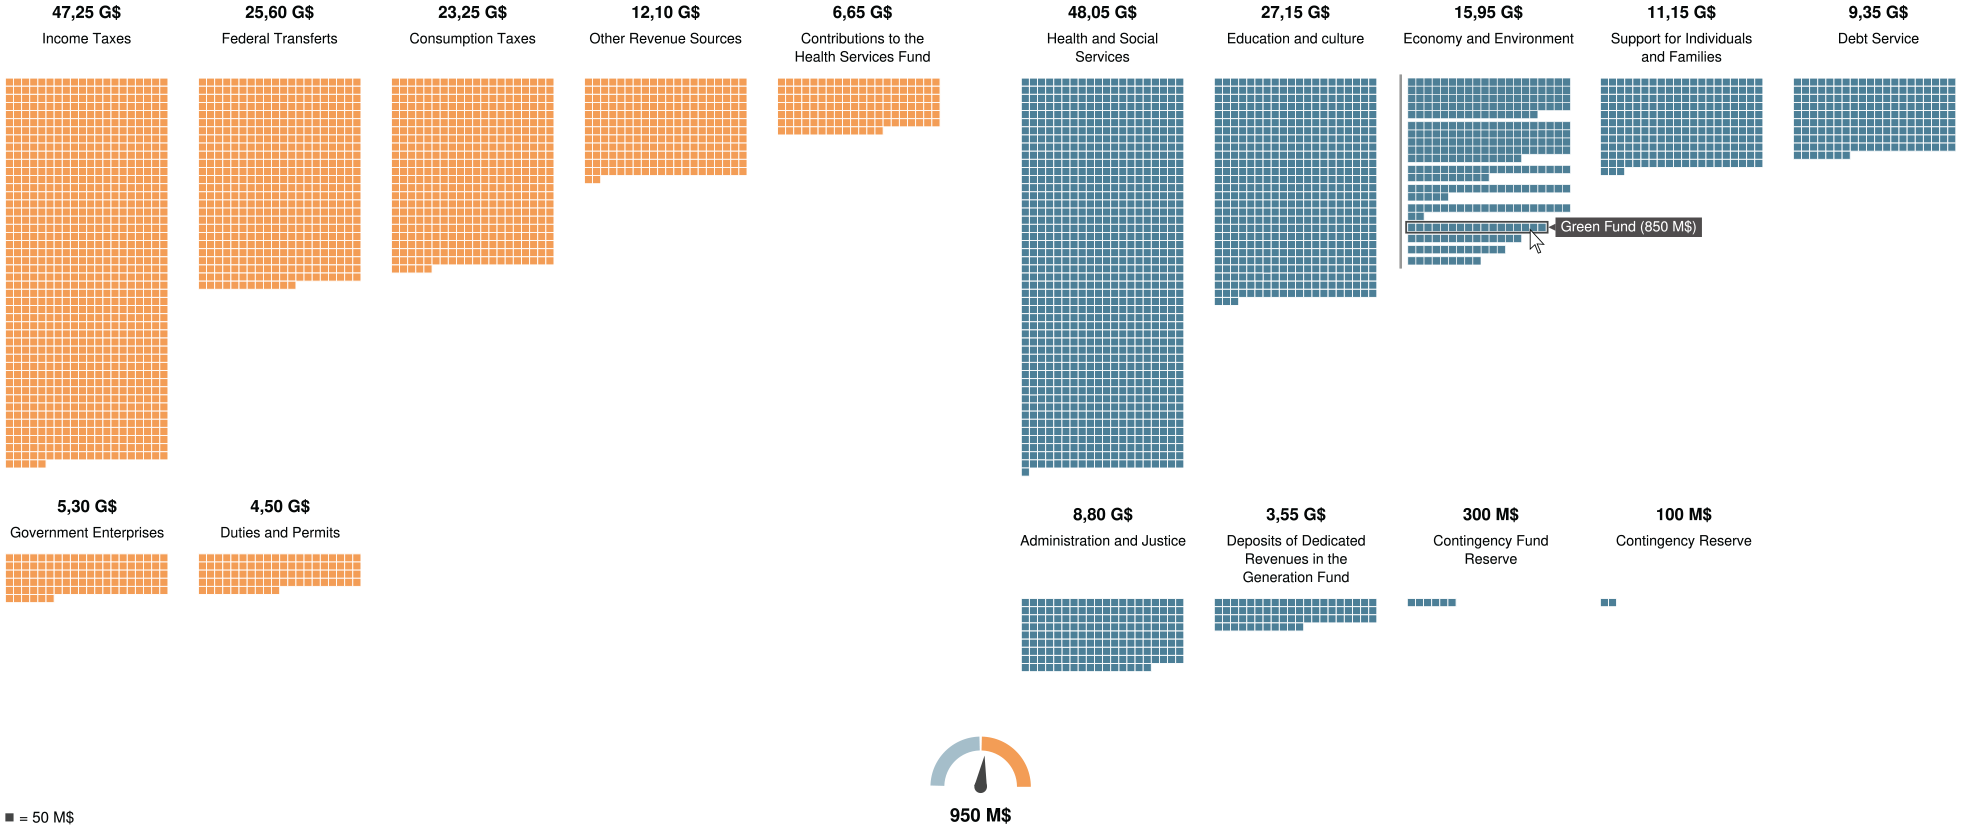
Waffster is a focus-plus-context unit-based representation based on hierarchical waffle charts enabling users such as mass media readers to consume and explore public budget data. Here, the user is exploring the Québec Government’s 2022–2023 projected expenditures (right) and revenues (left). Specifically, the user is digging into the structure of “Economy and Environment” expenditures and “Income Taxes” revenues.
Survey of public budget data visualizations
We gathered and analyzed a corpus of budget data visualizations from mass media and public institutions. We collected this corpus using general public search engines (e.g. Google), online libraries which archives and subscribes to extensive amounts of newspapers, scientific literature, and more practitioner oriented information visualization community websites, and finally directly through some media websites. This survey includes 39 public budget visualizations and encompasses a wide variety of design choices (see Figure 2). We analyzed this corpus along two dimensions: layout and tasks. The supplemental material website (https://antoinebeland.github.io/waffster) for this paper includes our corpus using these dimensions, and links to original sources.
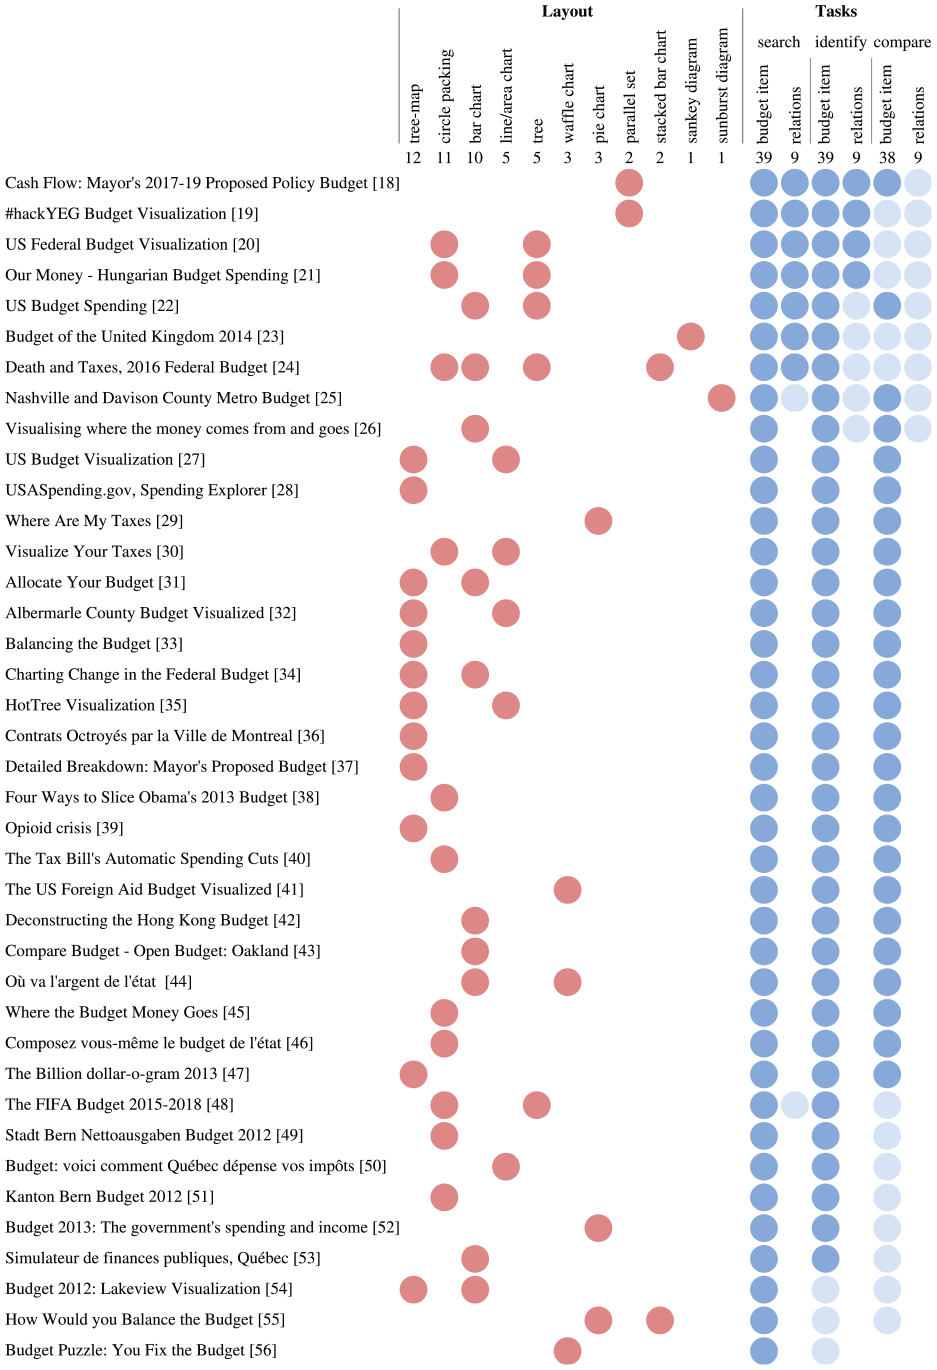
Design space and task distribution of all surveyed visualizations of public budget data. Vertical ranking according to number of covered user tasks (hard blue: primary task, soft blue: secondary task).
In terms of layouts, 11 different designs have been used, among which bar-charts, tree-maps 9 and circle packings 10 are the most popular, in similar proportions. The rest of this section analyzes how these layouts support the intended tasks.
The ability to compare is a major goal in our context. It sustains higher-level actions such as discover, present, and search 8 on all the targets we seek: budget items, relations, outliers, features, similarities and so on. The number of elements to compare, their size, and the complexity of their relationships are the main issues to tackle when pursuing this goal. 11 Most of our corpus uses juxtaposition-based layouts 12 to address these challenges.
Bar-charts seem an effective choice to support comparison-based actions as shown in previous user studies,13,14 compared to the two other popular layouts, tree-maps and circle packings. However, this effectiveness can be lessened when data presents a wide range of scales. Above all, bar-charts do not fully support the other important target which is the data topology, related to the hierarchical nature of budgets.
Among other layouts, tree-maps are probably popular in our corpus thanks to their efficient use of the screen space. 15 A tree-map is also efficient to represent a same level type of relation between nodes in a hierarchy. 16 However it performs poorly at search and compare actions 14 because of the varying ratios of rectangles. All the tree-maps found in our survey are also borderless, probably because of the wide range of scales that budget usually contain. This mean they miss other types of hierarchical relations such as within level and between levels relations. Unlike tree-maps, the circle packing layout allows the visualization of all types of hierarchical relations. Using circles, it also slightly improves the varying rectangle ratio issue. However, it still performs badly compared to any position-based visual mapping and it is less space-efficient than tree-maps.
All identified target tasks are also supported through different types of interactive navigation. Most tree-maps in our corpus use semantic or geometric zoom mechanisms to change the hierarchical level being shown. This technique limits the visible information and impedes the user orientation 8 due to the lack of contextual information. Composite visualization is also sometimes used, 17 although it prevents visualization within level nodes simultaneously. Therefore both of these mechanisms rely on the user short-term memory for most tasks. Only two examples in our corpus adopt a focus-plus-context navigation approach. The first example relies on a sunburst chart, 25 using an angle mapping for budget items. The other uses a circle-based layout. 20 The online version of our survey also includes a precise decomposition of the corpus along an interactions dimension, using a previously proposed taxonomy of interaction goals 57 containing six goals: select, reconfigure, encode, filter, navigate, connect. We added hovering (showing small chunks of info by hovering) and gamification goals to that list. The first is almost ubiquitous in our corpus and the latter is a noticeable goal where the user is invited to provide some data (e.g. his annual income) in order to engage him more in the visualization, a mechanism that is gaining popularity.
Proposed design
Based on the identified tasks that can be done on budget visualizations and on the insights gained from the latter survey, we gathered several considerations for the design of a public budget visualization.
Design considerations
An important consideration of the proposed design is to display revenues, expenditures and budgetary balance in the same view. In the visualizations surveyed, revenues and expenditures were often displayed in different views, and these views cannot be displayed at the same time. Thus, a user could have some difficulties in comparing budget items in different contexts due to, among other things, the human memory’s limitations. 58
Revenues and expenditures representation
A budget is composed of two main sets: revenues and expenditures. In the proposed design, the revenues are positioned at the left and are in orange, while the expenditures are aligned on the right and are in blue (see Figure 1). The color is used only to differentiate between these two groups but it is not essential to comprehension of the visualization. For instance, a color-blind person would be able to understand the visualization without the color feature.
For each of these sets, the budget items are aligned inside a grid (see Figure 3). Each cell of the grid shows a specific budget item, including labels for its name and its corresponding value ($). The cells are created from left to right and are sorted by descending order based on their values. According to Gleicher, 11 item-ordering helps for comparisons because it provides an effective scanning strategy for users.
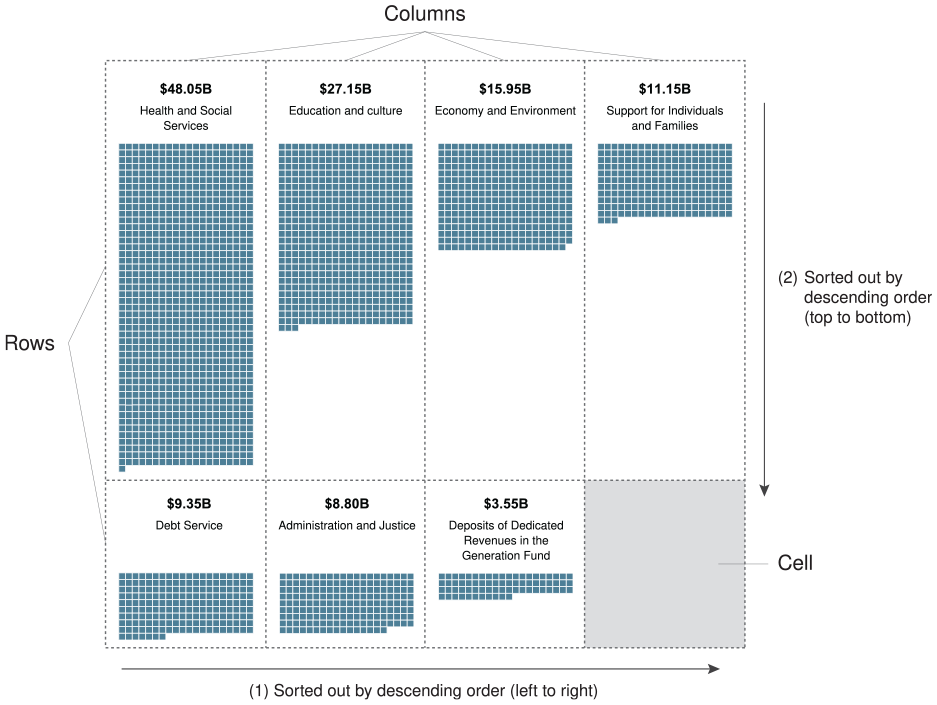
The expenditures representation. Each budget item is located inside a specific cell of the grid, based on their amount.
Budget item representation
Each budget item is presented as a set of small squares (unit visualization59,60), where each square shows a specific amount. Similar to a waffle chart, yet showing absolute amounts, these squares are aligned in a matrix, where the width is fixed and represents a significant amount that can be easily recalled by a user (e.g. $1B = 10 squares, if each square shows $100 M). Then, a user can only refer to the matrix height (
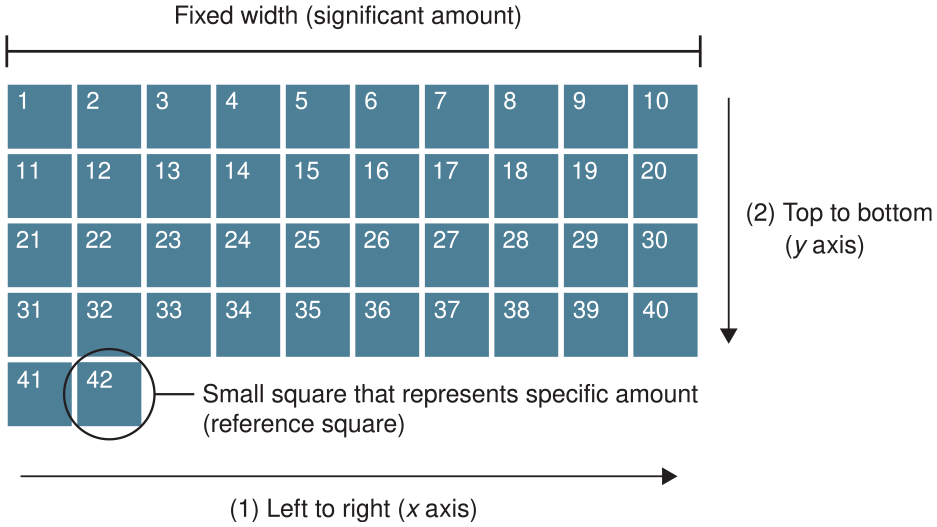
Budget item representation. The squares are created in the matrix from (1) left to right, and from (2) top to bottom. The numbers indicate the square creation order.
There are some benefits to using a unit-based representation. It minimizes data abstraction and facilitates item tracking when a change occurred. 60 Also, budget item amount is shown as a surface that is efficient for screen space usage. However, the choice of the reference square amount is crucial for visualization efficiency. If the value assigned to a unit is too small, it could cause visual clutter. 60 Conversely, if the amount chosen is too big, it might decrease the accuracy. An empirical method that we used is to set an intuitive round value that let represent smallest budget item with a low number of squares, and adjust it if needed to increase accuracy or lower the computational cost.
Budgetary balance indicator
The budgetary balance is a key element for public budgets. In the proposed design, a gage shows budgetary balance and is positioned at the bottom of the visualization. There are three zones indicated: (1) blue zone for a deficit, (2) orange zone for a surplus, and (3) white line for a balanced budget (see Figure 5). The needle position varies based on the amount of deficit or surplus, and the corresponding amount is displayed beneath.
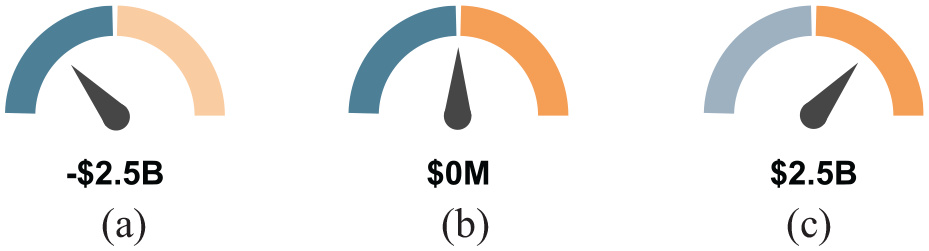
The budgetary balance indicator for different scenarios: (a) deficit, (b) balanced, and (c) surplus.
Interaction
An interaction mechanism was integrated in the proposed design for budget exploration. A budget is a hierarchical structure composed of items, sub-items and so on that cannot all be shown in a static visualization. To support discover, search, identify, and compare a task’s actions, the proposed design uses a focus-plus-context navigation approach to change the details level for specific budget items shown. This approach was applied because it provides both the overall context and the details, which limits disorientation and cognitive load. 8
Exploration mechanism
When a budget item is hovered and has sub-items, spacing appears between the sub-items to indicate that they can be explored. To change the details level of a budget item shown, a user has to double-click on it (see Figure 6(a)). The sub-items are then divided in different matrices using animated transitions and are sorted by descending order from top to bottom; these transitions are used to facilitate changes tracking and limits cognitive load. 8 In the situation where there are some missing squares in the first columns of the first matrix row, the last matrix squares are repositioned at the beginning to fill the empty space. This adjustment is performed to facilitate reading and comparison: all the sub-items are left-aligned in order to maintain effective reading. 61
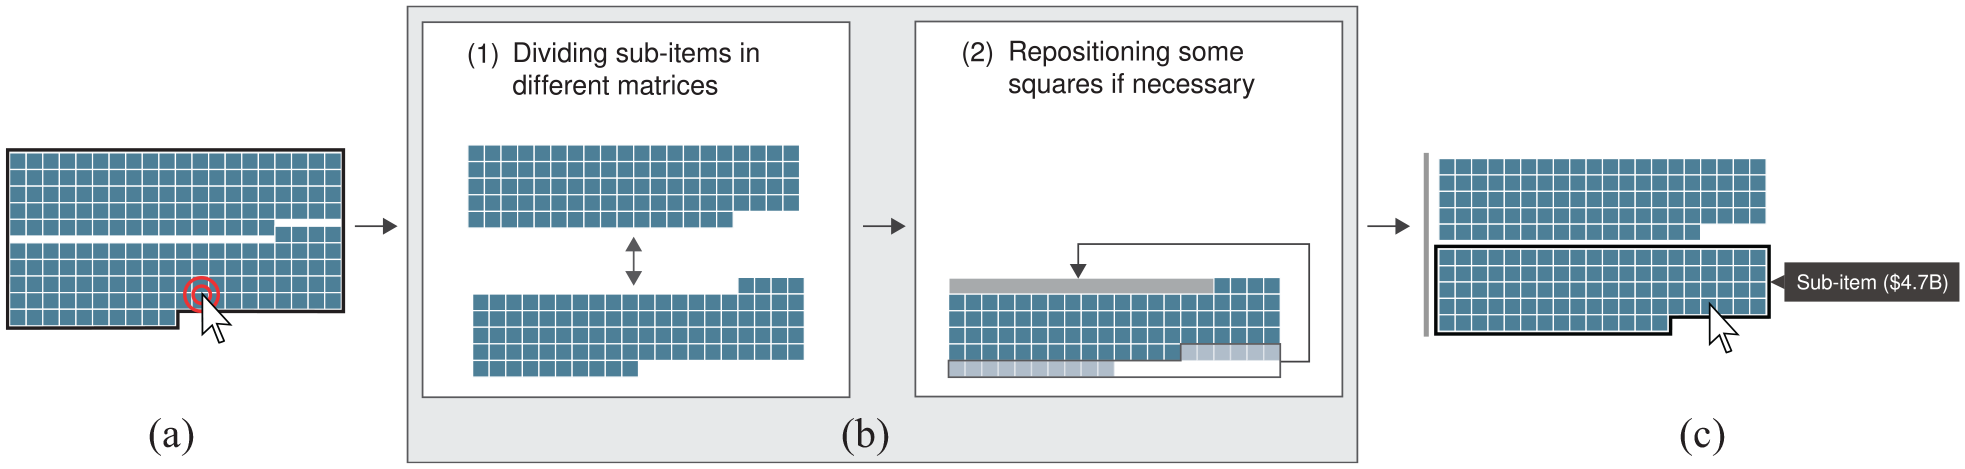
Exploration mechanism. When a budget item is hovered and double-clicked (a), the active level is changed using animated transitions (b): the sub-items are divided in different matrices (1), and some squares can be repositioned (2). Then, the sub-items of the initial budget items are shown (c).
Once the budget sub-items are displayed, the user can access more information about a specific one by hovering over it. Then, a tooltip appears and shows the name and associated amount of the hovered sub-item (see Figure 6(b)).
To illustrate and reinforce the perception of same-level sub-items, a single gray vertical line appears on their left. This line can also be used to return to a higher hierarchical level, when a user clicks on it.
Between levels coherency algorithm
Using unit-based elements may reveal inconsistencies between hierarchical levels in the square count of the budget items, based on the rounding rules used. For example, a budget item could be $800 M, corresponding to eight squares if the reference square is $100 M. Its sub-items could be estimated to $400, $325, $40, and $35 M. The three sub-items that are not a multiple of the reference square’s amount could lead to an inconsistency between the hierarchical levels that is, some squares could appear or disappear based on the active level shown (Figure 7).
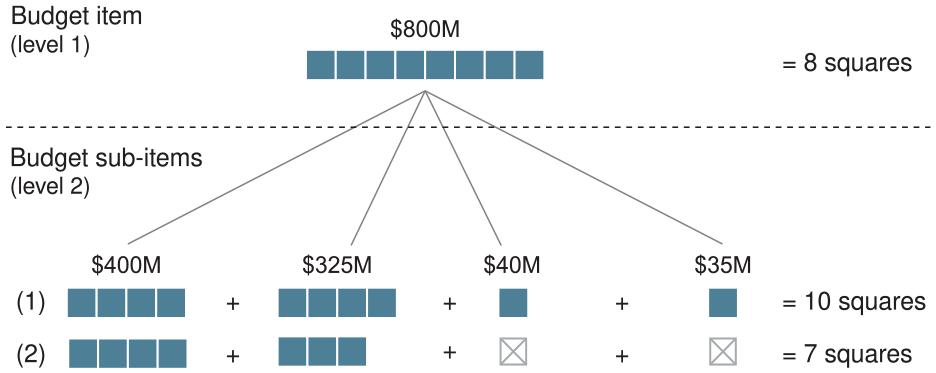
Inconsistencies between hierarchical levels in the square count of a budget item. The line (1) uses the ceiling function to round the sub-items that are not a multiple of the reference value. The line (2) uses the floor function to do the same thing.
To ensure coherency between different hierarchical levels, an algorithm was developed to round up or down budget item amounts which are not a multiple of the reference amount. This algorithm is run on the dataset just once, on initialization.
The algorithm executes a depth-first search on the hierarchical structure of each budget item. During this search, only the items of the hierarchy which do not have sub-items are considered (leaf nodes). These leaf nodes are then tested with the following condition:
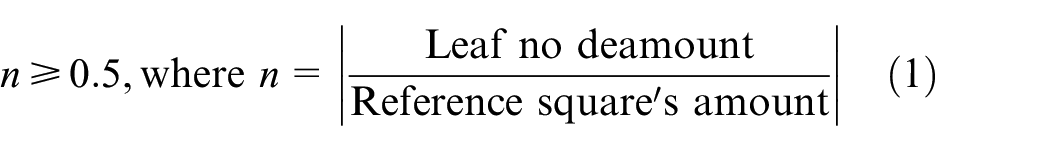
If a leaf node meets the condition (1), then this node and its parents can be displayed and the square count associated to it is computed using equation (2).
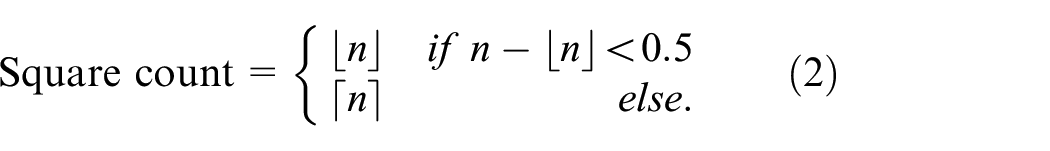
If a leaf node does not meet condition (1), two cases can be considered. First, the node is rejected if there are other leaf nodes on the same hierarchical level that meet the condition. Second, if none of the leaf nodes of a same parent node meet the condition, this parent node will be tested. The algorithm is repeated until one parent node of the hierarchy meets the condition. Figure 8 illustrates the two possible situations.
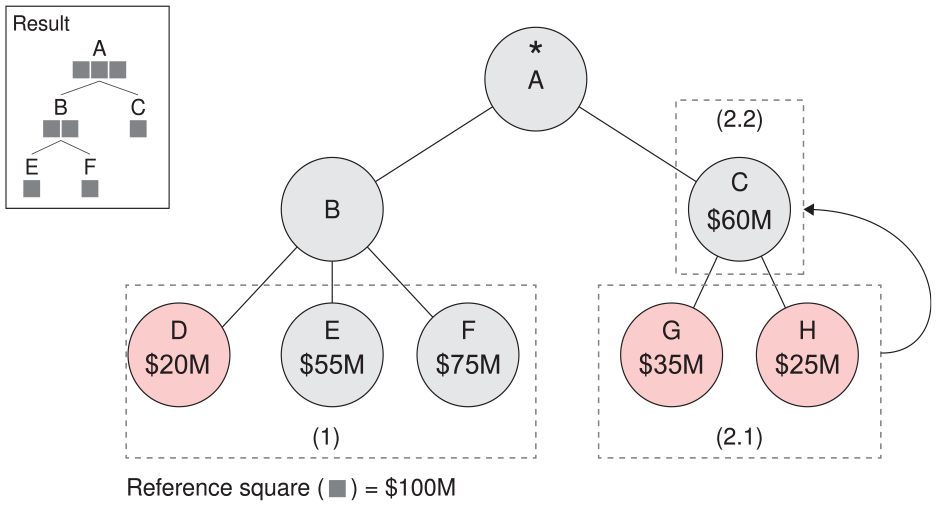
Between-levels coherency algorithm’s cases. Gray nodes are kept while red nodes are rejected. The frame (1) shows that only one node was rejected after algorithm execution (first case). The frame (2.1) shows that all leaf nodes do not respect the condition (1). Then, these nodes are rejected and the condition (1) is tested on the parent node as shown in the frame (2.2) (second case).
Implementation
Waffster was implemented as a web application using TypeScript and d3.js. 62 It is open source and uses GPLv3 license. A sample application and the source code can be accessed online (https://antoinebeland.github.io/waffster). A mechanism was integrated to automatically rescale the visualization to be sure that all budget departments and items are visible, no matter the screen size or the resolution used. This mechanism ensures the visibility of all the information into a same viewport by retrieving the screen size of the device used, and by rescaling the visualization to fit into that size.
Evaluation
We conducted two evaluations of the proposed design. First, a controlled experiment to compare our hierarchical waffle chart layout to a tree-map on several tasks. Second, a case study during the Québec 2018 electoral campaign with our partner Le Devoir.
Controlled experiment
Since tree-map is the most popular design used by mass media to visualize public budget data in our survey, we conducted a controlled user study to compare a tree-map to the proposed waffle chart based design on two aspects: data understanding through several assigned tasks, and user feedback through a survey at the end of the study. Unlike the tree-maps found in our survey though, we used a tree-map showing the borders of the full hierarchy in order to enable a fair comparison. We did not compare the proposed approach to a circle packing design (second most popular design in our survey) because tree-map and circle packing have already been compared under very similar tasks in a previous study, 13 as discussed in the survey section.
Experiment overview
This experiment is carried out online in order to maximize the number of respondents, with step-by-step instructions. Several controls have been introduced, following online user study past experiments. 63 Using different mechanisms, we controlled that a user: (1) could participate only once (Global Unique IDentifier) and only if he or she had been invited (unique URL containing the GUID), (2) perceives colors well (Ishihara test), and (3) cannot skip questions. This online experiment was conducted on a Le Devoir server using HTTPS protocol. Users’ answers were gathered on a Heroku secured server accessible only to the project’s research scientists (This experiment has been approved by the ethics committee of Polytechnique Montréal.).
In collaboration with Le Devoir, we contacted 3000 of its online subscribed readers by email. The participants joined the study using a web browser on their own computer. They were autonomous, and as such could not ask any assistant for help or clarification during the experiment session. Among the 3000 readers contacted, 144 passed the aforementioned controls and fully completed the experiment. From these participants (85 male, 59 female), 79% are over 55 years old. In terms of educational background, 82% hold a bachelor’s degree.
The experiment’s objective is to compare the proposed Waffster design (thereafter coined V1) to a tree-map (V2). We use the Squarify algorithm to generate tree-maps.
64
We implement a within-subjects study protocol
65
where each participant is confronted to both V1 and V2. Compared to a between-subjects protocol, a within-subjects protocol reduces the amount of error arising from natural variance between individuals. However, in order to discard the visualization design order a participant is successively confronted to, we need two unique datasets (D1 and D2) and thus four versions of the experiment depending on the dataset and design order used (V1/D1-V2/D2, V2/D2-V1/D1, V1/D2-V2/D1, V2/D1-V1/D2). Each of these four experiment versions were completed by 36, 35, 37, and 36 users respectively. We then group the results into two populations. The first group comprises the participants having the experiment versions V1/D1-V2/D2 and V2/D2-V1/D1 (
The experiment is organized into three phases:
Datasets and tasks
Datasets D1 and D2 are made of plausible mock budget data. The budget item amounts of these datasets were determined based on priorities given in real governments budgets (e.g. the healthcare budget item amount is larger than the tourism budget item amount). No other information, such as an associated country or public institution, is given to the participant to ensure he or she does not make any assumption about what the budget items and values should be.
During the experiment, users were asked to perform five different tasks, distributed along 10 questions (see Table 1). These tasks are similar to the ones used in previous user studies from Cleveland and McGill, 13 and from Heer and Bostock. 14 They reflect common tasks performed in visual exploration of hierarchical scalar data values:
Questions for the task phase of the controlled experiment.
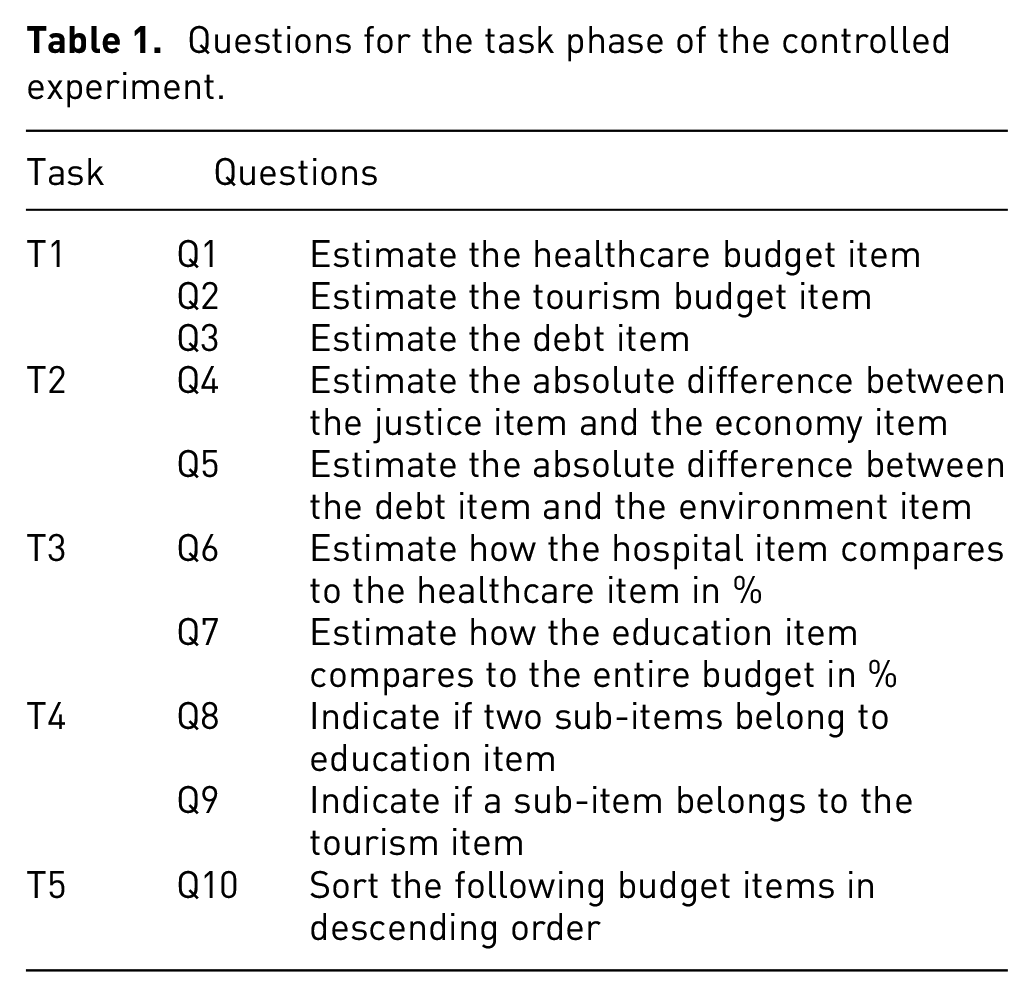
(T1) Single-item estimation
The participant is asked to estimate three budget item absolute values (Q1 to Q3). He gives his answer by adjusting a slider setting the chosen value in million of dollars.
(T2) Item comparison
The participant is asked to estimate the absolute difference between two budget items, again by adjusting a slider expressing the chosen difference in millions of dollars. This task is asked twice (Q4, Q5).
(T3) Part-to-whole estimation
The participant is asked to estimate the relative difference in % between two items having a part-to-whole relation (Q6, Q7). Question Q7 is relative to the whole budget. He answers by adjusting a slider in %.
(T4) Hierarchical relation identification
This task seeks to evaluate the hierarchical relation understanding performance. The participant is asked to indicate if two sub-items belong to the same parent item (Q8), and if a sub-item belongs to a specific parent item (Q9). Answer is given using a radio button.
(T5) Item ordering
The participant is asked to sort all the budget items in descending order depending on their values. The answer is given using drop-down menus.
For each task, the participant first sees the assigned task without seeing the visualization, for example, first telling him/her that he/she will have to estimate the education item value in the next visualization. When he/she is ready, the participant clicks on a Ready button, sees the visualization and the answering form together, clicks on a Validate button when satisfied with his/her answer and then move on to the next assigned task with a Next button. Completion times are recorded between the clicks on the Ready and Validate buttons. The participant can return and see the previous answers, but cannot change them.
Task completion results
Measures and statistical tests
Depending on the answer type and domain, we use different measures and relevant statistical tests. Quantitative continuous answers to questions Q1 to Q7 from Table 1 are derived into relative estimation errors values
To evaluate whether the differences in the distributions between V1 and V2 are statistically significant, we performed statistical hypothesis testing, setting a usual Type I error rate of 5%. For the estimation tasks (T1 to T3, Q1 to Q7), we used a Wilcoxon-Mann-Whitney non-parametric test on the distributions’ median values. We chose this test since the distributions often have outliers. This test is more robust in that regard compared to the Student/Welch tests. However we also observed that these latter two tests give similar conclusions. The Chi-squared test is used for Q8 to Q10 binary answers. Finally, for completion times, we use the Student/Welch tests on the distributions’ average values.
Estimation error results
Distributions of estimation errors to questions Q1 to Q10 for both datasets, are given in Figure 9. We can observe that the estimation error median from Q1 to Q5 is statistically smaller with V1 than V2, except for Q1 on D1 where no statistical difference has been found. This suggests that for tasks T1 and T2, Waffster let a user perform these tasks with better precision than a tree-map. These results extend some previous user studies such as13,14 which show that estimation error is usually lower with one dimensional marks than with two dimensional marks. We anticipated this result since budget items in the Waffster design vary vertically, except for their last possibly incomplete line. These results are also coherent with Park et al. study 60 which showed that a unit-based representation of a value require less efforts for a user to understand.
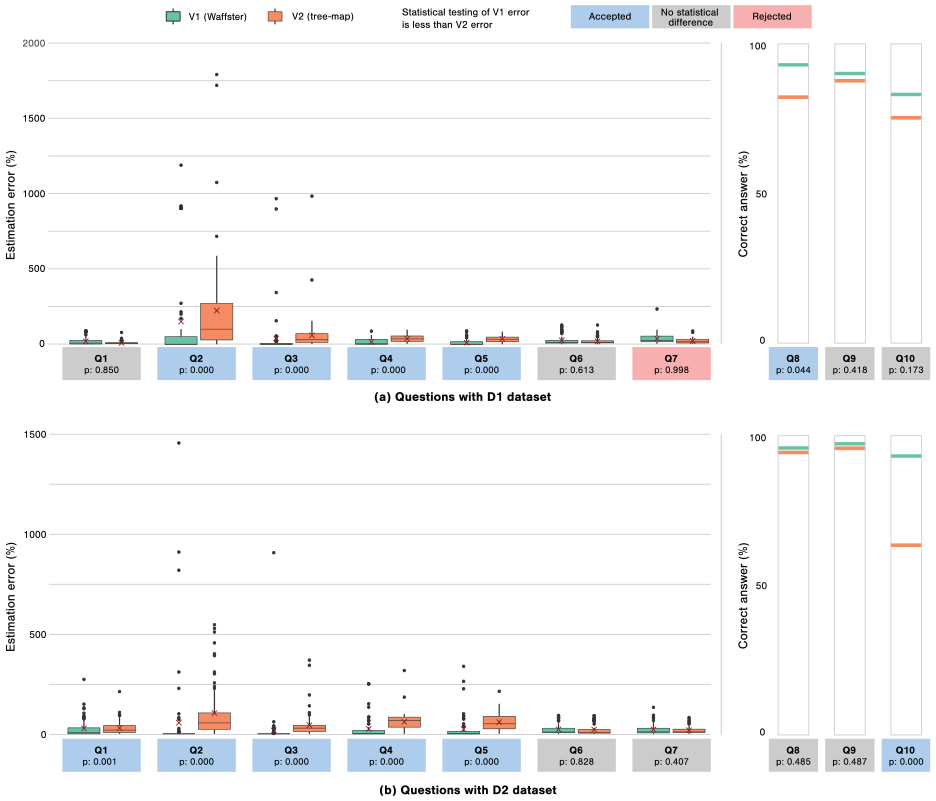
Estimation error results. Distributions of participant answers to quantitative continuous questions Q1 to Q7 of the user study (left), and success rates of participants to binary questions Q8 to Q10 (right), depending on the tested design: (a) Questions with D1 dataset and (b) Questions with D2 dataset.
For the part-to-whole estimation task (T3), distributions of errors sometimes show mostly not statistically significant similar results (Q6, Q7). For the Q7-D1 dataset, users using V2 statistically performed better. Our intuition is that since a tree-map aggregates the representated values, it might helps the user to estimate the area ratio, especially for Q7, where the question is about estimating the ratio between a sub-item and its direct parent item. However we observe that both designs offer rather low errors with this question, with a 10% average error.
Similarly, we did not observe statistically significant differences on tasks T4, where both designs let the participant perform with a very low error rate. However, for T4, we observe 96% of correct answers with V1, and 93% of correct answers with V2. For the ordering task (T5, Q10), the difference is stronger, and even statistically significant with D2. Which required choosing values on several drop-down menus, we observe 86% of correct answers with V1, and 73% of correct answers with V2.
Completion times
Distributions of completion times are detailed in Figure 10. Overall, we observe results that concur with the estimation error ones: V1 let the users perform faster on T1/T2/T4/T5 (with positive testing on Q2, Q3, Q4, Q5-D1, Q9-D2, Q10), and the opposite on T3 where V2 let the users perform faster (positive testing on Q6 and Q7), which concern again the part-to-whole task.
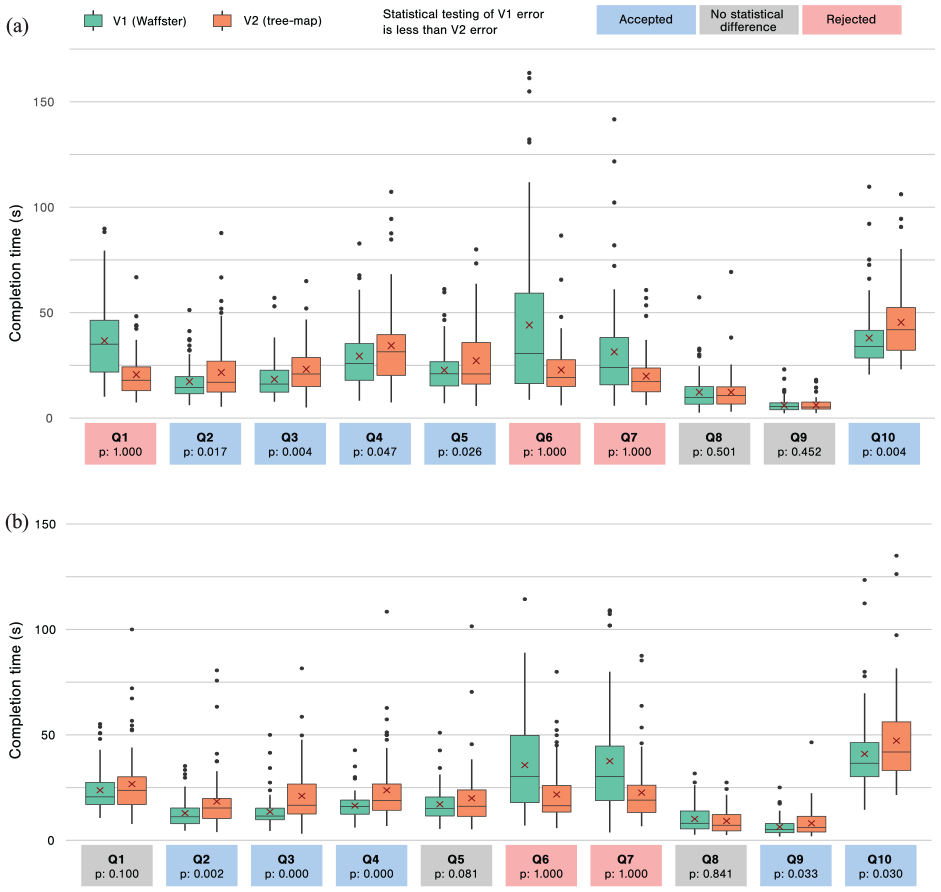
Completion time results. Distributions of participant completion times for each question of the user study: (a) Questions with D1 dataset and (b) Questions with D2 dataset.
Quantitative feedback results
We collected quantitative feedback, detailed in Table 2, using eight feedback questions F1 to F8. The first six questions are binary preference questions between V1 and V2. The first one is general, while the five others focus on each targeted task T1 to T5. They all show clear preference for the Waffster V1 design, with positive Chi-squared tests for all of them.
Feedback survey results.
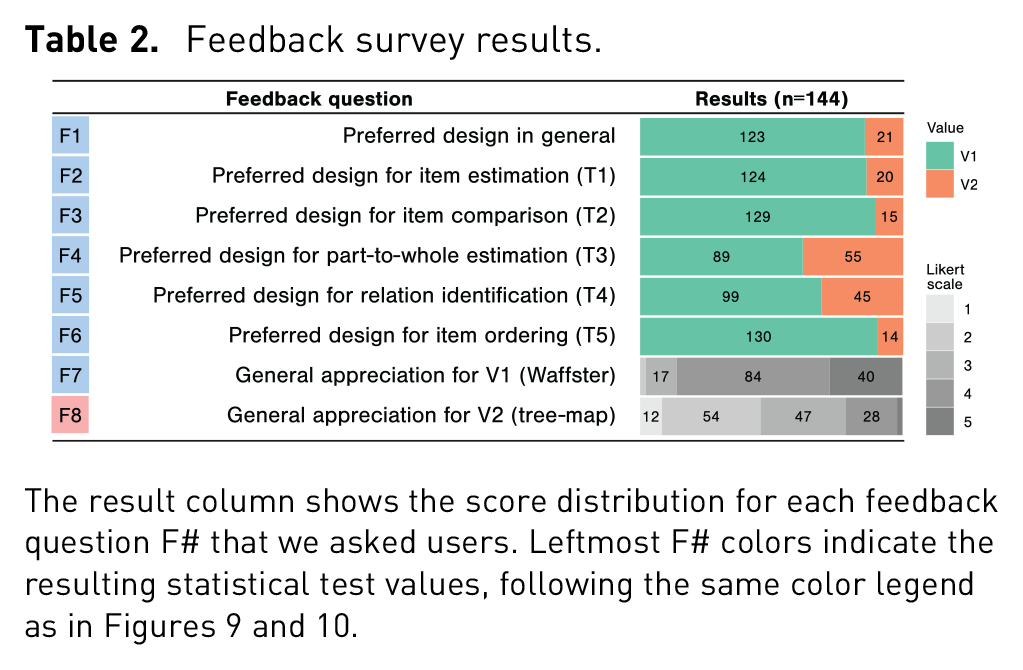
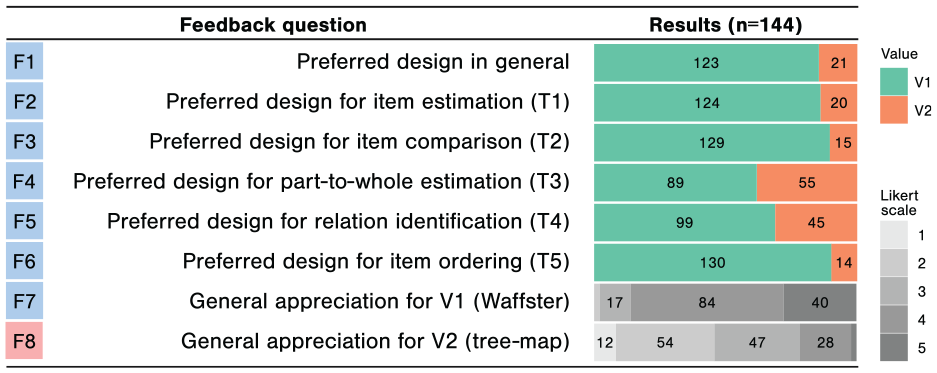
The two last questions F7/F8 ask for five levels Likert-scale evaluation of each design. These results show again that in term of appreciation level, Waffster is far better evaluated than a tree-map with our cohort with an average level of
Controlled experiment limitations
Several limitations can be raised and discussed about the proposed user study. First, users were recruited among Le Devoir subscribers, on a voluntary basis, invited to participate to a research study that had developed a budget data visualization for supporting laypersons targeted stories in a media context. It is thus likely that these users have a certain interest in budget data in general, and innovative media formats. Absolute general appreciation of regardless V1 and V2 has probably been impacted. Nonetheless, results would probably be different with a different, for instance less educated, population. Yet, it has been shown that numerical literacy and understanding of high magnitude amounts affect all types of population.2,66
Second, since that study has been done remotely, we could not fully control the experiment environment. Notably, the user display resolution, the color calibration, and possible distractions were mostly out of our hand. We encouraged users to not use a small display and to pause between two questions if being distracted but that does not guarantee that they followed these indications, nor they were not distracted during a single question. However they were sensitized to these aspects and also the duration of the experiment during the preliminary consent form step. The possible occurrence of outliers values also motivates the fact that we did our statistical tests on the median value of the results distributions.
Third, the D1 and D2 budget dataset are mock data where budget item amounts are multiples of the fixed square representative value. By doing so, we can guarantee that no rounding error, introduced by budget leaf nodes, biases the estimation made by users regarding the true item value, compared to the tree-map. However, that also mean that this user study does not evaluate indeed that possible effect in a full real case scenario. However let notice that the possible rounding error for budget leaf node is at most half a unit square. We give in the following section an example of the precise rounding error in a real case scenario.
Case study
Elections are widely covered by mass media. In 2018, Le Devoir prepared its media coverage of the Québec provincial election. During the electoral campaign, political parties publicized many promises. Each party also disclosed its financial framework to illustrate how these promises would be funded if it won the election. Le Devoir experimented with Waffster to present these data in order to let readers discover insights, and understand how these promises would impact the provincial budget. 67
The chosen reference budget was the projected one proposed by the government in power for 2022–2023. Its total amount is around $247B (income and expenses) decomposed into 55 budget items in a hierarchy whose maximum depth is 3. A $50 M representative square was chosen which led to the creation of 4965 squares and budget item amounts varying with a factor of 1000 from the smallest to the biggest. The average absolute rounding error is 0.23 square per leaf budget item. The accumulated rounding error back propagated up to the hierarchy root is the equivalent of 4.27 squares.
Based on Waffster, we built a scenario for each of the four political parties. Besides, the user could also explore the budget by himself. Each scenario presented around five electoral promises, their impact on the budget, and how the party planned to fund them. Each of these scenarios takes around 2 min to complete at a normal pace.
Within the month that followed its publication, this visualization-based article has been visited by around 21,000 unique readers, compared to an average 3000 readers for all articles. Readers spent an average time of 284 s using the proposed visualization. This is equivalent to around 2.5 party scenarios. This article ranked fifth of all Le Devoir political stories during the electoral period.
We analyzed reader feedback on the two Facebook posts made by Le Devoir showcasing this visualization-based interactive story. These two posts attracted 183 comments, 288 shares, and 384 Facebook reactions. This is much higher than the overall statistics during the electoral campaign, which brought on average 26 comments, 41 shares, and 117 reactions per story. Among the 183 comments, 10 were praising the innovative visualization-based format. Twenty comments initiated discussions on the political parties promises shown in the visualization. These specific comments triggered many discussions and debates comprising a total of 90 answers.
On an additional note, note that since that experiment, Le Devoir has reused Waffster and the proposed hierarchical waffle chart for other stories, for instance on greenhouse gas emission decomposition data, and student distributions among university programs.
Conclusions and future work
In this paper, we explored the use of a novel unit-based hierarchical waffle chart layout as an interactive way to present public budget data. This is an important issue for economic literacy, supporting citizens in their understanding of our democratic and political systems. Mass media play a key role in this context and therefore they regularly need to visualize this kind of data. To support this objective, we also included in this paper a thorough survey of online public budget data visualization designs. We present a controlled experiment to compare the proposed design to a tree-map layout, as being the most ubiquitous way to present public budget data by mass media. Finally, we describe a case study from our media collaborator which participated all along in the design process of this project.
An interesting future work could be to incorporate a user’s prior knowledge prediction and feedback mechanism. It has been shown that such a mechanism may improve recall and comprehension of the data.68,69 It would also be useful to adapt the proposed design for a global budget comparison task.
Footnotes
Funding
The author(s) disclosed receipt of the following financial support for the research, authorship, and/or publication of this article: We acknowledge the support of the Natural Sciences and Engineering Research Council of Canada (NSERC)
Supplemental material
Supplemental material for this article is available online.