
Abstract
In general, Natural Language Processing (NLP) algorithms exhibit black-box behavior. Users input text and output are provided with no explanation of how the results are obtained. In order to increase understanding and trust, users value transparent processing which may explain derived results and enable understanding of the underlying routines. Many approaches take an opaque approach by default when designing NLP tools and do not incorporate a means to steer and manipulate the intermediate NLP steps. We present an interactive, customizable, visual framework that enables users to observe and participate in the NLP pipeline processes, explicitly manipulate the parameters of each step, and explore the result visually based on user preferences. The visible NLP (VNLP) pipeline design is then applied to a text similarity application to demonstrate the utility and advantages of a visible and transparent NLP pipeline in supporting users to understand and justify both the process and results. We also report feedback on our framework from a modern languages expert.
Introduction and motivation
Visual computing approaches have been adapted in order to understand and open up machine and deep learning methods, and have been used as an educational means to understand black-box machine learning techniques. For example, TensorFlow Playground 1 is an interactive, web-based tool that enables users to understand neural networks via visualization. Also, Strobelt et al. 2 use visualization techniques to analyze the hidden state dynamics of recurrent neural networks (RNNs). Recently, Chatzimparmpas et al. 3 present a survey of surveys on the use of visualization for interpreting machine learning models.
However, there remains a lack of such approaches that demonstrate visualization techniques which enable the user to see the results of Natural Language Processing (NLP) processes.
The black-box metaphor is defined by Cambridge dictionary 4 as: “a system or process that uses information to produce a particular set of results, but that works in a way that is secret or difficult to understand.” Merriam-Webster dictionary 5 also defines black-box as: “anything that has mysterious or unknown internal functions or mechanisms.” Guidotti et al. 6 in their survey describe black-box systems as systems that hide their internal logic to the user. 6 This usually applies to machine learning and artificial intelligence models as the user can not interpret their behavior and predictions. In the context of this paper, black-box is used to refer to a system that lacks the explanation of how the results are derived and does not enable the user to observe intermediate results and fully understand every stage of the process. For example, a common challenge with standard NLP tools is that they produce results and do not obviously relate to the original text such as in normalization. Furthermore, many standard pre-processing steps involve stop words removal and do not enable users to visually moderate this list.
Additionally, the lack of transparency is considered a challenge when developing interdisciplinary visual analytics tools. Visualization also tends to reduce informational dimensions to produce a focus that shows certain perspectives or interpretations of the data. 7 As a result, intended users struggle to trust such results until they understand how they are derived, which is in most cases very challenging. In this paper, we address this challenge by making the NLP process visible, transparent, user-steerable, and understandable. To achieve that, our proposed tool leverages both the machine’s computation power and human intelligence. It enables users to set explicit parameters to interactively guide the automation. Complete automation can accelerate the process however that is not the goal of VNLP.
While previous related research is generally guided by the well-established information visualization mantra 8 : “Overview first, zoom and filter, then details-on-demand,” this paper presents an alternative approach that focuses on the details first: in other words, the process that is used to generate the overview in the first place. Our approach starts with raw text input into the NLP pipeline before developing visible layers of abstraction step-by-step to help the user understand the underlying choices made at each stage of the VNLP pipeline. Figure 2 illustrates the visible stages and the corresponding visual encodings. Finally, the overall visible result is explored based on the combined machine + user’s parameter choices and intelligence.
Feldman 9 introduces seven process levels that NLP systems use to understand spoken language or text: the phonetic, morphological, syntactic, semantic, discourse, and pragmatic levels. In this context, our design is concerned with the presentation of the input data and the morphological level where the smallest parts of the texts are transformed into their base forms. Our novel design makes this transformation fully visible.
This paper contributes the following:
The introduction of the Visible NLP (VNLP) concept;
A novel interactive design of a generic VNLP pipeline that enables users to explicitly observe the NLP pipeline processes and update the parameters at each processing stage;
A case study application to text similarity quantification to demonstrate the usefulness and advantages of our approach; and
Feedback on our framework from a domain expert in modern languages.
This paper’s main contribution is conceptual and exploring every different implementation of tools and algorithms is beyond the scope of a single paper.
The rest of this paper is organized as follows: Section 2 discusses previous work related to our approach. Section 3 defines the most important and domain-related terminology. Section 4 outlines the design requirements. Section 5 introduces the VNLP implementation and design. Section 6 is dedicated to the evaluation of our visible framework. Section 7 introduce the future work possibilities of our research.
Related work
We first review the text visualization surveys as they provide a valuable overview of the field. Then, we include literature that incorporates some visible NLP aspects within their approaches before, finally summarizing the most common and recent text visualization approaches to review the visual design space used to represent text embeddings.
Text visualization surveys: Multiple surveys focus on text visualization approaches. Kucher and Kerren 10 provide an interactive visual survey of text visualization techniques. Cau and Cui 11 present a review of text visualization research. Federico et al. 12 survey visual analytics approaches that focus on scientific literature and patents, while Heimerl and Gleicher 13 survey the visual approaches that facilitate word embeddings. In addition to these, Alharbi and Laramee 14 present the first survey of text visualization surveys, describing 14 survey papers that focus on text visualization techniques. They classify the text visualization approaches into five categories based on the classification each survey proposes. Most early text surveys categorize their literature based on the target input (single or multiple documents) such as, 15 but recent surveys10,16,17 propose multi-faceted classifications that map visual approaches into multiple dimensions, such as tasks, interaction, and presentation. Alharbi and Laramee also include surveys that support digital humanities tasks, such as Jänicke et al. 18 Jänicke et al. provide an overview of applied visual encoding techniques to visualize text content in the digital humanities. Their review also includes a taxonomy of the text analysis tasks in this domain. Alharbi and Laramee 14 report that a common challenge described in the surveys is the lack of user interaction to support analysis. Culy 19 compiles a list of visualization tools that he implemented which serve a variety of applications, such as concordance views and dependency trees.
Explainable machine and deep learning models: Several solutions are proposed to solve the lack of transparency in machine and deep learning models. They are often referred to as explainable artificial intelligence (XAI).20–22 Hohman et al. 23 present the state-of-the-art of deep learning visualization using an interrogative framework which includes: Why, Who, What, How, When, and Where. Chatzimparmpas et al. 3 introduce a survey of surveys on the use of visualization for interpreting machine learning models that are designed to clarify and help understanding of the intermediate process and layers of such techniques. Multiple surveys focus on the interpretation of ML models with the use of visualization, such as Endert et al. 24 , Choo and Liu. 25 Some of these designs are implemented for educational purposes, such as TensorFlow Playground, 1 while others are implemented to cluster, classify, and understand reduced-dimensionality vector space, such as Smilkov et al. 26 and Liu et al. 27 Other approaches incorporate visualization to understand and interpret machine learning models, such as Refs.28–32 Zhang et al. 33 propose a visual and interactive framework for interpreting, comparing, and debugging machine learning models. Ribeiro et al. 34 present a methodology and visual tool that tests individual capabilities of NLP models using different test types. However, most of these advanced techniques are difficult to implement and understand for domain scholars.
The following section first reviews the related visual approaches that visually integrate and facilitate NLP functions and enable user interference in order to update the analysis process. Then, we review the research space for the most common visual representations used to depict text embeddings.
Related visible NLP: Some text visualization approaches incorporate NLP functions to pre-process text data and produce embeddings that are used in visual interfaces.
Abdul-Rahman et al. 35 incorporate tools that enable the user to segment and tokenize text based on multiple presets. They illustrate the results with a dot plot graph to depict text re-use patterns.
Jänicke and Wrisley 36 propose a visual alignment approach to align versions of medieval poetry, providing an overview alignment using a bipartite graph. The user can investigate an alignment from the bipartite graph using an intermediate level they call “meso reading,” which illustrates the aligned pairs of lines between two text versions and provides a preview that annotates stopwords and encodes the frequency of reused words using saturation.
AlignVis 37 enables the user to manipulate the alignment process via multiple options such as stopword removal and normalization. AlignVis visually encodes the alignment between the source and target text using a bipartite graph, and encodes the confidence value of the similarity measurement using the color of the text segments and edges.
In contrast to our work, very few previous approaches explicitly demonstrate the processes they undertake and enable the user to explicitly manipulate intermediate NLP steps to observe the effects of changes.
Visual design space: we summarize some of the most common and recent text visualization approaches to represent the visual encodings to depict text embeddings.
Dot plot graph: The dot plot 38 is a 2D matrix plot used to detect similarities and reuse between two sequences. Abdul-Rahman et al. 35 incorporate tools that enable the user to segment and tokenize the text based on multiple presets, integrating a dot plot to illustrate different text alignments patterns. Schätzle et al. 39 incorporates standard visualizations and interaction to analyze historical linguistic data. They exploit a 2D matrix plot to compare between selected dimensions across given time periods. Other approaches utilize dot plot and facilitate colors to encode the embeddings.40,41
Storylines and stream graph: Storylines and stream graphs are another common visual design to depict interrelationships between text entities and detect patterns above the level of individual terms. 42 TRAViz 43 facilitates a stream graph to enable the user to investigate the variation between texts, with the number of lines and the size of the font indicating the frequency of word reuse. Silvia et al. 42 adopt a storyline design to illustrate interactions between entities in a story and explore how entity relationships evolve over time. The word tree 44 is another kind of directed stream graph used to illustrate the occurrence of terms in a text. Alharbi et al. 45 similarly propose an overview of translations that connects aligned segments using curved lines.
Bipartite graph: A number of approaches incorporate bipartite graphs to illustrate text alignment and communicate the comparison task. Riehmann et al., 46 for example, combine bipartite graph and pixel-based representations to detect plagiarized text passages in PhD theses. Jänicke and Wrisley 36 provide an overview alignment using a bipartite graph. Abdul-Rahman et al. 35 also incorporate an interactive bipartite graph in which the user can define a subset to examine using a dot plot design, and Alharbi et al. 37 adapt a bipartite graph to illustrate the alignment results and color each edge based on the confidence value to guide the domain scholar in refining the alignment.
Heatmap and pixel-based graphs: Geng et al. 47 implement the vector space model to explore patterns of variation between different translations of Shakespeare’s Othello, with the term-document matrix visualized using a heatmap where the color encodes the term frequency. Keim and Oelke 48 extract different statistics, such as average word and sentence length, and vocabulary measures, such as word frequency and lexical diversity, and encode them using a pixel-based graph.
Parallel coordinates: A parallel coordinates design is considered a useful technique to explore multi-variate data. 49 The embeddings are translated into each dimension and polylines connect the corresponding entities. Parallel Tag Clouds 50 integrate the font size and color to visually encode embeddings. Geng et al. 47 implement parallel coordinates of the similarity measures in order to depict the variation between translations. Alharbi et al. 45 incorporate parallel line charts to illustrate the terms embeddings that are generated to convey the variation between different texts.
Word clouds: Word clouds depict tokens that occur frequently in the source text.51–53 VarifocalReader 54 integrates word clouds to summarize the numbers and topics segments to serve as a starting point for further analysis. Parallel Tag Clouds 50 use the font size mapped to word significance in a document collection which is arranged vertically. Oelke et al. 55 propose a glyph-based visualization to illustrate multivariate properties, integrating a word cloud approach to show the most descriptive terms of each topic cluster, and integrating encodings to visualize the relevancy of each topic to a specific class and determine the extent to which a topic is discriminative for a class.
Network graphs: Several approaches attempt to present the word relations in a text, with embeddings usually encoded using color, edge thickness, and font size. DocuBurst 56 integrates WordNet 57 to generate vocabulary measures, depicting the word relations using radial graph layouts. Phrase Nets 58 and SentenTree 59 use a directed node-link graph. The edges encode the strength of the relation between the connected words and the size of the words represents the word frequency. Wattenberg 60 propose the arc diagram which visually connects repeated substrings using translucent arcs.
Beck et al. 61 present and discuss five sources of representation and annotation challenges: ambiguity, variation, uncertainty, error, and bias. They outline the proper approaches to address these challenges and the consequences when applying insufficient treatments.
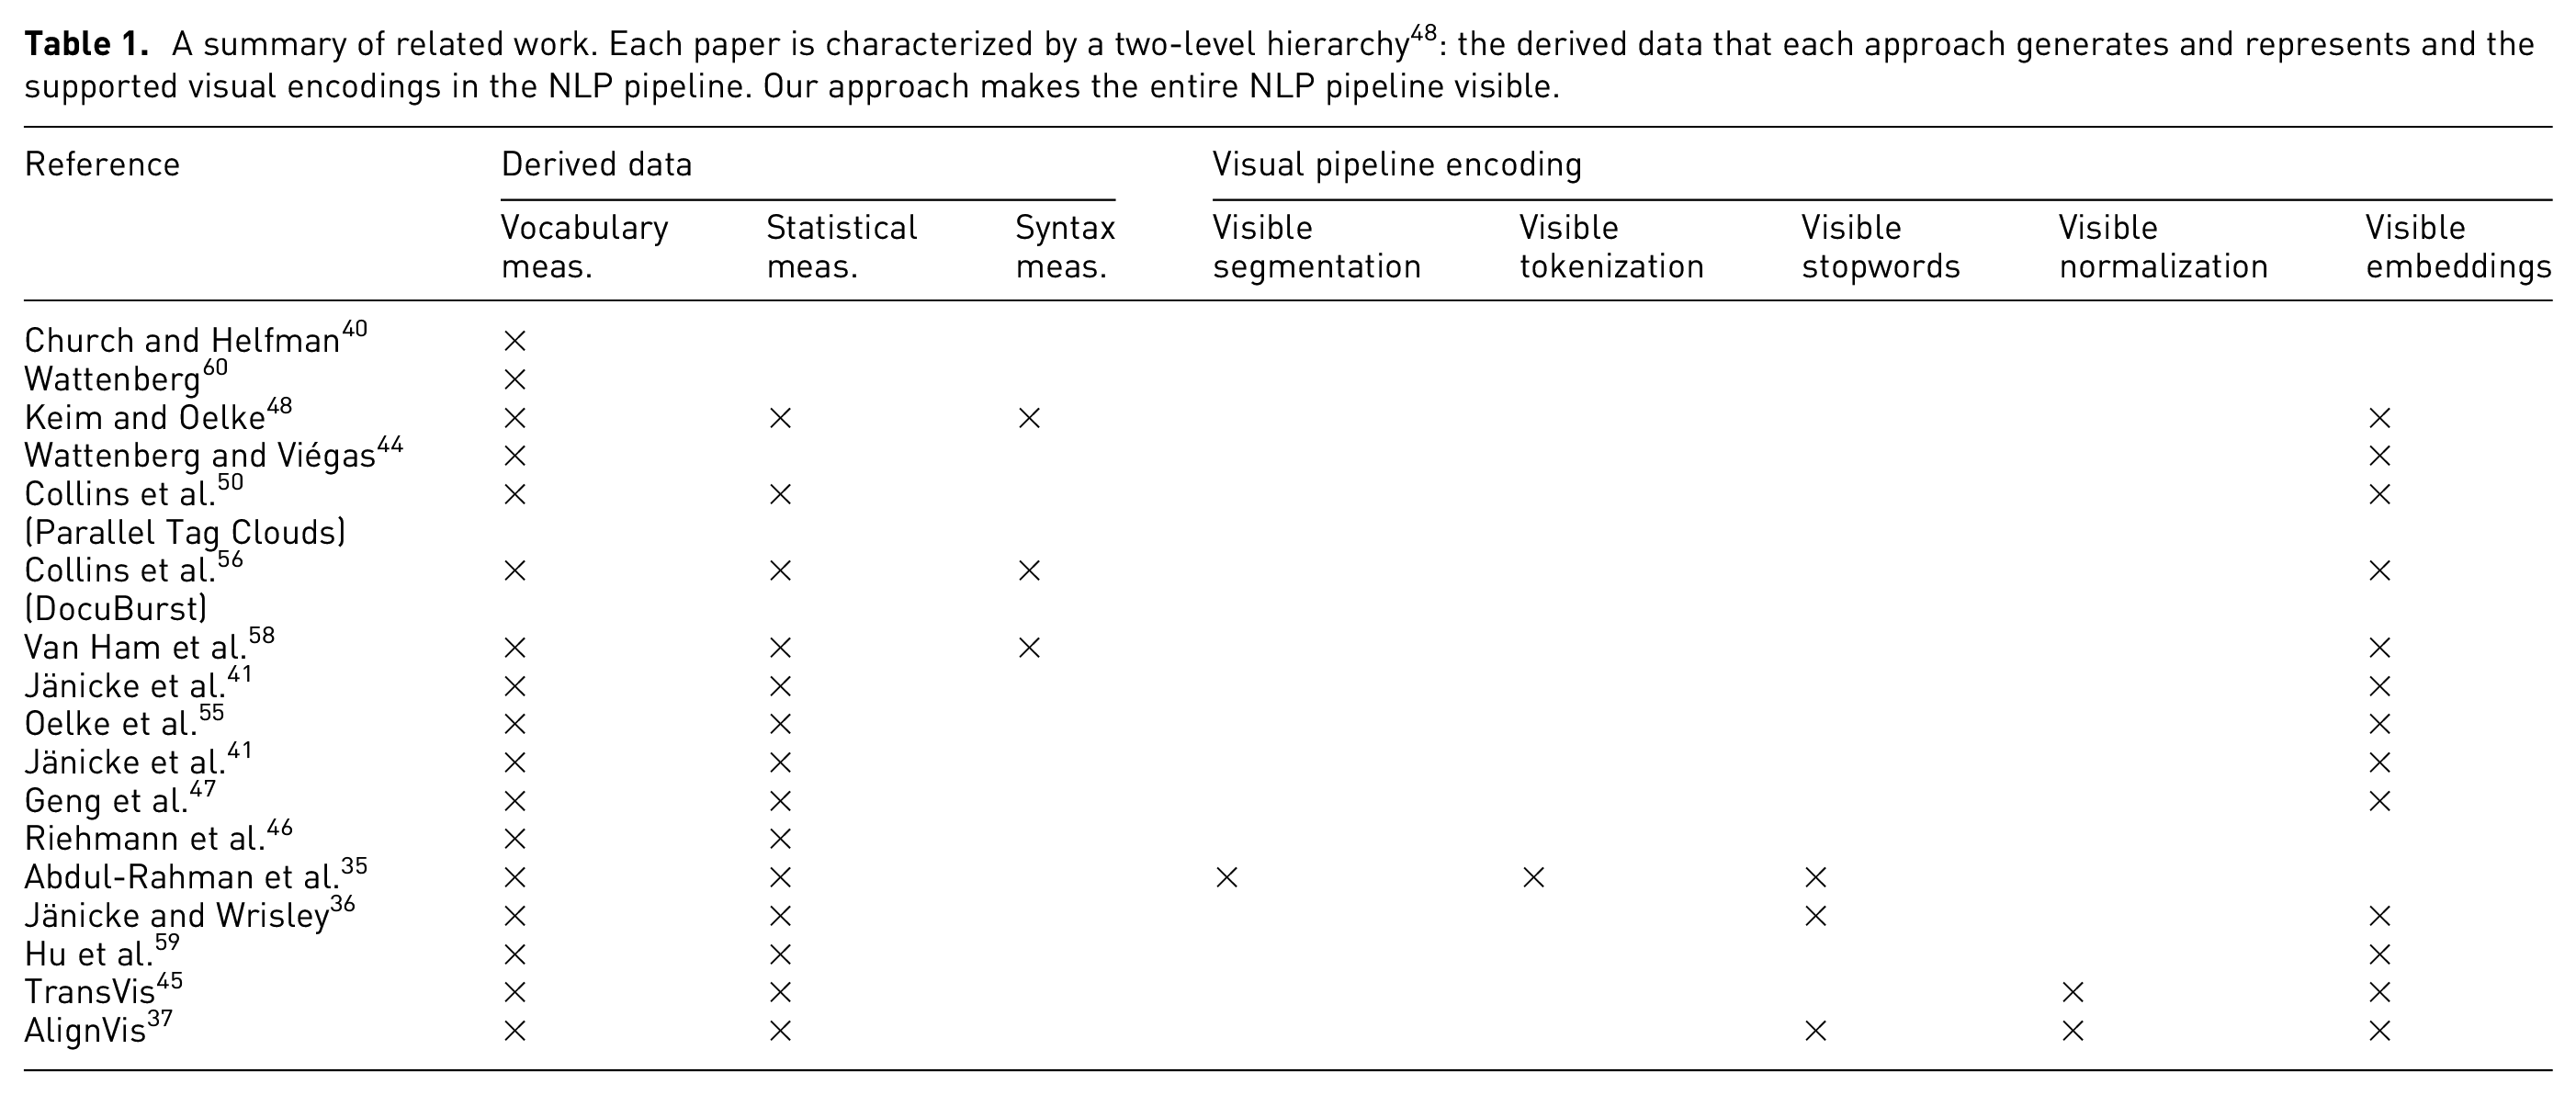
Table 1 summarizes the representative approaches classified into a two-level hierarchy. The first level classifies the approaches based on the derived data. We adopt the Keim and Oelke 48 literary analysis classification: statistical measures, vocabulary measures, and syntax measures. Vocabulary measures include word frequency and word co-occurrence. Statistical measures include global aggregation such as average word length and occurrence proportion. Syntax measures comprise the utilization of a syntax tree of the texts. The second level summarizes the work based on the supported visual encoding of our adapted pipeline. We categorize the documents based on the existence of interactive means to explicitly modify the task by the user. The representative approaches include common visual designs for texts and designs that support parallel texts. The visible embeddings refers to the support of visual encoding of feature extraction phase results.
A summary of related work. Each paper is characterized by a two-level hierarchy 48 : the derived data that each approach generates and represents and the supported visual encodings in the NLP pipeline. Our approach makes the entire NLP pipeline visible.
Our approach is different from a fundamental perspective as it enables the user to explicitly manipulate the parameters of the NLP pipeline process. At each stage, the user can explicitly observe the effect of their changes in each process. The design is applied to a text similarity application to explore the effect on the embeddings that are controlled by user preferences.
Definitions and terminology
This section defines the most important and domain-related terminology required for developing a visible NLP pipeline.
Segmentation includes methods that break a document down into independent and minimal textual components which are usually called segments or tokens. 62 A text segment is defined as a contiguous piece of text that is linked to itself but largely disconnected from the adjacent text. 63
Tokenization is the process of dividing a segment into individual tokens. A token is an instance of a sequence of characters that are semantically grouped together. 64 Some literature, such as Pak and Teh, 62 considers tokenization as a sub function of segmentation. To some extent, we agree they overlap and could be used interchangeably, however in the context of this paper, we refer to tokenization and segmentation as two stages, as defined here.
Stopwords also called function words (as opposed to content words) are defined as commonly used words that are omitted in the process of generating a concordance. 65 Stopwords can include very common terms such as definite and indefinite articles, auxiliary verbs, prepositions and conjunctions, as well as common corpus-related words with no discriminant value within a given domain or corpus. An example of the latter is the word learning, which can be a stopword for the domain of education and a content word in the domain of computer science. 66 Stopwords have grammatical functions and can be defined subjectively or objectively. There are multiple studies that focus on the significance of stopword removal as a pre-processing step.67–69
Normalization includes techniques that are applied to reduce the dimensionality of feature space. 70 It involves applying linguistic models to restore words to their canonical forms in a standard language. 71 Stemming and lemmatization are examples of normalization.
Stemming is the procedure that standardizes and generally truncates all words with the same root to a common base form called a stem irrespective of their inflections. 72 For example: amusing and amusement have the same stem as amus. 73
Lemmatization is similar to stemming in terms of function. Lemmatization functions produce lemmas which are dictionary-based words which, unlike stems, are not truncated or ambiguous. 74 For example: amusing and amusement have the same lemma as amuse. 73
Word embeddings are semantically meaningful vector representations of words in a high-dimensional space. 75 Word embeddings can also capture linguistic regularities, for example vector operations vector(“Paris”) − vector(“France”) + vector(“Italy”) results in a vector that is very close to vector(“Rome”), and vector(“king”) − vector(“man”) + vector(“woman”) is close to vector(“queen”). 76 BERT (Bidirectional Encoder Representations from Transformers) 77 produce (Pre-trained) contextualized word embeddings. As opposed to word2vec 78 and GloVe, 79 BERT can generate multiple word vectors for one word based on the context. Word2vec and Glove produce only a single word representation of each word.
Document embeddings, or so-called document representations, 78 are the mapping of documents to numerical vector spaces. There are different approaches used to generate document embeddings such as TF-IDF 80 and BM25. 81 Contextual word embeddings can also be used to vectorize documents.78,82
Feature is an individual measurable property, characteristic, or behavior observed. 83 In the context of document embeddings, a feature is a unique or unusual term, phrase, or sentence that can characterize a document.
Requirement analysis
Throughout our collaboration with domain experts in the digital humanities (DH), there was consistent interest in a transparent design that reveals how the results are derived rather than just presenting the end results. The experts also expressed appreciation of an informative framework that explains intermediate steps and makes them visible. Therefore, we established and incrementally refined the following requirements based on our discussions with the DH expert: R1 Provide information about each pipeline stage that includes an explanation of the corresponding stage, what it outputs, and how it affects the intermediate results. R2 Show explicit results at each stage and enable the user to adjust the parameters to observe the effect at the individual stage level. R3 Provide a dynamic layout that customizes the pipeline and scales up and down in line with user preferences. R4 Demonstrate the usefulness and advantages of the design through an NLP application.
The requirements are coupled to the discussion of our design in the following section.
Implementation and design of visible NLP pipeline
Overview of the visible NLP pipeline: Our VNLP pipeline illustrated in Figure 1 shows the NLP sub-processes that play a major role in NLP results, quality, and correctness. In Figure 2, we illustrate the visual mappings that are implemented to support the VNLP pipeline stages. Apart from the raw input data and the end results, the user cannot normally observe the behavior, intermediate results, and parameters of the NLP algorithms. The visible NLP pipeline contains the primary stages: visible text segmentation, visible text tokenization, visible stopword removal, visible text normalization, and visible embeddings generation. In the last phase, visible similarity measurements may be applied to derive alignments. This phase includes a selection of popular, state-of-the-art distance, and similarity measurements. Cosine, Hellinger, and Okapi BM25 measurements support the TF and TF-IDF embeddings. 84 Word Mover’s Distance, on the other hand, is hypothesized to be the best that utilizes the quality of word2vec embeddings. 78
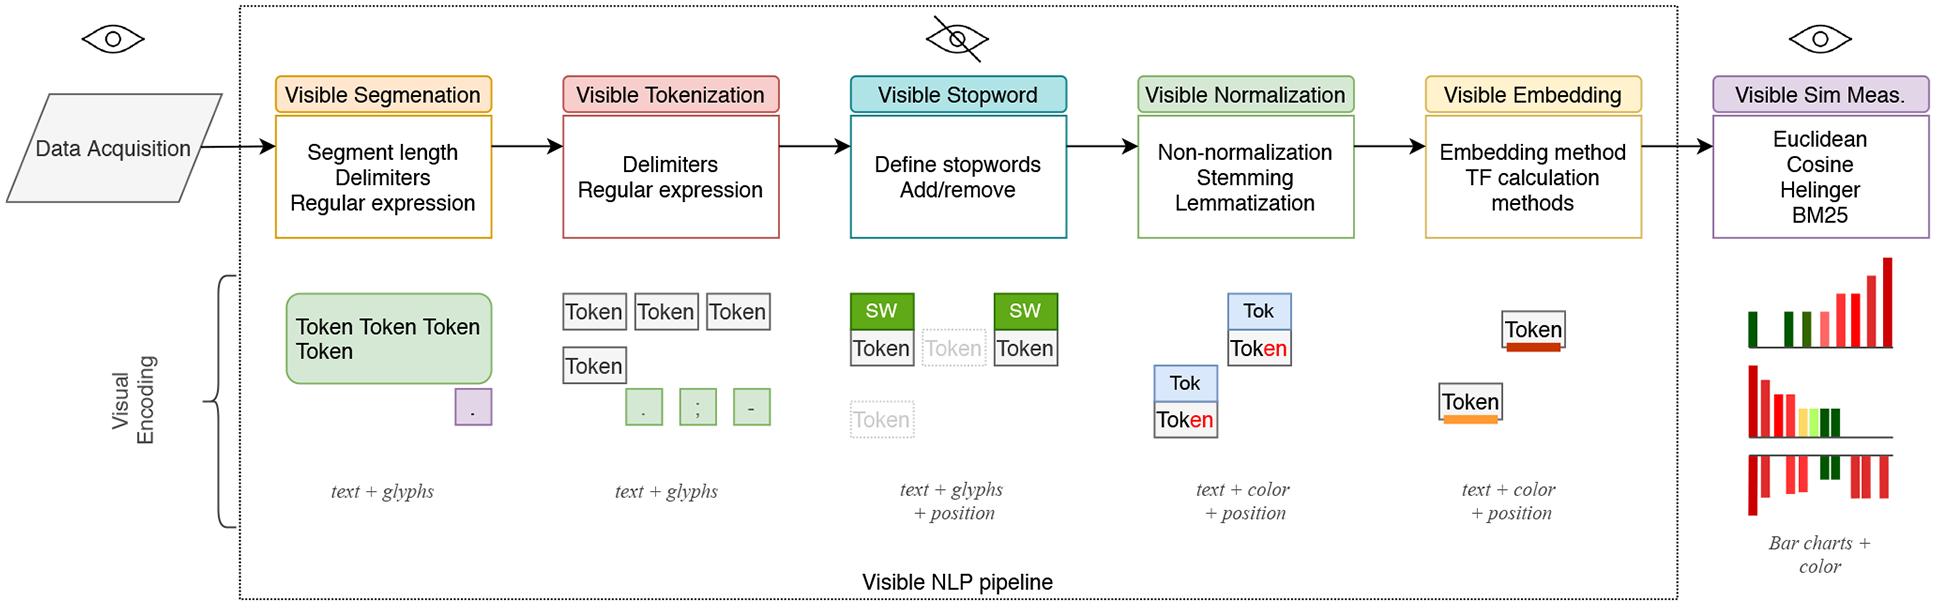
Our VNLP pipeline illustrates five main NLP stages: text segmentation, tokenization, stop word removal, normalization, and embeddings. We integrate an application to text similarity quantification to demonstrate the usefulness and advantages of our approach. In the lower half, we show the corresponding visual encodings of the VNLP pipeline stages.
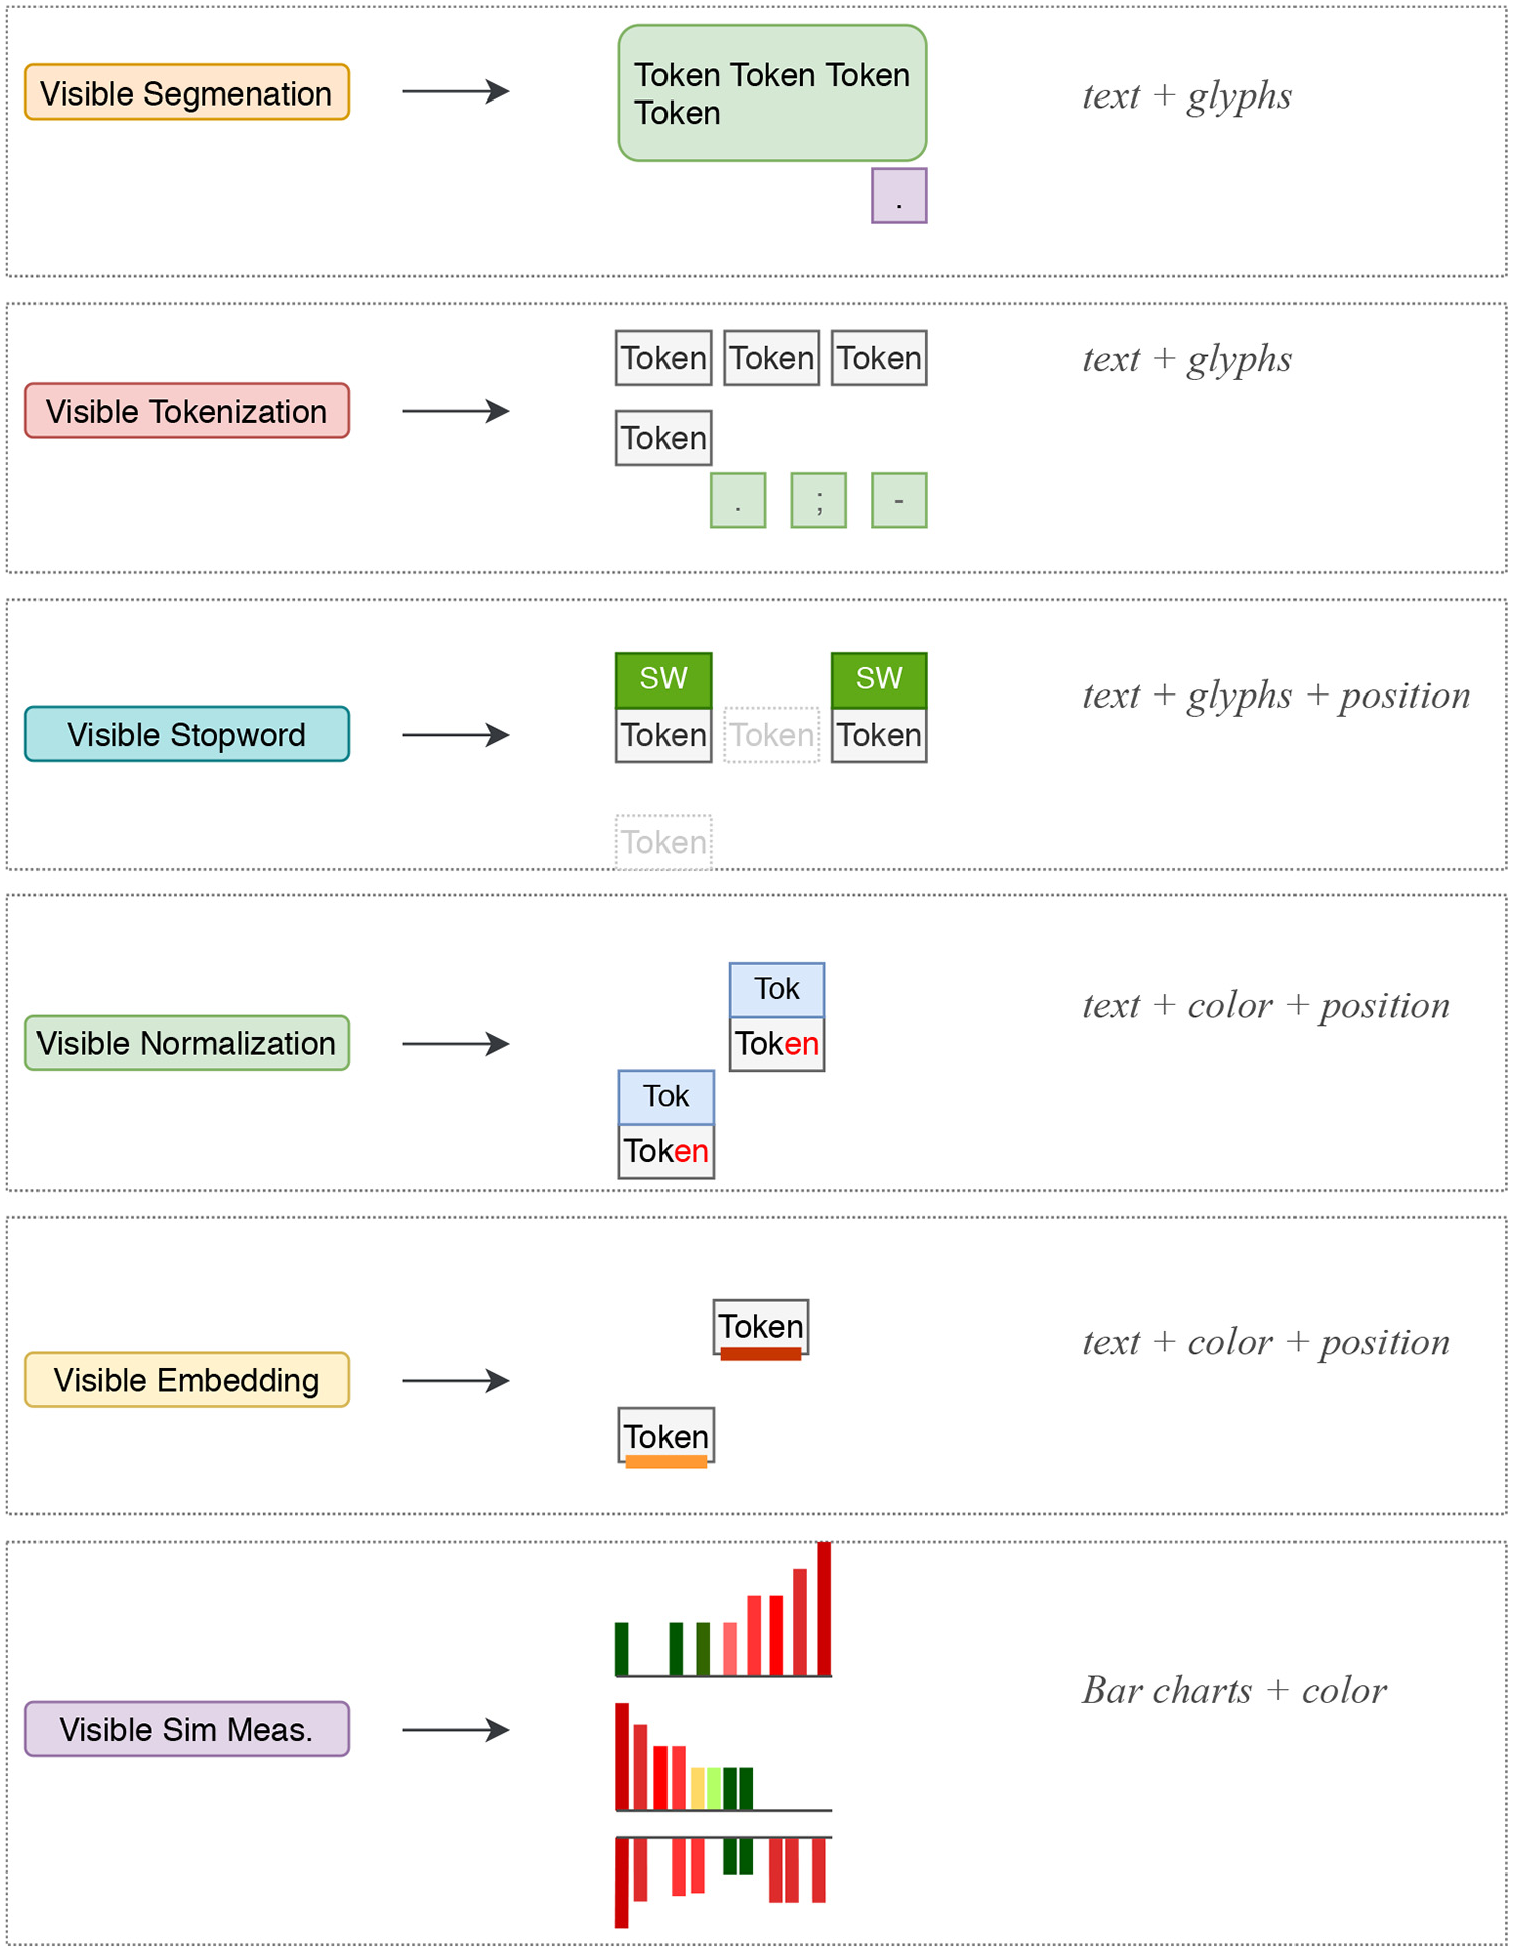
A summary of the visual encodings that are implemented to support the generic VNLP pipeline stages.
The implementation of the VNLP pipeline consists of four main components. The first is a window which accommodates options to customize the focus and target texts (Figure 3(a)) and enables the user to set their preferred font size to make the layout more accessible (R3). It also provides an option that shows the similarity results in the other texts in the collection. The user options include multiple preset color schemes which can be applied to visible embeddings and a similarity histogram graph.85,86 This window appears only on demand as it incorporates functions related to the VNLP application process (R3).
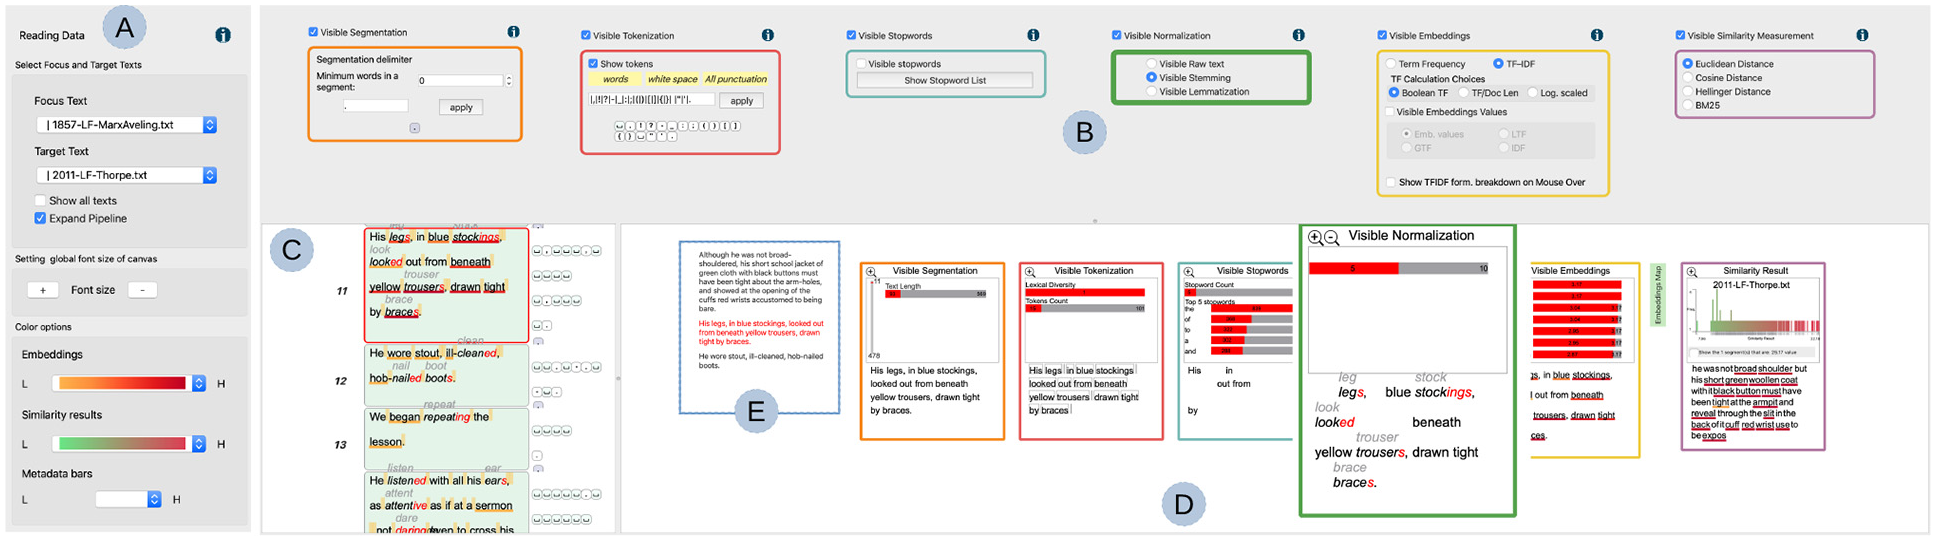
An overview of the VNLP pipeline: (a) a dialog that accommodates options to customize the text, update the font size for accessibility, and the color options, (b) the VNLP pipeline GUI where the user controls the parameters of each stage, (c) the user-chosen focus text, (e) the context of the user-selected segment, and (d) the visible results pipeline with each result reflecting the parameters chosen in the corresponding GUI component.
The second component is the GUI pipeline where the user interaction is applied in order to modify and steer the underlying visible pipeline stages (Figure 3(b)). All of the visible pipeline processes are computed interactively at the same time the user changes the parameters. The GUI components are ordered based on the pipeline overview discussed in Section 5 and shown in Figure 1. Each GUI component integrates an information icon which, when clicked, presents detailed information about the corresponding stage, as shown in Figure 4 (R1). Each GUI component can be toggled on or off and the corresponding stage in the visible result pipeline is then updated in the other view below (R4). This is to help the user focus on any stage and display the space efficiently.
An information dialog view that shows a detailed explanation of the corresponding VNLP pipeline stage.
The third component is the current visible results pipeline which renders the results and responds to the user’s interaction in the GUI pipeline (Figure 3(d)). Each result integrates a graph that provides a metadata analysis related to the corresponding stage. The user can magnify a given stage for closer analysis (R3). In the following sections, each stage is discussed in detail as well as the correspondence between the visible results and the GUI components (R2). The visible results pipeline view includes the current user-chosen segment and context segments (Figure 3(e)), where the user can navigate to the previous or next segment in the same window. The current segment is indicated by a red font color. Next to the visible embeddings result, the window provides a green button (magnified in Figure 3(d)) which leads to the embedding map to illustrate the overlap between the focus and target segment (R4). This application is discussed further in Section 5.4. The final item in this view, called the “similarity results,” demonstrates the VNLP application and is discussed further in Section 5.4 (R4).
The fourth component shows the focus text which is segmented based on the user’s choice (Figure 3(c)). The segments are illustrated top-down as they appear in the original text in order to facilitate the reading task. In this view, the tokenization and segmentation separators are illustrated next to the individual segments to show the position of the separators in each segment.
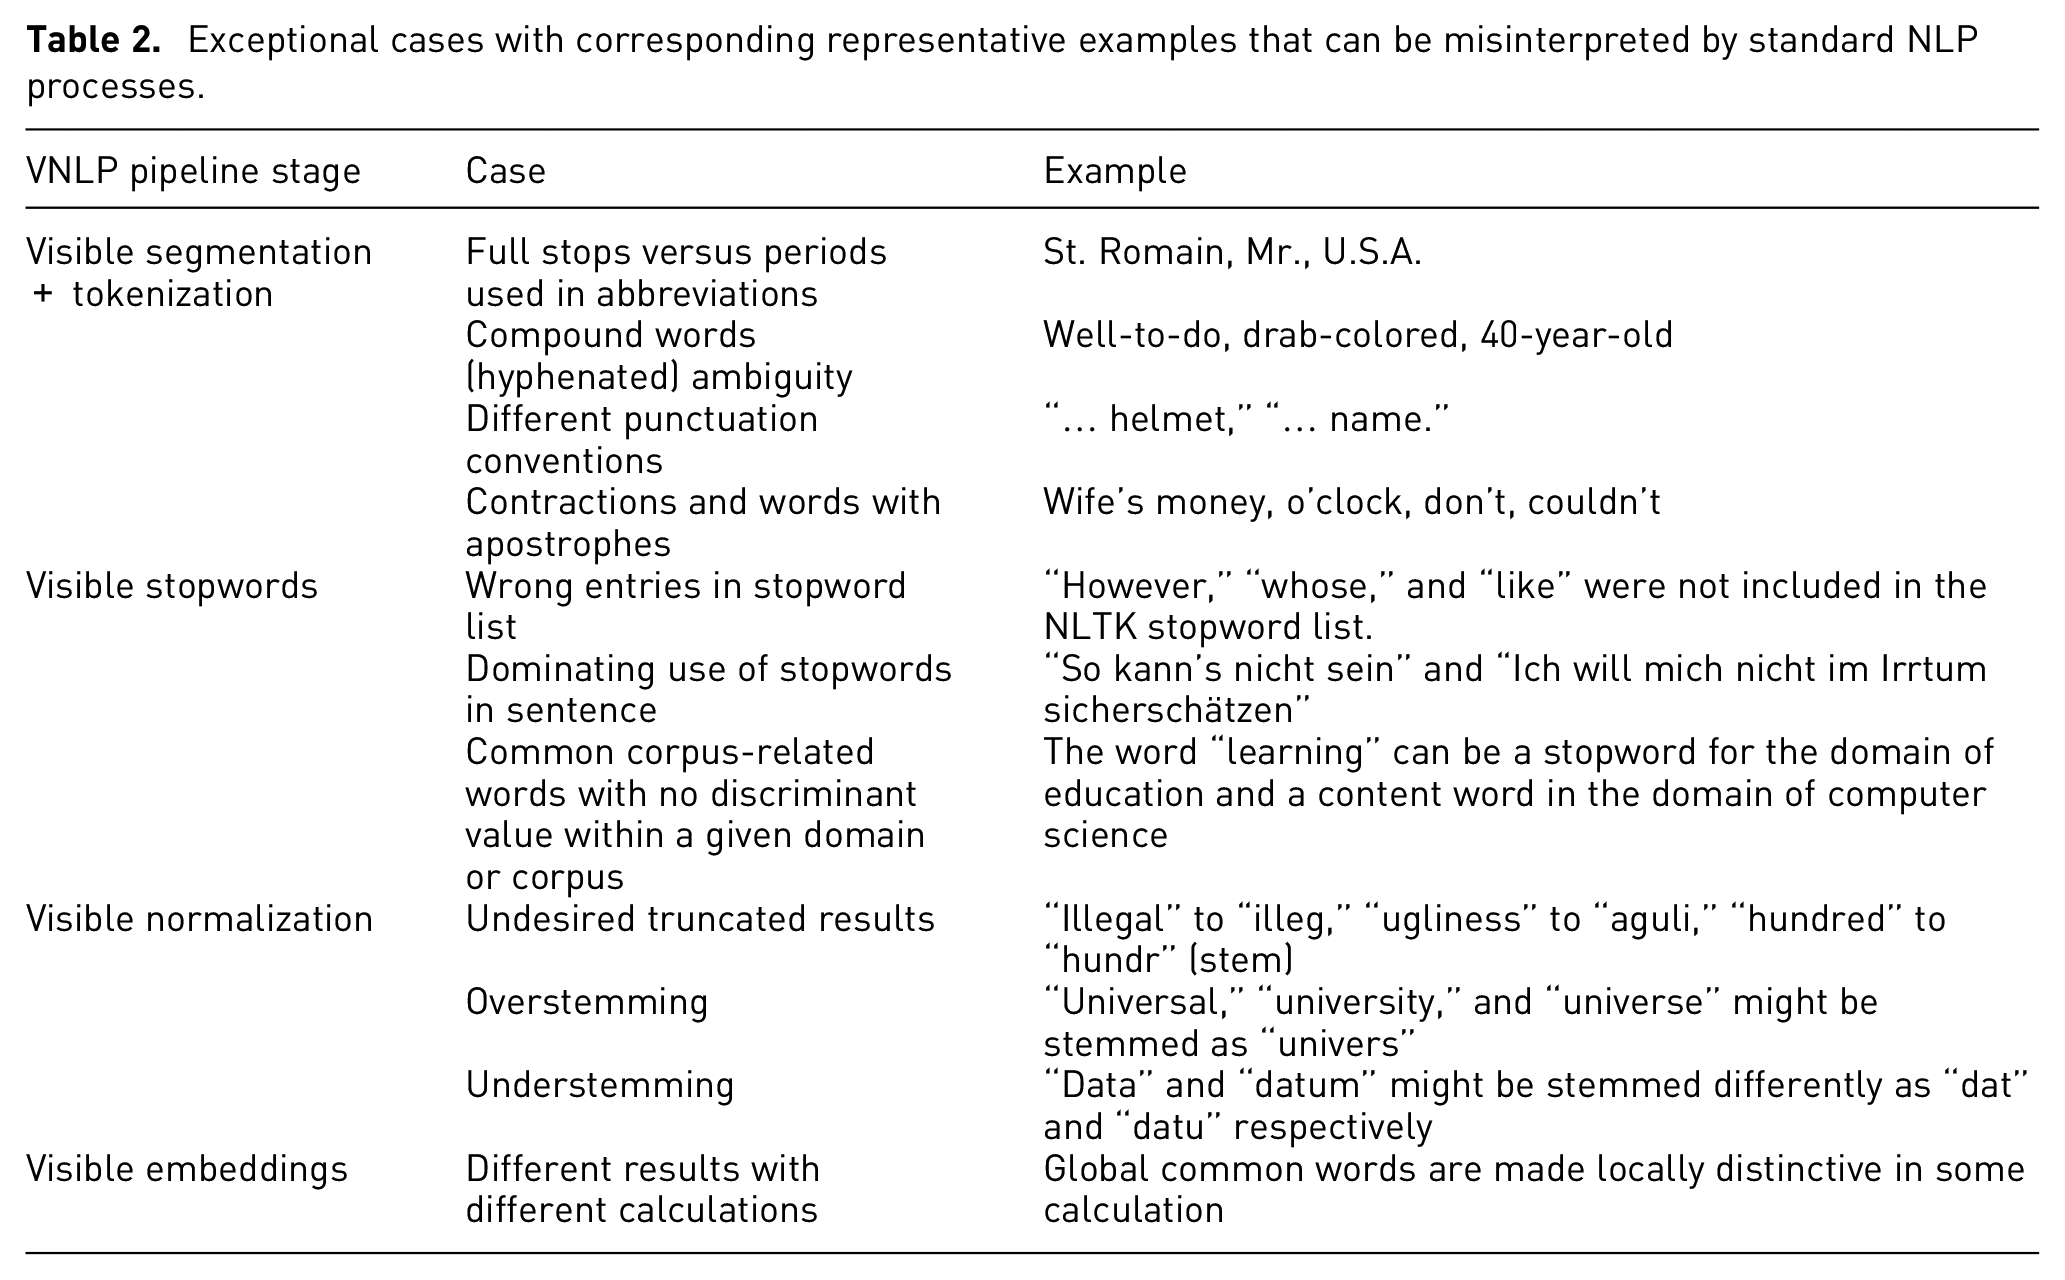
Table 2 presents some exceptional cases that can produce undesired results when applying standard NLP algorithms.
Exceptional cases with corresponding representative examples that can be misinterpreted by standard NLP processes.
Visible segmentation and tokenization
Segmenting the text into tokens or sentences might sound like a trivial task, but various implicit decisions and different languages can affect the results. Most default segmentation tools do not necessarily provide similar results and each implementation incorporates implicit decisions of which the user may not be aware.
For example, the NLTK function (
Our design enables the user to explicitly define how to segment and tokenize the text using specific separators or regular expressions. The user-specified delimiters are shown in the GUI component as the user enters them, as can be seen in Figure 5. It also incorporates a segmentation threshold to avoid segments that are too short. The visible result is illustrated in Figure 5. Our implementation offers a metadata analysis of the segments and tokens in the focus text in order to provide an overview of the results. In Figure 5(a), the vertical bar indicates the relative position of the user-selected segment and shows the total number of segments in the focus text. The horizontal bar illustrates the length of the current segment and how it compares relative to the other segment lengths. In Figure 5(b), the metadata indicates the lexical diversity of the selected segment, which measures the number of lexical tokens in the segment, and shows the number of tokens the segment includes compared to other segments in the focus text.
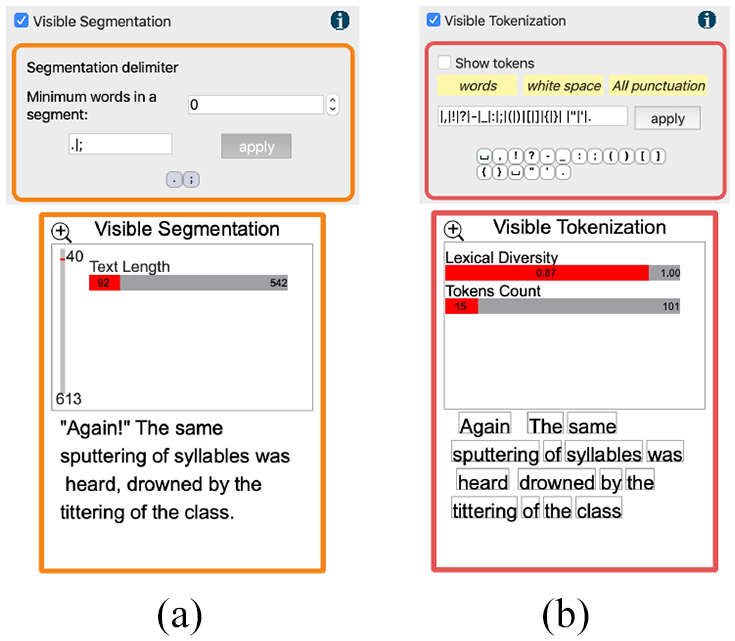
Top: the visible tokenization and segmentation GUI components. Bottom: the visible tokenization and segmentation results. In each result, metadata analysis is provided for an overview of the results.
Using the visible framework, the user can observe the segments and how they are derived, as well as identify unwanted behavior that is difficult to discover without a transparent system. For example, Figure 6(a) shows a case where a segmentation delimiter, a period in this case, is placed in the middle of a quote. Also, due to different writing standards, the closing quotation mark is placed after the period in the middle segment, which causes the quotation mark to be pushed to the following segment. Another example is shown in Figure 6(b), where the period in the word “St. Romain” causes the main segment to be divided into two.
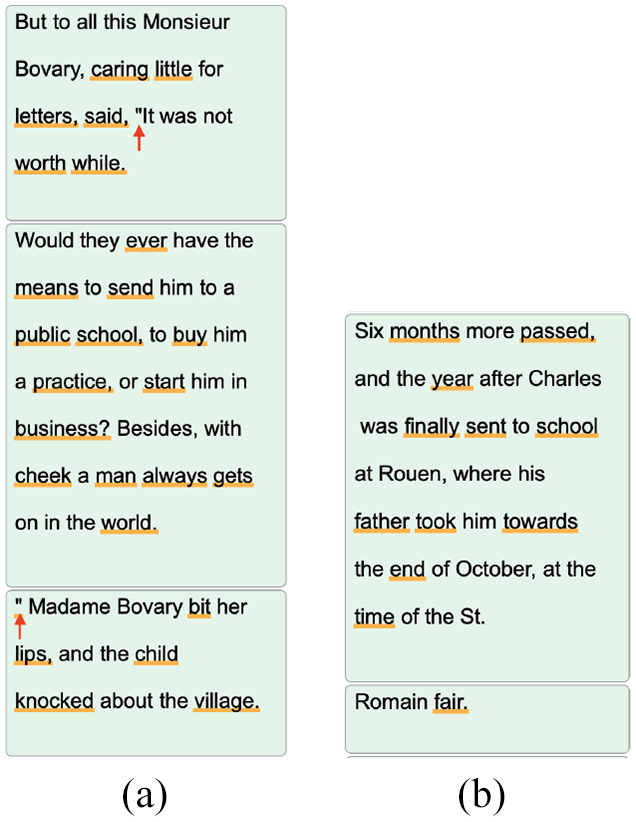
Two examples of ambiguous segmentation cases: (a) a period placement in a quote (annotated by arrows) results in a new segment and (b) the second segment was generated due to the period in the word “St. Romain.”
In the case of tokenization, the user can transparently observe and examine the derived tokens. There are many ways in which tokenization implementations can derive undesired results. For instance, in Figure 7(a) the word “o’clock” is divided into two tokens, “o” and “clock,” when using the punctuation-based tokenizer. This can affect the results in different NLP applications. Figure 7(b) shows an example of an interesting tokenization choice where the compound word “well-to-do” is divided into three tokens which all could be stopwords and consequently the phrase is removed in the next NLP stage.
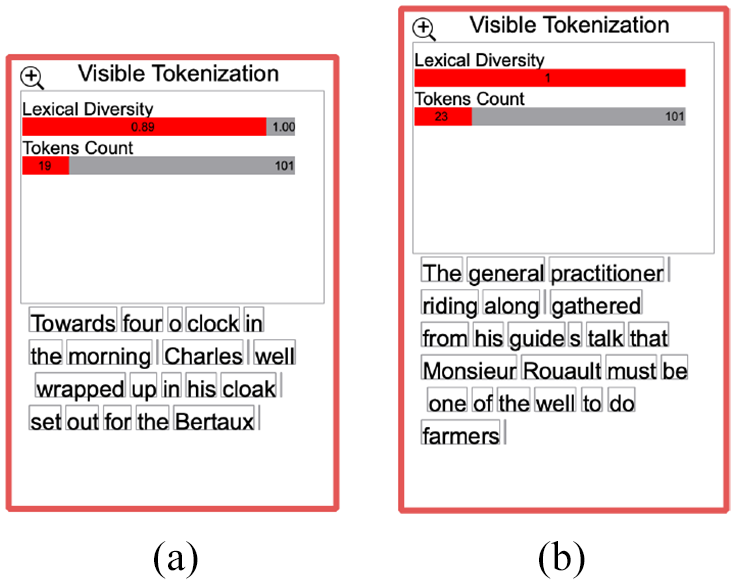
Two examples of erroneous tokenization cases: (a) a inaccurate tokenization of the word “o’clock” and (b) the compound word “well-to-do” is divided into three tokens which are considered stopwords and consequently removed in the following NLP stage.
Visible stopwords
Stopword removal is a common practice in text pre-processing and information retrieval applications. However, other approaches claim that the removal of stopwords may lead to an increase in false alignments.35,36 Research indicates that stopwords can be useful in some applications such as authorship attribution as stopwords tend to be included by the author subconsciously. 48 Most approaches facilitate and integrate a fixed set of stopwords and do not incorporate means for the user to explore and manipulate the stopwords list. By contrast, our design enables the user to observe the stopwords in the focus text by annotating them, as shown in Figure 9. We also implement interactive means to add or remove stopwords and observe the effect on the results accordingly. As shown in Figure 8(a), the user can include the stopword removal function in the visible NLP process, see the current stopwords list and add or remove stopwords. The user can also interactively add or remove stopwords from the visible results of stopwords and normalization stage by right-clicking on the word, as can be seen in Figure 8(b). In this case, for example, the word “however” is not included in the NLTK stopword list. 87 Another example is shown in Figure 10(b). The user observes that multiple words could be considered stopwords, such as “whose,” and “like” which are not included in the NLTK stopword list, and so can right-click on these words and add them to the stopword list, as shown in Figure 10(a).
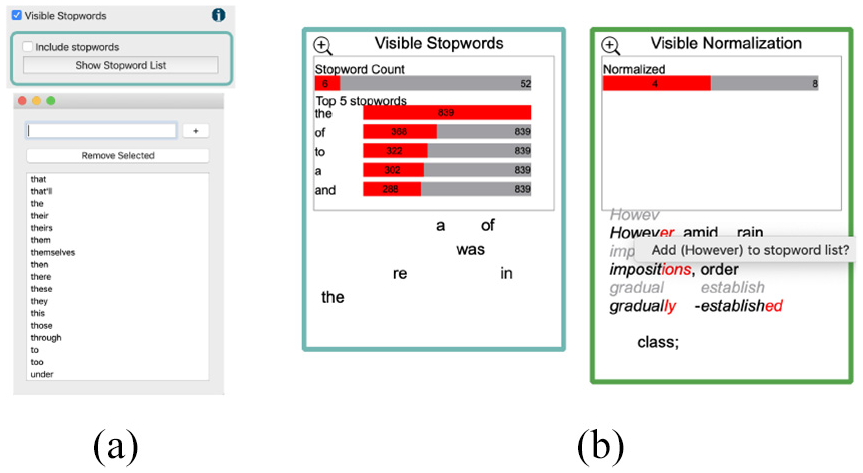
(a) In the stopword GUI window, the user can include or remove stopwords. The GUI provides a list of the stopwords where the user can add or remove them. (b) From the visible results of both the stopwords and normalization, the user can observe stopwords and add words from the normalization results to the stopwords list and vice versa.
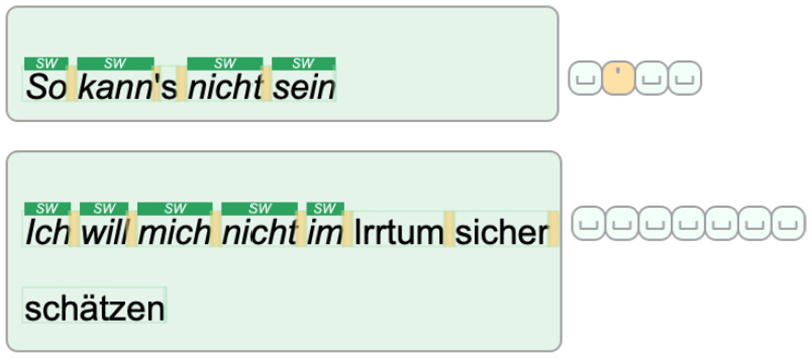
Two cases of visible stopwords. The top shows a case where the entire segment is composed of stopwords. The bottom shows a segment with five sequential stopwords. The glyphs that accompany each segment illustrate the tokenization delimiters chosen by the user.
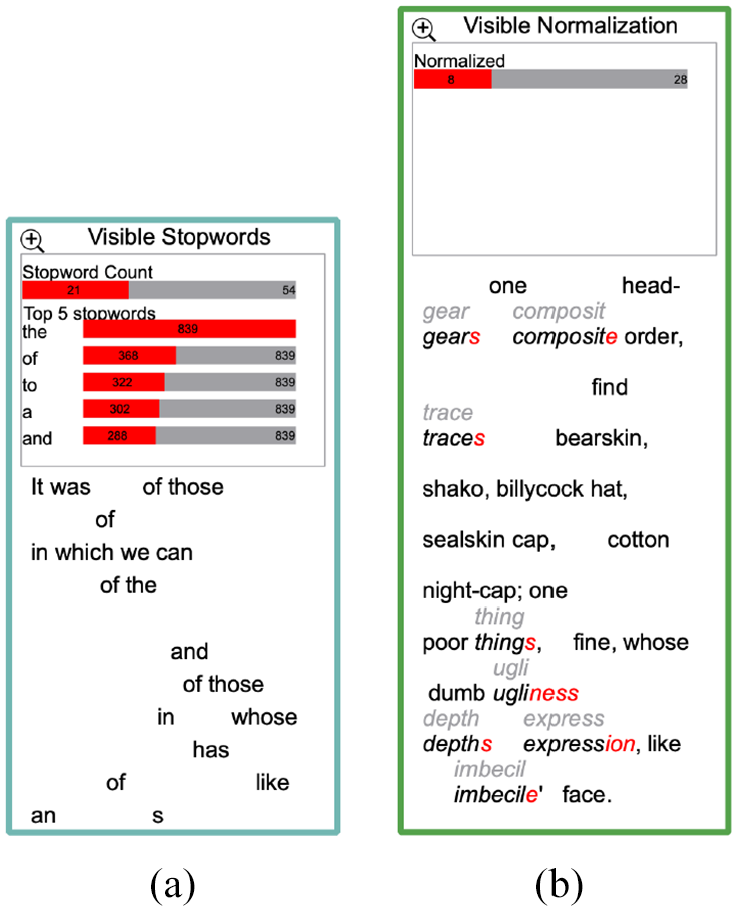
An example of stopword exploration: (a) in the visible stopword window, the user can explore the stopwords included in the selected segment and (b) in the visible normalization result the user can identify candidate words and add them to the stopword list.
When applying our design to Shakespeare’s play Othello, 88 some special cases can be observed. There are cases in which a segment consists only of stopwords, such as the segment “So kann’s nicht sein,” or is dominated by stopwords such as the segment “Ich will mich nicht im Irrtum sicher schätzen,” as shown in Figure 9. The choice of removing the stopwords is not necessarily constructive in such cases. In another ambiguous case, in our tool the word “sei” is not included in our list while other similar words are, such as “sein,”“es,” and “ist.” Therefore, a transparent design that explicitly shows the results and enables user intervention can be useful.
Visible normalization
Most of the approaches in our collection do not offer any means for the user to normalize, verify, or explore the result of normalization. In our collaboration with the modern languages expert, 47 we experienced frequent unsatisfactory results from the normalization implementations provided by GermaLemma 89 and TreeTagger. 90 Although this might be influenced by the nature of our data, we believe the normalization results need to be shown and verified for the user to understand and trust the analytical results. Our design enables users to choose raw text, stemmed text, or lemmatized text to be embedded in the next phase.
Visualizing the results of the normalization process can reveal interesting results for the domain experts that they may not expect or desire. For example, stemming can produce undesirably truncated results, such as the words “forty, hundred” stemmed to “forti, hundr.” While this is the underlying function of stemming, the domain expert may not appreciate such decisions. Another visible example is shown in Figure 10(b). The user can see the normalized form on top of each word if it is different from the current form. For example, the word “ugliness” is transformed to “ugli” which leads to understanding the method used to produce the normalized form.
Visible embeddings
The visible embedding section offers multiple options to manipulate and steer the feature extraction phase. As shown in Figure 11, the interactive options in the GUI window enable the user to specify the statistical quantifying approach. The terms frequency (TF) and term frequency-inverse document frequency (TF-IDF) are used to produce fixed-length vectors of word weights. Since the TF-IDF implementations have different definitions of TF, 91 this phase enables the user to experiment with three different formulas for deriving the TF values in the TF-IDF function. This stage also enables the user to project different embedding values in the visible result as shown in Figure 11. The projected values can be changed to help the user understand the derived embedding results. The user can choose to view the current embedding values, the local term frequency, the global term frequency, or the inverse document frequency. These choices affect the implementation of the TF-IDF and can produce different results accordingly. When the user hovers the cursor over each word, these values can be seen explicitly, as shown in Figure 12(a), and we also provide a breakdown of the formula if the user chooses, shown in Figure 12(b). The formulas were explicitly illustrated to help the domain user understand the different derived outcomes and explain the different embedding values that each calculation produces.
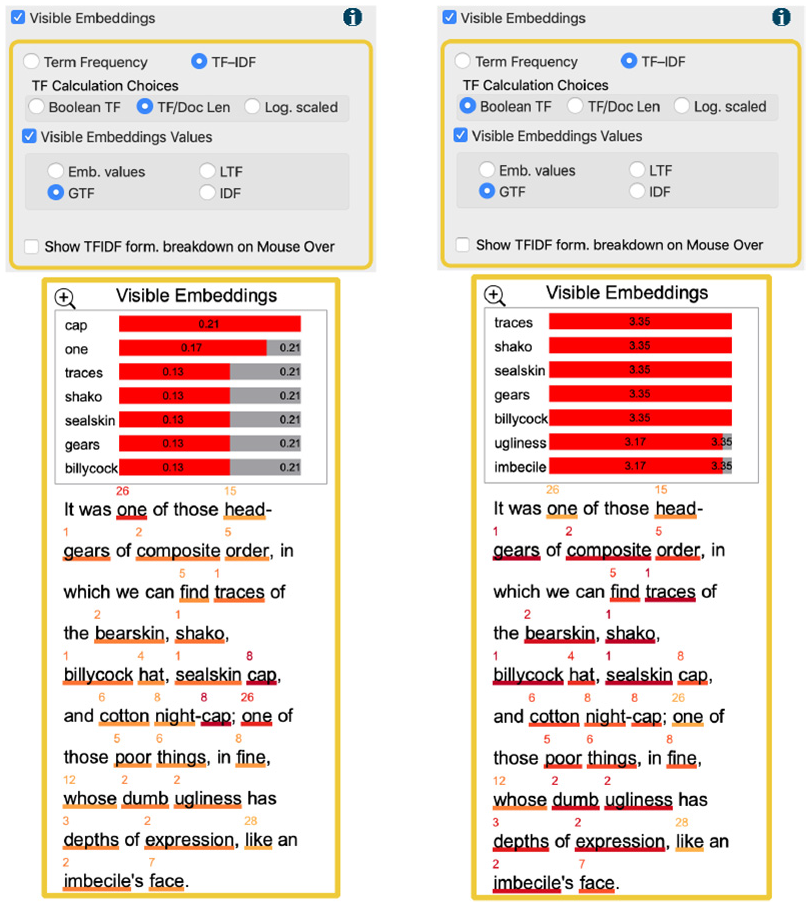
An example of the exploration of user modifications to the visible embedding generation process: (a) the default embedding generation implementation results in common words such as, “one” and “cap” to become distinctive words and (b) after the user changes the TF calculation method, the words “one” and “cap” are considered non-distinctive and other more important words appear.
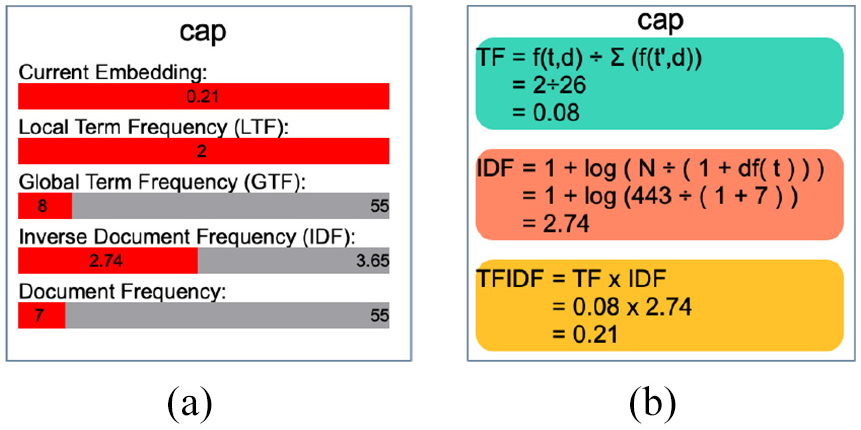
The two views that are shown when the user hovers over a word in the visible embedding result: (a) a summary of the embeddings values that are derived for this word and (b) a breakdown of the formula that is used to derive the current embeddings.
Showing these values explicitly communicates to the user some of the differences between formulations and how they perform. For example, when the user examines the segment in Figure 11(a), the words “one” and “cap” are considered the most distinctive words. This does not align with the domain user’s knowledge as these words are common in the current texts as indicated in the projected values on top of each word. In Figure 11(b), the user changes the embedding generation parameters to use the Boolean calculation for TF and observes improved results that correspond with their assumption.
Evaluation
We evaluate our design by utilizing its features to demonstrate the application of similarity quantification to support and analyze aligned translations in the target text. Following the application, we report feedback from a domain expert in modern languages and translation studies. The case-study evaluation is conducted in the context of higher education with a professor in modern languages that uses NLP tools in his lectures and labs.
Case study: Visible text similarity application
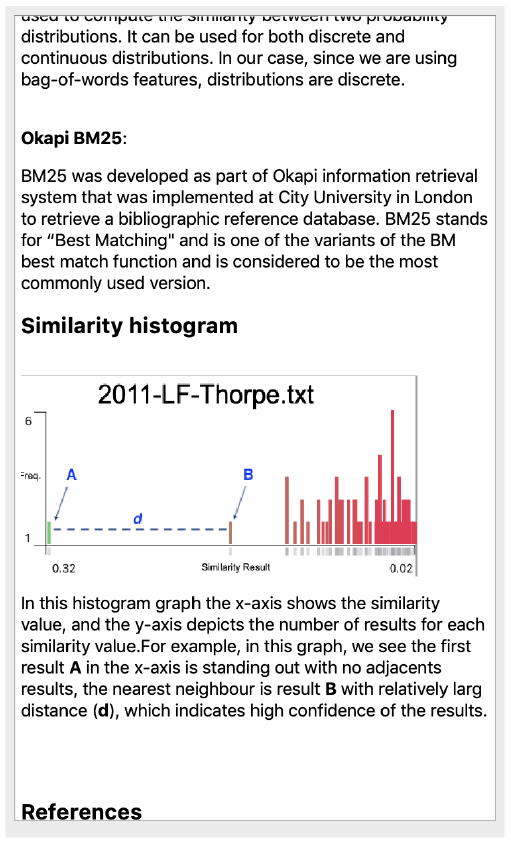
The visible similarity GUI, shown in Figure 3(b), provides a list of similarity measurements from which the user can choose. The visible embedding result incorporates a similarity histogram and shows the most similar segment text at the bottom of the visible result. The x-axis in the histogram depicts the similarity value and the y-axis shows the number of results in each similarity value. The rationale behind this design is to illustrate the notion of the confidence value presented by Alharbi et al. 37 For example, Figure 13(a) shows the similarity results along the x-axis. The distance between the first value and the second value along the x-axis is short when compared with the distance between the first and second results in the histogram in Figure 13(b). The histogram includes a user option to remove the last value column (usually the zero results) as it appears to skew the histogram distribution, as illustrated in Figure 13(c). The user can also observe the similarity results in the other texts in the collection.
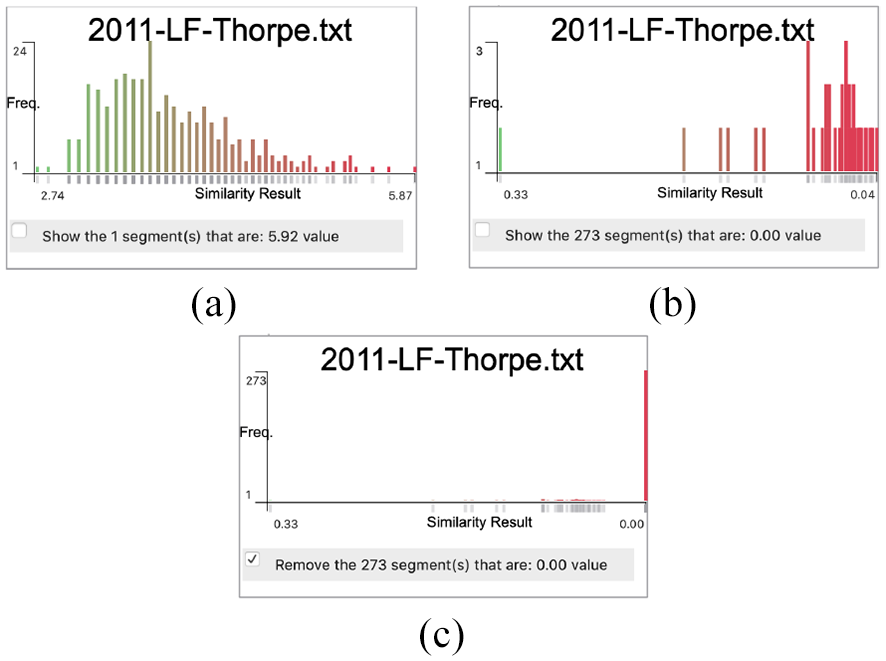
Three similarity histograms that show the similarity results along the x-axis. The y-axis indicates the number of results for each similarity value. The histogram in (a) indicates that the distance between the first value and the second value along the x-axis is small while it is relatively greater in the other histogram (b). The histogram in (c) shows the effect of showing the similarity values that equate to zero.
The embeddings map is implemented to help the user investigate the shared embeddings between the chosen focus segment and the segments in the target text. The embeddings map window, as shown in Figure 14, provides the user with multiple options by which to sort the embeddings, such as by alphabetical order, by focus or target embeddings values, or by the focus text word order. It also includes a navigation option to move to the next result based on the similarity results derived by the selected measurement. The map includes two bar charts where the x-axis is mapped to the common words of both segments and the y-axis depicts the embedding results.
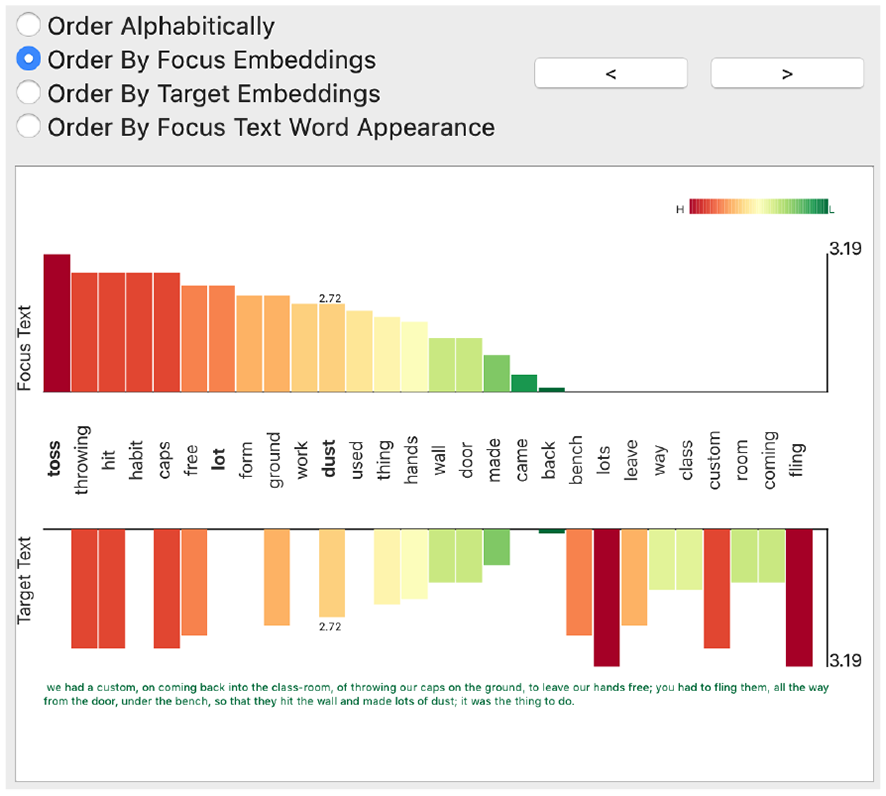
The embeddings map window that illustrates the embeddings values in both the focus and target texts. It integrates user options where the user sets the sorting of the embeddings values and navigates to other target segments. The two bar charts represent the embeddings in the focus and target text.
Here, we demonstrate the usefulness of the VNLP in investigating the embeddings and understanding the process undertaken. When the user selects the segment starting with “We could see him working…,” the framework correctly shows the aligned segment from the target text. When the user examines the embeddings map as shown in Figure 15(a), the user clearly observes that the words “work” and “working,” and the words “look” and “looking” are not combined. The user can also observe that the word “dictionary” appears twice due to the period in one of the occurrences. The similarity measurement, Cosine in this case, assigns a value of 0.20 to the result. The user chooses the stemming from the visible normalization options and changes the tokenization delimiters to consider other punctuation. The embeddings map interactively updates based on the user choices, as shown in Figure 15(b). The user observes in the updated embeddings map that there is one word (stem) that combines both “work” and “working,” and “look” and “looking.” As well as this, the map only contains one stem for the word of “dictionary” (“dictionari”) after handling the punctuation issue. The updated similarity result value is considerably higher due to the changes (0.51). It shows that the word “working” is highly distinctive, but not when it is returned to its base form. This helps the user understand the basic notion of weighted terms and the TF-IDF principles. This visibly demonstrates to the user that the features quantity decreases from the map in Figure 15(a) which facilitates understanding the idea of features and dimensionality reduction. It also shows that the user can observe the inner features (words) and enhance the embeddings by editing the VNLP GUI options. Users are informed on the different stages of the VNLP and how they collectively influence the end result.
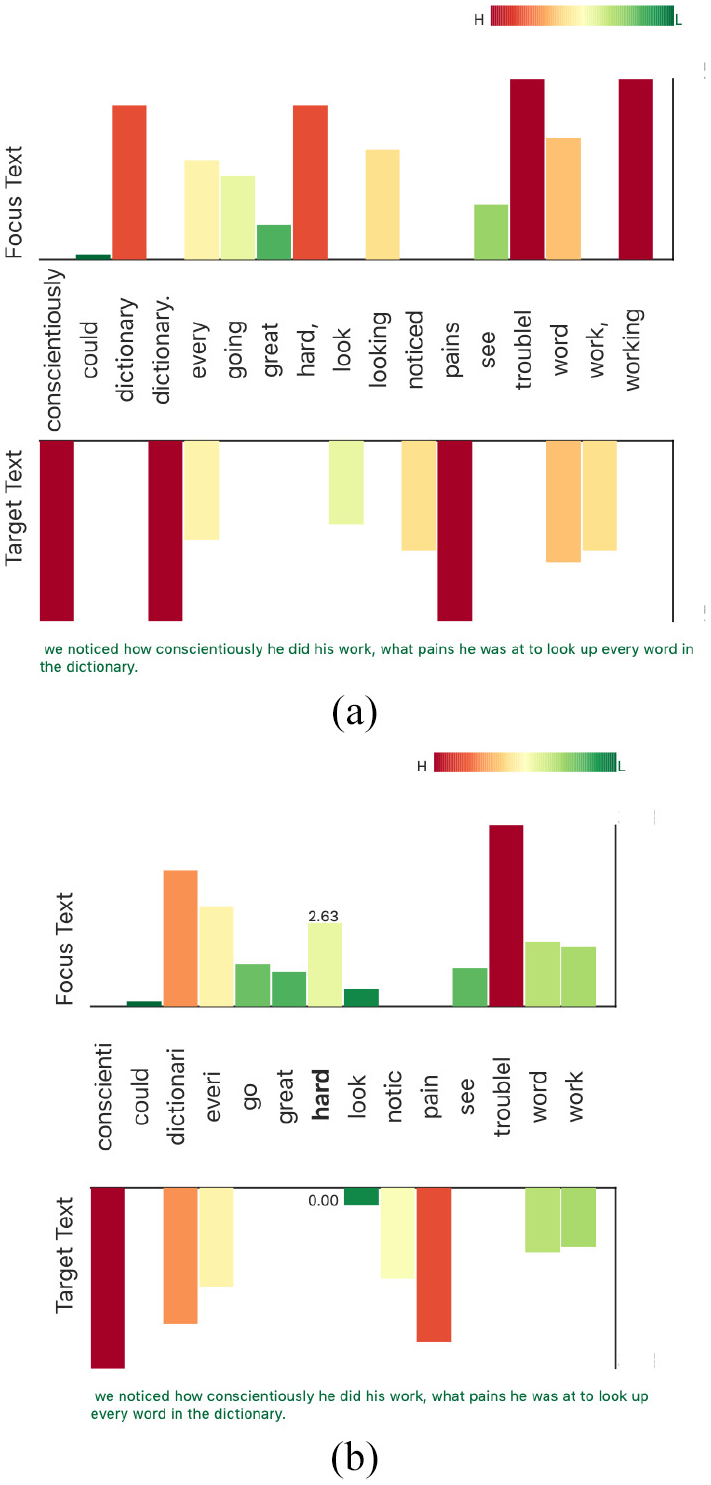
Two examples of the embeddings map which demonstrates the effect of the user interaction in the VNLP GUI. The map in (a) shows the default settings for both the tokenization and normalization. The map in (b) shows the reduction of features after applying more delimiters to the tokenization and stemming.
Domain expert feedback
To evaluate our framework, we sought feedback from a Modern Languages and Translation expert with experience of collaborating on computational text analysis projects involving NLP. This project benefits from more than 3 years of collaboration with the same domain expert. Approximately 16 h of meetings and brainstorming sessions contributed to the implementation of this design. For the evaluation of VNLP, three feedback sessions over a 2-month period were conducted and video-recorded for post-analysis and archiving. Our semi-structured interview questions were guided by Hogan et al. 92
Collaboration overview and domain expertise: This work is carried out in close collaboration with the College of Arts and Humanities in Swansea University under a collaborative project scheme founded in 2011 called “Translation Arrays: Version Variation Visualisation (VVV).” 93 The project is responsible for collecting, aligning, and warehousing the dataset under examination along with other “multi-retranslation” datasets. The team has developed prototype online tools 94 for managing such datasets and developing visualization to explore and analyze them. Professor Tom Cheesman is the principal investigator of the VVV project. He is a specialist in modern and contemporary German literature and culture. He has been researching German culture and translating German literature since the early 1980s. Professor Cheesman has been investigating the history of German translations of Shakespeare’s Othello since 2009, using traditional qualitative methods (contextualized close reading) and experimental, quantitative, digital methods. Relevant online outputs, presentations, and published articles by him and his collaborators are listed on the project’s website. 94 The articles include publications in Digital Scholarship in the Humanities 95 and Journal of Data Mining and Digital Humanities. 96
When we first demonstrated the framework to the expert, he appreciated the idea of making the NLP pipeline visible, stating: “This is very interesting and has a lot of potential for introducing NLP to students. I’m pretty sure it’s a unique idea.” When we presented the segmentation and tokenization options, he liked the visible options and the glyphs of the separators: “That is really valuable. It is underestimated, but handling punctuation in text preparation and normalization is very difficult. There are lots of different approaches to use and the decisions you make have massive impacts on subsequent analyses. This is great! I think I could have a lot of fun playing with this.”
In the case of the visible stopwords and their correspondence with the visible normalization, the expert stated: “I like that. It’s a perfect demonstration of the value of making the process visible, and giving me visible feedback if I make different choices. We normally present stopwords as one long list. Showing them in the text segments like this makes more immediate sense to users. It helps make the concept clear, and the implications of defining stopwords in different ways. The result is kind of poetic, too. I think a lot of people who are interested in literature will respond to this very well. It’s like a kind of concrete poetry.” Furthermore, he suggested interacting with both windows in order to add or remove stopwords to make it easier for the user to experiment with the effects of altered lists, and so this feature was implemented.
The visible embedding window was challenging for the expert and this feature evolved most in response to his successive feedback sessions. At the early stages, the framework did not provide information about the different values used to calculate the embeddings and the different calculations. At one point, whilst investigating a case, the expert interrupted: “Hang on! I’m trying to figure out how these values are derived.” Making these values and calculations clear and transparent answered his questions and increased his trust in the framework. He stated: “This is really informative and takes you through the steps, telling you what you need to know.”
The final discussion with the expert focused on evaluating how useful this framework can be in teaching basic NLP principles. As a closing remark, the expert stated: “I think it could be a really useful framework precisely in educational contexts, introducing NLP principles and processes to the kind of students we have in languages and translation or linguistics, who usually have limited computational skills and are nervous about NLP interfaces which assume a huge amount of knowledge. This lets them learn a lot by playing around with options which produce different results.”
Future work
This research opens up many varied directions of future work. We believe it opens up a new theme of research that is analogous to explainable machine learning.
This research serves as a starting point for a wider subject. We aim to extend it to include more NLP functions and advanced techniques such as part-of-speech tags (POS).
While this project is limited to one case study, adding different applications such as, visible sentiment analysis or visible text classification to increase the usability of the framework is valuable.
Contextual word embeddings, such as BERT, can also open up different applications such as visible word relations and translation variations.
Supporting the comparison of two or more parameterizations side-by-side is a possible future direction.
With respect to the evaluation, due to the scope limitation, we evaluated our approach using a text similarity application and domain expert feedback. However, an in-depth user study to evaluate the generalizability and usability of the approach is valuable and would make a paper in itself, for example, Firat et al. 97 Also, evaluations in other contexts such as legal and health documentation are encouraged.
More glyph optimization, variations, and novel designs for the embeddings map and VNLP stages are also future work directions for this research.
Conclusion
In this paper, we present VNLP, a framework that enables users to observe and participate in the NLP pipeline processes, explicitly interact with the parameters of each step, and observe the effects on the visible VNLP result. The aim of this research is to implement an educational and transparent process of the NLP pipeline. We support this with an application of text similarity to demonstrate the usefulness of the VNLP. This work is a result of a close collaboration with an expert in modern languages and translation studies and evaluated through domain expert feedback.
Supplemental Material
sj-pdf-1-ivi-10.1177_14738716211038898 – Supplemental material for VNLP: Visible natural language processing
Supplemental material, sj-pdf-1-ivi-10.1177_14738716211038898 for VNLP: Visible natural language processing by Mohammad Alharbi, Matthew Roach, Tom Cheesman and Robert S Laramee in Information Visualization
Footnotes
References
Supplementary Material
Please find the following supplemental material available below.
For Open Access articles published under a Creative Commons License, all supplemental material carries the same license as the article it is associated with.
For non-Open Access articles published, all supplemental material carries a non-exclusive license, and permission requests for re-use of supplemental material or any part of supplemental material shall be sent directly to the copyright owner as specified in the copyright notice associated with the article.