
Abstract
Research in machine learning has become very popular in recent years, with many types of models proposed to comprehend and predict patterns and trends in data originating from different domains. As these models get more and more complex, it also becomes harder for users to assess and trust their results, since their internal operations are mostly hidden in black boxes. The interpretation of machine learning models is currently a hot topic in the information visualization community, with results showing that insights from machine learning models can lead to better predictions and improve the trustworthiness of the results. Due to this, multiple (and extensive) survey articles have been published recently trying to summarize the high number of original research papers published on the topic. But there is not always a clear definition of what these surveys cover, what is the overlap between them, which types of machine learning models they deal with, or what exactly is the scenario that the readers will find in each of them. In this article, we present a meta-analysis (i.e. a “survey of surveys”) of manually collected survey papers that refer to the visual interpretation of machine learning models, including the papers discussed in the selected surveys. The aim of our article is to serve both as a detailed summary and as a guide through this survey ecosystem by acquiring, cataloging, and presenting fundamental knowledge of the state of the art and research opportunities in the area. Our results confirm the increasing trend of interpreting machine learning with visualizations in the past years, and that visualization can assist in, for example, online training processes of deep learning models and enhancing trust into machine learning. However, the question of exactly how this assistance should take place is still considered as an open challenge of the visualization community.
Keywords
Introduction
Machine learning (ML) techniques and tools have become ubiquitous in the process of analyzing data for diverse purposes. The underlying ML models are used, for instance, to predict future events based on the data at hand.1,2 However, ML models are not always trusted by analysts, even if they offer high-quality results in comparison with other analytical methods. 3 In many cases, they are considered as black boxes, that is, the internal functionality of the underlying algorithms is not entirely understandable for analysts,4–6 and even ML experts struggle to tune and parameterize those models. 7 The sheer complexity of the algorithms that were invented is a critical factor that makes the data analysis process challenging.8–10
Nowadays, it is widely accepted that information visualization (InfoVis) can aid in this process and offer guidance toward more (and better) interpretable ML models. 11 Explorable and transparent ML models enable users to understand, trust, and manage these models. InfoVis plays a crucial role in analyzing such models and, as a result, provides guidance to users, interaction techniques to control them, and information about their inner workings that are often hidden away. 12
Within the past 5 years, the number of publications that focus on the interpretation of ML models using InfoVis techniques has significantly increased, which makes it difficult for novice researchers or analysts to get in the field quickly. In order to acquire the necessary knowledge, they have to spend many hours searching and reading related papers and articles. An obvious solution is to look for more comprehensive survey articles that provide an overview of a specific aspect of ML models and how to interpret them; but even here, they will find a fairly high number of survey papers. In this case, in particular, they might also often not be able to find the needed information due to either too-specific focus or a mixture of various topics in such survey papers.
This challenge caught our attention during the search for relevant work to base our research on improving the interpretability and explainability of ML models with the use of InfoVis. Throughout that stage, we gathered and analyzed several surveys that summarize the related work in the topic with the goal of getting an overview of the field. But due to the number of surveys, the different perspectives shown in each, and the lack of common ground between them, we found that task to be much less straightforward than we expected.
In order to contribute to this challenge, we present this meta-survey—or “survey of surveys” (SoS)—which summarizes and describes survey publications that focus mainly on the exploration and interpretability of ML models, that is, opening the black box of the various types of ML algorithms and visualizing them. At this point, it is important to clarify our use of the terms interpretable and explainable ML, following the definitions of Gilpin et al. 13 It is common for interpretability and explainability to be used interchangeably, but Gilpin et al. argue that there are solid reasons to differentiate between them: the main purpose of interpretability is to describe the internals of an ML model in an understandable way for humans. In addition to that, explainable ML should explain the models that are already understandable, in order to obtain the trust of users or to generate new insights about the reasons for their decisions, subsequently answering the question of why a specific decision has been made by the model. Here, any explanation is also assessed according to its completeness, that is, the ability to describe the model operations precisely, also in other, more general situations. Both properties, interpretability and completeness, often contradict each other, because the most accurate explanation may not be very interpretable. Consequently, “explainable models are interpretable by default, but the reverse is not always true.” 13 Thus, we carefully select and use these terms throughout our paper according to these guidelines; for more details, we refer the reader to the paper by Gilpin et al. 13
Our meta-analysis proposed in this article has two main target groups:
Early-stage researchers ( ) who struggle to collect information from surveys and papers that refer to the interpretability and explainability of ML algorithms. We intend to support early-stage researchers by providing information that may guide them to the correct surveys according to their goals, help them not to lose time when reading extensive surveys that are not useful for their current research focus, or simply better organize and plan their reading schedule.
Senior researchers ( ) in InfoVis and/or visual analytics (VA), who are interested in the interpretability and explainability of ML models, may want to learn more details on how the existing surveys were conducted or how they differentiate from each other. They may also benefit from research gaps derived from those surveys and areas not yet covered.
Although we provide a detailed and descriptive summary of the current ecosystem of surveys in our focus area, there are also inherent limitations of this work that must be considered. The available number of surveys is relatively small (especially when compared to McNabb and Laramee’s SoS paper), 14 and they were published in only 5 years. This is not due to methodological issues, but an inherent characteristic of the research area itself, which is still quite young. The surge of research papers in the past decade has been reflected in a similar wave of recent surveys in the past few years, which motivated our work. Thus, while this is an early work and our scope is arguably restricted, that characteristic has been taken into account in our methodology. Our goal was not to derive a deep theoretical framework from the available data; we would not be able to do that with such a small sample in a relatively restricted time period. Instead, we focus on describing the current surveys at a high level, where they differ, and how they treat the current research to help with guiding researchers into more meaningful and efficient future work. As the research area matures and more papers and surveys are available, more interesting and meaningful patterns and trends will surely arise in the future from larger samples of primary research. Concretely, our contribution comprises the following points:
The aggregation and description of research opportunities (i.e. open challenges) described in survey papers concerning interpretable and explainable ML to assist the mentioned main target groups.
The identification of research subtopics and trends under the umbrella of interpretable ML.
The analysis of various temporal and topical aspects related to the survey papers themselves and the publications they discuss.
To support a smooth and progressive immersion of our readers into interpretable ML with the help of visualization, we propose two alternative flows: (a) bottom-up, starting from the summaries of each survey paper, or (b) top-down, starting from our collection of high-level information on the whole field of visualizing ML models. Figure 1 displays both flows and how early-stage researchers and senior researchers might follow specific paths in order to read this paper.
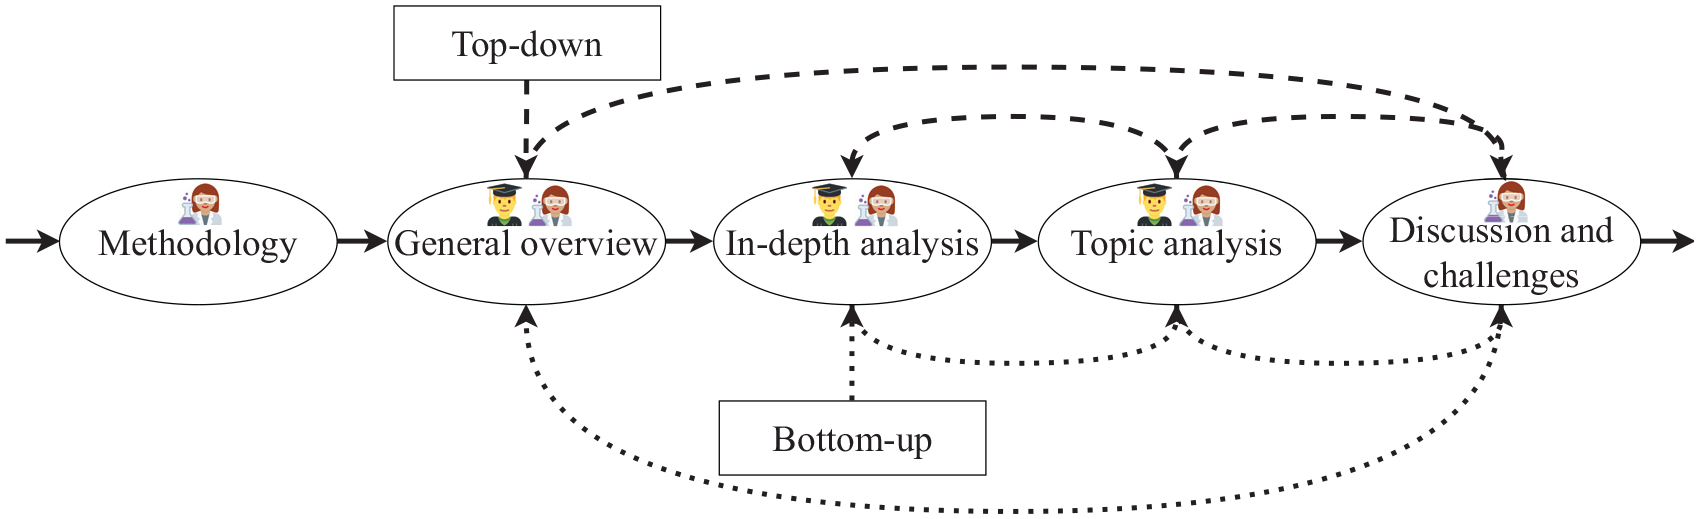
Flowchart to guide readers on possible paths to read and interpret our SoS. The usual path is depicted with solid arrows connecting each section linearly. The dotted arrows show the two alternative paths that correspond to the bottom-up and top-down flows. Following the standard path, early-stage researchers are probably most interested in getting an overview first, then moving on to the details and specific models, and finally finding relationships between survey papers, topics, and individual papers. However, senior researchers might be curious to learn how to write SoS or validate our results by reading the “Methodology” section. Finally, from the “Discussion and challenges” section, they might extract some knowledge from the lessons learned and explore the research opportunities we identified. However, in contrast to the suggested early-stage researchers’ path, the order which senior researchers might follow is more varied, depending on individual preferences and interests.
The structure of our SoS is given as follows: in the next section, we describe the differences between our work and other SoS papers focusing on InfoVis and VA. The subsequent section contains the methodology that we followed in order to gather the survey papers. After this, a first general overview of our research subject is described from aggregated data that we collected. The subsequent section is about a more detailed analysis of the single categories in which we classified the collected survey papers. Next, we present the results of a topic modeling approach applied to all individual papers discussed in the individual surveys. In the penultimate section, we discuss observations and our interpretations from the results presented in the previous sections, and we present open challenges/research opportunities in the field. Finally, the last section concludes this article.
Related work
Due to the potentially large number of survey articles that aim to overview research on a specific topic, it is common in various scientific areas and communities to have SoS papers or meta-surveys that, in turn, classify those survey articles. Some examples are the SoS by Saini et al. 15 on vehicular ad hoc networks or the work by Giraldo et al. 16 on security/privacy approaches for cyber-physical systems. Visualization journals and conferences have introduced specific tracks that try to tackle the potentially large number of survey papers. For instance, ACM Computing Surveys publish comprehensive, readable tutorials and survey papers that give guided tours through the literature and explain topics to those who seek to learn the basics of areas outside of their specialties. Also, conferences such as EuroVis have a special track for state-of-the-art (STAR) reports, which is vital as the community grows.
To the best of our knowledge, there are only three SoS papers for the InfoVis and VA domains, written by Alharbi and Laramee, 17 Alharbi et al., 18 and McNabb and Laramee. 14 Alharbi and Laramee 17 discussed 13 survey papers on text visualization and categorized them into five different groups. In Alharbi et al., 18 the authors gathered 11 survey papers regarding visualizations of computational biology and described solved issues and open challenges. The authors of the latter 14 gathered more than 80 survey papers and extensively analyzed half of those. Although there is a small overlap with this work in terms of surveys included (3 out of 18), the goals of the two SoS papers are different: while McNabb and Laramee 14 concentrate on different topics of InfoVis and provide potential future directions for the community as a whole, we focus specifically on the exploration and interpretability of ML models using InfoVis.
Methodology
Our work covers the subject of interpretable ML models and exploration of ML models using visualization in the many stages of the process of analyzing data with ML, for example, (a) labeling and pre-processing the data, (b) letting the user handle the data with queries, (c) making the algorithm transparent during its execution, (d) interacting with the ML algorithm to steer it, and (e) comparing different algorithms and evaluating the results.
Following the guidelines from McNabb and Laramee, 14 and after an initial pilot phase where we manually searched for survey papers from the last 10 years, we converged on using combinations of relevant keywords such as “black box,” “ML,” “interactive,” “models,” “deep learning,” “neural networks,” and other derivatives with similar meanings. The majority of the included surveys were found by also including words such as “survey,” “overview,” “taxonomy,” or “state of the art,” but some of them were harder to find, so we had to include more keywords such as “literature review,” “review,” “categorization,” or “classification.” We primarily focused on important venues and proceedings that regularly publish InfoVis papers, including IEEE Transactions on Visualization and Computer Graphics (TVCG), Computer Graphics Forum (CGF), IEEE Computer Graphics and Applications (CG&A), Information Visualization Journal (IVJ), Computers & Graphics (C&G), Visual Informatics (VisInf), IEEE Visual Analytics in Science and Technology (VAST), IEEE InfoVis, Eurographics Visualization (EuroVis), IEEE Pacific Visualization (PacificVis), ACM Conference on Human Factors in Computing Systems (CHI), and ACM Intelligent User Interfaces (IUI). For both support and validation, we also looked through the SoS discussed in the previous section 14 and searched for relevant survey papers among their references.
This selection process was repeatedly executed (and its results updated) for 8 months, during which we monitored and scanned the InfoVis publications in order to identify as many surveys as possible. For the sake of completeness, the Related Surveys sections and references from the identified surveys were also used as sources of new surveys (a process known as snowballing). 19 In more detail, this selection phase was performed in three steps: (a) we started by reading the titles of every reference to detect potential closely related survey papers; (b) then, we checked the abstract of each survey selected in Step 1 and decided if at least a part of it refers to interpretable and/or explainable ML models; (c) finally, we checked the Related Surveys section of each survey paper selected in Step 2 and tried to find even more candidate surveys. Some of the Related Surveys sections 20 were very informative and helped us to considerably increase the number of results that we gathered (see Figure 2).
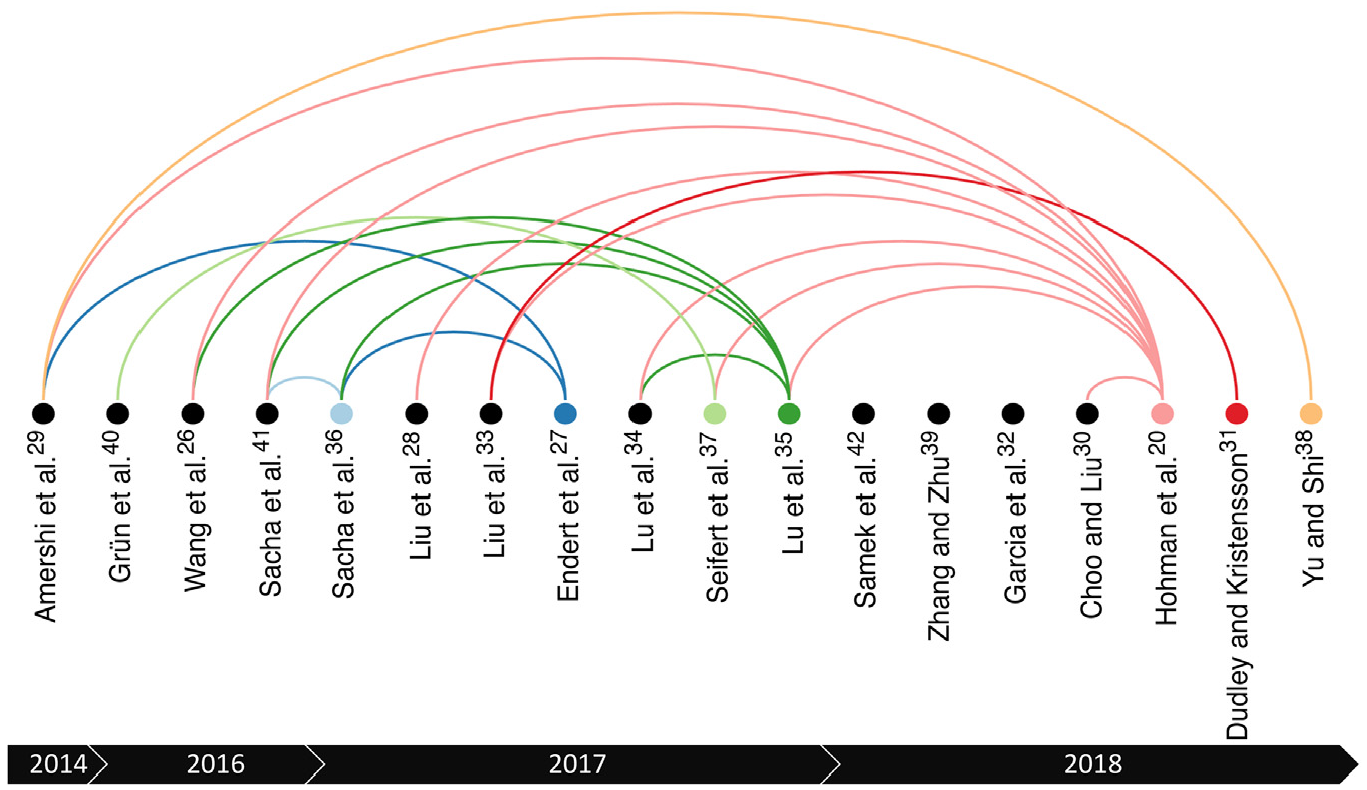
Citations between our selected survey papers, from 2014 to 2018. The color of the nodes and links illustrate the sources of citations, that is, papers that cite at least one previous survey. Note that this color-encoding is different from the one used in Table 3.
Throughout this search procedure, we identified some related (and potentially interesting) survey papers, which were not included in our analysis for a variety of reasons. On one hand, Minar and Naher, 21 for example, is accessible but not published in a peer-reviewed venue. Abdul et al., 22 on the other hand, was not considered relevant since the authors provide a very general overview of the full landscape of existing papers on explanations and interpretable systems to highlight research opportunities and open challenges for the human–computer interaction (HCI) community. Two more papers that we excluded are Adadi et al. 23 and Guidotti et al., 24 which focus on describing mostly non-visualization methods used in order to open the black boxes and explain models. Finally, Sacha et al. 25 gathered a series of papers that focus on VA for assisting ML in order to evaluate their ontology. Although the gathered papers are related to our work, the authors do not analyze these papers in detail, and they did not perform a reproducible search as in a typical literature review, survey, or taxonomy paper.
Some of the survey papers—such as Wang et al., 26 Endert et al., 27 and Liu et al. 28 —initially seemed too general, but after a more detailed investigation we agreed that they actually contain information and papers related to the interpretation of ML models with the use of visualization. Consequently, we included them in our SoS, but we did not use them in their entirety, only the related and important parts.
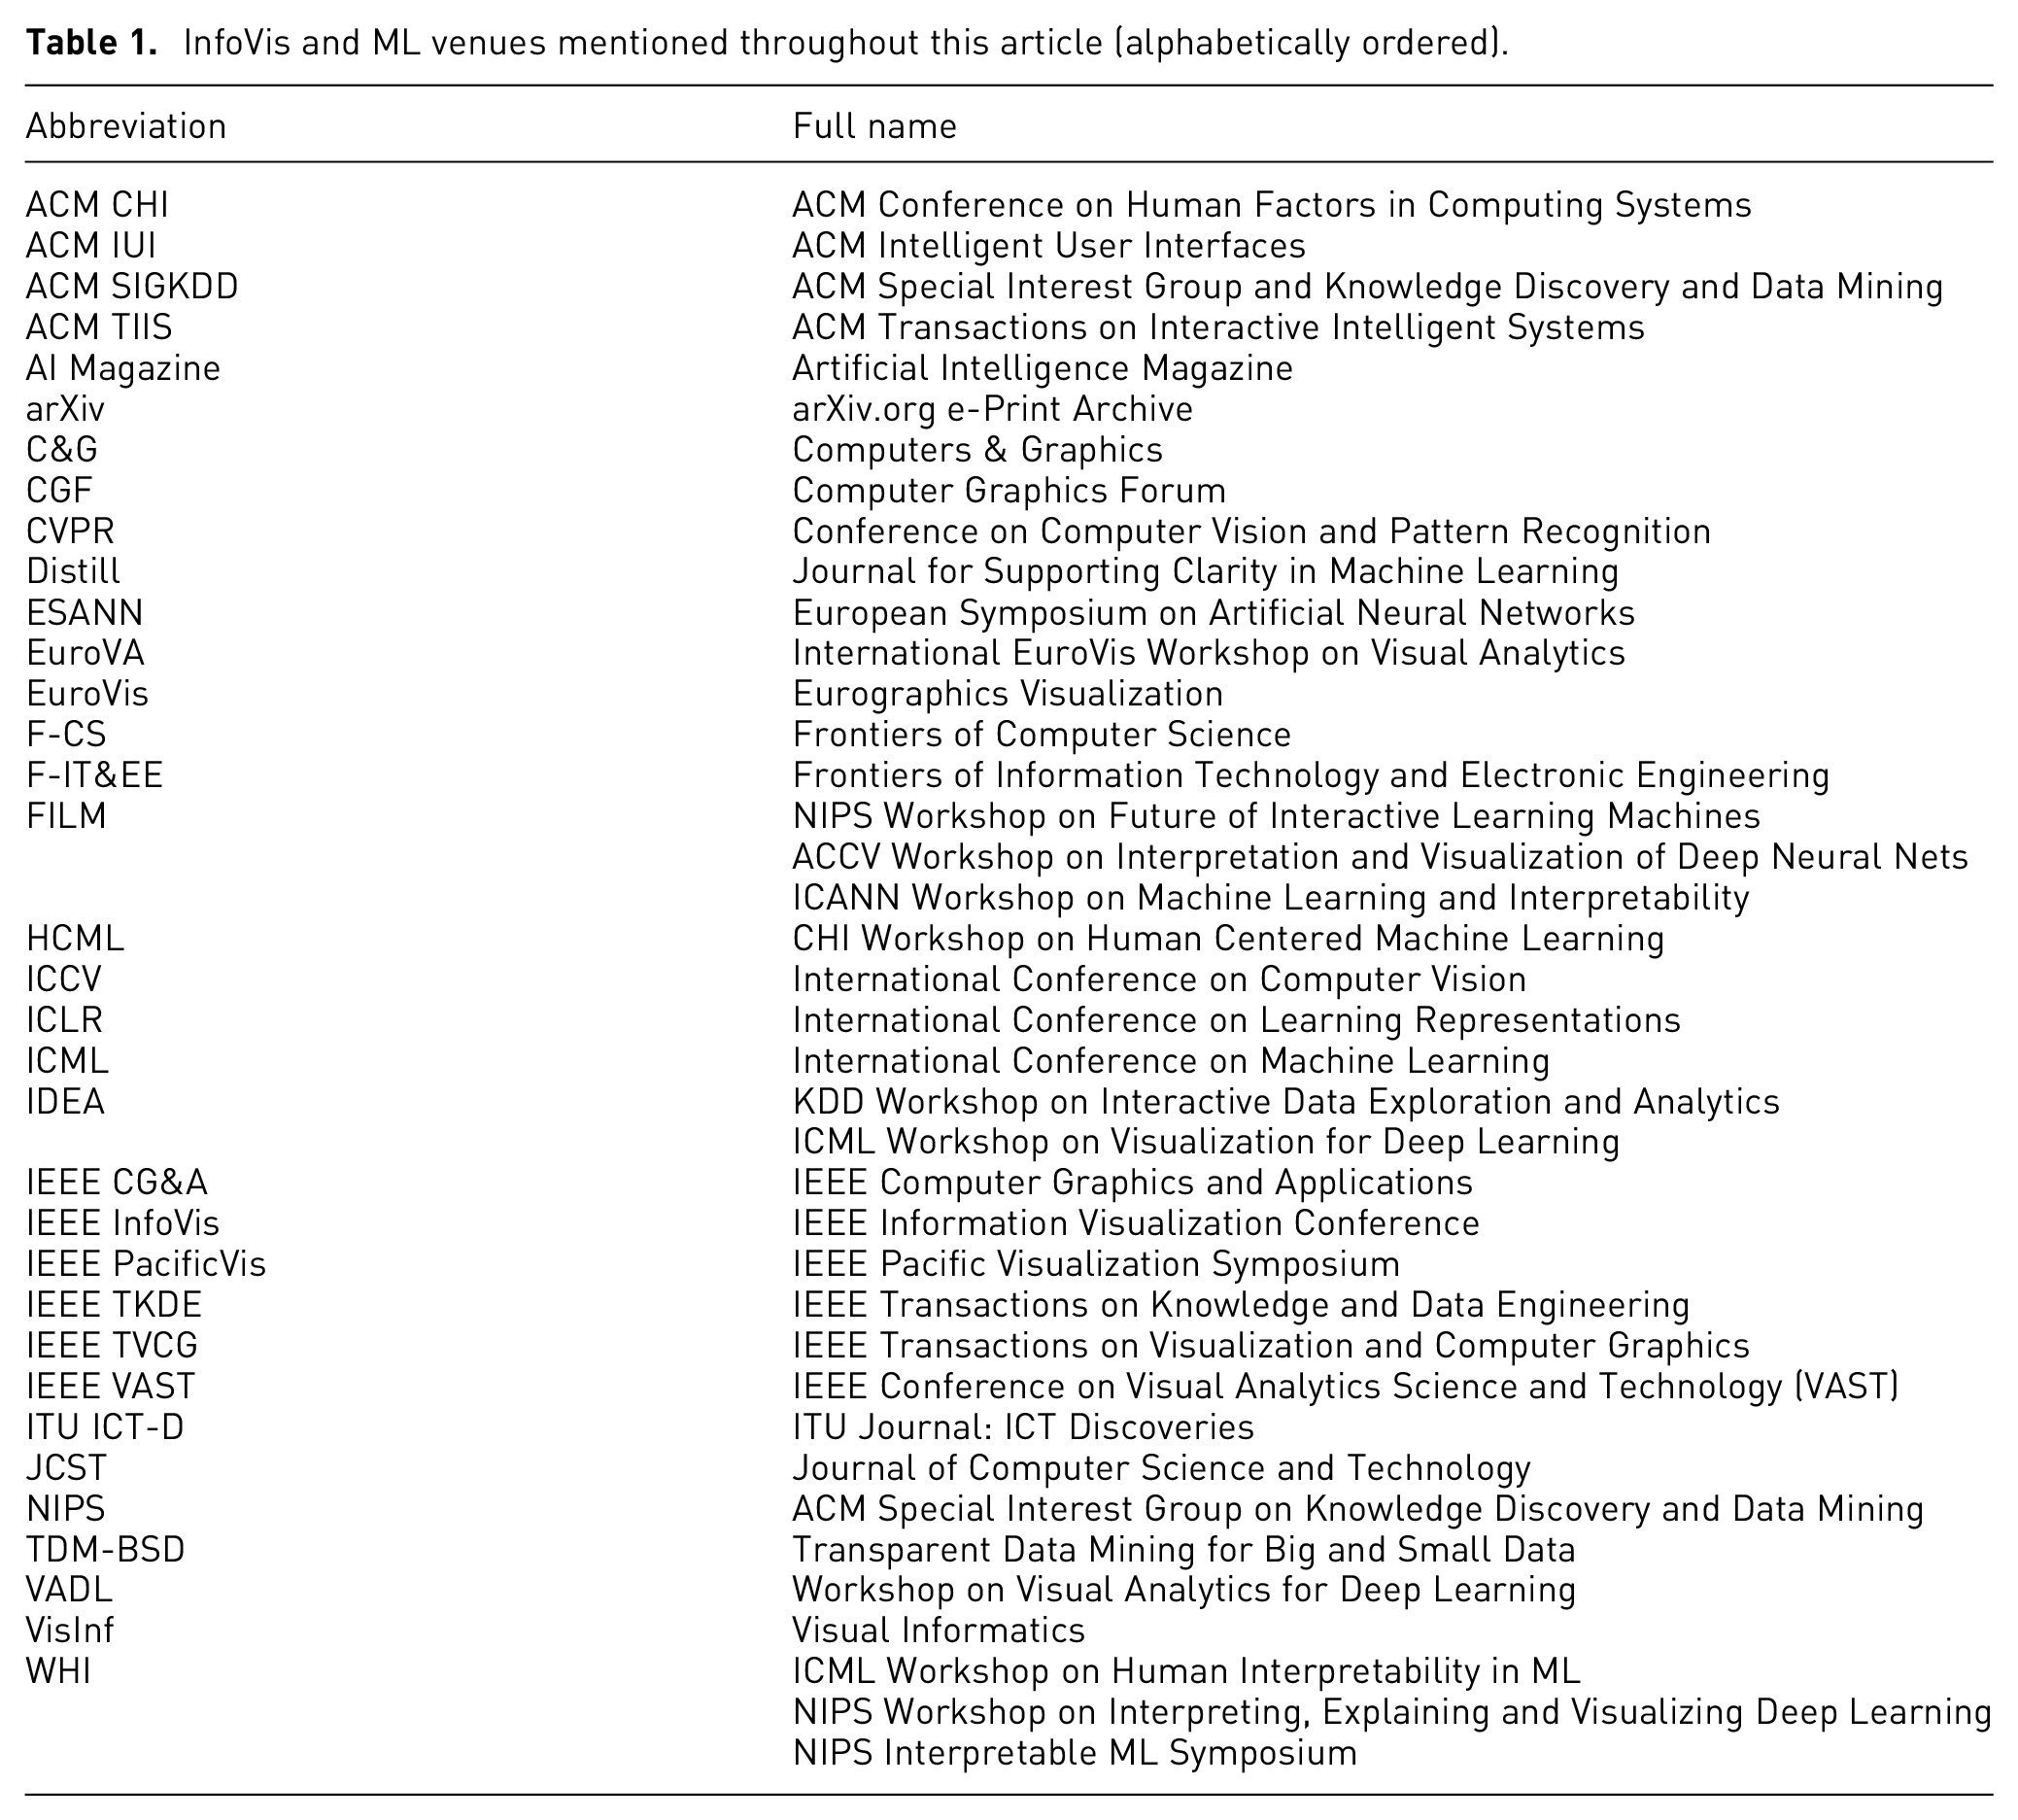
In Table 1, we list (in alphabetical order) the abbreviations and full names of the venues mentioned throughout our article, for reference. Some of the venues also aggregate other smaller subvenues, such as the entry IDEA, which includes two different workshops: KDD Workshop on Interactive Data Exploration and Analytics and ICML Workshop on Visualization for Deep Learning.
InfoVis and ML venues mentioned throughout this article (alphabetically ordered).
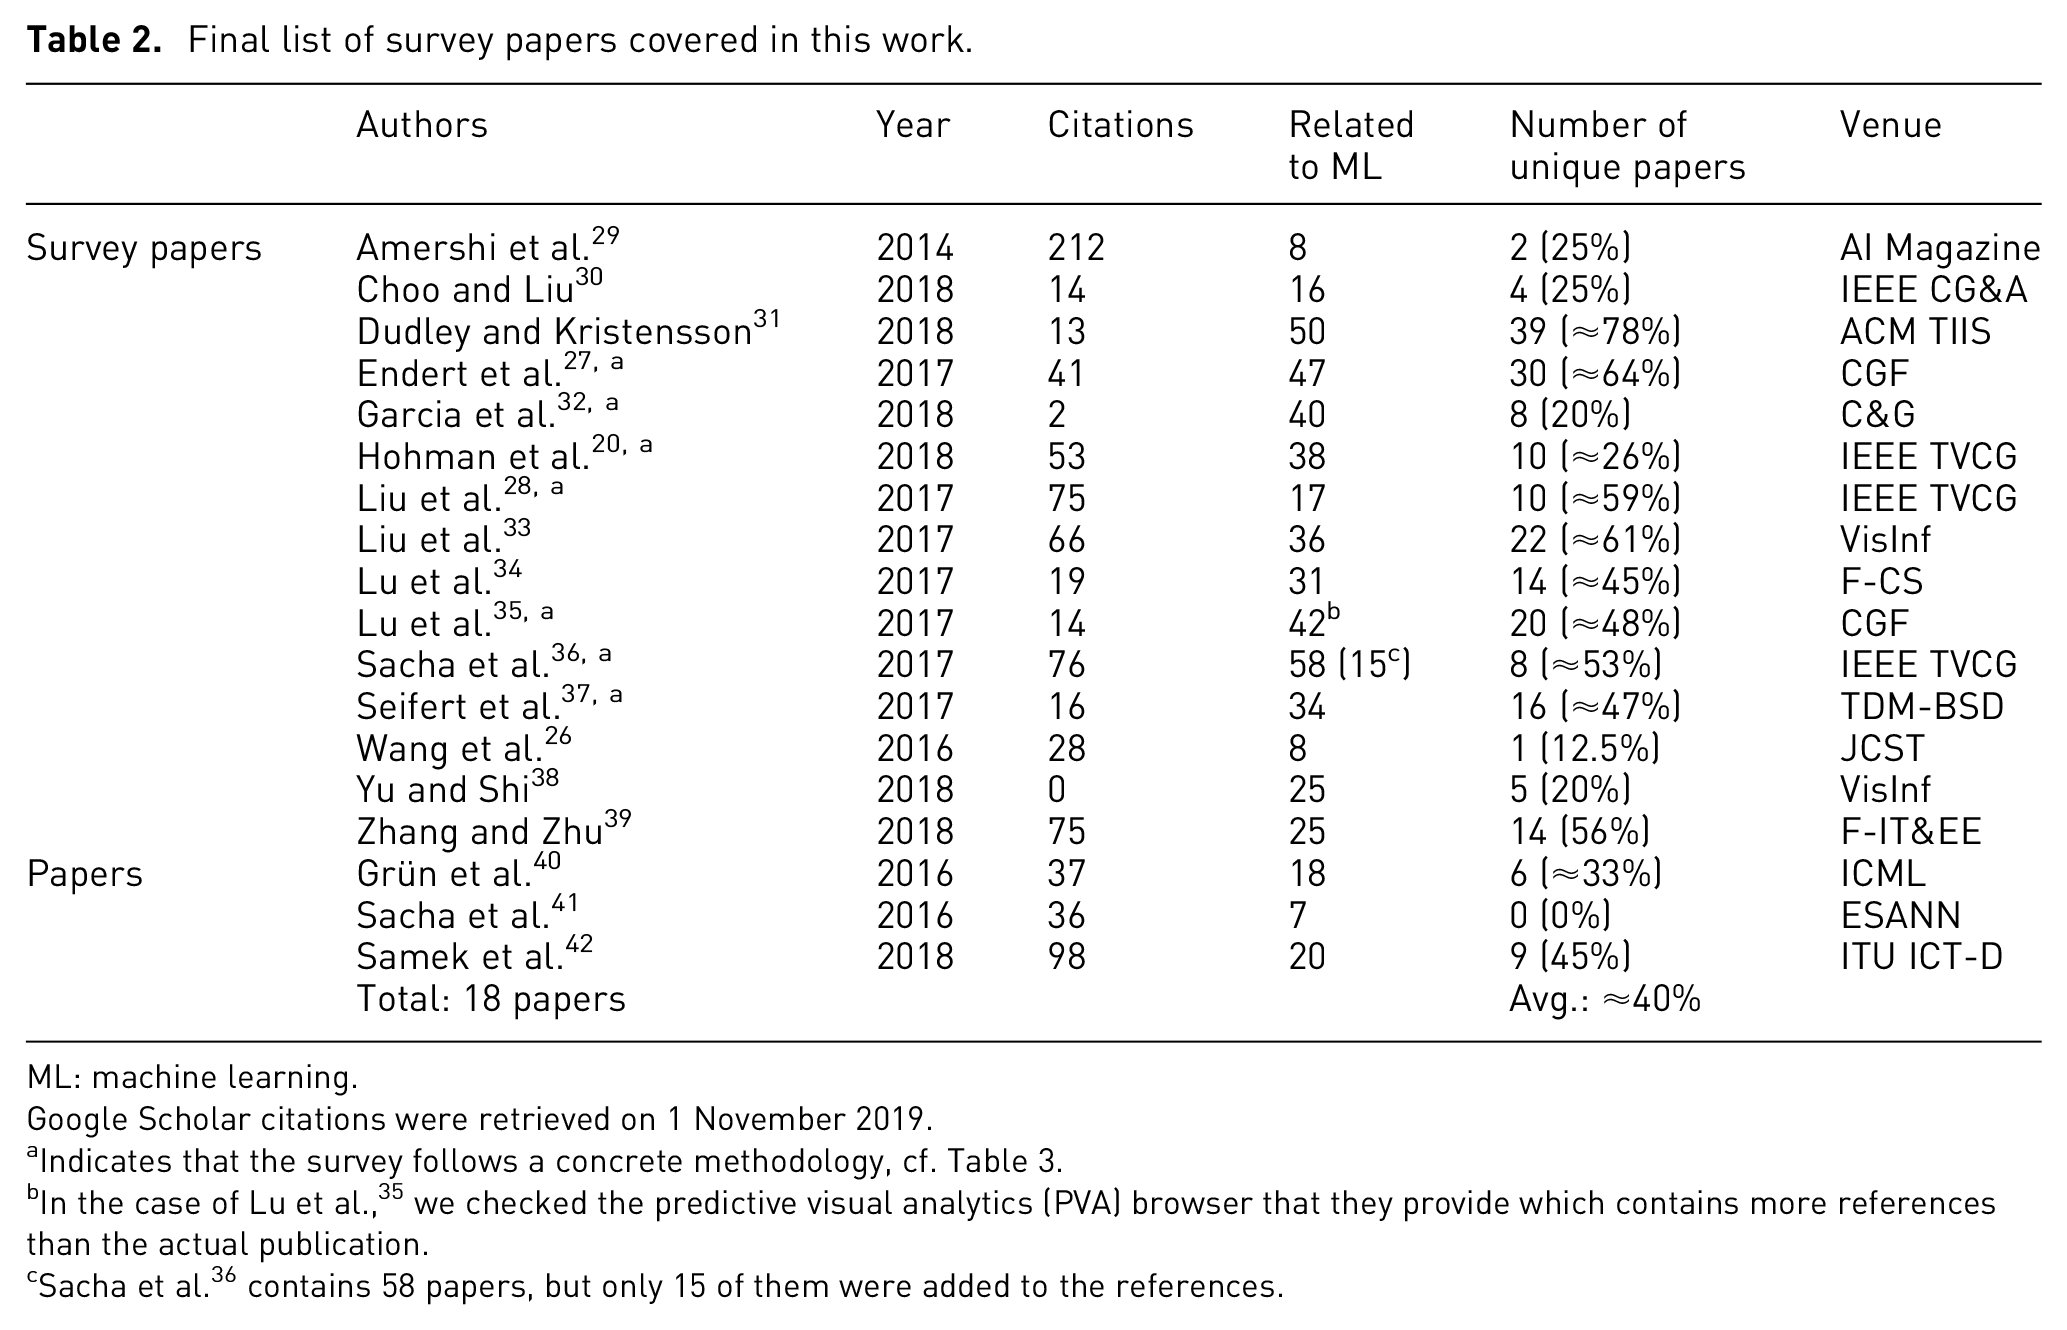
In Table 2, we present the final list of all the survey papers included in this meta-analysis, along with some associated details, such as the venues from which we retrieved them. We can observe that not all the venues were part of the initial search. We started with the primary, most important venues (as described previously), but survey papers from the secondary venues were also added due to the use of the aforementioned snowballing process. As a result, we almost exclusively got survey papers from 2016 to 2018.
Final list of survey papers covered in this work.
ML: machine learning.
Google Scholar citations were retrieved on 1 November 2019.
Indicates that the survey follows a concrete methodology, cf. Table 3.
In the case of Lu et al., 35 we checked the predictive visual analytics (PVA) browser that they provide which contains more references than the actual publication.
Sacha et al. 36 contains 58 papers, but only 15 of them were added to the references.
Although we believe that we managed to identify all important survey papers related to the subject, a threat to the validity of this methodology could be to miss surveys which contain only a small paragraph on our subject of interest. Such surveys may focus on another research topic and were probably not included.
General overview
We start our meta-analysis of the survey literature in interpretable ML models using visualization by presenting an overview of the final results of our search, according to the methodology described in the previous section. Table 2 lists all 18 papers we covered, divided into two categories: (a) survey papers, including papers with the usual survey format and published in well-known venues and (b) papers, which are research papers (not surveys) that contain briefer but also interesting literature reviews.
Although most of the results are in the period of 2016–2018, one paper from 2014 was found through our search process. Table 2 also shows information related to the relevance of included surveys, such as the number of citations (as extracted from Google Scholar at the time of writing) and the number of unique research papers found in each, that is, papers that do not appear in any other survey. On average, a published survey in the area includes approximately 40% of new, unique papers, which points to the advantages of regularly keeping up with new surveys instead of focusing only on a few. This information can be relevant both to experts, who might wish to ignore a survey if it already contains too many covered papers, and to newcomers, to whom it might be important to obtain different points of view for the same papers in order to broaden their perspective.
Figure 2 shows the citations between our selected papers. In general, they cite at most two of the previous surveys, except Hohman et al. 20 and Lu et al. 35 This suggests the importance of a meta-survey, such as ours with a comprehensive outlook on the area: in contrast to what one might assume, recent individual surveys do not necessarily mention or cover the previous work in a comprehensive way.
In Table 3, we summarize the methodology information of those seven surveys where the authors described their methodology explicitly, including the venues that they searched during the process of collection. As we can observe, only 7 out of the 18 survey papers follow a concrete methodology. This seems to be a weak point of the survey literature in the area, which needs improvement. On one hand, the most popular venues (i.e. with high impact factors) were usually covered by the authors, although with a variable degree of consistency (as can be seen from the relative sparsity of the matrix). On the other hand, some other venues which are known to contain papers on VA for interpreting ML models (e.g. ACM IUI) were not covered by any of the included survey papers. Another potential weak point is that most of the survey papers searched for only IEEE TVCG from the journals category. In addition, 3 out of the 7 survey papers made a general search on the web. Garcia et al. 32 and Liu et al. 28 found papers by checking the references of other publications, which makes it hard to assess the systematization of their process objectively. In addition, 3 out of these 7 survey papers searched for specific keywords, such as deep neural networks (DNNs), which also inspired our own methodology.
Search targets (publication venues, web repositories, keywords, etc.) used by the authors of the survey papers covered in this work.
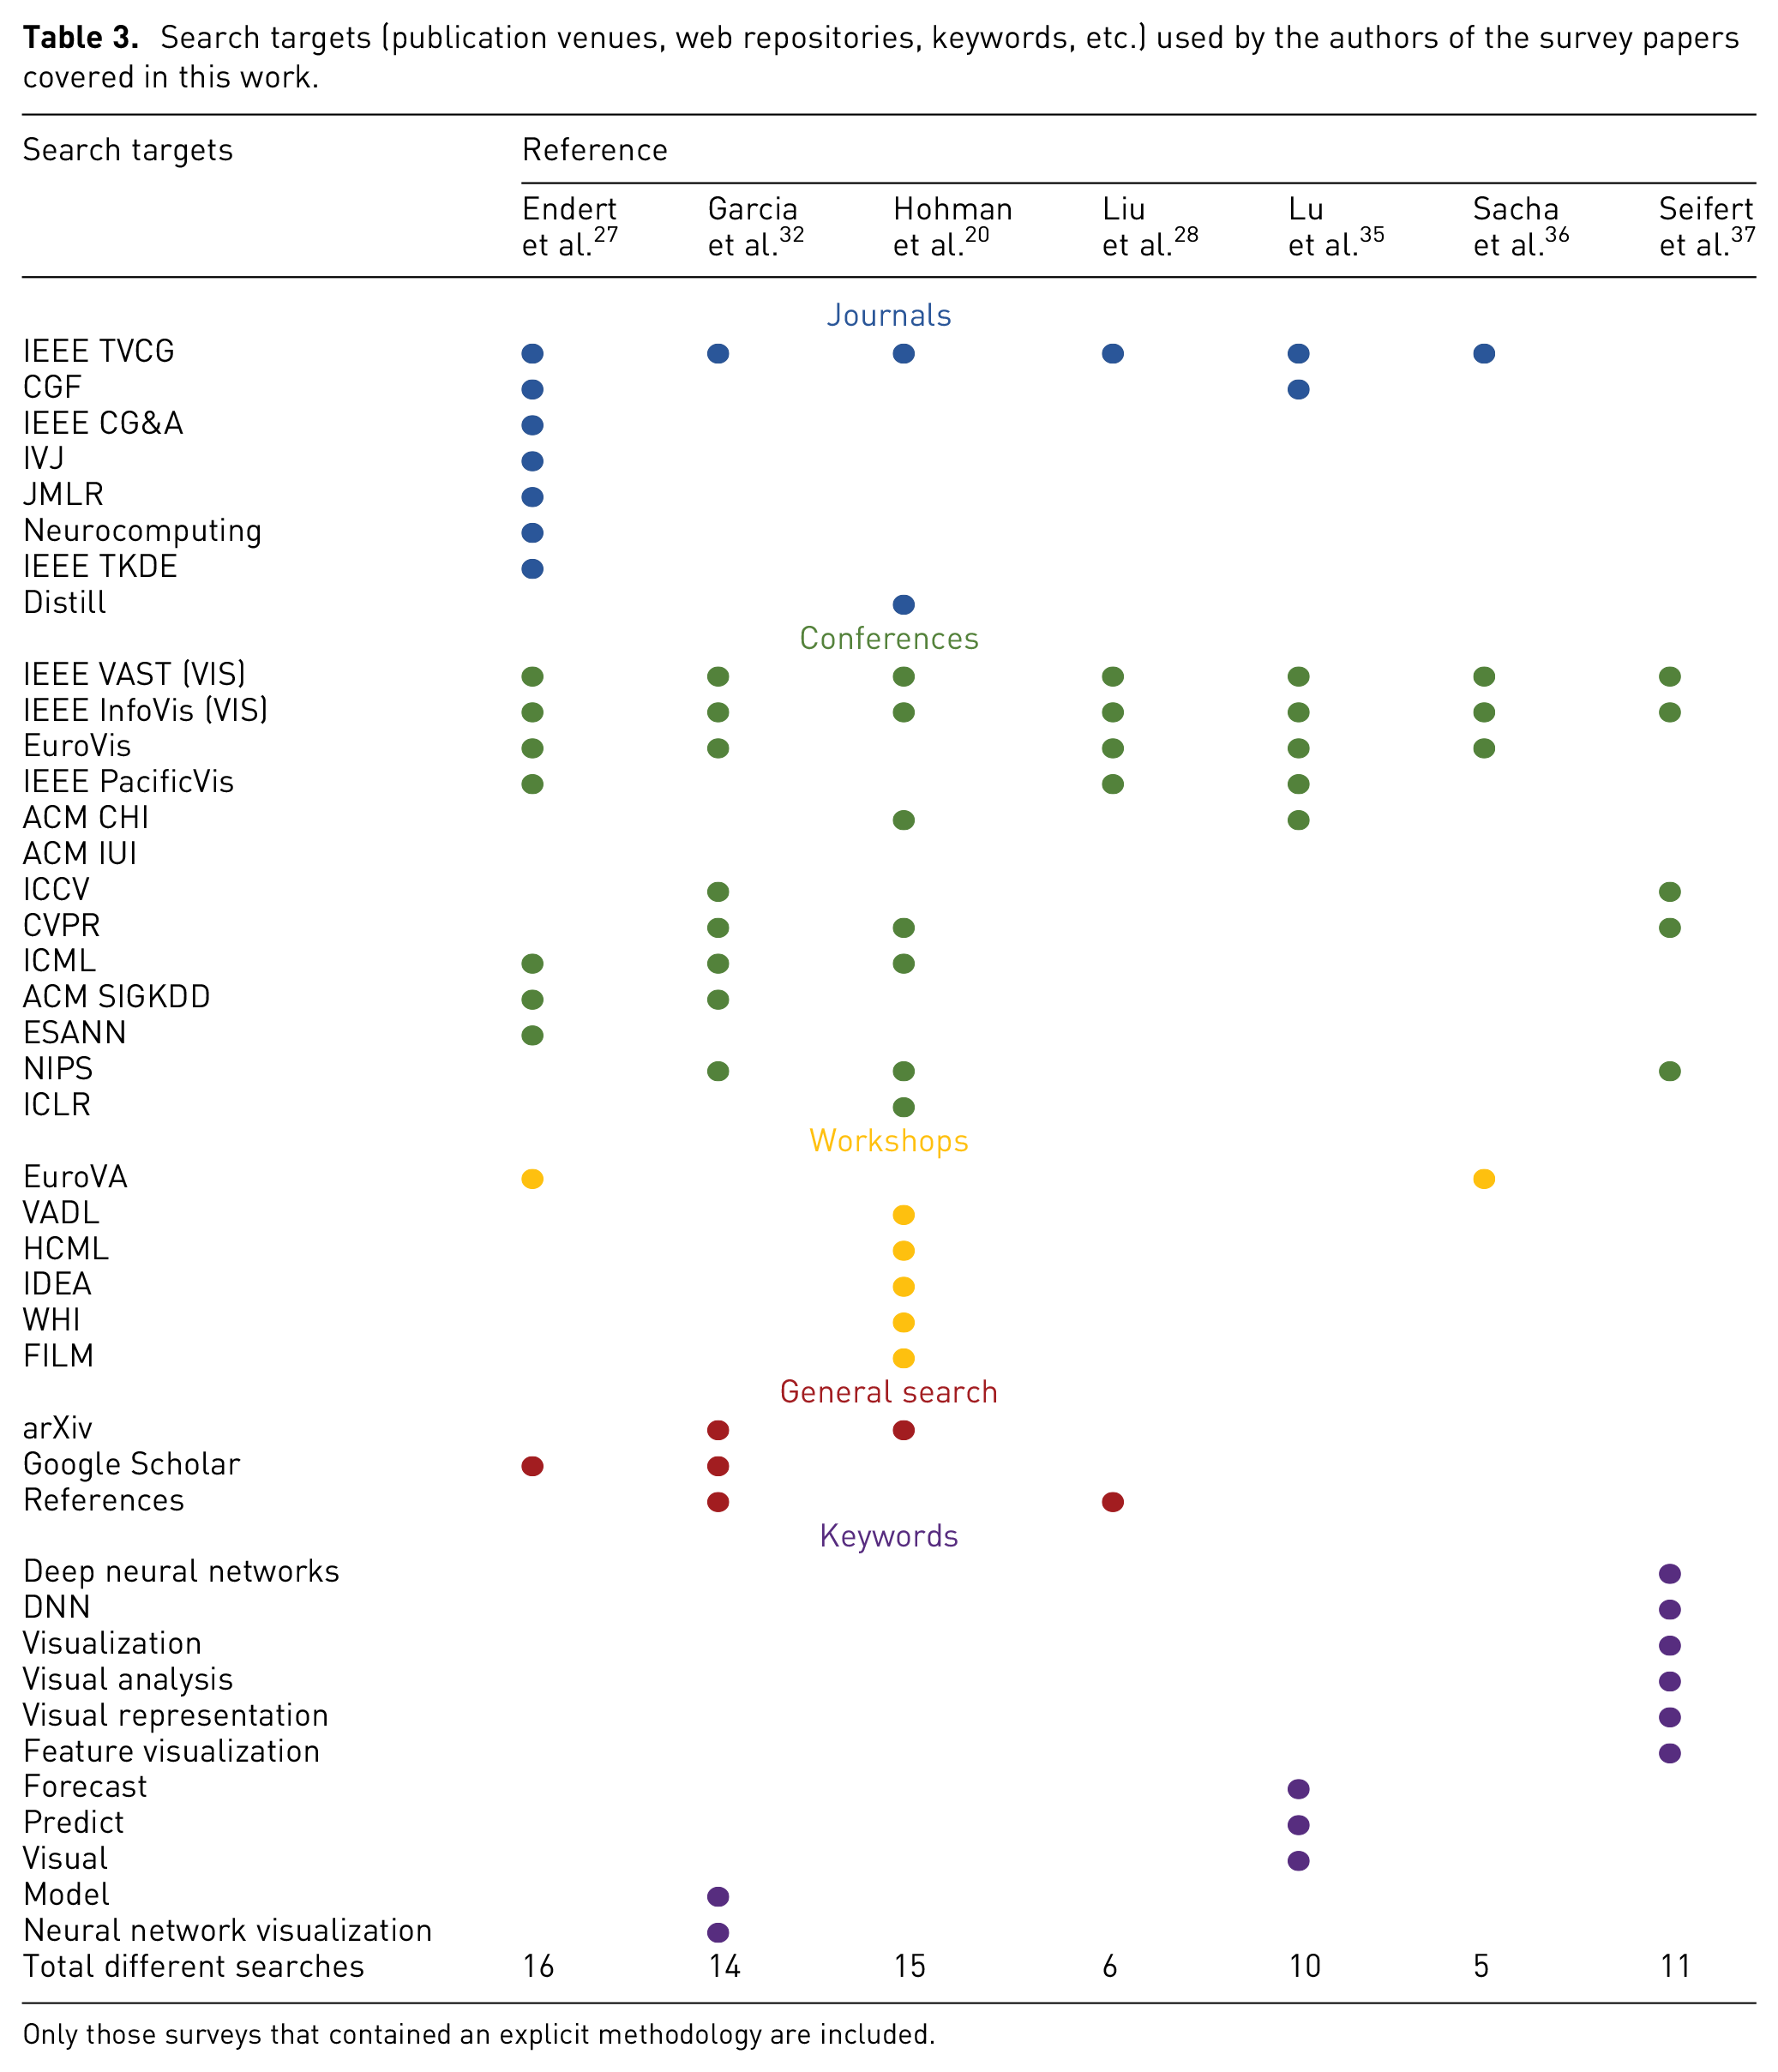
Only those surveys that contained an explicit methodology are included.
In Table 4, we present the yearly distribution of papers analyzed by the included surveys. Although the surveys seem to have covered long periods of time, it is hard to capture a clear picture since most of them do not give explicit information about the considered time frame. From our analysis, the survey authors include only a few (2 on average) papers from 1992 to 2007, while the last 10 years are much more heavily covered with the number of papers published each year still growing. For example, we can observe that in the period of 2008–2013, there were 144 papers, while 2014–2017 alone surpassed that with 262 papers on the subject.
Number of papers per year analyzed by each survey covered in this work.
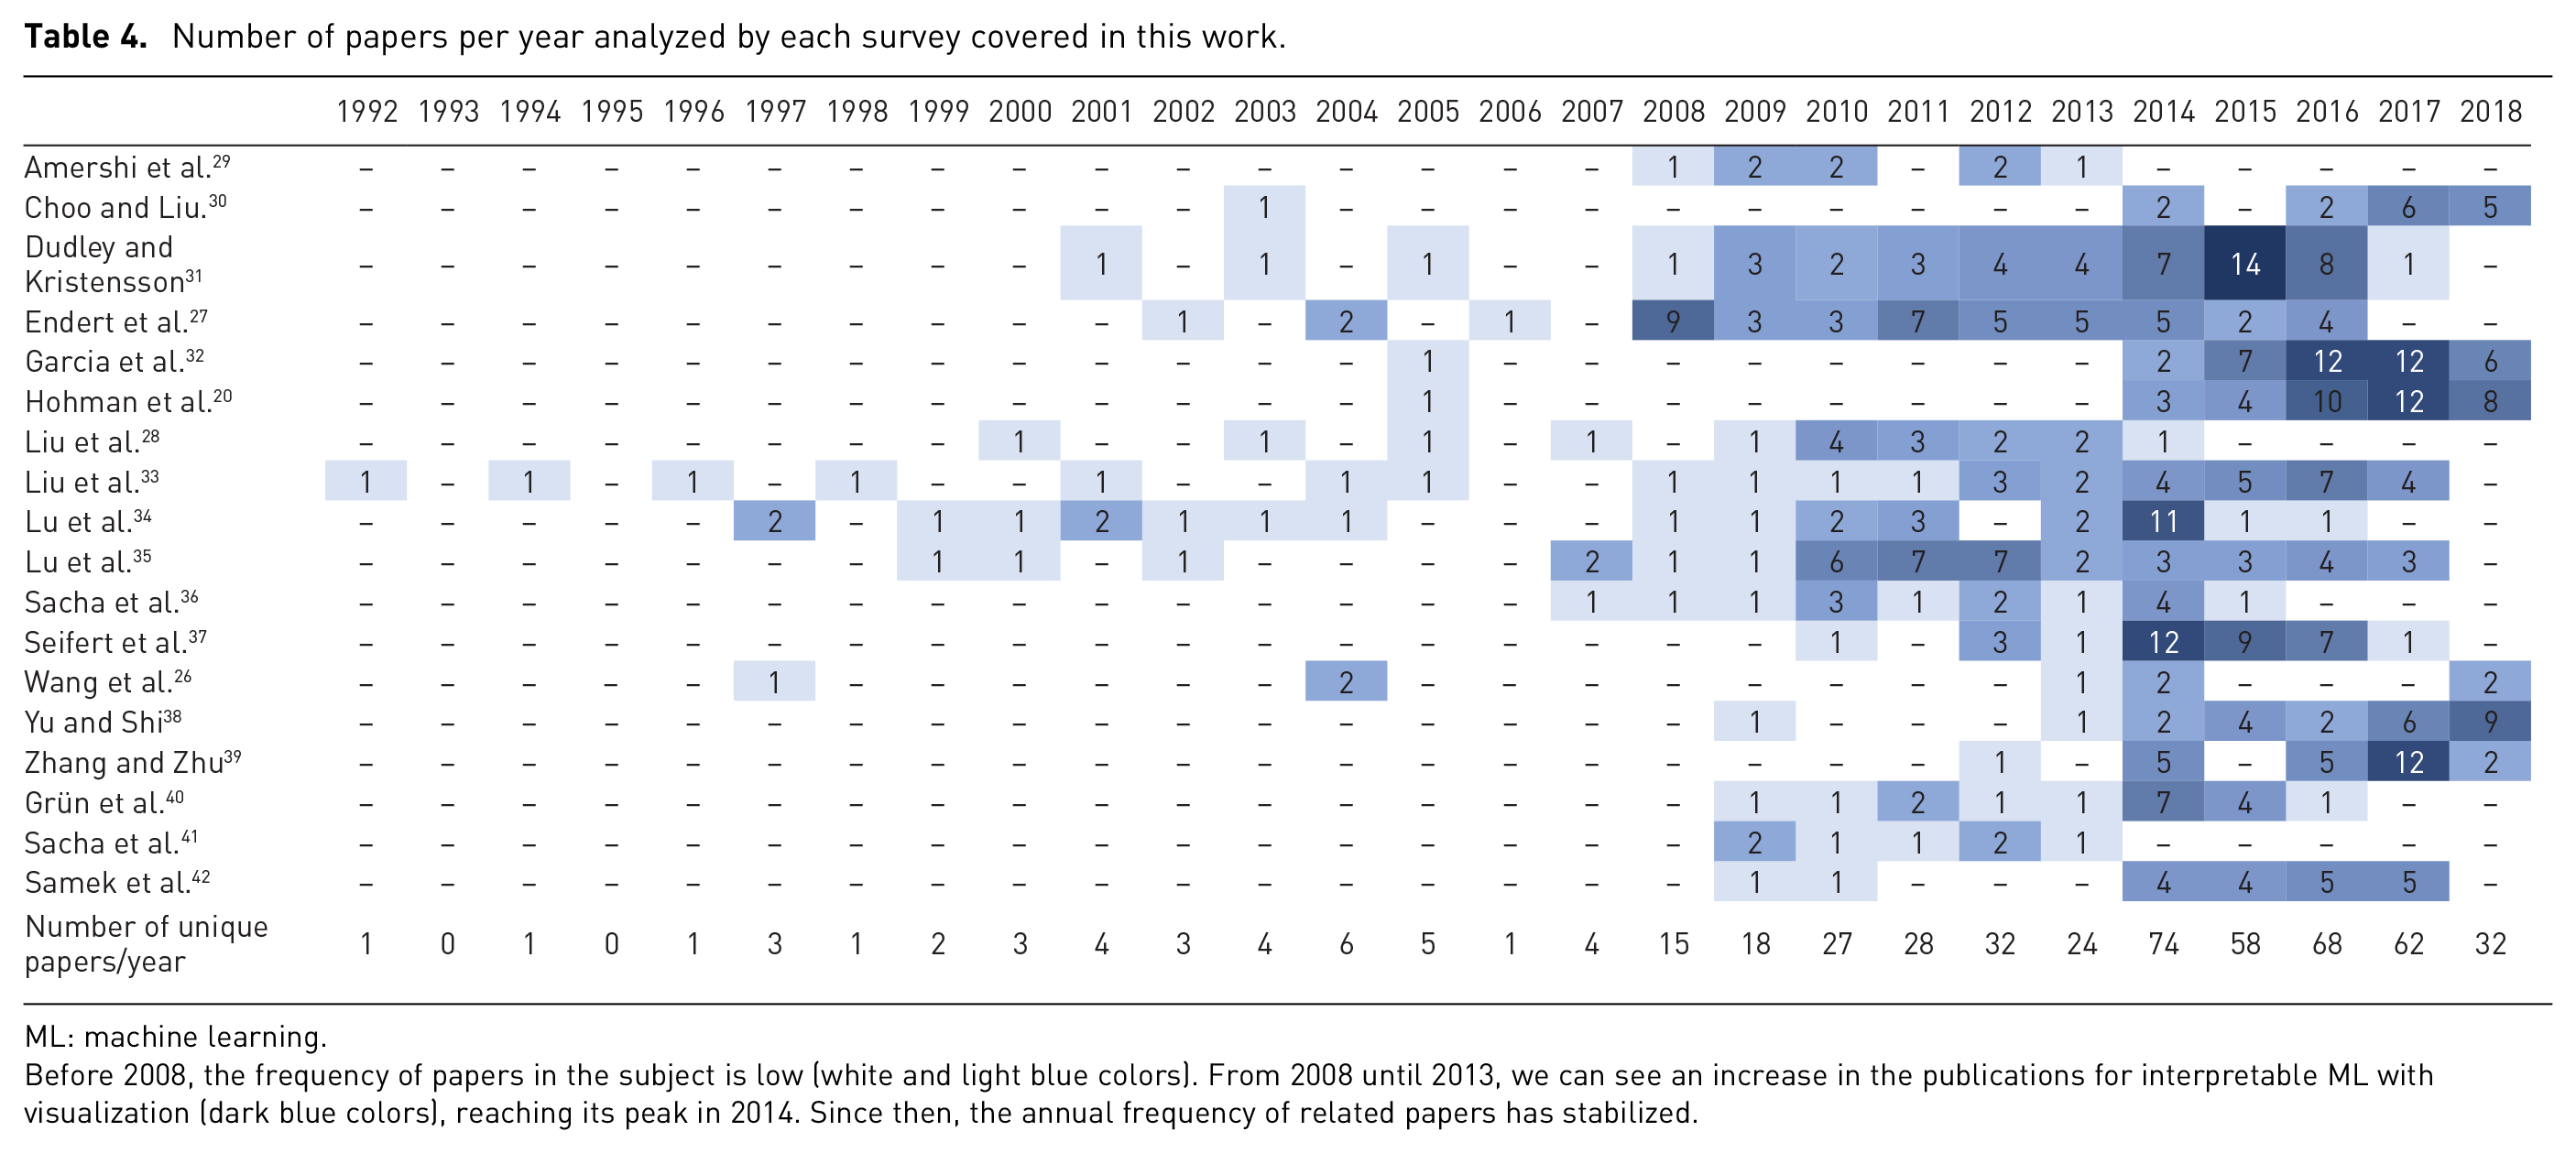
ML: machine learning.
Before 2008, the frequency of papers in the subject is low (white and light blue colors). From 2008 until 2013, we can see an increase in the publications for interpretable ML with visualization (dark blue colors), reaching its peak in 2014. Since then, the annual frequency of related papers has stabilized.
Regarding the main focus of each of the covered surveys, shown in Table 5, we can observe that 8 out of the 18 survey papers (≈44%) are mainly related to the broad family of deep learning (DL) techniques, including terms such as convolutional neural networks (CNNs) or recurring neural networks (RNNs). Other topics that are found include VA pipelines, general ML models, predictive visual analytics (PVA), interactive machine learning (IML), and dimensionality reduction (DR). Moreover, we consider 12 out of the 18 survey papers as being classification/taxonomy-centered (CT) surveys, in which the authors heavily focus on the work of constructing strict categories and separating papers accordingly. However, we consider 6 out of the 18 survey papers as being analysis-oriented (AN), which means that they include more details about the studied papers instead of focusing on the categorization task.
Main focus and types of each survey.
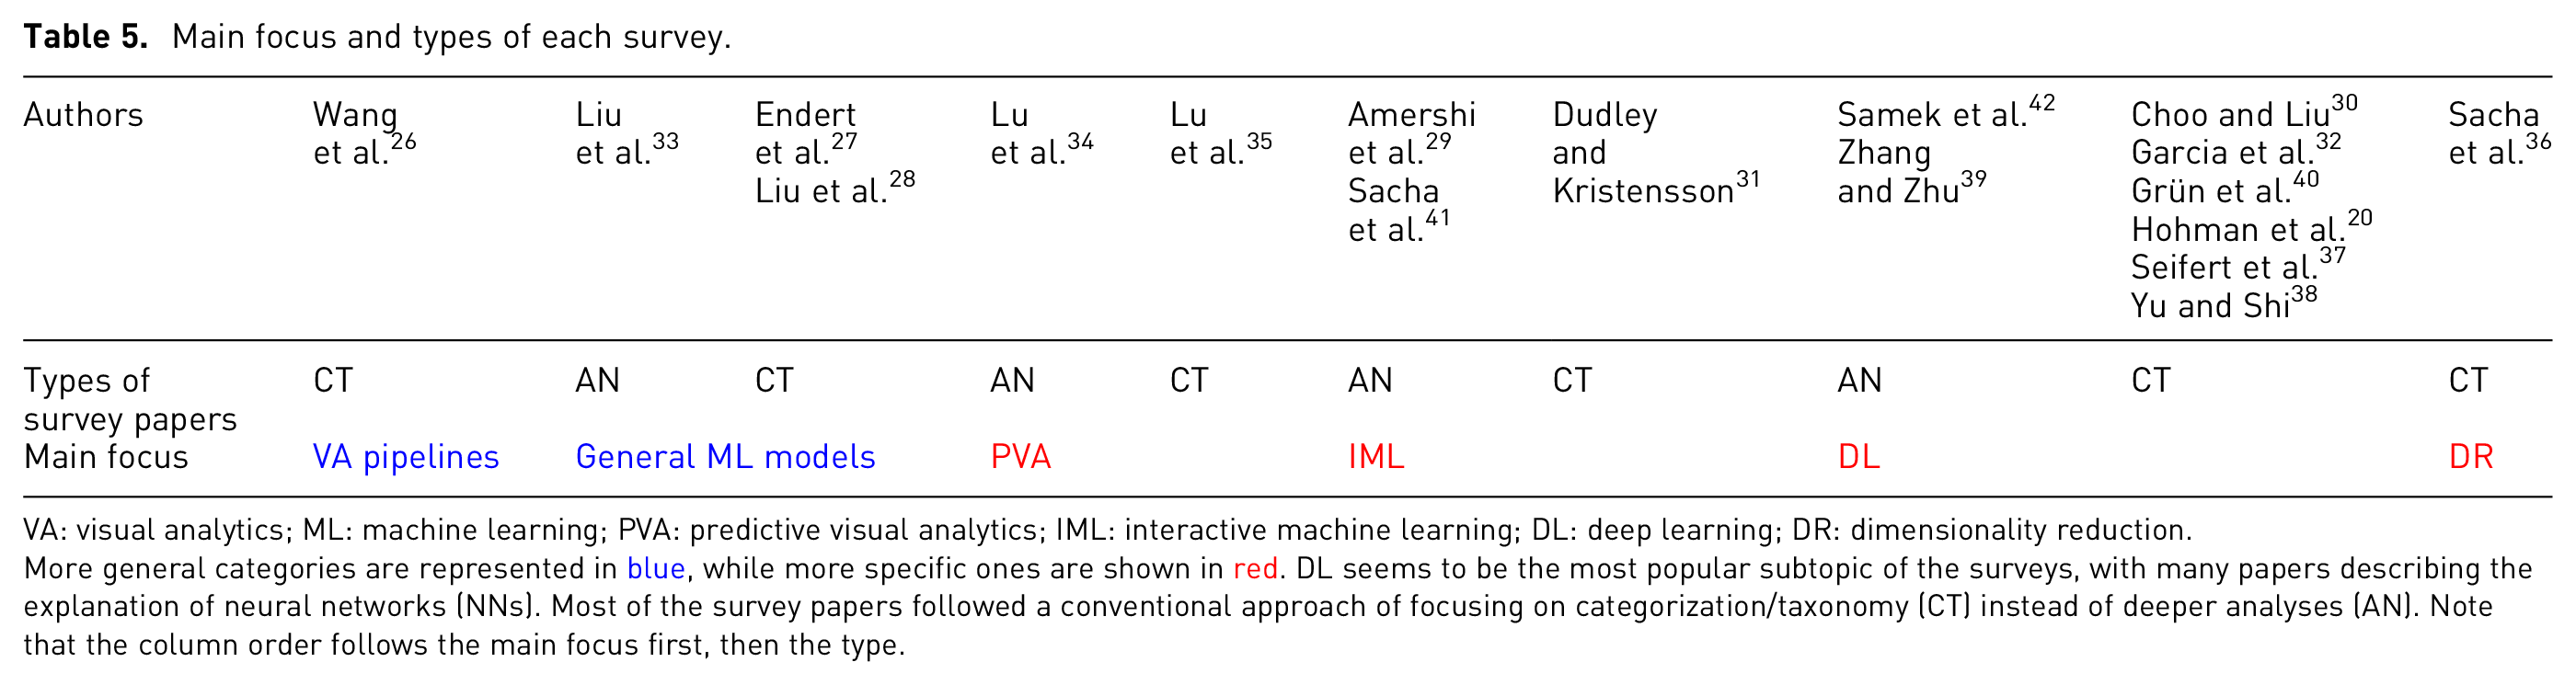
VA: visual analytics; ML: machine learning; PVA: predictive visual analytics; IML: interactive machine learning; DL: deep learning; DR: dimensionality reduction.
More general categories are represented in blue, while more specific ones are shown in red. DL seems to be the most popular subtopic of the surveys, with many papers describing the explanation of neural networks (NNs). Most of the survey papers followed a conventional approach of focusing on categorization/taxonomy (CT) instead of deeper analyses (AN). Note that the column order follows the main focus first, then the type.
In-depth analysis
After selecting and reading the survey papers, we classified them into separate categories regarding content-related patterns, and whether they deal with more general versus more specific concepts, as shown in Table 5: VA pipelines and general ML models (more general); PVA, IML, DL, and DR (more specific).
In this section, we present an in-depth analysis of the content of the selected survey papers, organized according to our proposed categorization. Following our proposal to support a wide range of different readers from the field, we indicate inline which parts of each survey should be more interesting for each type of reader: early-stage researchers () or senior researchers (). Overall, the symbol indicates more general concepts and overviews, while the symbol points to more detailed analyses and descriptions. Note that we also highlight the main differences in the used categorizations throughout the 18 surveys later in the “Discussion and challenges” section and in Table 7 as well.
Visual analytics pipelines
Only one survey
26
has been classified as dealing with VA pipelines in general. The authors of this survey present the usual VA pipeline and compare it with other visualization pipelines, taken from papers that propose them in context of one-dimensional data, two-dimensional data, multi-dimensional data, text data, and networks. One of the discussed works is the PVA pipeline by Lu et al.,
34
see below. For some pipelines, Wang et al.
26
discuss individual stages in detail, such as visual mapping, view generation and coordination, and interaction. All those steps lead to models which allow the analysts to decide between visual methods and automatic analysis methods. Moreover, the authors propose a general visualization pipeline that fits the problem of interpreting ML models with three main stages: (a) feature selection and generation, (b) model building and selection, and (c) model validation. Concretely, feature selection has two fundamental requirements: to not decrease the classification accuracy and to sustain the distributions of classes as they were before the filtering/selection process. For feature generation, algorithms have been developed to make these processes fully automatic, but they often make mistakes that an expert with the appropriate views and knowledge might be able to avoid. In model building and selection, it is vital to have a visual interface that connects ML models with users, hence enabling examinations of hypotheses and obtaining insights. In many cases, model validation is entangled with the previous stage of the pipeline. The final piece of the puzzle is the capability to iterate over this pipeline to achieve better model selection and validation, which leads to even better feature selection and thus forming an infinite loop that can tackle challenging problems. Overall, this survey paper serves as a starting point for early-stage researchers to get familiarized with the pipeline of how the interpretation of ML models works and where visualization is suitable.
General machine learning models
The work of Liu et al.
33
(a predecessor of Choo and Liu
30
) categorizes papers related to general ML models in three classes: (a) understanding, (b) debugging, and (c) refinement. The scope of this survey is not specifically about IML; instead, it presents a much broader discussion and analysis of recent work in visualization of ML models. Their overview shows several paradigms from DL, classification, clustering, and general ML models, which they fit in their three-class categorization with a strong focus on the explanation of the model rather than the other stages of the pipeline. According to Liu et al.,
33
researchers have developed point-based and network-based visualization approaches in order to understand how neural networks (NNs) behave when pre-processing, processing, and analyzing data, in addition to VA tools that diagnose model performance for binary classifiers, multi-class classifiers, and topic models. The available VA systems allow interaction for enhancing the performance of both supervised and unsupervised models.
Endert et al.
27
wrote a survey on a topic that is related but not exactly the same as ours: integrating ML into VA techniques (as opposed to using VA for interpreting ML models, which is our case). Although their survey contains quite a bit of unrelated information, they included many papers that match our criteria, which made us decide to include them in our work. Their categorization starts with DR, clustering, classification, and regression, and then crosses those categories with two separate requirements: (a) modify parameters and computation domain and (b) define analytical expectations. Endert et al.
27
give detailed explanations and analysis of each category, including a table that guides the reader to more information about those tools and techniques.
The final survey in this category, Liu et al.,
28
describes approaches for the visualization of high-dimensional data using the stages of the typical visualization pipeline to divide their papers into three categories: (a) data transformation, (b) visual mapping, and (c) view transformation. While initially this might not be explicitly relevant to our subject, in some of their categories, we found interesting papers for this work, including articles dealing with DR, subspace clustering, and regression analysis.
Summary of the three surveys
The latter two survey papers concentrate on presenting various tools and providing future challenges without any meta-analyses. They follow similar categorizations of algorithm types, but the difference between them is the focus. For Endert et al., 27 the main subjects are tools for adjusting the parameters of an algorithm, or even replacing the algorithm used, and supporting users to interact with results of the computational process, versus methods that enable users to monitor the output of an algorithm and improve it. Liu et al. 28 used the InfoVis reference model and, specifically in the data transformation part of the pipeline, included papers addressing the problem of exploration of ML models. The first survey by Liu et al. 33 also describes the model analysis, which is a further step of the pipeline after data processing/transformation, and feature selection before evaluation/validation. Thus, researchers can benefit by browsing through these surveys that cover different aspects of a pipeline of ML, depending on the area they are more interested in.
Predictive visual analytics
According to the literature review in Lu et al.,
34
the pipeline of PVA consists of four main blocks: (a) data pre-processing, (b) feature selection and generation, (c) model training, and (d) model selection and validation; complemented by two extra blocks that interact with the pipeline: (e) visualization and (f) adjustment loop. The authors provide extensive details for each block and describe example papers related to data cleaning, data transformation, and data integration and fusion, which all are part of data pre-processing. Additionally, a comparative analysis has been performed with white box and black box methods, revealing the differences between them. Various applications for different types of data are presented, such as tabular data, time-series data, spatio-temporal data, textual data, and image data. Before reaching to the conclusion and open challenges, they define a list of comparisons with methods before PVA and after the use of PVA in a quantitative manner.
Another survey paper about PVA, written by Lu et al.,
35
was published a few months after the first one. They follow a similar approach by classifying papers considering the PVA pipeline that we described in the previous paragraph. In addition, there are two new categories: interaction and prediction. For example, regression, classification, clustering, and others are the main subcategories of the prediction task, and select, explore, filter, and others, are subcategories of interaction. Two tables show the results of co-occurrence and correlation analyses of classes of interactions, model types employed, and stages of the PVA pipeline according to their classification. In addition to the survey paper, they also offer an online web-based browser that contains papers on PVA, where the users can search through the papers with specific filters, such as selecting specific classes, years, or keyword search.
Summary of the two surveys
From Table 2, we can conclude that approximately half of the papers are unique in the two survey papers described above, which suggests that both have their value. Researchers interested in learning more about specific applications of PVA with different types of data should focus on the first survey paper 34 since an extensive analysis of the pipeline is made, including various papers in each step. However, the second survey paper 35 contains only a short analysis of the PVA pipeline but focuses much more on interaction techniques used in the tools. Its co-occurrence and correlation matrices serve as a rich meta-analysis of the covered papers, which should benefit both new and experienced researchers. The paper selection in that survey suggests that three groups are beneficiary from this survey: end-users (i.e. non-expert users), domain experts (experts in a particular field), and modeling experts (experts in models but not in a specific application).
Interactive machine learning
The first survey that falls into this category is from Amershi et al.
29
Instead of focusing on the classification of papers into different categories, they emphasize the description of different applications of IML, for example, image segmentation and gesture-based music. Furthermore, a significant part of their discussion is geared toward user interaction from a human perspective. They highlight, for example, the strong tendency of humans to give more positive rewards/feedback than negative rewards/feedback to learners during reinforcement learning (i.e. where an agent senses and acts in a task environment and receives numeric reward values after each action). They further demonstrate that feeding a visualization system with positive feedback through interaction, even if it might have taken the wrong decisions, is currently a prominent issue that requires a solution. Consequently, systems that guide their users in a correct way are desirable to solve this problem. According to the authors, people react positively and appreciate transparency in ML systems. As labeling is still a demanding process, they found that people want to superimpose the data labels with additional comments, and this is when transparency becomes valuable.
In the last section of their survey, Amershi et al.
29
present papers that include implemented tools supporting interaction with ML models. The authors asserted the levels of assistance that users get through interaction in three stages of the execution of ML algorithms: input, intermediate steps, and output. For instance, user interaction can be useful at the input stage for tuning hyperparameters and comparison purposes between the various ML techniques. They consider as intermediate steps both the human interaction with the system and receiving guidance from the system during the execution of an ML algorithm. Concrete actions, for example, might be queries to alternate the flow and/or the outcome of the procedure or quality assessment during the iteration of the algorithms. At the final stage, the users should be capable of evaluating the output and deciding which faulty aspects should be excluded from the next analysis. For each presented stage, they cite papers and tools that support these operations. All these observations brought them to the conclusion that it is essential to combine and take advantage of different ML models.
2. Dudley and Kristensson
31
present a survey of existing approaches and applications in IML with a categorization based on the type of data (application). The authors begin by discussing implementations and techniques that allow users to interact with ML models in the visualization of text, images, speech, audio, video, and motion. The remaining part of their survey contains more general considerations about how to deal with assisted processing of structured information and raw numerical data. The former is about IML systems that utilize structured data to train models that improve user abilities. These examples are related to the application domain or the experts’ special knowledge of the training process. The latter refers to trials that omit the data type and process numerical data. Those approaches are unrelated to the data types and could be imagined as similar to spreadsheet applications that brought the key statistical functionalities to non-expert users. These techniques are suitable for experts but also for non-experts depending on the approaches that the authors deploy. After the analysis of the literature, they describe the design that an IML interface should have and present a workflow of the IML process according to their notes.
3. Finally, Sacha et al. 41 propose a human-centered ML framework that is general enough to fit different existing tools. The conceptual framework enhances several interaction options by dividing the process into five steps: (a) edits and enrichment, (b) preparation, (c) model selection and building, (d) exploration and manipulation, and (e) validation and interaction. In edits and enrichment, users should be able to interfere with the data instances and labels (e.g. by adding or editing labels in the training process) and check preliminary “what-if” hypothesis scenarios in order to better understand the data itself. The preparation step is important to allow users to affect groups of observations by applying transformations, for example, scaling and weightings, selecting specific features, or filtering. In model selection and building, users should be able to interact with ML models by choosing different algorithms and adjusting their parameters. The aim of the exploration and direct manipulation step is to support the interpretation and validation of the previous ML models by visualizing the data and model spaces, the quality, and the structure of ML algorithms. The final validation and interaction step concerns the potential analysts working with a visualization tool which integrates all the functionalities into an individual system in order to check the results and derive final insights.
Summary of the three surveys
Even though the three described survey papers focus on different aspects of IML (e.g. importance of users, approaches for specific applications, and general framework), they converge into a common pipeline, that is, a similar framework/workflow that is useful for visualization researchers. First of all, the data should be easily labeled, cleaned, filtered, and reviewed—with assistance from visualization—before being used as input to ML algorithms. After that, especially according to Sacha et al., 41 comes a transformation stage, characterized by giving weights and manipulating the data features or instances, for example. Then, the three works suggest model selection and comparison until the best suitable for each case (data set/application) is found; and afterward, to allow the user to steer the model toward the best possible solution. Exploration and manipulation for the assessment of the quality while the process is ongoing, or after the results are shown to the user, is also a crucial part of the common pipeline. Dudley and Kristensson 31 extend this part of the pipeline and state that monitoring and keeping track of the time and cost of the process should be visualized after the end of this process. Then, finally, comes validation and interaction with the use of visualization in order to fit the model into a specific application and to tackle a specific problem. The workflows or frameworks that are presented by the papers in this category show how visualization can aid users in various ways when attempting to solve a complicated task. Early-stage researchers should focus on those areas, and these survey papers for IML are a good starting point.
Deep learning
DL is currently a very popular area of ML, not only in artificial intelligence (AI) but also in the InfoVis community. This is reflected in the statistics of our SoS: over one-third of the surveys that we collected are about DL, which are the eight surveys that we discuss in the following:
To connect DL with VA, Choo and Liu
30
consider three major directions: (a) model understanding, (b) debugging, and (c) refinement/steering. Model understanding intends to reveal the reasoning behind model predictions and the internal operations of DL models. When a DL model underperforms or is not able to converge, then the model debugging process can be utilized in order to distinguish and resolve such problems. Model refinement/steering refers to techniques that interactively include the users’ expertise in the development and refinement process of a DL model. That could be achieved, among others, through user interactions, supporting semi-supervised learning, or active learning. The survey authors list libraries and tools that were used in model understanding and debugging which could be helpful for both young and senior researchers. Computational methods for the interpretation of DL from ML and AI communities are also introduced. Before analyzing research opportunities, the authors discuss VA approaches and cite articles that give clues on how to troubleshoot and improve models (i.e. model understanding and refinement). VA tools for RNNs and CNNs are broadly discussed as well.
Garcia et al.
32
explain the classical ideas behind ML and DL from a mathematical perspective, including deep feedforward networks (DFNs), CNNs, and RNNs. Additionally, they present a VA workflow which shows the tasks of the multiple phases of DL networks, placing emphasis on the value of VA for DL networks. The authors’ contributions include the separation of their collection of publications into three categories, depending on their particular visualization goal: (a) network architecture understanding, (b) visualization to support training analysis, and (c) feature understanding. They conclude by testing techniques that different tools use with common DL architectures (i.e. DFNs, CNNs, and RNNs).
Hohman et al.
20
investigate VA tools that explore DL models by classifying papers into six categories, each based on a research question: “Why would people want to use visualization in DL?”; “Who is able to take advantage from visualization of DL?”; “What data, features, and relationships could be visualized in DL?”; “How is it possible to visualize the data, features, and relationships?”; “When in the DL process is visualization useful?”; and “Where DL visualization could be necessary?” Accordingly, each of the analyzed papers is assigned to one or more of these questions, depending on whether it contributes to that aspect or not. Interpretability and explainability as well as debugging an improving model are two subcategories that most of the papers belong to. According to the authors, a common approach for visualization designers/researchers is to perform instance-based analysis and exploration, that is, specific data instances are tested to understand how they develop throughout a model pipeline. Additionally, most of the discussed tools at this survey paper are used to observe the results of an in-depth learning process instead of the middle steps of the training process. The DL models that these visualization papers focus on are mostly related to CNNs, RNNs, and GANs.
The two research questions that Seifert et al.
37
tried to answer are “What are the insights that can be gained from DNN models by using visualizations?” and “Which visualizations are appropriate for each kind of insights?” To reach their conclusions, they surveyed visualization papers and separated them into five main categories: (a) the visualization goals, which are mostly related to an assessment of the architecture, (b) the visualization methods, which are single-image pixel-based displays, (c) the computer vision tasks, which are mostly classification and representation learning, (d) the network architecture types, which are in most cases CNNs, and (e) the data sets that are used, with ImageNet
43
being the most popular. Moreover, they offer a table showing the relationships between visualization goals and applied methods, a table with an overview of data sets, which is a unique feature across the surveys that we reviewed, and tables with the aggregated results.
Zhang and Zhu
39
separate their survey paper into five distinct sections. The first one is about visualization of CNN representations in intermediate network layers. The second deals with the diagnosis of CNN representations, and the third discusses issues of disentanglement of “the mixture of patterns” encoded in every filter of CNNs. The fourth is about building explainable models, and finally, the last one concerns semantic-level middle-to-end learning through human–computer interaction. They do not follow a clear methodology of categorization. Instead, they analyze the field according to the above-mentioned viewpoints.
Grün et al.
40
describe a new taxonomy for feature visualization methods that—according to the authors—fit most of the relevant papers. This taxonomy supports the task of providing an overview of feature visualization papers together with the open-source library FeatureVis
40
for MatConvNet
44
which they created. FeatureVis is used for the visual analysis of DL models and the direct development of users’ network architectures. Grün et al. place papers in three distinct categories as follows: (a) input modification methods, (b) deconvolutional methods, and (c) input reconstruction methods. They define their characteristics and summarize the related literature of each category.
Samek et al.
42
summarize the field of interpreting DL models by focusing on the techniques/tools that try to open the black box of the models. They do not have a precise categorization, and not all original papers are analyzed in detail. The main goal of this survey is to foster awareness of the usefulness of having interpretable and explainable ML models using methods such as sensitivity analysis (SA)
45
and layer-wise relevance propagation (LRP).
46
Yu and Shi
38
surveyed visualization tools that assist the user in reaching four high-level goals: (a) teaching concepts, (b) assessment of the architecture, (c) debugging and improving models, and (d) visual exploration of DNNs, CNNs, RNNs, as well as deep generative models. They target four distinct groups of people: (a) beginners, (b) practitioners, (c) developers, and (d) experts, respectively. These groups are all, according to the authors, related to the aforementioned four visualization goals.
Summary of the eight surveys
Due to the relatively large number of surveys in this category, we present here a brief comparison instead of a short summary. First, we look at the differences with respect to their focus on specific DL models, and second, with respect to the chosen visualization methodologies.
Garcia et al.,
32
Hohman et al.,
20
Seifert et al.,
37
and Yu and Shi
38
discuss papers for visualizing DNNs, CNNs, and RNNs. A specific type of DNNs, called DFNs, is examined only by Garcia et al.
32
Long short-term memory (LSTM) and generative adversarial networks (GANs) are also considered in the taxonomy of Hohman et al.
20
Multicolumn deep neural networks (MCDNNs) were reported by Seifert et al.,
37
along with deep convolutional neural networks (DCNNs), which are variations of NNs and CNNs. Deep generative models (DGMs), such as GANs, and variational autoencoders (VAEs), were included in Yu and Shi.
38
In most cases, the described visualization tools provide visual explanations for experts, and debugging and improving models for developers as target groups.
Furthermore, Hohman et al. 20 and Seifert et al. 37 provide discussions on concrete visualization methods. They discovered that instance-based exploration and pixel-based approaches are the most common. Aggregation of information20,32,38 is also a usual way to describe the inner parts of the algorithms, along with feature and instance explorations. In these four mentioned survey papers,20,32,37,38 there are examples of tools developed for model users, developers, practitioners, and non-experts, but the survey authors conclude that experts are the main target group for most of them. Also, DNNs and CNNs are the most prominent NNs which are usually visualized. Choo and Liu 30 and Samek et al. 42 motivate why we need visualization to support DL, while Zhang and Zhu 39 and Grün et al. 40 work with CNNs following a similar approach with visualizing, diagnosing/debugging, building explainable models, and allowing the user to steer/interact with the model. The difference here is that Grün et al. 40 focus on feature visualization techniques, while Zhang and Zhu 39 focus on the values of model interpretability. Choo and Liu’s 30 paper does not have any specific model when describing those cases. Samek et al. 42 include examples of different application domains in which those models can be used.
Dimensionality reduction
Sacha et al.
36
focus in their survey on DR techniques and tools. They propose very detailed and comprehensive categorizations, initially separating the original papers into seven guiding scenarios for DR interaction: (a) data selection and emphasis, (b) annotation and labeling, (c) data manipulation, (d) feature selection and emphasis, (e) DR parameter tuning, (f) defining constraints, and (g) DR type selection. Some of the papers they collected belong to more than one scenario at the same time, in some cases even reaching the four different scenarios for a single paper. The authors also assess interaction and usability covered by those papers by categorizing them into five more categories: (a) direct manipulation of visual elements, (b) controls such as sliders or buttons, (c) command line interface, (d) other, and (e) not applicable for the unmatched papers. Finally, they also distinguish between two more categories related to the tasks in which the methods are used: clustering and classification. Their approach is closer—in comparison to others—to the mental map and the logic that people usually follow in order to classify and find what techniques they should use in visualization. Therefore, this survey works nicely as a guide for better understanding the design space and supporting the implementation of new DR-based tools. The authors also show the relationships between the identified DR techniques and the above-listed interaction scenarios, including a table with temporal statistics of interaction and DR techniques.
This survey paper provides a robust meta-analysis of the included papers, including previously identified patterns such as calculating correlation between analyzed papers. It should be a valuable source for experienced researchers to retrieve new information about the subfield of explaining DR with visualization.
Topic analysis
In order to detect interesting relationships and emerging topics among the 18 survey papers, we applied topic modeling to the individual papers discussed by them, following the overall visual text analysis approach proposed by Kucher et al. 47
Methodology
First, we selected only the unique papers of each survey paper, collected all their PDF files, and converted them to text. Next, we processed their full texts with the latent Dirichlet allocation (LDA) algorithm,48,49 a standard approach for topic modeling. In order to validate the LDA results—it might produce different results at different executions—we ran the same process multiple times and found equivalent results without significant changes. In the end, our LDA results led to ten topics; the top 8 terms for each topic are presented in Table 6. Our implementation uses Python with natural language toolkit (NLTK) 50 for the pre-processing of stop words and Gensim 51 for the topic modeling stages. The names of the topics were manually proposed after discussions between the authors considering the top terms and the contents of the survey papers in each topic. The results are visualized with the help of the interactive visualization tool described by Kucher et al., 47 see Figure 3.
Top eight terms for each of the 10 topics generated with latent Dirichlet allocation (LDA) from the collection of the papers of the survey papers.
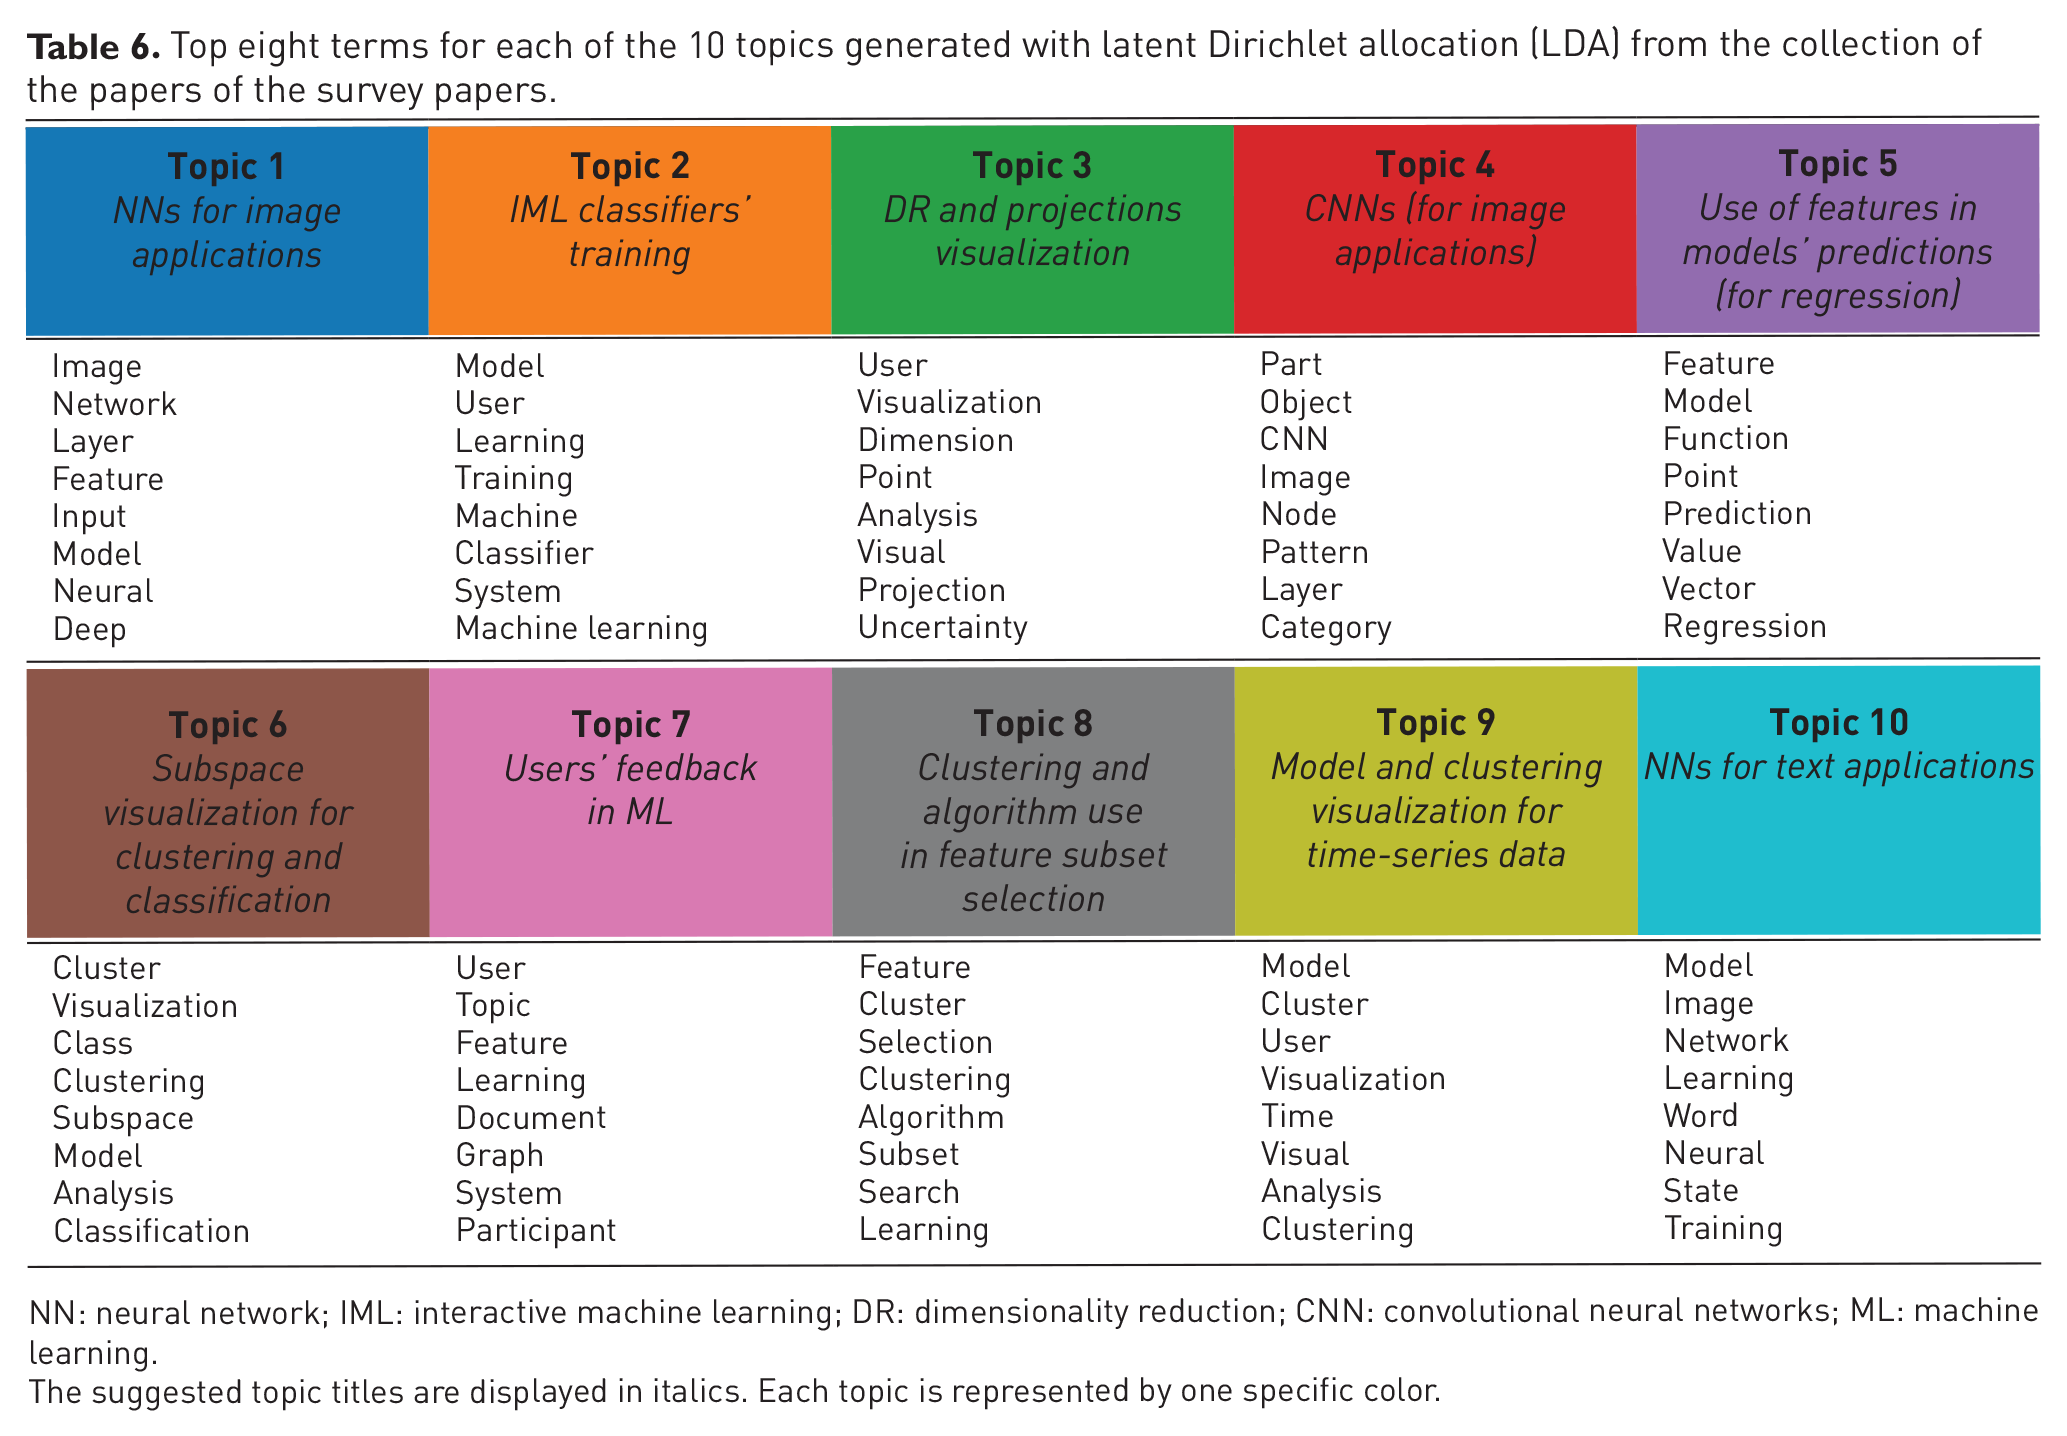
NN: neural network; IML: interactive machine learning; DR: dimensionality reduction; CNN: convolutional neural networks;ML: machine learning.
The suggested topic titles are displayed in italics. Each topic is represented by one specific color.
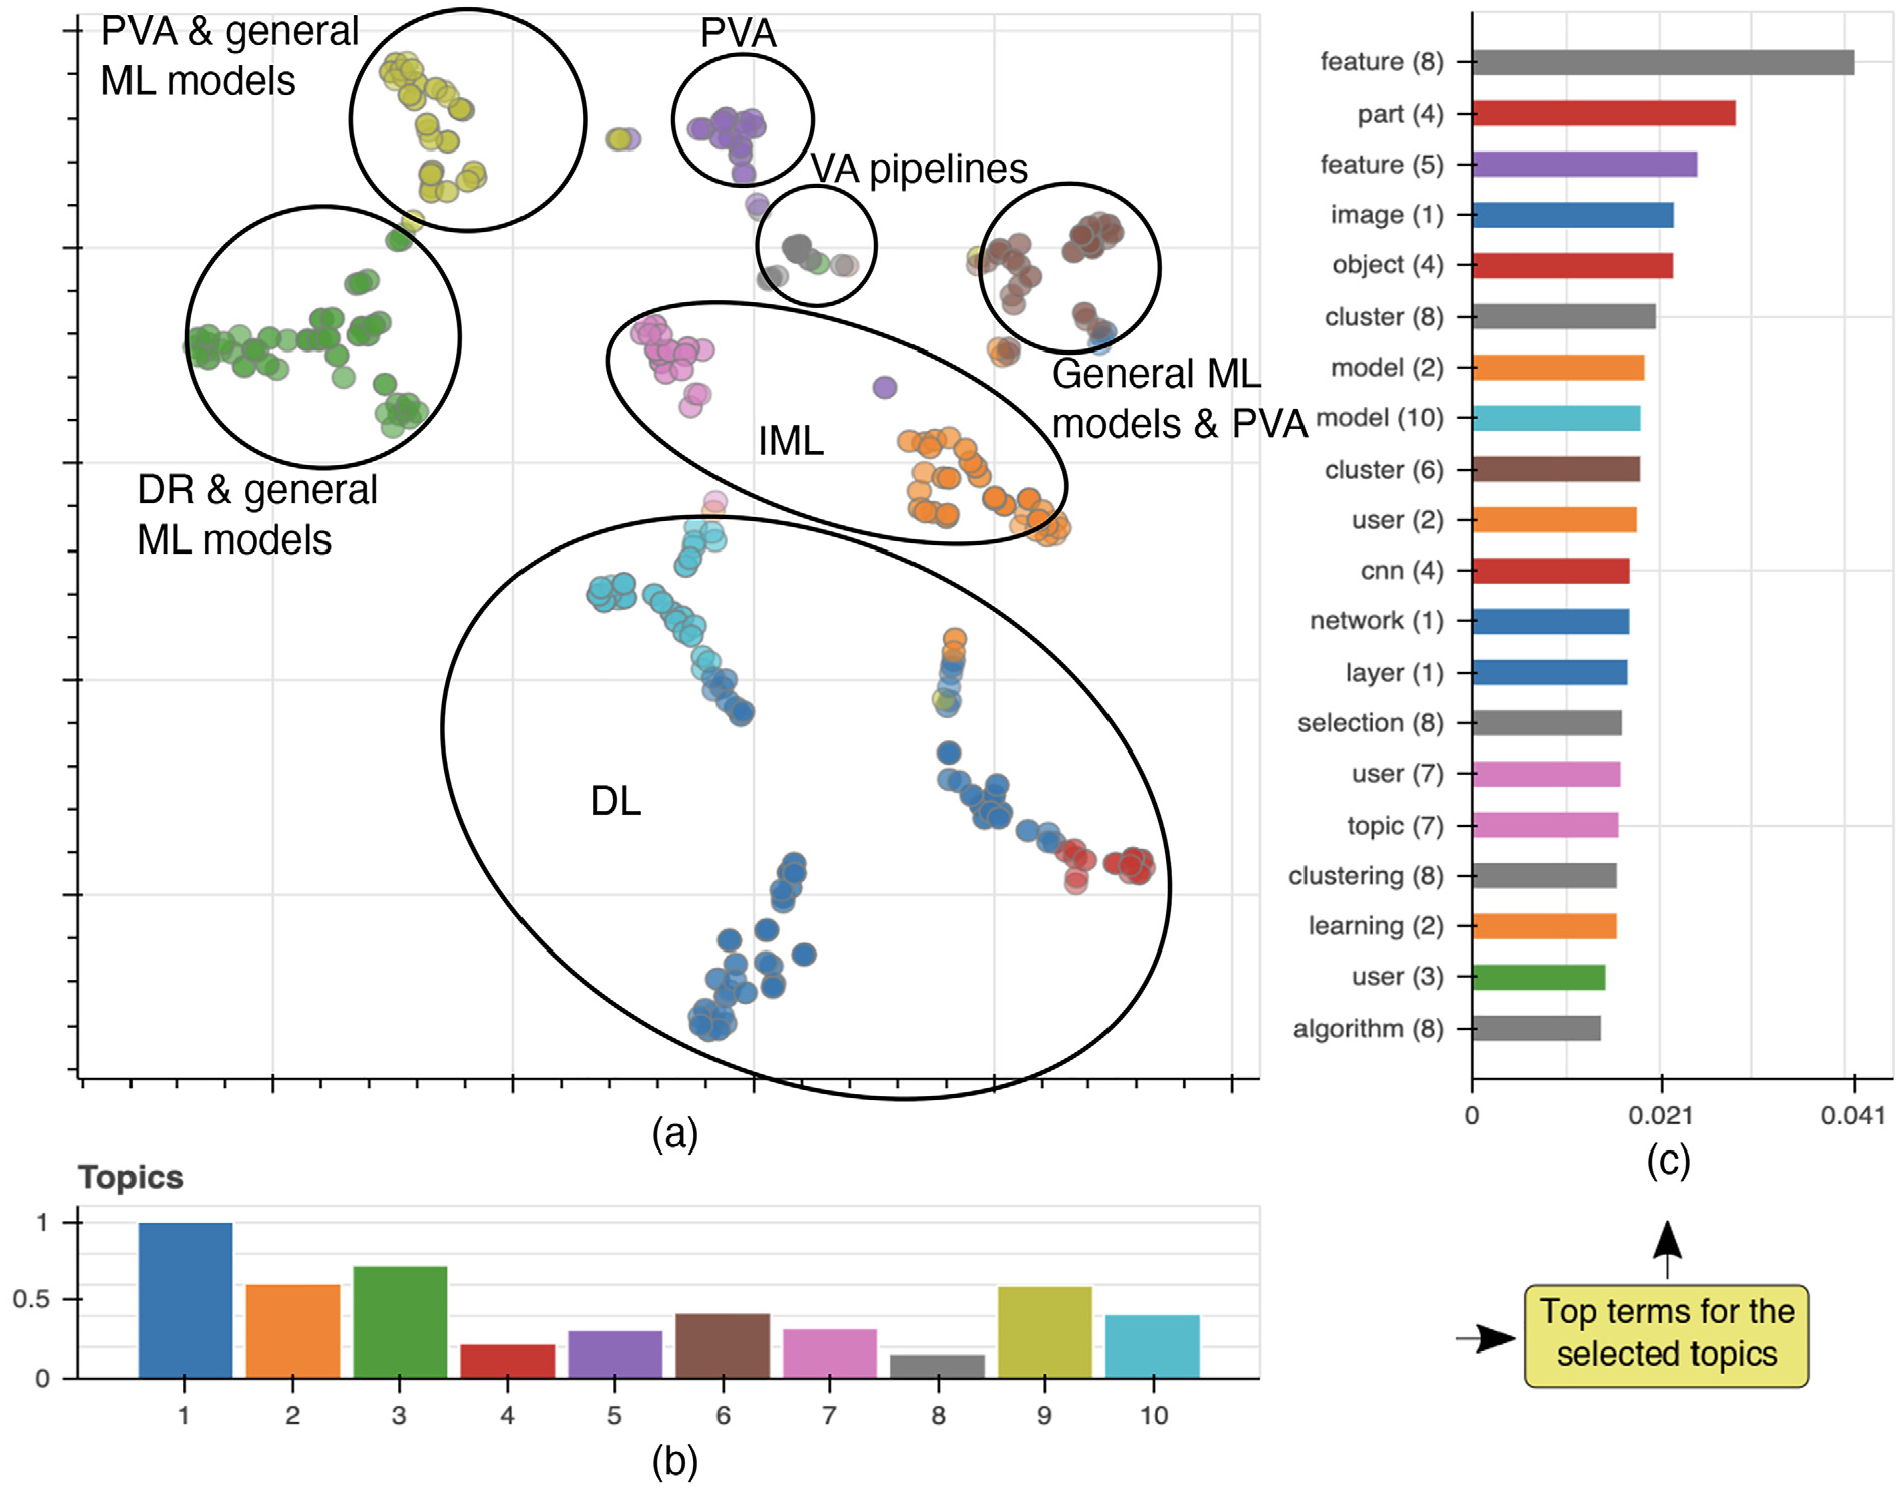
Exploration of emergent topics extracted from all individual papers discussed in the surveys. (a) Papers’ embedding created with t-SNE and based on the extracted topics (black outlines were manually drawn and represent our categorization). (b) Bar chart of topics with their relevance (scaled from 0 to 1). (c) Bar chart of top terms with the highest relevance for all the topics (topics are identified by both numbers in parentheses and colors; note that a single term can be present in multiple topics).
Topics
In the following description list, we briefly summarize the 10 topics we identified:
 Topic 1. NNs are often used in image applications, and visualizations are frequently employed to get a better understanding of pre-trained networks. However, visual representations of NNs that display the middle layers and try to open the black box of NNs are less explored according to the related survey papers (cf. Table 5). Consequently, such visualizations might be good candidates to focus on in future research.
 Topic 2. During a training process, it is desirable to include humans in the loop that inspect and correct the classifier’s errors and decisions.
31
However, more research is necessary for defining the appropriate level of the end-users and classifiers distribution of work, setting the right occasions of interference from the user side to the system, and finding the frequency of these interactions of the human and model.
Topic 2. During a training process, it is desirable to include humans in the loop that inspect and correct the classifier’s errors and decisions.
31
However, more research is necessary for defining the appropriate level of the end-users and classifiers distribution of work, setting the right occasions of interference from the user side to the system, and finding the frequency of these interactions of the human and model.
 Topic 3. Data Manipulation and DR Type Selection were only found seven and four times in individual papers of Sacha et al.,
36
respectively. Sacha et al. propose that an appropriate selection of DR algorithms, while users explore, modify, and manage the data, can be a worthwhile direction for future research.
Topic 3. Data Manipulation and DR Type Selection were only found seven and four times in individual papers of Sacha et al.,
36
respectively. Sacha et al. propose that an appropriate selection of DR algorithms, while users explore, modify, and manage the data, can be a worthwhile direction for future research.
 Topic 4. CNNs are in several cases used in image applications. Model understanding and diagnosis visualization tools and feature visualization methods aid in explaining them.
39
Topic 4. CNNs are in several cases used in image applications. Model understanding and diagnosis visualization tools and feature visualization methods aid in explaining them.
39
 Topic 5. Use of features in models’ prediction is not a trivial task, especially due to the computational resources that are needed while using predictive analytics algorithms and allowing the user to steer the process. As a result, one research question is “how the feature selection process can be supported during a real-time algorithm execution?” along with the problem generated by the lack of formal validation studies in the area of PVA.34,35
 Topic 6. Dealing with subspace visualization for clustering and classification types of ML is an interesting topic which is already in the focus of the visualization community. Subspace clustering methods not only support the search for various robust projections but also deal with the difficulties of the ever-increasing complexity of the data by breaking them down into lower-dimensional subsets.
27
Topic 6. Dealing with subspace visualization for clustering and classification types of ML is an interesting topic which is already in the focus of the visualization community. Subspace clustering methods not only support the search for various robust projections but also deal with the difficulties of the ever-increasing complexity of the data by breaking them down into lower-dimensional subsets.
27
 Topic 7. This topic represents methods that unite user steering as part of the algorithm and refresh the underlying model to match user input. Some research questions that arise are the trade-off between accuracy and execution time of these algorithms while being under user control, and how to incorporate user feedback into computation during runtime.
31
Topic 7. This topic represents methods that unite user steering as part of the algorithm and refresh the underlying model to match user input. Some research questions that arise are the trade-off between accuracy and execution time of these algorithms while being under user control, and how to incorporate user feedback into computation during runtime.
31
 Topic 8. Clustering and algorithm use in feature subset selection is only discussed in the survey paper by Wang et al.
26
and is related to the first stage of their proposed pipeline. Improvements can be accomplished if, for instance, users monitor (with visualizations) the feature selection and generation process and intervene—when necessary—by adding, modifying, or deleting features.
26
Topic 8. Clustering and algorithm use in feature subset selection is only discussed in the survey paper by Wang et al.
26
and is related to the first stage of their proposed pipeline. Improvements can be accomplished if, for instance, users monitor (with visualizations) the feature selection and generation process and intervene—when necessary—by adding, modifying, or deleting features.
26
 Topic 9. This topic refers to systems that address the inherent temporal aspect of time-series data. A number of surveys conclude that the analysis of the time aspect, and also real-time applications, need more exploration by future research.27,34,35
 Topic 10. NNs are often used to analyze textual data sets (usually with RNNs).20,32 Several surveys20,32,38 claim that aggregated information and analyses of the textual input data mostly lead to instance-level visual exploration, because a single text phrase is considerably easier to understand for the analyst than a massive set of words/phrases with additional information derived from the raw texts.
Topic embedding
The 10-dimensional data space of the topics over all individual papers has been reduced to two dimensions using t-distributed stochastic neighbor embedding (t-SNE), 52 that is, two papers are positioned close to each other if their topic relationships are alike, see Figure 3(a). The scales in the depicted bar charts are from 0 to 1, with 1 being the highest relevancy value of a topic in Figure 3(b) and of a term in Figure 3(c). The black outlines on top of the visualization (see Figure 3(a)) are manually assigned and validated following the bipartite graph (Figure 4) depicting the relations of topics, survey papers, and categorization.
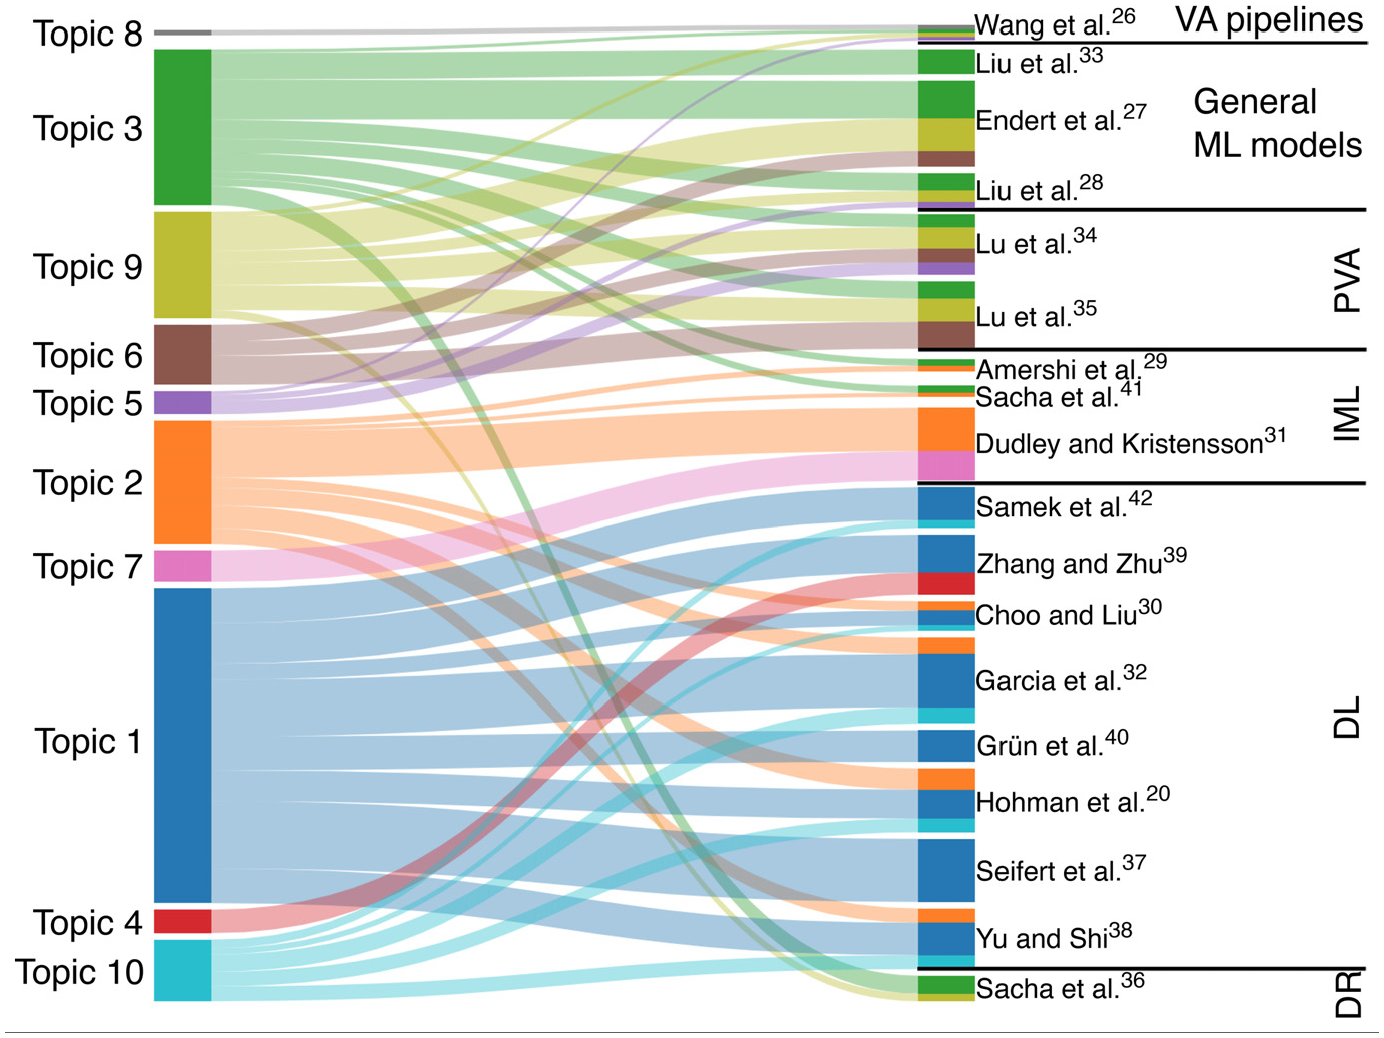
Explicit connections between the survey papers and the LDA topics extracted automatically from the individual papers under each survey. The width of the connections shows the weight of each topic in each survey paper. On the right side, the survey papers are categorized and sorted according to Table 5. On the left side, the topics are ordered to minimize the number of crossing lines.
By relating the main categories of the 18 surveys (described in the previous section and Table 5) to the t-SNE plot (indicated by the black outlines in Figure 3(a)), we could find a number of interesting insights. The “general ML models” category, for example, is shown in three separate clusters of the plot, because it is mainly related to three auto-generated topics. This is to be expected from such a general category. However, one unexpected observation is that the same effect is observed in the “PVA” category. After some investigation, we believe it is due to its broad topic coverage as PVA uses projections and DR, makes predictions based on features, and also explores the various subspaces of data sets. According to Figure 3, Topics 1, 4, and 10 are clearly related to DL; Topics 2 and 7 to IML; Topic 8 to VA pipelines; and Topic 5 to PVA. One example of a well-separated group is the one related to DR and clustering, in general associated with Topic 3. Overall, we found that the automatically generated topics agreed with our manual categorization while, at the same time, introduced new subcategories that refined even further the organization of the papers under analysis by the surveys. We believe that this combination of coarse-grained, manual categorization, with fine-grained, automatic refinement can help guide potential readers through this set of surveys.
Relations between topics and survey papers
In Figure 4, we show the explicit connections between the topics and the survey papers in a weighted bipartite graph. The weight is calculated as a percentage by summing up the “strength” of the individual papers within each survey paper according to the LDA algorithm. The acceptable threshold for these weights was set to ≥14% coverage—that is, for an edge to be plotted in the bipartite graph, at least 14% of a survey paper must be related to a topic. By setting this threshold, we have (on average) three topics related to each survey paper, which leads to a good compromise between readability and complexity. We can see that groups of related survey papers emerge from this graph, for example, the combination of Topics 1, 2, and 10, and the combination of Topics 3, 6, and 9, are generally in agreement with our manual categorization (cf. Table 5) and with the previous visualization (see Figure 3). It is also possible to differentiate here between topics that are more general (less specific), such as Topics 1, 2, and 3, which are spread among many surveys, and less general (more specific) ones, such as Topics 4, 7, and 8, which only show up in one survey each. Considering that a reader probably intends only to follow a small subset of the detected topics, Figure 4 should work as an objective and concrete guide to this task.
Network visualization
Finally, in Figure 5, we use network visualization 51 to present a map of the landscape of the publications in the area, directly showing the relationships between different survey papers (larger, gray circles, with reference numbers) based on their common analyzed individual papers (smaller, colored circles). The colors of the individual papers indicate the most prominent topic they address. This also indirectly helps to visualize the connections between survey papers and topics. In order to improve the network visualization, we used “hidden” edges with low weights between individual papers having the same color and belonging to the same survey paper, which led to their grouping (we removed these hidden edges in the final drawing). The Fruchterman and Reingold 53 force-directed layout algorithm was used for the network visualization together with the “no overlap” option (provided by the Gephi 51 tool) to minimize crossings. The results mainly work as a confirmation of the patterns noticed before with the topic analysis, since the figure shows two large-scale communities: those closely related to DL (Figure 5(a)) and the rest of the surveys (Figure 5(b)). These two large-scale communities are bridged by the survey of Liu et al. 33 (related to General ML Models) since General ML Models also partly include DL as a subcategory. The DL community (a) is mostly homogeneous, while community (b) can be split into the top-left group (b.1), related to IML with “orange” and “light purple” color-encoded papers referring to Topics 2 and 7; and (b.2) in the bottom-left corner, where clustering, projections, and DR are the major subjects (Topics 3, 6, and 9).
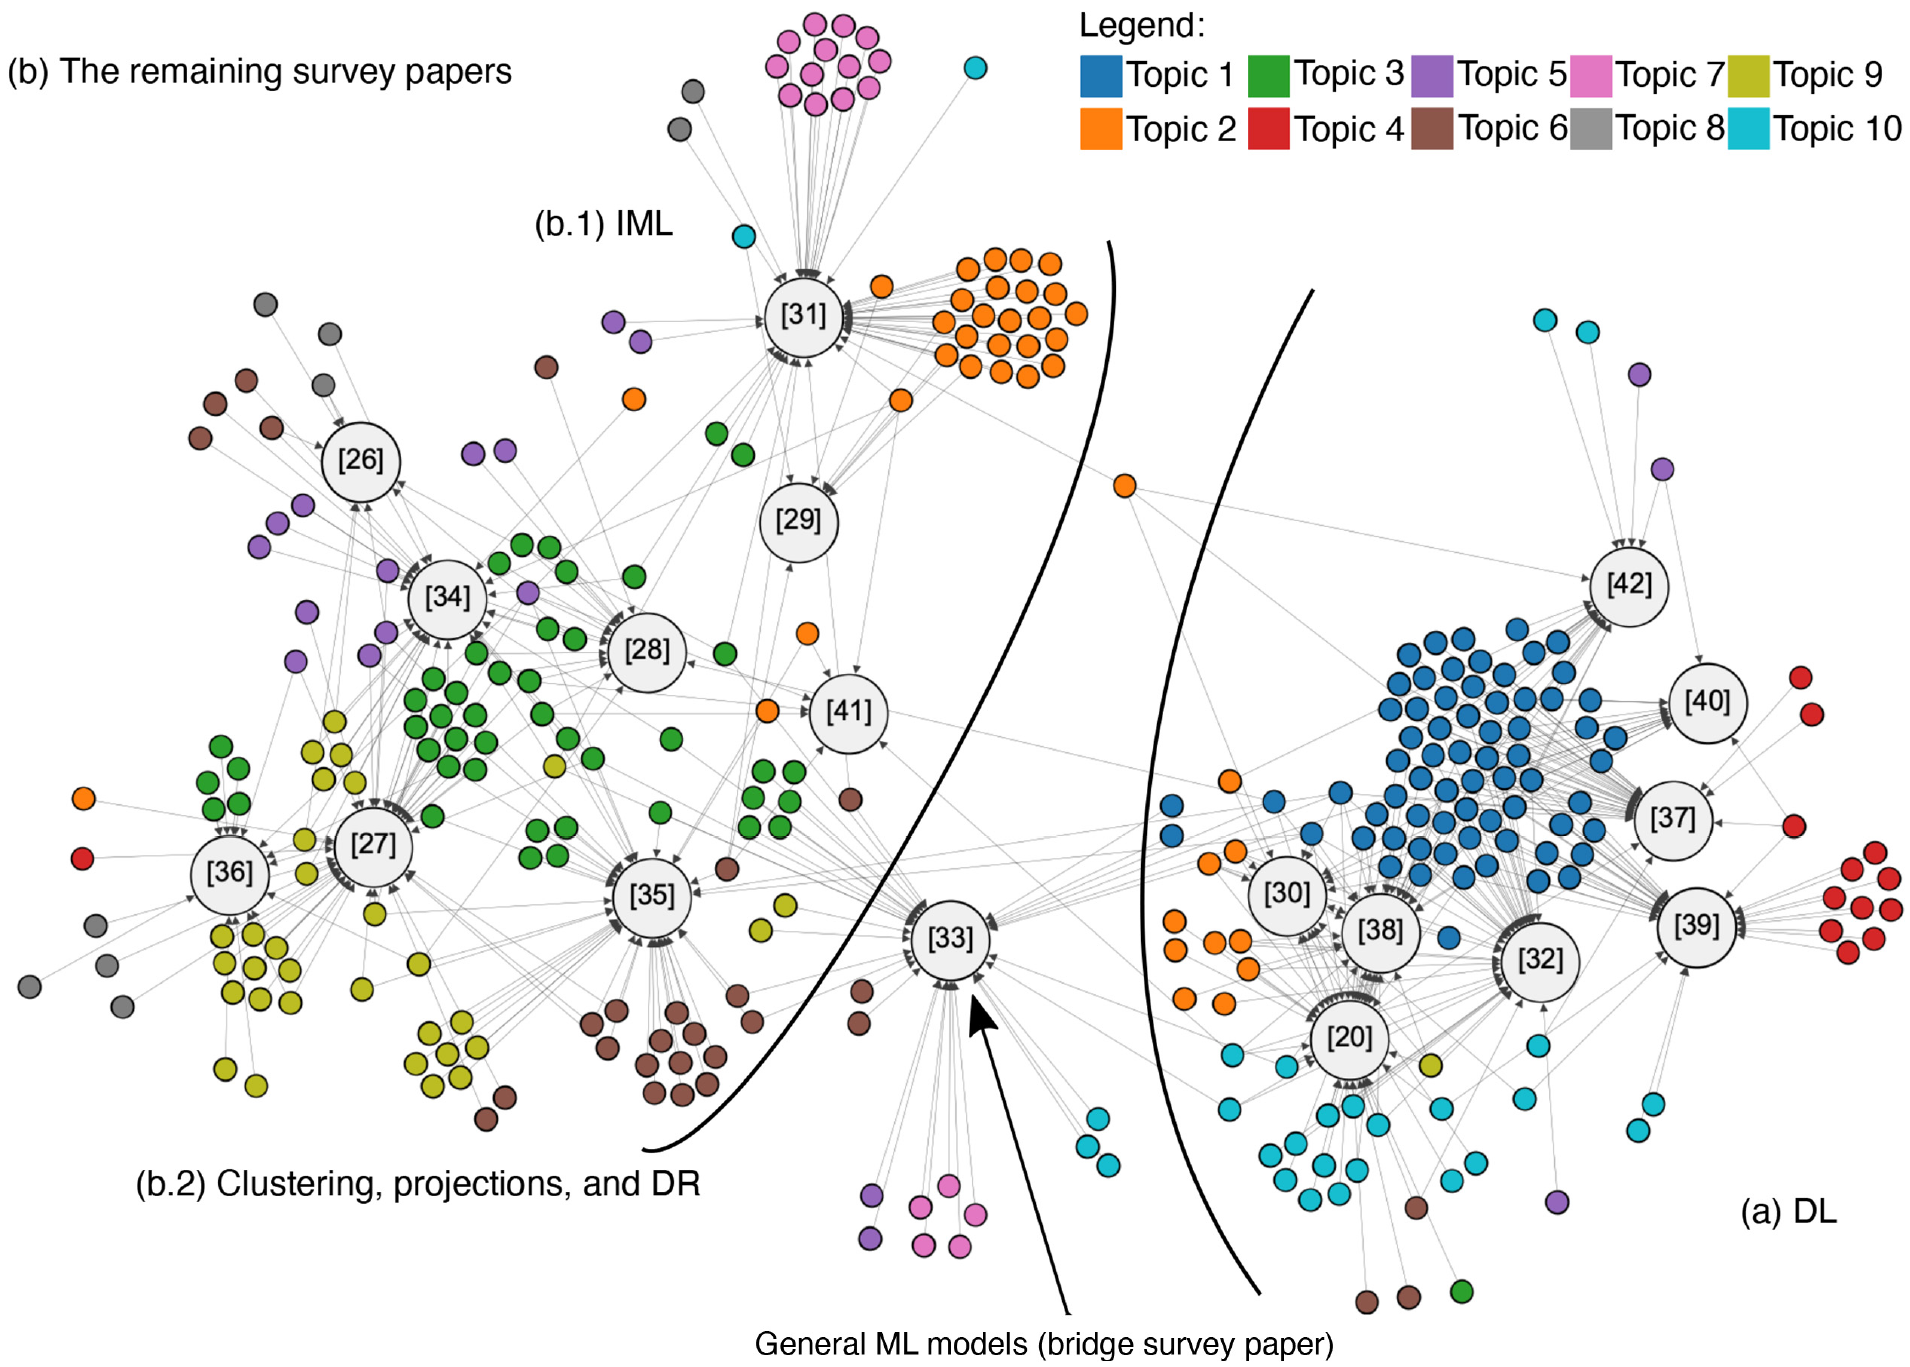
Network visualization showing the connections between individual papers and survey papers. On top of that, we mapped the topics using the same color-encoding as introduced before (see the legend). The node size is different for the survey papers and the individual papers, with the former being larger than the latter. Inside each survey node, we included its reference to the bibliography. (a) DL. (b) The remaining survey papers: (b.1) IML, (b.2): clustering, projections, and DR.
Discussion and challenges
Discussion
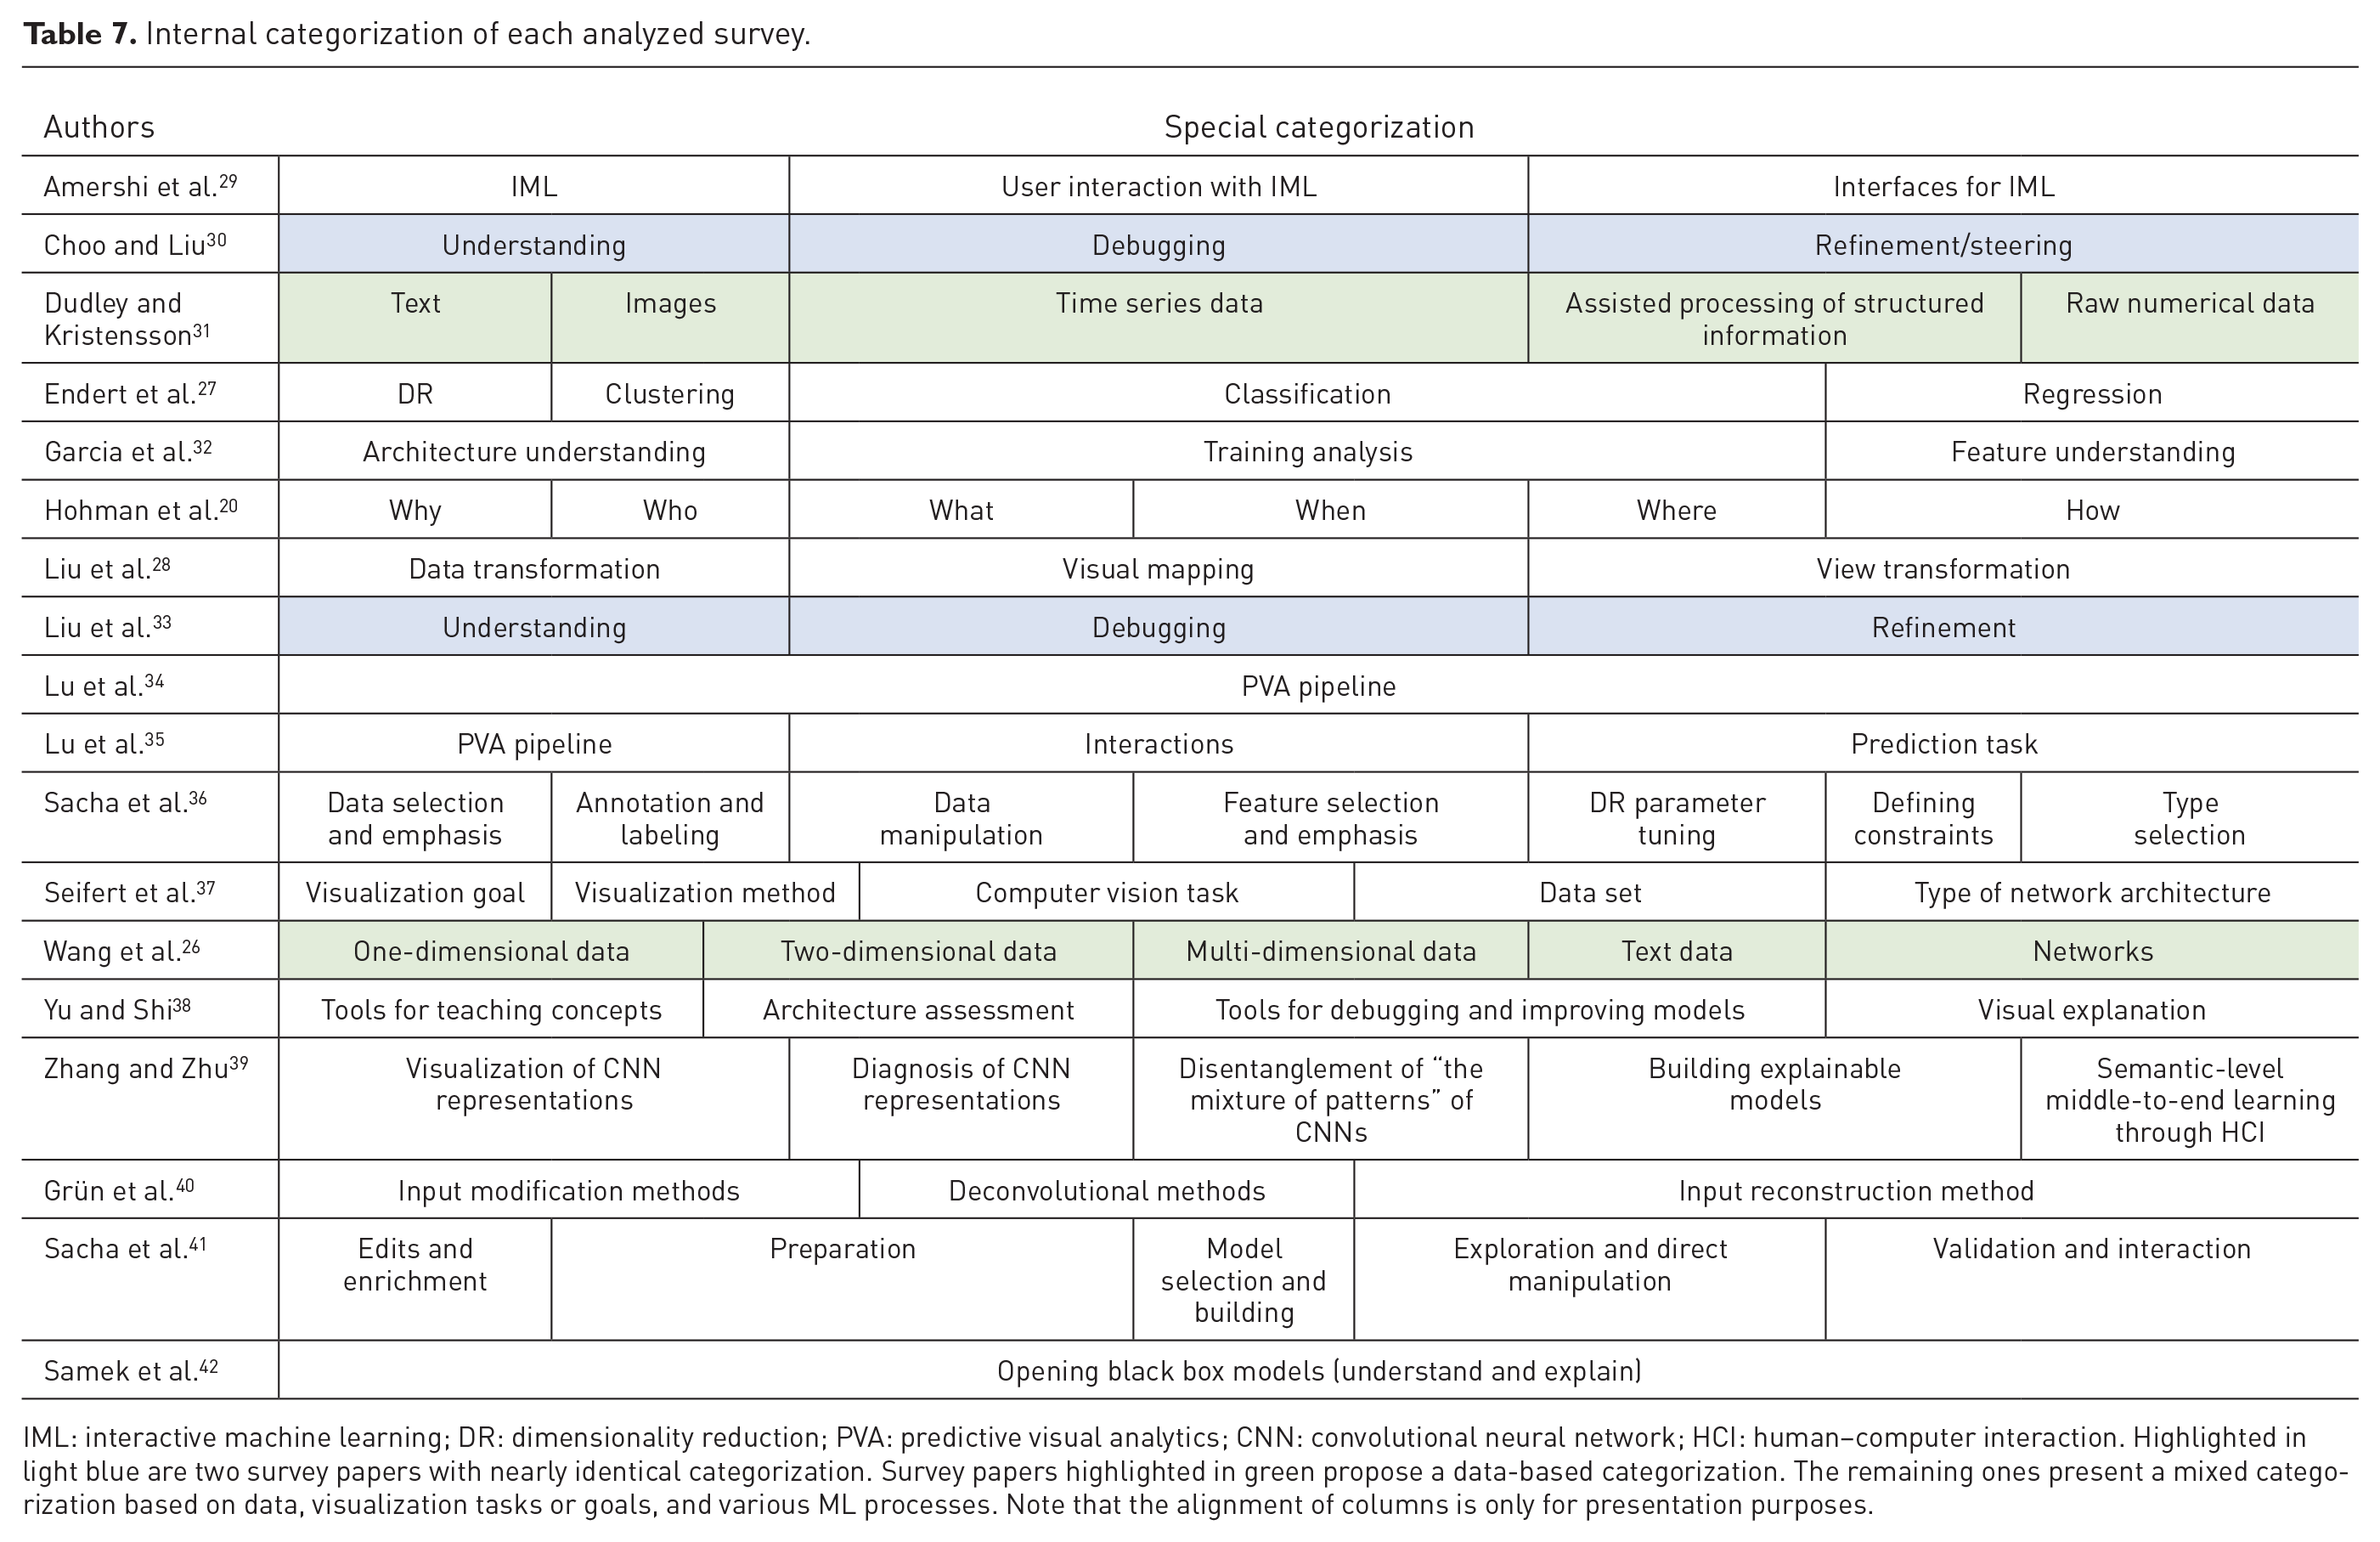
Similar to our work, many survey authors develop and use some sort of categorization or taxonomy to aid the analysis of the underlying papers. Table 7 contains a summary of such categories for the eight survey papers presented in this SoS. By analyzing all these survey papers, we can infer that most of them are related to particular ML models. For example, in DL, they deal mostly with CNNs and RNNs with most of the concepts not easily extendable for additional models, such as deep generative networks (DGNs). Many survey papers include future work and/or discussion paragraphs that describe the possibility of expanding parts of the visualization tools in order to be generalizable, or even the entire visualization tool being applied to different NNs. However, little practical effort has been accomplished in that area.
Internal categorization of each analyzed survey.
IML: interactive machine learning; DR: dimensionality reduction; PVA: predictive visual analytics; CNN: convolutional neural network; HCI: human–computer interaction.
Highlighted in light blue are two survey papers with nearly identical categorization. Survey papers highlighted in green propose a data-based categorization. The remaining ones present a mixed categorization based on data, visualization tasks or goals, and various ML processes. Note that the alignment of columns is only for presentation purposes.
We identified two major groups of survey papers within our focus: the first type consists of standard CT surveys following some kind of categorization/taxonomy and the second type includes the more analysis-based AN surveys, where the authors usually analyze a smaller portion of papers for deriving more detailed findings (see Table 5). Most of the recent surveys are about a specific subtopic of ML (especially on DL). PVA is currently a very popular subfield, having already spawned two survey papers. One possible gap for new surveys is the subject of ML models in general which only had three survey papers so far. But from our experience, several new visualization tools have been developed within the subject during the past 2 years.
From Table 7, we can detect a pattern related to the frequent occurrences of two categories: the first is “understanding” and the second is “interaction.” These two categories are usually present as classification terms in survey papers. From the same table, we also observe that each survey paper uses a different approach to categorize the papers. If the survey papers would provide a more unified way to categorize their papers, it might have been much easier to interpret and compare them. But at the same time, they also would lose the individual viewing angles that they provide when using categorizations specifically adapted to their focus. From the established scenarios (i.e. categorization/taxonomy), we believe that the one proposed by Sacha et al. 36 (e.g. data selection, labeling, and data manipulation) better resembles the visualization/perception approach that researchers in the visualization community would easily relate to. Therefore, we consider the seven scenarios that they proposed as one useful technique to follow when there is a need for categorizing papers in the VA area for interpretable ML models.
With respect to the performed topic analyses, we have to point out that Topics 1, 2, 3, and 9 (even though they are very diverse) seem to be, in general, the most targeted by the InfoVis community. Moreover, by combining the information that can be retrieved from Figures 4 and 5, we can observe that the bridge survey paper by Liu et al. 33 has only one main topic, which is Topic 3, and includes several others in smaller percentages. These topics are omitted because they capture less than 14% of the entire content of the survey paper. The other possible scenario is that a survey is intensely focused only on a single topic, such as Grün et al., 40 which solely includes Topic 1 (see Figure 4). Overall, the analyzed survey papers are rather focused on their own specific topics and, as a result, the “Topic analysis” section can be used as a means for readers to connect the knowledge acquired from the “In-depth analysis” section to specific topics of high interest for them.
To be consistent with our methodology, we clarify some limitations for the following two papers. For the Sacha et al. 36 survey, we chose a subset of 15 papers that are actually fully referenced, instead of the 58 papers mentioned in their own table. The papers in the table are not fully referenced and were hard to identify and to track, as they are listed in a short form using only the name of the first author, the venue, and the year of publication. In the case of Lu et al., 35 we used the PVA browser that they provided that contains more references than the actual publication.
As indicated previously, we found and analyzed surveys within the time range of 2016–2018 (with only one exception from 2014). Even though the sample of survey papers might be considered small, this represents the analysis of a total of 520 papers. Our results indicate that the research subject of interpretable and explainable ML is still growing (cf. Tables 2 and 4) and has the potential to evolve even further. Regarding the methodological aspects, we conclude that survey papers could be more concrete and precise in the description of their methods, since only 7 out of the 18 survey papers followed a clear and objective methodology. Moreover, some venues are not covered by any survey paper, such as ACM IUI. We believe that in the future, more venues will accept survey papers and might include specific survey tracks. As a result, an increase in publications of ML-related survey papers could occur. Nevertheless, by examining our outcomes—although visualization and ML communities intersect in this topic of interpretable ML—only a few visualization papers are published in dedicated ML journals and conferences, which points to opportunities for more collaborations between the two communities in the future.
Finally, other lessons learned during the writing of this work are that (a) overview tables are very convenient, since a researcher can easily identify important papers based on their categorization, and (b) having an interactive online browser that hosts the taxonomy of the surveyed papers adds to the overall usability of the survey, enabling users to interact and filter the papers according to their wishes and interests. These insights should be useful for authors interested in writing survey papers in related areas.
Research opportunities
We have gathered and summarized in Table 8 the open challenges and opportunities described in the analyzed survey papers. These open challenges are tagged based on our differentiation between interpretable and explainable ML:
13
from uninterpretable to interpretable ML models, that is, before interpretation
Research opportunities for interpretable ML models.
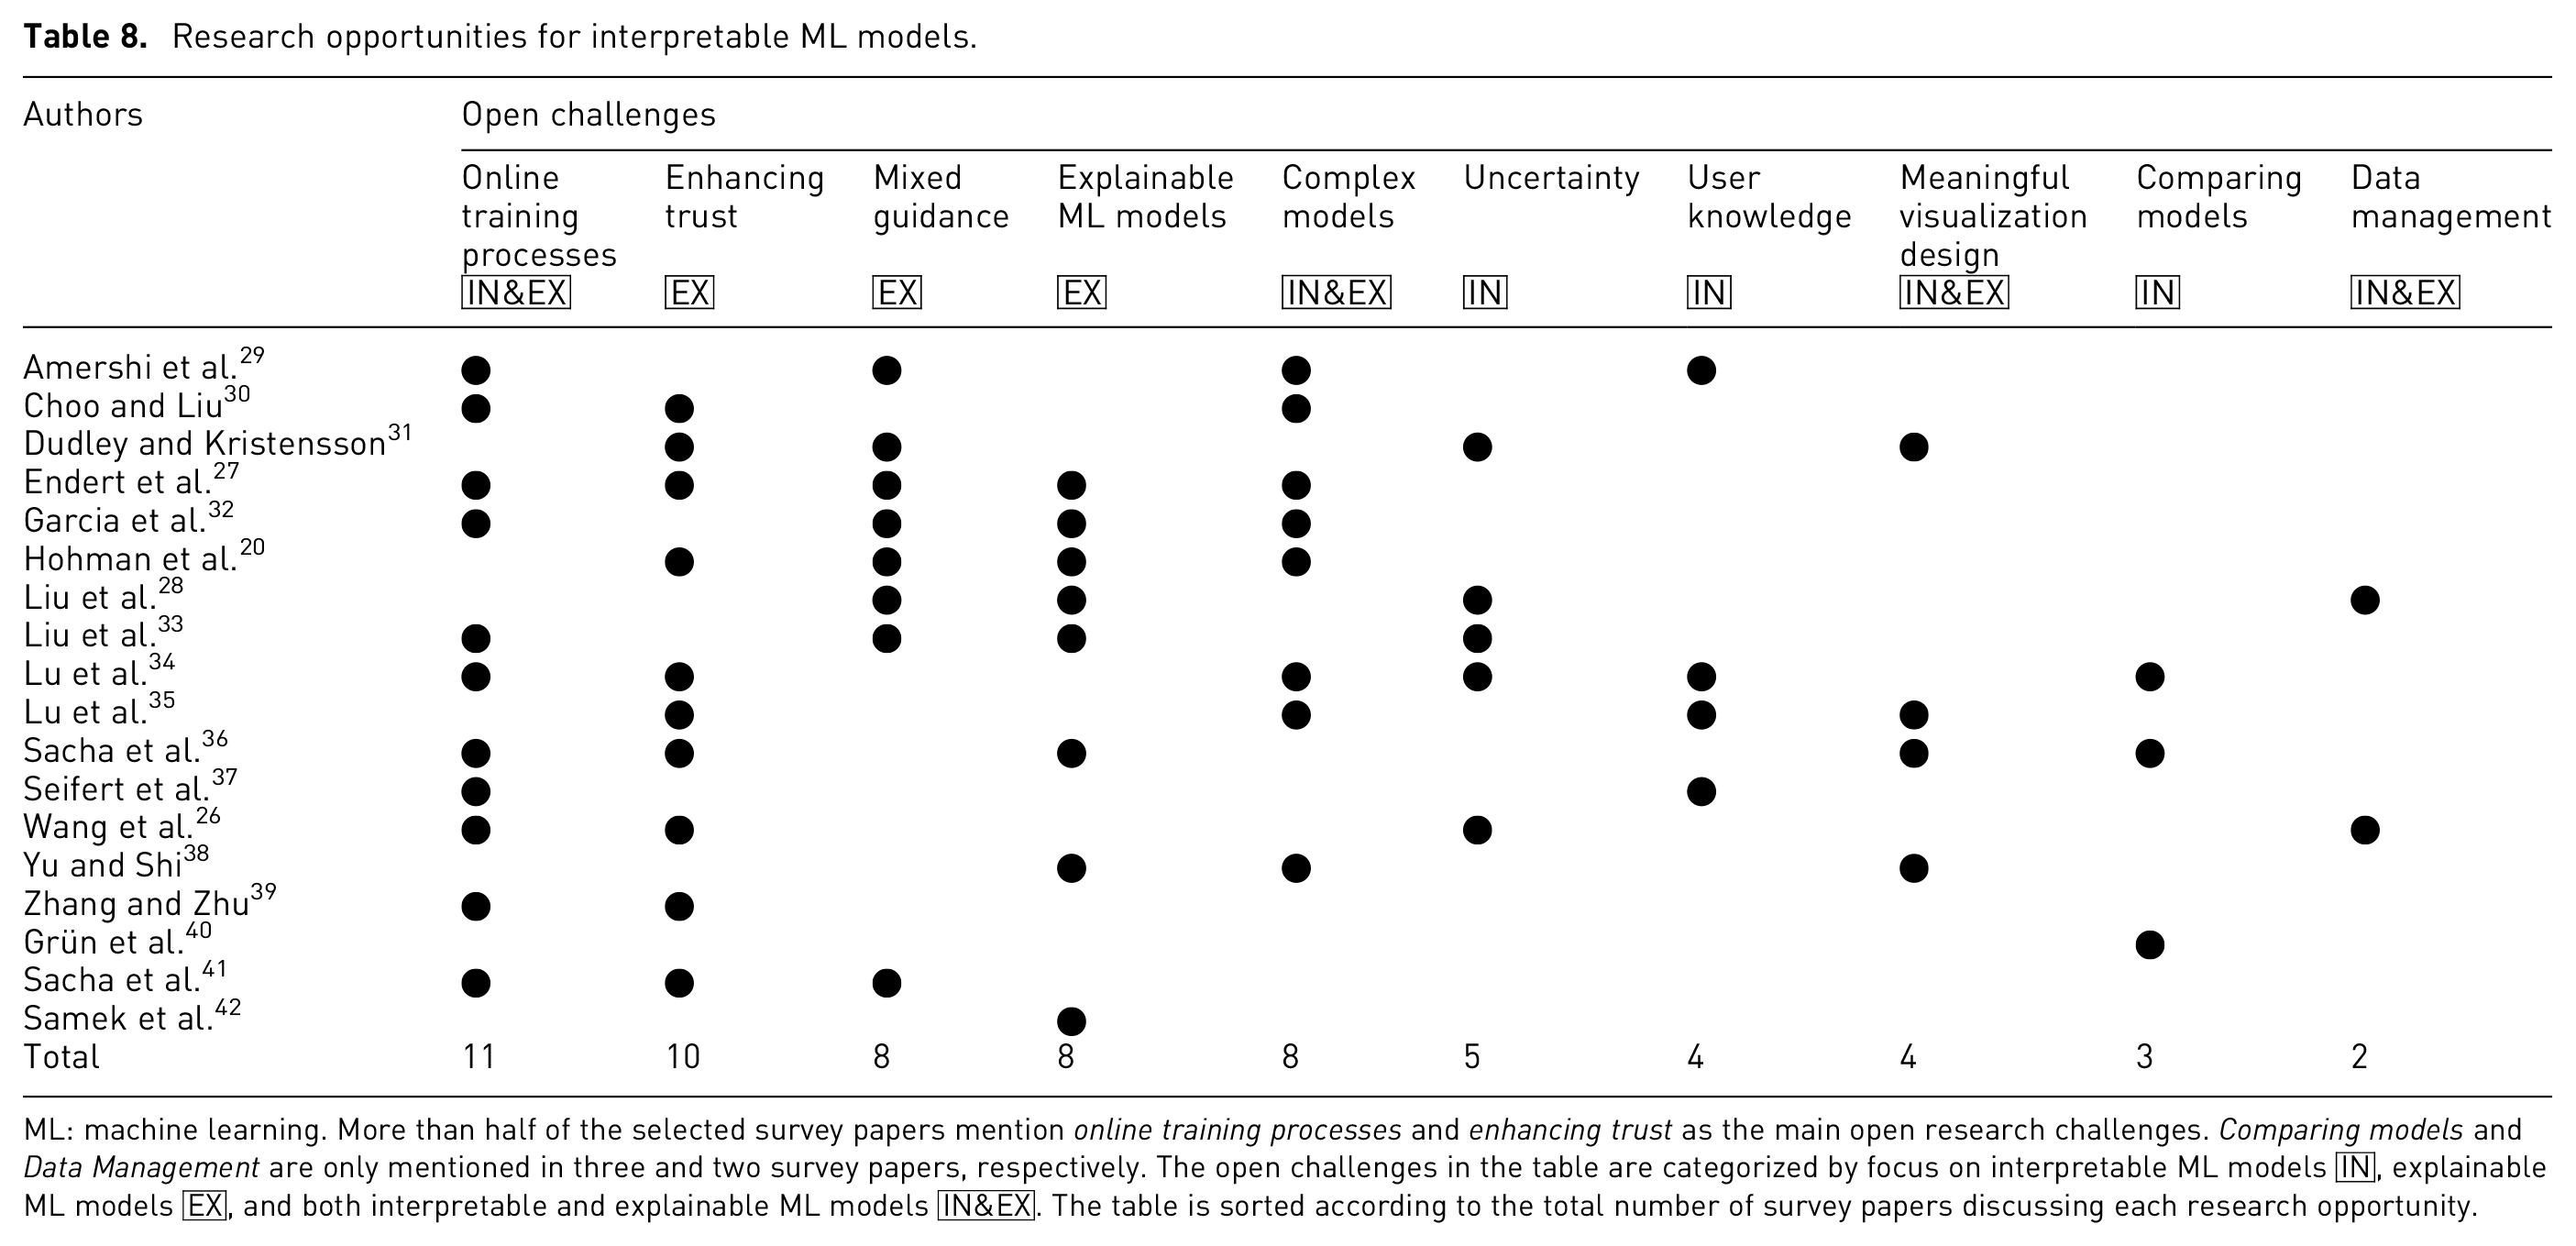
ML: machine learning.
More than half of the selected survey papers mention online training processes and enhancing trust as the main open research challenges. Comparing models and Data Management are only mentioned in three and two survey papers, respectively. The open challenges in the table are categorized by focus on interpretable ML models
Online training processes IN&EX
The majority of survey papers (11 out of 18) suggest real-time online training processes as a key future challenge. The reason for proposing this challenge is that existing approaches mostly analyze the results of ML techniques only, while skipping the possibility of an interactive training process for improving trust in the results. To exemplify this challenge, we might think of an expert who trains a NN which might take hours to finish. Even though the expert could use a visualization tool to better understand the final results, a visualization approach supporting the online training process could aid to find preliminary insights and subsequently help to steer the training process, and thus help to minimize the spent time and resources.
Enhancing trust EX
Another core challenge is the need to enhance the trust in the ML algorithms and models (10 out of 18). Evaluation is still a challenge that requires special consideration from the InfoVis community. Several survey papers state that trust and better validation of models must be researched.27,34,39 Trust issues are one of the most significant problems that ML faces, and visualization has proven to be useful in this regard.20,27 Achieving this goal requires the combination of both interactive visualizations and traditional quantitative metrics combined into visualization tools/systems, thus creating an “ecosystem” which enables expert users to control and monitor the ML models at different levels. For instance, a tool/system visualizes how standard validation metrics (e.g. accuracy, precision, or recall) of classifiers perform in each execution step of an ML algorithm and permits experts to perceive deviating behaviors of the ML model. As a result, it may act by “injecting” their knowledge into the process and supporting intervention when it is necessary.
Mixed guidance EX
To accomplish a “healthy” relationship between humans and machines with the “correct” amount of guidance from machines to humans (and vice versa) is not a trivial task (8 out of 18). From the machine perspective, the ML community has produced systems that play a critical role, for instance, by recommending the best views and actions in the progressive analysis process.54–58 From the human perspective, the InfoVis community developed several techniques where the user is the first-class citizen when adjusting and enhancing the performance outcomes. There is a potential trouble spot between the directions that the system provides and the user’s personal opinion. A closely related concept which falls into this category is hyperparameter exploration, suggested for example as a future challenge by Garcia et al. 32 It is related to how a machine can compute the best parameters to allow the users to fine-tune an ML model in general or, for instance, the training process of a DL model. Extracting and visualizing interaction data that occur between humans and machines can be an initial step to address this research problem. 27 Keeping track of the history of such interactions, empowering the user to undo specific actions (known as “what-if”-hypotheses testing) and examining these events with interactive visualizations are other examples to solve this challenge.59–61
Explainable ML models EX
The three challenges mentioned above are directly related to the demand for more explainable ML algorithms (8 out of 18). In order to analyze the hidden parts of an ML algorithm, it is essential to uncover—with the help of appropriate visualizations—how those models actually work. However, information that might help humans to reach better results is usually ignored and, as a consequence, the desired performance is not achieved. The fundamental challenge is to compose a standardized way of explaining each ML model properly.32,33 One possible goal is to identify those parts of the ML model’s structure that represent crucial operations and to tweak them accordingly (using interactive visualizations) for increasing the performance in each iteration.62–65
Complex models IN&EX
The sheer complexity of the available ML models is another issue that emerged during the past years, since the models have become more and more massive, and sometimes inefficient (8 out of 18). More complex problems demand more complex solutions, sometimes with the use of a mixture of different models. The visualization of such scenarios is hard, since several models must be considered simultaneously. Another challenge in this context is how to properly scale visualization tools to work for more substantial and complex models. For instance, RNNs and CNNs are two basic DL architectures that have been visualized in many scenarios according to Choo and Liu, 30 Hohman et al., 20 Lu et al., 34 and Lu et al. 35 However, there are multiple alternatives, such as ResNet 66 and DenseNet 67 for image recognition, that have not (to the best of our knowledge) been visualized by or drawn any attention from visualization researchers. Therefore, the use of visualization to make such complex ML models better understandable and their results better explainable will undoubtedly be further developed in the future.
Uncertainty IN
ML models already include inherent uncertainties, and when humans interact with them, this can improve their performance but also introduce new uncertainties into the analysis process. For example, if the system displays erroneous information to users, then fine-tuning a model does not necessarily lead to new outperforming and trusted results. On the contrary, users’ refinement attempts might increase bias and result in overfitting.31,34,35 Effective ways to quantify and measure this uncertainty are still open research questions. Uncertainty may be expressed in different ways and can appear in every stage of an ML model’s pipeline, which makes it even harder to solve with a single solution (5 out of 18). A way to move forward on this challenge is to find ways to quantify uncertainty at the diverse levels, then add a new visualization layer explicitly addressing this problem, and “throw the ball” to the experts to determine where and how they should respond.31,34,58,68,69
User knowledge IN
Users who interact with ML models through InfoVis tools belong to various groups, such as domain experts, non-experts, or developers. It is currently an important challenge for visualization tools to take advantage of the previous knowledge that users have, and the adaptation of visualization tools to different user backgrounds can benefit multiple stages of ML models’ pipelines, such as—but not only restricted to—the online training processes of the ML models (4 out of 18).35,70 For instance, in a scenario of predicting a company’s earnings, factors like the user’s bias or opinion that might be in favor or against the company can lead to different analysis outcomes. The intrinsic burdens of this challenge stem from such hard-to-grasp factors. We have to establish processes in order to digitize and measure prior users’ knowledge for making use of this knowledge in predictive models. 35
Meaningful visualization design IN&EX
A large number of visualization techniques already exist for making ML more interpretable, and concurrently, many user interactions can be mapped to various computations in the backend. But constantly mapping individual user inputs to a potentially large number of complex (and expensive) actions, while covering the whole VA pipeline for ML, still remains an open challenge. Moreover, tasks related to the evaluation of user interfaces for IML often demand differentiation from traditional user interfaces and could possibly support additional features, such as allowing workflow analysis and cooperation among analysts. In consequence, developers and researchers have to carefully think about how to choose the most suitable interactions in order to produce more meaningful visualization designs (4 out of 18).
Comparing models IN
Different ML models usually perform better or worse in different data sets or applications. By comparing different ML techniques, we can recognize which of those perform better than others in specific situations, and consequently, combine them in particular orders that could lead to better analysis results (3 out of 18). For example, if we apply a DL algorithm with a specific architecture, instantiate many models/classifiers from it (all with various hyperparameters), and execute them in different iterations (known as epochs for DL), then we can summarize the results in one simple plot and observe the fluctuations in the performances of each one during every iteration. 40
Data management IN&EX
Data management is hardly in the focus of published visualization papers. Nevertheless, the growing complexity and volume of the data demand visualization tools that provide flexible data management approaches. Empowering the VA process with integrated interfaces for querying databases can be considered a step toward addressing those challenges. Moreover, we lack visualization tools that directly manipulate data at a pre-processing stage, for example, by labeling unlabeled data or removing incomplete data that is unnecessary for supervised ML (2 out of 18).
Conclusion
This article is a result of our efforts to gain insight into the state of the art in interpretable ML using visualization, originally with the aim of writing a survey paper on the topic. Once we were aware of the number of existing survey papers, the wide range of covered subtopics, and the heterogeneous nature of their methodologies, it became clear that a meta-analysis of these surveys was necessary to help readers taking their first steps into the area. In this SoS paper, we present the results of such a meta-analysis, consisting of both an overview and a deeper analysis of the existing surveys on the topic of interpreting ML with the help of visualization.
We present several contributions that are potentially interesting to early-stage researchers () in the area, as well as to senior researchers () in visualization and experts of ML. Our first contribution is a general overview of the surveys, accompanied by a collection of aggregated quantitative information about the survey papers. It includes data about targeted publication venues, number of unique papers referenced in each survey, the timeline of publications, and topics covered by them. The second contribution is a categorization of the surveys into groups depending on their focus and scope, along with a description of each survey paper within the context of this categorization, helping readers to focus only on their subject of choice. Finally, we used the insights and new information we gathered during this process in order to identify gaps in the literature that will drive our future endeavors in the research on interpretable and explainable ML models through VA (cf. Table 8 for a summary), as well as gaps in the existence of related survey papers (cf. the “Discussion and challenges” section and Table 5). We hope that, with this report, we will manage to provide the same possibility for our readers.
Footnotes
Acknowledgements
The authors are thankful to Kostiantyn Kucher for proofreading this article and his support in the topic analyses. The authors also thank the anonymous reviewers for their constructive feedback.
Funding
The author(s) received no financial support for the research, authorship, and/or publication of this article.