
Abstract
Visual elicitation methods, such as diagramming, are growing in their use with vulnerable populations, trauma-informed research, and social work studies where the use of traditional oral interviews alone may be lacking in their ability to increase access to different areas of human consciousness. The adoption and designing of innovative diagramming and visual methods have the potential to push the boundaries of data collection in understanding the experiences of forced migrants. However, scholars have seldom adopted this method in forced migration research. In this article, the authors explore three diagramming methods-timelines, convoy circles, and ecomaps-to highlight the possibilities of their use for social work research with forced migrants. The benefits of utilising these methods in support of the unique characteristics and challenges of forced migrants are also discussed. The article concludes by identifying several limitations while advocating for the adoption and documentation of the use of diagramming in studies with forced migrants.
Introduction
Graphics predate language and are central to the human condition, profoundly affecting our identities, memories, feelings, and ambitions (Spencer, 2011). Over the last century, graphics have primarily been used in positivist and post-positivist research for data collection, analysis and findings presentation (Umoquit, 2013); however, in recent decades, they have become essential tools for qualitative or inquiry-based research (Crilly et al., 2006). Qualitative researchers have widely used graphic methods such as photography, drawing, and graphic illustration (Cleland and MacLeod, 2021; Sitter and Mitchell, 2020; Edmondson, 2018; Ekoh et al., 2022a; Ekoh et al., 2023), as well as diagrams which are art-based graphic representations to explore complex experiences, and different relationships between parts and concepts (Umoquit et al., 2011). Mayoux (2003) noted that diagrams are also useful qualitative data collection methods in situations where cross-cultural language barriers or low levels of education limit verbal communications and text. Scherer (2016) further maintains that the significant advantage of diagrams lies in the fact that participants are not pressured to learn to use a camera – with methodologies such as photovoice – or have artistic skills associated with drawings and comics.
Diagrams are also a simple method of graphic elicitation, as their focus is not on aesthetics but on diagram contents (Bagnoli, 2009; Scherer, 2016). By adopting various degrees of abstraction, diagramming can collect data on a range of subject matters from conceptual to physical, which aids in eliciting unique contributions and investigating topics not available by other means (Crilly et al., 2006). Social workers and other behavioural scholars have used diagramming for research with vulnerable and marginalised populations (Patterson et al., 2012), individuals who experienced trauma (Berends, 2011; Umoquit et al., 2008), people with language difficulties, cultural differences and low-level of education (Mayoux, 2003; Umoquit et al., 2013), people with a heightened need for social support (Bravington and King, 2019; McCann and Roberto, 2012), and other groups with similar characteristics and experiences as forced migrants, yet there is scarce evidence of diagramming being used for research with forced migrants.
Guided by an understanding of the plurality of knowledge creation premised in the critical constructivist paradigm, which entails a multiplicity of approaches to truth and knowledge, we advocate that diagramming presents additional innovative data collection methods with forced migrants that can identify critical aspects of understanding experiences beyond approaches that prioritise written or spoken communication. Based on the preceding, the authors describe the application of diagramming as a research method, focusing on understanding the experiences of forced migrants. The article begins with an overview of art-based diagramming within the theoretical context of critical constructivism. The topic of forced migration is then-which includes all forms of forced migration, such as displaced persons, refugees, and asylum seekers-and the challenges that make them apt for diagram elicitation research. What follows is a discussion of how scholars have used three diagramming tools (timelines, ecomaps, convoy circles) for data collection in research and their (diagramming tools) appropriateness for social work research with forced migrants. This article concludes with some limitations of using diagramming for qualitative research and the need to adopt diagramming for research with forced migrants.
Art-based diagramming
As authors, we are informed by the critical constructivist paradigm, which merges constructivism and critical epistemology (Kincheloe, 2005). This view opposes the positivist objectivity and neutral perspective of knowledge but instead seeks to understand how humans construct and interpret knowledge (Schwandt, 2020). Critical constructivism emphasises the decontextualisation of knowledge and pluralistic perspective, encouraging multiple perspectives (Given, 2008). Thus, following the opinion of Keddell (2011), who argued that in critical constructivism, reality can be constructed using language and drawing on the discursive resources of time and place, we stand on the pluralist perspective to knowledge creation and argue for the adoption of more innovative data collection methods that will be more beneficial for both researcher and participants than traditional interviews alone. Critical constructivism encourages finding an alternative way of thinking and creating knowledge, and diagramming as an art-based method provides new ways for individuals like forced migrants to think about their subjective position concerning traditions, social problems and social norms (Loseke and Best, 2003; Milner and O'Byrne, 2002). Diagramming also lends itself to the democratic principle of critical constructivism, which ensures researchers’ self-reflection in relation to social power and allows participants to control the knowledge production process, justification, and ownership of knowledge (Bentley, 2003).
The use of diagramming as a tool for data collection is relatively new and still developing across social work, social science disciplines and healthcare research (Bagnoli, 2009; Umoquit et al., 2013). Nevertheless, it has been found to be as effective and sometimes more suitable for data elicitation with vulnerable groups when compared to verbal interviews and other graphic data collection methods like comics and photography (Scherer, 2016). Diagrams, like other visual data collection methods, can be evocative and increase access to different areas of human consciousness, leading to an investigation into layers of human experiences that are difficult to express in words (Gauntlett, 2007; Prosser and Loxley, 2008). It can also provide a foundation for deeper interaction between the participant and the researcher (Crilly et al., 2006). While diagramming has been applied with significant effect in research with participants of all ages and different demographic features (Berends, 2011; Patterson et al., 2012), its role as a research method is well documented with children to help make the interviewing process concrete and provide memory aid (Husbands, 2020) as well as with participants who may find it difficult expressing themselves verbally due to cultural and language differences (Bagnoli, 2009).
In diagramming, participants can either produce the diagrams independently or co-create them with the researchers (Prosser and Loxley, 2008), and both approaches offer important strengths in data collection. For instance, while participant-produced diagrams have been preferred mainly by researchers (Brandt and De Mortanges, 2011; Simone et al., 2017), several studies indicate that diagrams co-produced by researchers may provide unique insights into data collection, especially for participants needing assistance to function (Meagher-Stewart et al., 2012). In researcher-produced diagrams, some researchers recommend codifying issues identified in preliminary interviews as a sketch that spurs discussion focused on the artefact (Padilla, 1993). Conversely, participant-produced diagrams allow participants more time to reflect on the explored topic (Gauntlett, 2007). Participant-produced diagrams also ensure that participants are integral to the research process as co-creators of knowledge. Participants drawing abilities are of little importance in the use of diagramming for data collection; it is used in an interview for engagement, improved communication, and to ensure that holistic exploration of the research topic is paramount.
Understanding forced migrants and their unique features for diagramming
The degree of choice to leave one’s home or home region has been central in the definitions of forced migrants. Forced migrants are typically involuntarily forced to flee their homes to seek refuge in a haven (Cane and Conaghan, 2009). Although some escape life-threatening situations by their own initiatives, others are driven from their homes by insurgent groups or the government to depopulate or displace the locality’s religious, ethnic, or other composition (Martin, 2010). Various causes of forced migration include conflict, violence, human rights violation, development, natural disasters, repression, disasters, and environmental hazards (UNHCR, 2021). Forced migrants can be grouped into refugees, internally displaced persons, stateless persons, asylum seekers, and victims of trafficking in person.
The demographic population of forced migrants is largely women and children. Many migrate from rural to urban centres, from low-and-middle-income to high-income countries (HelpAge International, 2018), with limited education and training to make a livelihood in their new environment (Habu et al., 2017). Forced migration is also characterised by losses of properties, social networks and support (Ekoh et al., 2022b), traumatic experiences and other mental health challenges (Saxon et al., 2017), health problems and disabilities (Filler et al., 2021), abuse (Human Rights Watch, 2016), limited access to resources (Wachter et al., 2021), poverty and loss of agency (Horn, 2009), language and cultural differences (Burton and Breen, 2002). Some of these characteristics and challenges associated with forced migration make diagramming a valuable tool for data elicitation with forced migrants. Below will be a discussion of how researchers have used different diagramming tools for research with populations with similar demographic features and challenges.
Theorising the need to adopt diagramming for data collection with forced migrants
Diagramming for data collection is well suited for research with forced migrants for several factors. Studies with people who have experienced loss and trauma, changes in social network and support, language difficulties, cultural differences, and loss of agency have adopted diagramming to help participants reflect on their experiences safely through the research (Bagnoli, 2009; Mayoux, 2003). Additionally, given the history of diagramming for research with children, participants with a low level of education, and cultural and language differences (Husbands, 2020; Mayoux, 2003; Umoquit et al., 2013), forced migrants, who essentially embody these characteristics, will benefit from diagramming. Forced migrants also fall within the vulnerable and marginalised population, and Patterson et al. (2012) and Bravington and King (2019) have strongly argued for the use of this method for data collection with such populations because of its strengths in helping participants build resilience and develop agency, while also participating in co-creation of knowledge on their experiences.
Some of the significant diagramming tools used in research with vulnerable populations include timelines which are a chronological representation of people’s experiences, concentric circles and ecomaps which are relational diagrams that represent the nature of people’s social networks and support.
Utilising timelines in research
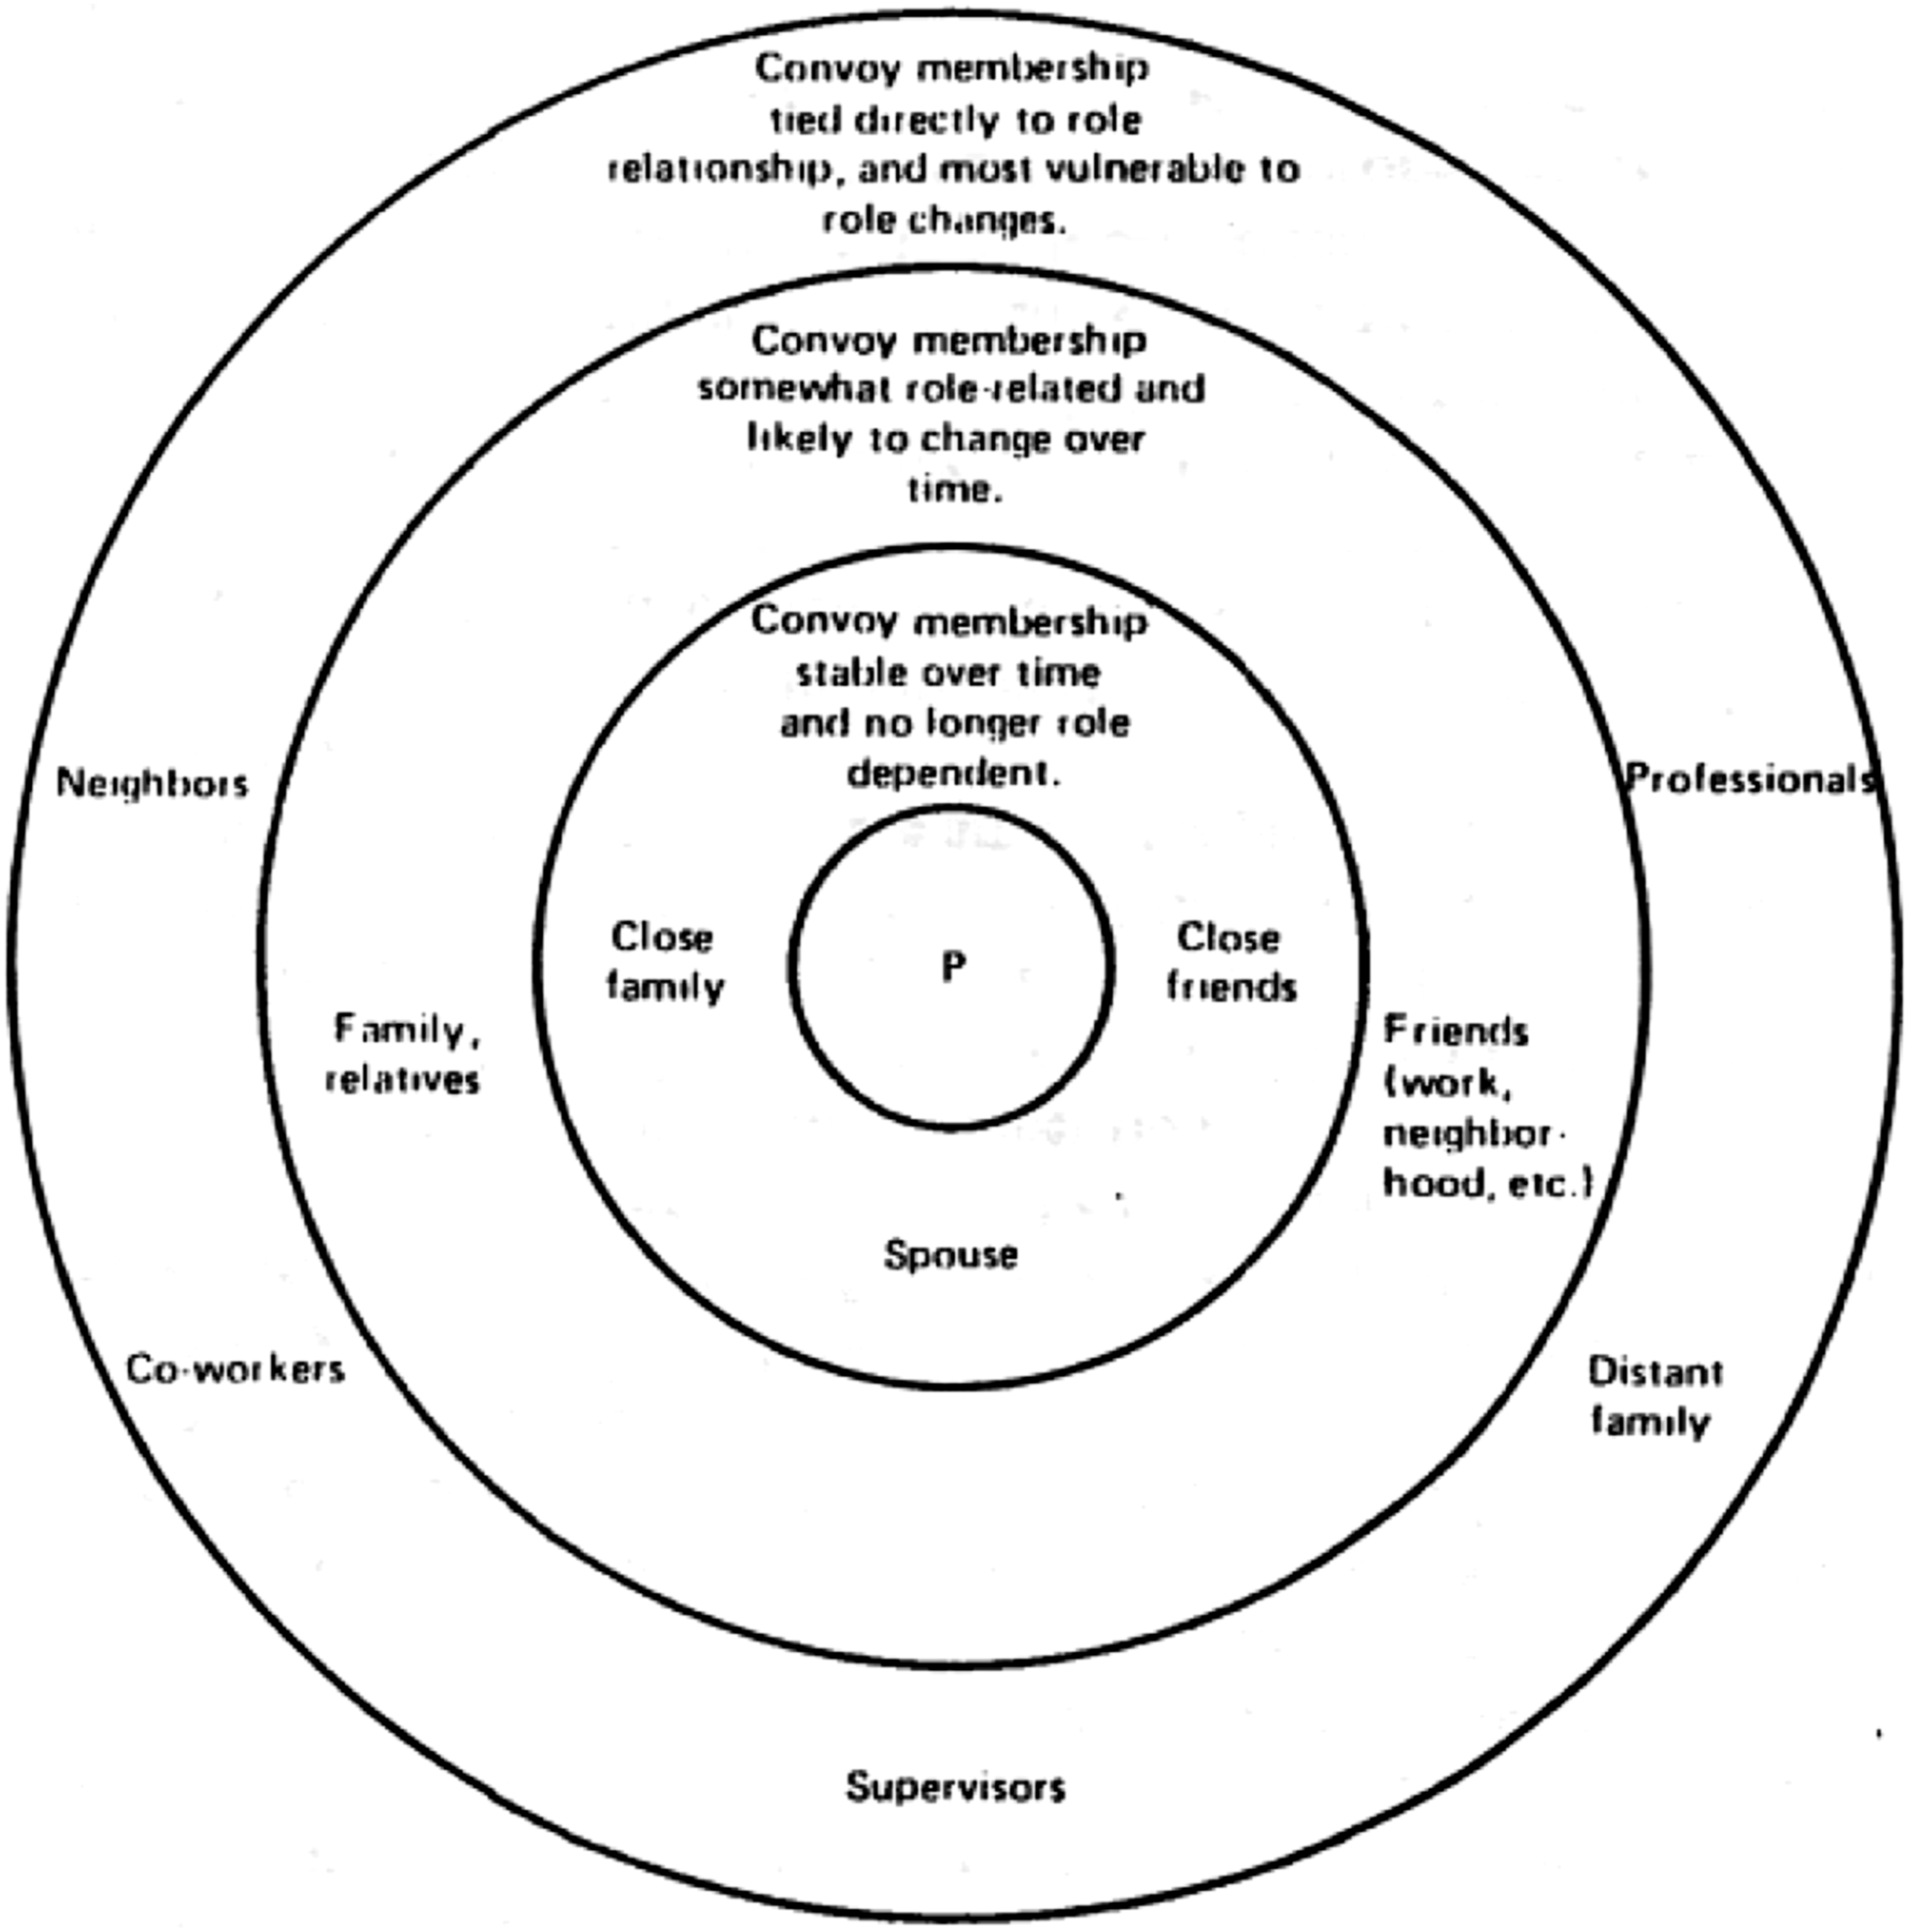
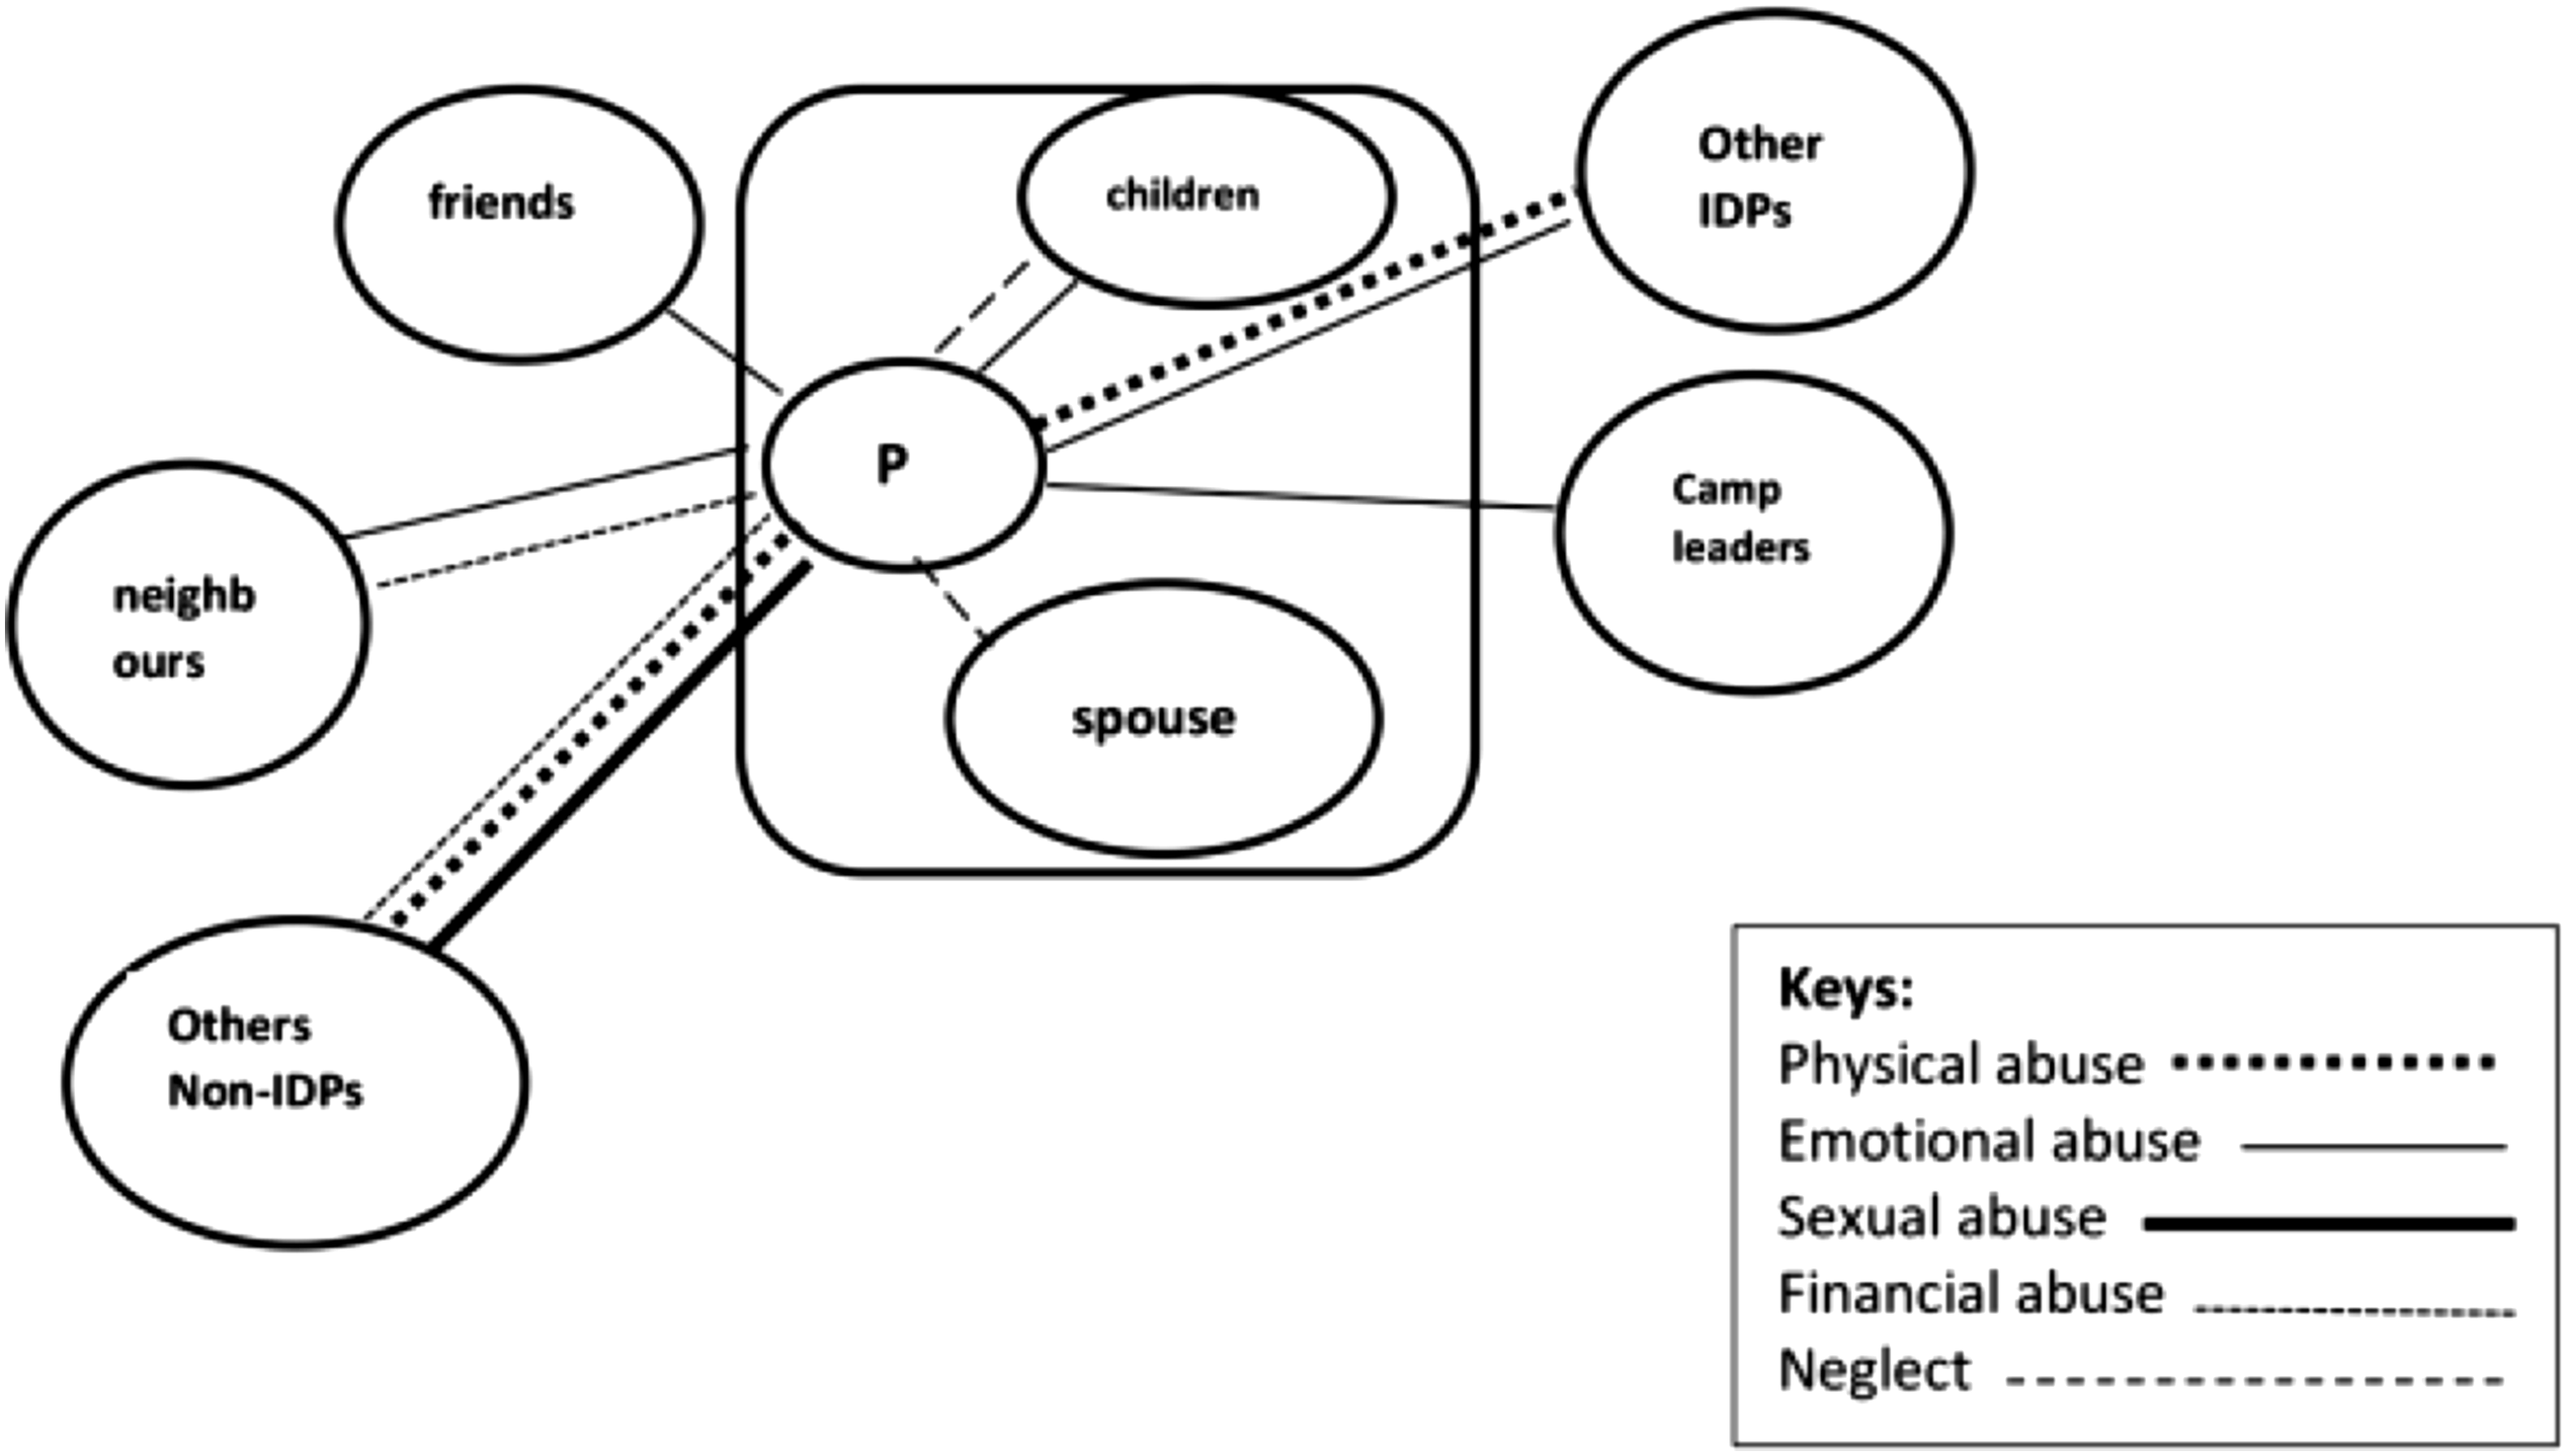
Timelines are visual chronological representations of life events that are significant to a person (Patterson, 2012). They are created from participants’ life experiences and events arranged chronologically with important events highlighted and meanings attached to these events identified (Berends, 2011; Patterson et al., 2012). It is a visual data collection tool that allows participants to reflect on past, present and future events, organise their thoughts and present them chronologically, thereby providing rich data (Mannay, 2016). Timelines are helpful in research with marginalised and vulnerable participants who have experienced traumatic events. It makes data collection more amenable and allows for diversified exploration and representation of life experiences (Berends, 2011; Umoquit et al., 2008). Timelines can be ‘list-like’, describing life events chronologically with or without dates and columns containing brief notes (as shown in figure 1). It can also be continuous-line timelines which involve drawing a line and using spikes, angles, dips, curves, and waves to represent participants’ experiences. A hybrid timeline is a combination of continuous-line and list-like timeline styles. Figures 1–3 Sample of timeline template. Source: Pell et al. (2020). Sample of concentric circle. Source: Kahn and Antonucci (1980). Sample of ecomap. Source: Ekoh et al., 2022c.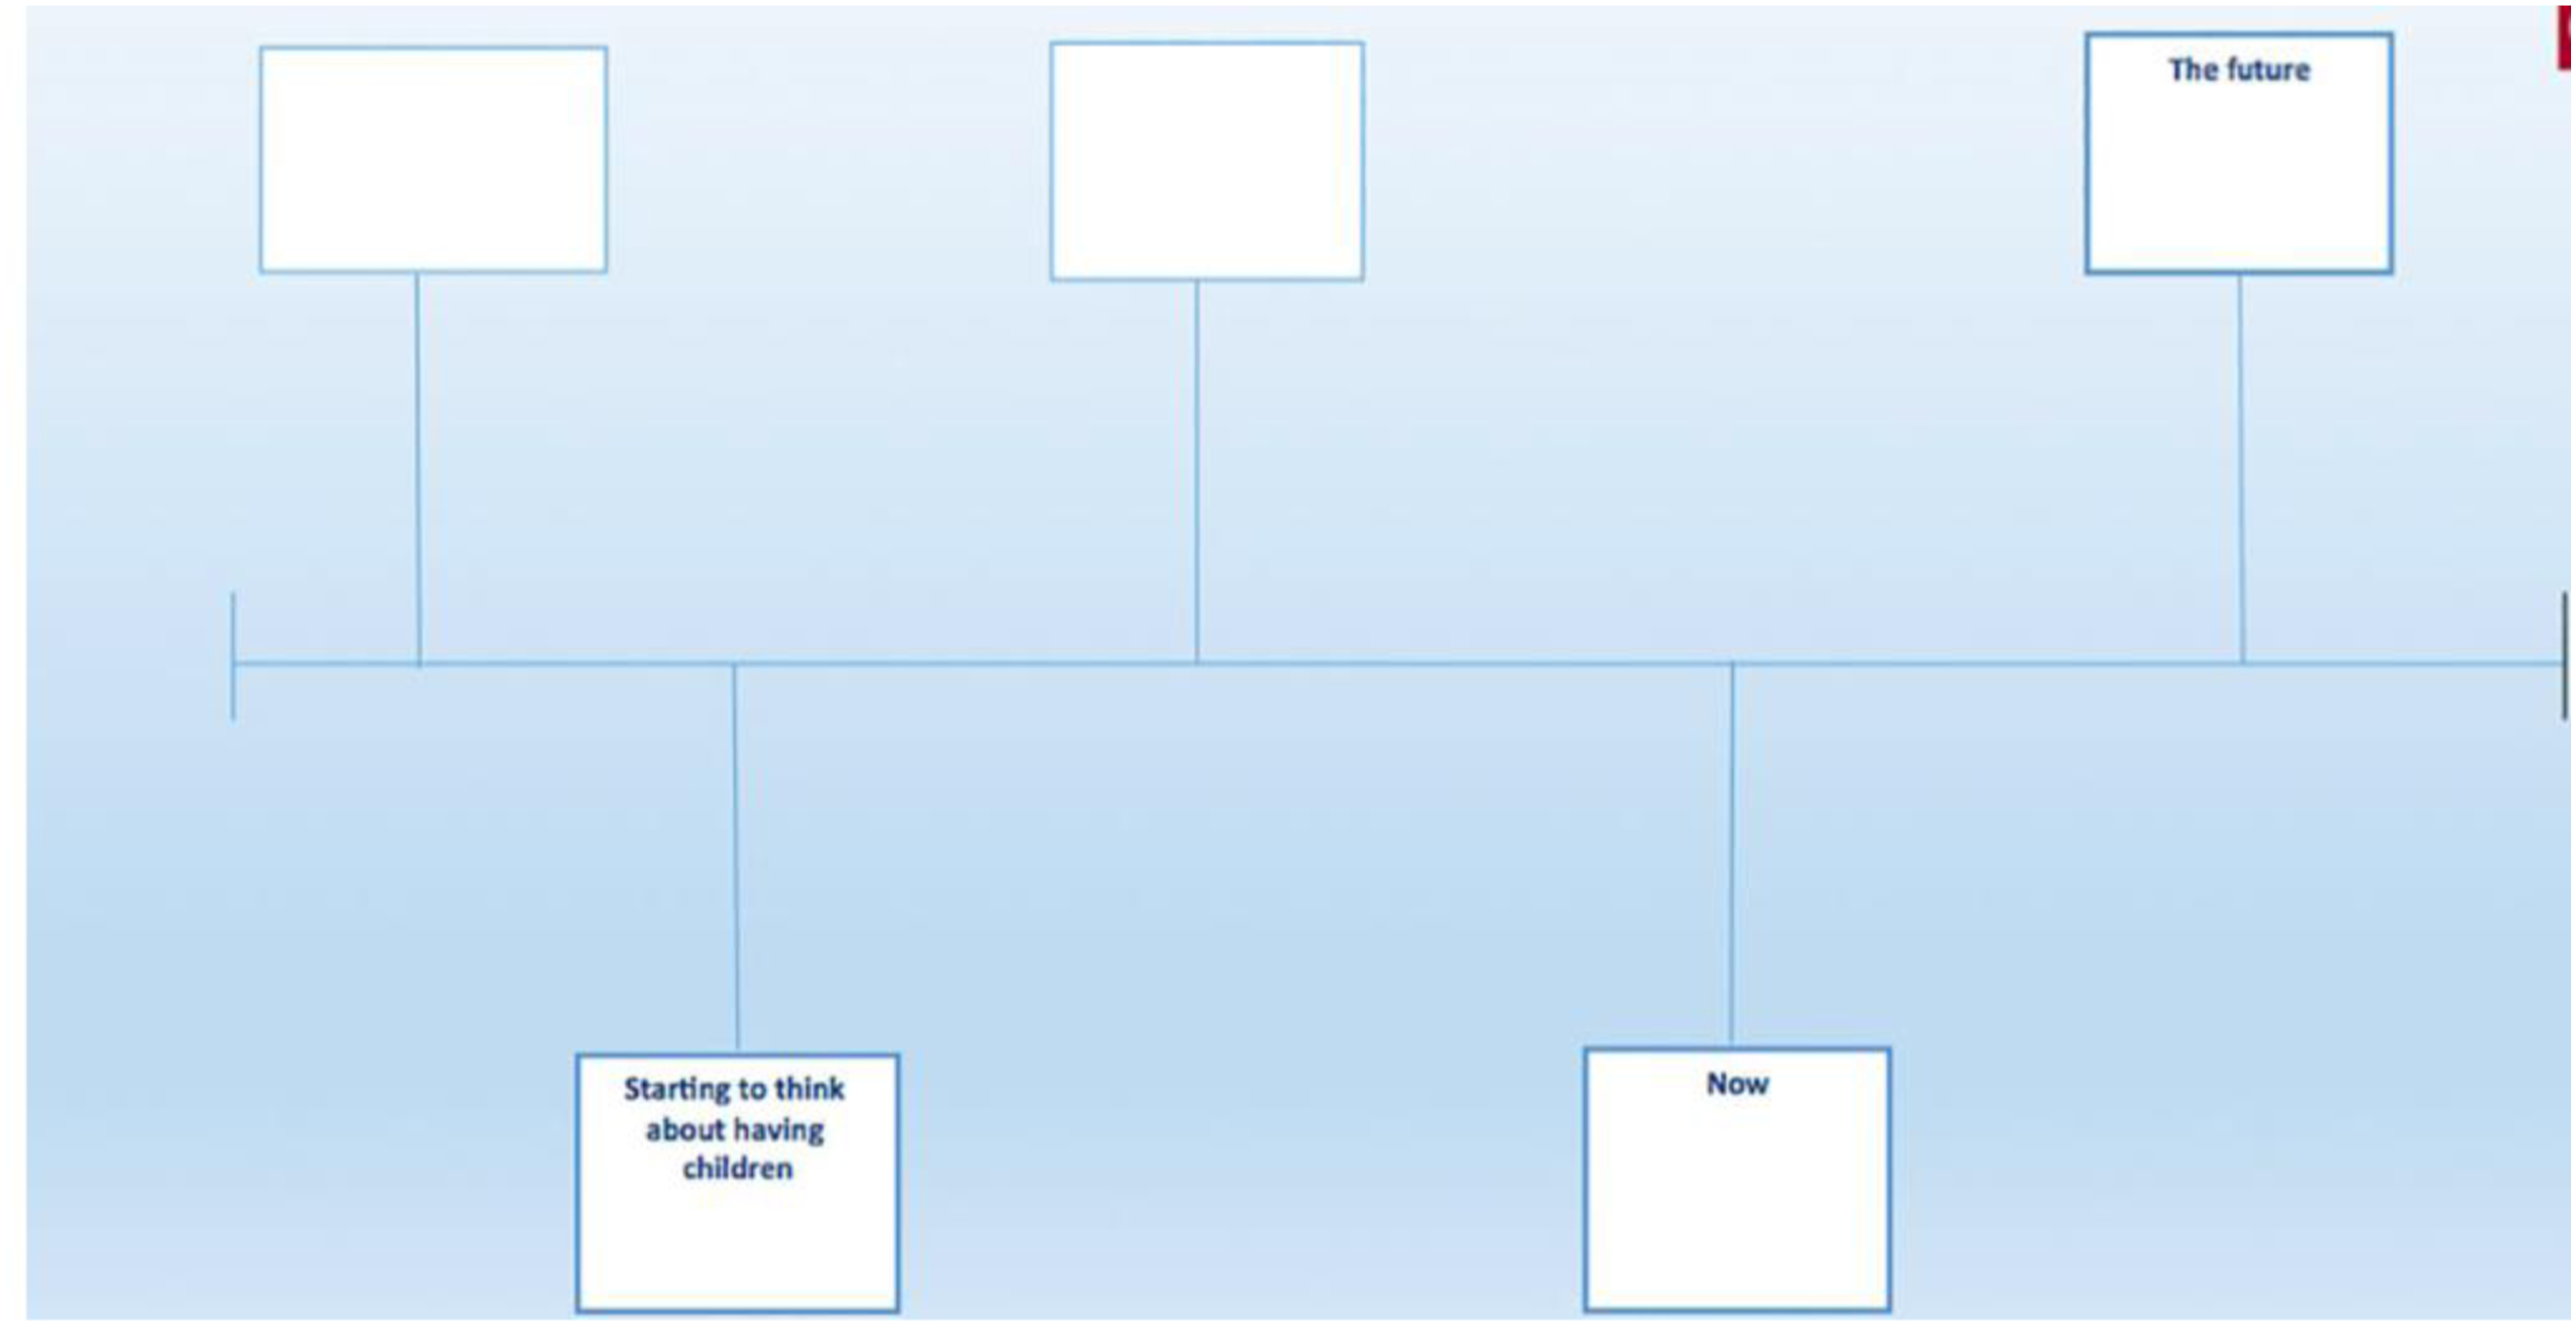
Qualitative researchers have primarily used timelines in face-to-face interviews with vulnerable groups to explore the complexities of participants’ experiences. However, they can also be used with telephone interviews. For example, Pell et al. (2020) used timelines and telephone interviews to study vulnerable women living with autoimmune rheumatic disease. The researchers sent stationery packs to the participants containing a timeline template, paper, emoticon and coloured stickers, coloured pens, an example key of colours to represent different feelings and physical symptoms, and instructions to aid the interview process. This method provided the sampled women a safe space to share their personal and sensitive stories. It gave them a feeling of control over the interview process and the opportunity to reflect on their lived experiences and validate their stories. Telephone interviews were adopted because the participants were hard to reach. However, the sample in this study was not diverse and was highly educated, which made using timelines and telephone interviews easier. Adopting a similar method with a less educated population might pose unprecedented challenges.
Two face-to-face studies by Kolar et al. (2015) and Kolar et al. (2012) adopted timelines and narratives to explore resilience in South Asian immigrant women who experienced domestic violence and street youths who experienced violent victimisation, respectively. Drawing from the power-conscious epistemology, which favours a co-constructive process in research to help participants tell their stories and recognise and legitimise participants’ understandings of resiliency, researchers co-created timelines with participants, and the participants subsequently used the timelines to reflect on and discuss their experiences. Similarly, scholars like Adriansen (2012) and Bremner (2020) argued for the use of timelines for life histories exploration, while Leung (2010) and Sheridan et al. (2011) revealed that timelines are best suited for exploring illustrations or narratives of a person’s journey, highlighting and capturing specific events, its meaning and context.
These characteristics make timelines a salient tool for collecting data on the experiences of forced migrants, from the premigration stage to the postmigration stage, as well as their future aspirations and expectations. Timelines create a space for forced migrants to reflect on their migration journey, significant events, meanings and context of such events, and their expectations for the future. It will also facilitate interaction in a manner that improves the understanding of their experiences as well as navigating the reminiscence-induced stress associated with data collection with vulnerable groups (Goldenberg et al., 2016; Hattis and Rhodes, 2018), thereby helping social work researchers get detailed, person-centred, chronologically rich data which captures the migration experiences of forced migrants.
Sharing experiences of forced migration can be a source of potential distress for the participants, eliciting anxiety as participants reflect on traumatic and difficult experiences (Hollway and Jefferson, 2013). Scholars have shown how timelines can limit re-traumatization and other psychological stresses during data collection with crisis survivors (Kolar et al., 2012, 2015; Pell et al., 2020). When used appropriately by researchers, timelines not only focus on pathology and challenges but can aid reflection on both participants’ positive and negative experiences. This will assist participants in framing their migration journey, identifying the strengths and resilience shown through the significant events that laced the journey and building agency (Kolar et al., 2015).
Utilising social convoy circles in research
Convoy circles are relational diagrams representing associations between people or concepts (Bravington and King, 2019). The use of convoy circles for data elicitation evolved from its use for Social Network Analysis (SNA) to become a salient tool for data collection (Borgatti et al., 2009). Convoy circles look like an archery practice target, starting with a central circle and other larger circles radiating outwards (see figure 2). The participant is placed at the centre of the concentric circle, with the participant’s innermost circle showing convoys closest to them and the most important source of social support. The outermost concentric circle represents convoy members that are not very close to the participant but have been identified as occasional sources of support. The importance of a convoy at any point in the life course is determined by the quality and quantity of support they provide and their level of closeness with the participant. Its major limitation is its inability to illustrate the nature of interactions within the social convoys.
Using the convoy model in research can aid in conceptualising the multidimensionality of social relations. In its simplest form, they illustrate the structure, type, and quality of social networks (Antonucci et al., 2014; Kahn and Antonucci, 1980), with early research adopting the use of simple counts of the number of social contacts (Berkman and Syme, 1979; House et al., 1982), while the quality of relations was included later (Blazer, 1982). Links between quantity and quality of relationships started to develop, given that one has to necessarily have the quantity of relations to have the quality (Antonucci et al., 2014). Exploring the characteristics of network members, such as type of relationship (friend, spouse, and children), age, gender, geographic proximity, and contact rate, became part of the convoy model (Antonucci et al., 2014). Although social relations are considered necessary at any given time, convoys can help explore previous and current relations.
The design of convoy circles can be as simplistic as the circles in an archery target and as complex as the planets surrounding the solar system. For instance, in Josselson’s (1996) work on human relationships, participants were asked to model their convoy circles in the form of the solar system. The participants represented the sun; those important to them were the planets revolving around it. This was done repeatedly for 5 years and revealed how convoys appear and disappear from individuals’ social worlds over time. In another study by Bagnoli (2009), a somewhat less structured convoy circle was adopted. The researcher gave the participants tips and asked them to draw themselves in the centre surrounded by people important to them. They also illustrated how important the people are to them by placing them closer or more distant from themselves. This led to participants being as creative as possible in the designs of their convoys. Innovative applications of convoy circles in understanding lived experiences include topics such as social relations of people with addiction (Dobbie et al., 2018) and chronic health conditions with research-designed/participant-led concentric circles (McCann and Roberto, 2012) considering frailty and mobility.
Life events like forced migration are characterised by changes in social networks and support (Sippel et al., 2015). Many forced migrants lose their social networks during events leading to forced migration; they migrate to new environments where the nature of social support may differ (Ekoh et al., 2022b; Sippel et al., 2015), and this typically leads to a gap in support. Convoy circles can collect data on the quantity and quality of social networks and support available to forced migrants in two ways. It can capture a snapshot of forced migrants’ social networks, the nature of support and the importance of the support. It can also be used to explore the changes in social networks and support for migrants due to forced migration. This can be done by placing two concentric circles side by side, with participants placing social convoys before displacement in the first circle and social convoys after displacement in the second concentric circle to show how social networks and support have changed as a result of forced migration. This can help identify gaps in social networks and support for forced migrants, and filling such gaps will improve the resilience, coping capacity and quality of life of forced migrants (Sambu, 2015). Longitudinal studies aimed at exploring the dynamics of relationships within forced migration can benefit from using concentric circles. A prolonged collection of data from the same sample with concentric circles can show the relational changes in the world of forced migrants.
Utilising ecomaps in research
Ecomaps, a diagram simulation that maps the ecological system (Hartman, 1995), have similar features to convoy circles with the added advantage of representing the nature of interactions in the relationship between networks and events (see figue 3). Ecomaps started in the 1970s with its use in family therapy by a social worker, Ann Hartman (1978), who adapted it from the General Systems Theory. It was typically used for measuring social support (Hartman, 1995) and diagramming a family’s connection with larger society (Compton and Galaway, 1999), but later became a valuable tool for the data collection on the dynamics of relationships and events and the environment in relation to participants (Umoquit et al., 2011).
Its design characteristically depicts participants in a central circle or box and other circles or boxes containing social networks or/and events around the centre to demonstrate external systems that are important or influential to the participant. Lines of different weights and patterns coded to illustrate the nature of the relationships are used to connect the participants’ central circle or box with the circles or boxes of the external events or networks. For instance, a dotted line may show a broken relationship, while a straight thin line shows a steady positive relationship.
Ecomaps illustrate rich and dynamic complexities in social relationships and connections between individuals and their environment (Crawford et al., 2016; Doyle et al., 2017), sources of support and stress, reciprocity of relationships, and the ability of a particular relationship to be both harmful and positive at the same time (Ekoh et al., 2022c; Washington, 2009). Its strength-based and collaborative nature helps build rapport and creates a safe space for disclosing sensitive information (Nascimento et al., 2014). It has also been found to be effective for research with people with educational, language and cognitive limitations (Doyle et al., 2017; Summerville, 2018). Although it has primarily been used for research with children (Borja, 2017; Charepe, 2011), it can also be adapted for studies with other populations in a culturally sensitive manner, reflecting complex individual interactions (Brown, 2007; Doyle et al., 2017; Nguyen et al., 2016).
Given its suitability for exploring evocative issues, it has been adopted by many researchers for examining sensitive topics. For instance, it was adopted by Correa et al. (2011) to explore abuse within the social networks of single Puerto Rican mothers of children living with disabilities. With the aid of the diagrams, participants could reflect on and describe the nature, strengths, and reciprocity of their relationships and identify supportive and abusive relationships. Washington (2009) also utilised co-created ecomaps to examine caregiving for children with disabilities. It explores the interaction between the children’s family and community. The ecomaps helped participants reflect and conceptualise how caregiving and interaction with the community can lead to stress which may result in child maltreatment.
Ecomaps have been criticised as paternalistic, sexist, and insensitive to cultural diversities and power differences (Manja et al., 2021). This is because of its origin as a tool for family relation assessment which creates conditions that deem some people as normal and others as dysfunctional (Iverson et al., 2005). To address these concerns, researchers have adapted this method to explore the experiences of minorities facing discrimination and oppression. For instance, ecomaps were used by Doyle et al. (2017) and Stewart and Allan (2013) argued for their appropriateness for research with indigenous populations, as they help participants externalise their emotions and discuss trauma with a limited risk of re-traumatization. Nguyen et al. (2016) also used ecomaps to examine the multiple layers of sexual and gender diversity amongst couples as they experience homophobia, heterosexism, and cisgenderism, charting the resources, areas of strength, and support systems available to sexual minorities.
Ecomaps can be used to explore similar issues with forced migrants. It has the added advantage of showing the dynamics of the participants’ relationship with social networks compared to convoy circles as an instrument for data collection with forced migrants. It can be used to explore some sensitive social challenges associated with forced migration, such as exclusion, abuse, and isolation (Ekoh et al., 2022c). It can be used to map out resources available to forced migrants, given the scarce resources during forced migration (Wachter et al., 2021). Studies on health promotion, stress, and caregiving with forced migrants who are vulnerable within vulnerability, such as older people, people living with disabilities, and children, can be done with ecomaps as it helps participants better reflect on sources of stress, relationships with caregivers and challenges accessing healthcare services (Correa et al., 2011).
Discussion
The demographic characteristics, vulnerabilities, and challenges of forced migrants make using diagramming in social work research with forced migrants suitable. Drawing from the critical constructivist paradigm, the authors call for a shift to more innovative and art-based visual data collection methods in qualitative research with forced migrants. When applied, diagramming holds excellent potential for reflexivity, externalising emotions, ensuring critical thinking and evocative thoughts, and increased access to different areas of human consciousness leading to an investigation into layers of human experiences (Gauntlett, 2007; Prosser and Loxley, 2008). It also aids in discussing sensitive and traumatic experiences with minimal risk of re-traumatization, providing a foundation for further interaction between the participant and the researcher and serving as openers or icebreakers for deep investigative discussions (Crilly et al., 2006).
Timelines, concentric circles, and ecomaps as data collection tools can effectively illustrate how forced migration has led to changes in network composition, support quality and quantity from the pre-migration period to the post-migration era. The concentric circles and ecomaps have been used to identify gaps in social support (Borja, 2017; Roseneil, 2006), which can help reveal the displacement-induced gaps in social support. Ecomaps can also show the duality of forced migrant reciprocative relationships with convoys, revealing critically how social networks can be a source of adversity as well as support for forced migrants (Ekoh et al., 2022c; Washington, 2009).
Diagramming also presents other unique advantages for research with forced migrants. Compared to other visual data collection methods like photovoice, it is cost-effective as only pen/pencil and paper are the essential tools, eliminating the limitation of image rights and consent. Little instructions and training are required with this method. It also puts less pressure on participants, given that the focus is not on the aesthetic or artistic nature of the diagrams but on the information contained in them. As illustrated by Bagnoli (2009), diagramming can be flexible, allowing participants to be as creative as possible in their designs. The collaborative nature of diagramming can help remove researcher-participant power imbalance and aid in developing rapport.
Again, the flexibility of this method allows for different diagramming methods to be combined with other data collection methods for richer data. For instance, timelines and ecomaps can be combined with interviews, narratives or storytelling. The timeline can be used to guide the narration of the migration journey, limiting potential distress associated with reflecting on trauma as well as identifying the agencies hidden within the journey (Hollway and Jefferson, 2013; Kolar et al., 2015), while ecomaps or concentric circles will be adopted for deeper exploration of identified significant events, systems, and networks within the timeline narratives. Moreso, scholars like Doyle et al. (2017) and Nguyen et al. (2016) have argued for the adaptability of diagrams for studies with other populations in a culturally sensitive manner, reflecting complex individual interactions. This is crucial given that the community of forced migrants comprises a diverse population who are culturally, ethnically, sexually and religiously varied.
Irrespective of the strengths of diagramming as a data collection method, some concerns have been identified. Scholars have identified data oversaturation as a significant limitation of adopting diagramming and other visual data collection methods, arguing that researchers may become overwhelmed and struggle to sort and manage excessive data from these methods (Bravington and King, 2019; Umoquit et al., 2013). Umoquit et al. (2008) further identified a lack of evidence to prove the superiority of these methods over traditional interviews, recommending experimental research on this. Justine (2017) argued that a limitation of diagrams is that once the information is drawn up, it becomes static, representing a snapshot of the time. Furthermore, social desirability bias can lead participants to depict overly optimistic illustrations, underscoring the need to verify the accuracy of representation with other sources of information (De Souza and Kantorski, 2009). Some participants may also struggle to depict visual ideas (Kennedy, 2010) coherently, and some diagramming tools, such as ecomaps, may be complex for participants with lower levels of education, thus, requiring more training (Bravington and King, 2019).
Nonetheless, diagramming can potentially improve data collection with forced migrants, allowing them access to multiple dimensions of experiential memories. They help participants express issues challenging to put into words, control the pace of the research, and be co-creators of knowledge about their experiences. It will also increase critical reflection, reduce the stress and risk of re-traumatization during evocative discussions, and access agencies, inherent strengths and resilience that traditional qualitative interviews may not unravel. Therefore, we hope social work researchers can start pushing the boundaries by adopting more innovative methods like diagramming for data collection with forced migrants. We also believe that the adoption and documentation of diagramming in studies with forced migrants will potentially reveal more benefits and limitations, which will help in designing more innovative diagramming and visual data collection methods for research with forced migrants.
Footnotes
Declaration of conflicting interests
The author(s) declared no potential conflicts of interest with respect to the research, authorship, and/or publication of this article.
Funding
The author(s) disclosed receipt of the following financial support for the research, authorship, and/or publication of this article: This work was supported by the Vanier Canada Graduate Scholarship and Pierre-Elliot.