
Abstract
The vital assessment of cardiovascular health metrics, notably heart and respiratory rates, is paramount for early detection and timely intervention of vascular anomalies. With the rise in global prevalence of cardiovascular diseases, there’s a pressing demand for systems that support long-term and remote monitoring. In response, this study explored Ballistocardiography (BCG)—a technique capturing the minute vibrations caused by cardiac contractions and bodily movements, offering non-invasive, continuous monitoring. Utilizing Dozee, a cutting-edge contactless monitoring system, we sought to identify optimal sensor placements. Data was collated from 18 healthy participants and 7 with vascular conditions, with sensors arrayed across the upper and lower body. Post rigorous signal filtering and statistical analyses, the thorax and lumbar spine sensors emerged as the most accurate for the upper and lower body, respectively. However, regions like the cerebral and legs faced compromised signals due to external interferences such as body movements. The study underscores BCG’s potential as a promising, non-invasive, and cost-effective alternative to traditional diagnostics. For a broader clinical application and validation, further research, especially high-powered controlled studies are required.
Introduction
On a global scale, cardiovascular diseases (CVDs) such as ischemic heart disease and cerebrovascular diseases such as stroke account for 17.9 million deaths annually and are the leading cause of mortality worldwide. 1 According to the World Health Organization, about one-fifth of the deaths are contributed by India alone, especially in the younger population. The results of the Global Burden of Disease study state that the CVD death rate is 272 per 100,000 people in India, which is much higher than the global average of 235. In comparison to other ethnic groups, Indians are 2–4 times more likely to be hospitalized for CVD complications, and admission rates are 5–10 times higher for individuals under the age of 40. The onset of CVDs in the Indian population has been observed to be at least a decade earlier than in the Western population. 2 In 2016, CVD contributed to 28.1% of total deaths and 14.1% of total disability-adjusted life years (DALYs), compared with 15.2% and 6.9%, respectively, in 1990. 1
Vascular diseases are characterized by heaviness in the muscles, angina (chest pain), fatigue, nausea, significant variations in the heart rate, shortness of breath, or a high respiratory rate.1,3,4 Among these symptoms, clinical parameters such as the heart rate and respiratory rate can be easily monitored. This property of the aforementioned parameters can be exploited for the development of early detection systems for vascular diseases.
The current diagnostic practices such as Magnetic Resonance Angiography, Vascular Ultrasound, and Computed Tomography Angiography, while accurate, are machine-intensive, and expensive and do not allow for long-term, remote monitoring of clinical parameters that are indicative of vascular abnormalities. Ballistocardiography (BCG) has been an important field of research because of its unique ability to capture valuable information on essential factors including heart rate, respiratory rate, and stroke volume.
5
Conventionally, Electrocardiography (ECG) has been a popular method for continuous cardiac monitoring. While both ECG and BCG are equally capable of monitoring the cardiac cycles, the major difference between the two signals lies in the principle of application of the two methods. ECG works on the principle of monitoring the electrical activity of the heart while BCG works on the principle of monitoring the mechanical vibrations caused by the electrical activity of the heart. The ECG QRS complex depicts electrical signals, that is, ventricular depolarization before contraction while the IJK peak in BCG is caused by mechanical movement during ventricular contraction and hence the time delay between the two signals (Figure 1(a)). An important study revealed that abnormal BCG is obtained as an early indicator of potential complications in cases of acute myocardial infarction, angina pectoris, and asymptomatic coronary artery disease. Because the amplitude and waveform of BCG signals are determined by cardiopulmonary mechanics, especially cardiac muscle movement, valve action and blood flow, any abnormality in these factors can serve as an early warning sign, making them the ideal choice for vital health monitoring.
5
In addition, BCG is preferred over other traditional acquisition including photoplethysmography or seismocardiography as BCG is non-intrusive or contactless as well as it is less susceptible to noise
6
(a) A typical Electrocardiogram (ECG) signal and Ballistocardiogram (BCG) signal. (b) Experimental set-up of BCG acquisition.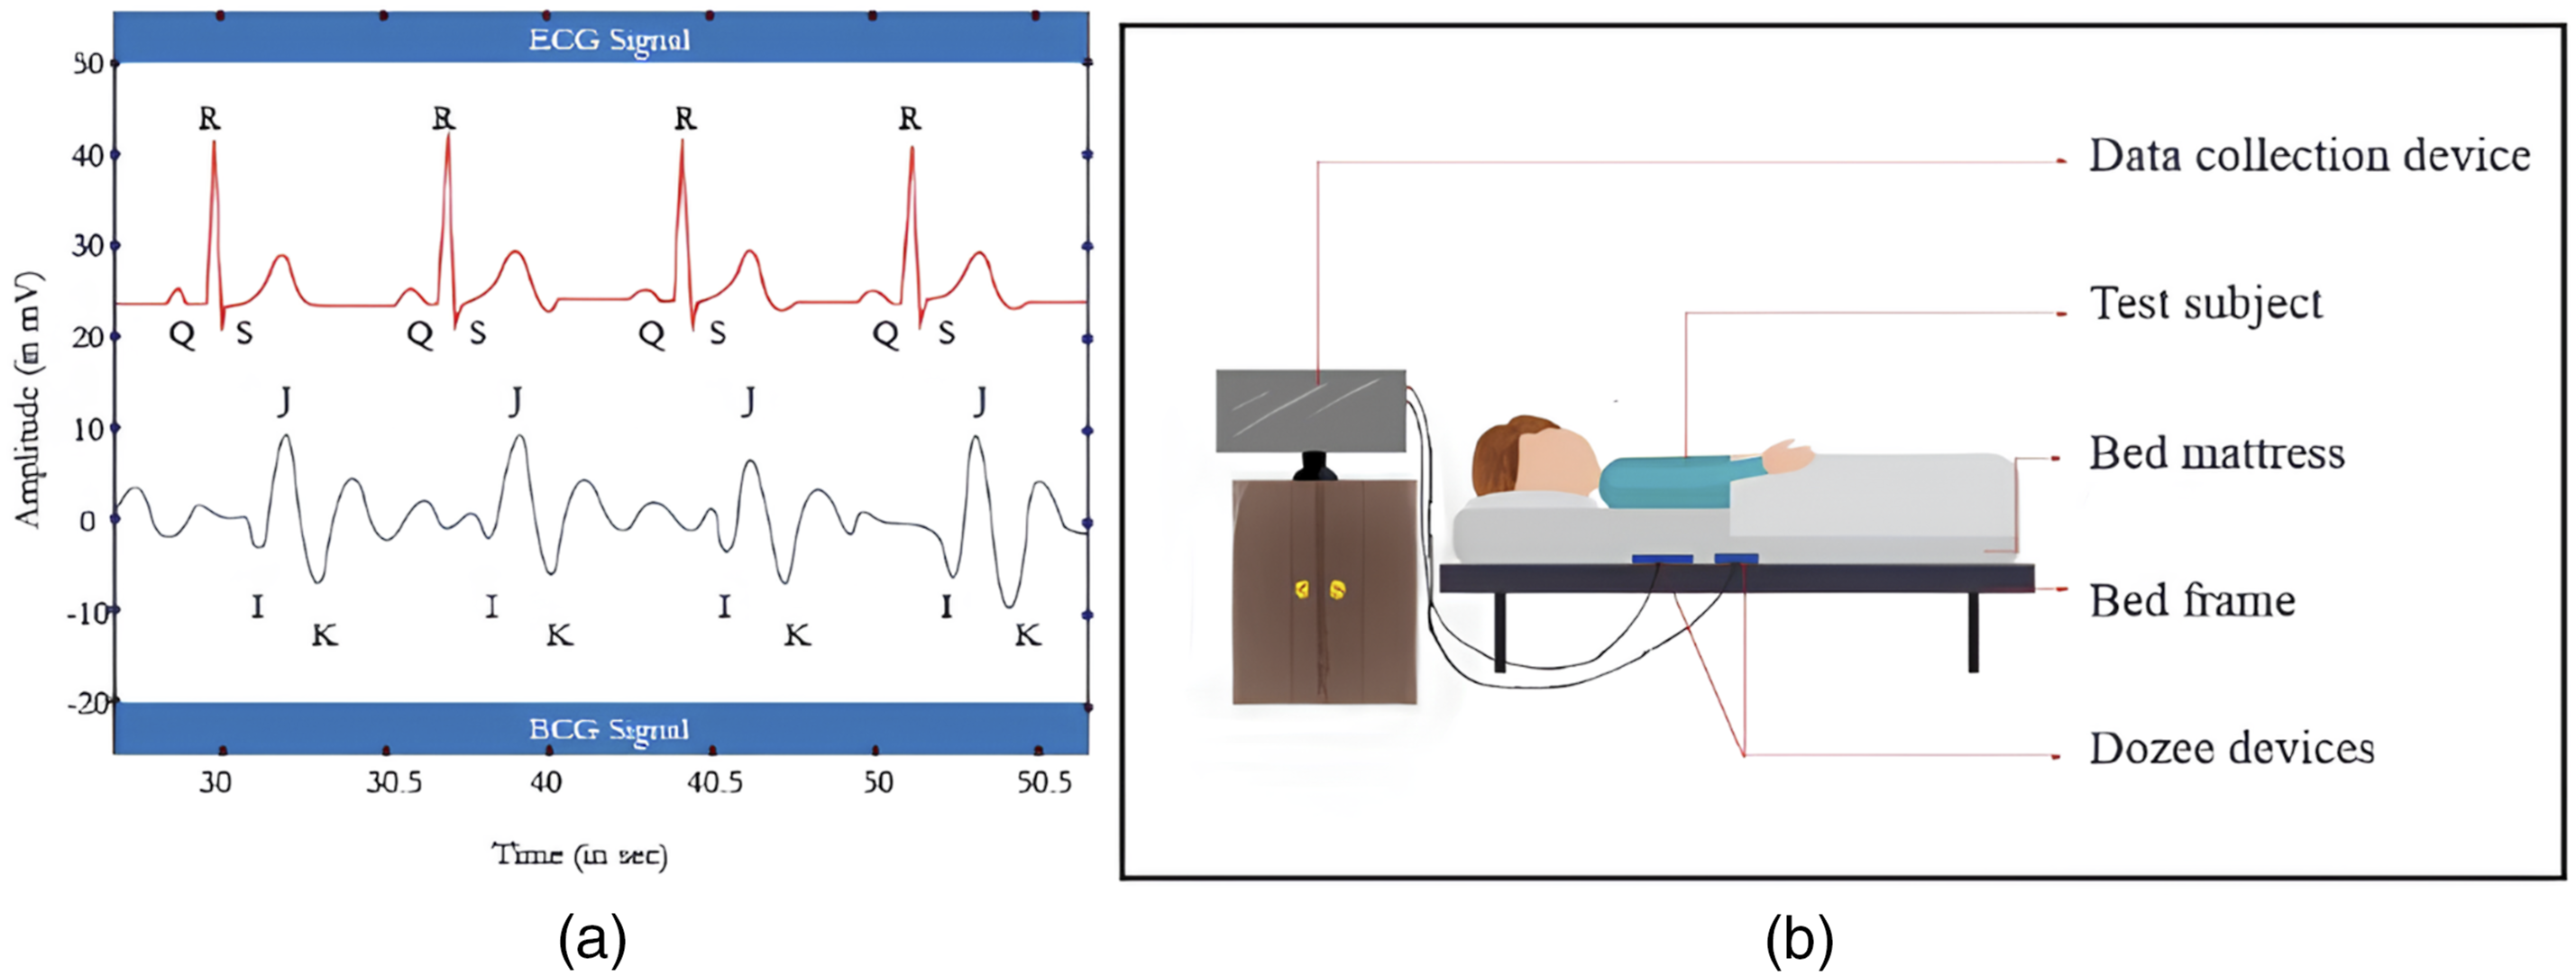
However, BCG inherently has a few drawbacks. The signals are susceptible to noise artifacts brought on by human motion and ambient noise. Any change in the position of the subject or the sensor can affect the quality of the BCG signal. Additionally, BCG signals also vary according to the Body Mass Index (BMI) of an individual.7,8 Therefore, it is critical to identify the best sensor placements for obtaining high-quality BCG signals for vascular health monitoring. Existing studies on BCG sensor placements primarily focus on either theoretical models or small-scale clinical evaluations without systematically comparing multiple sensor locations under controlled conditions.9,10 This study bridges this gap by evaluating sensor placements using both experimental data and simulated environments. We hypothesize that placing the sensors in the thorax region covering the entire upper portion of the body and the lumbar region covering the lower portion of the body may be optimum for the acquisition of BCG signals for vascular health monitoring. This hypothesis is based on the anatomical proximity of the thorax and lumbar spine to major blood vessels and organs, making these regions ideal for detecting the micro-vibrations related to heart and lung activity. Prior studies on BCG have highlighted the significance of micro-vibrations, particularly in the chest region, where the highest signal amplitudes are observed due to cardiac contractions. 11 Since BCG is a contactless sensing method, optimizing sensor placement in regions with the strongest physiological micro-movements ensures better signal quality and reliability. The term explicitly defines “contactless” as the ability to acquire signals without physical attachment to the body, which makes it distinct from “non-invasive,” a broader category encompassing techniques that avoid penetrating the skin. However, the noise generated by the head and leg sensors can be effectively removed using advanced signal processing methods.9,12
The remainder of this paper is structured as follows: the Methodology section details the study participants, the Dozee BCG device, the heartbeat simulator, BCG data acquisition, and data processing. The Results section presents the findings, followed by the Discussion and Limitations, which critically analyze the outcomes and study constraints. Finally, the Conclusion summarizes key insights and potential future directions.
Methodology
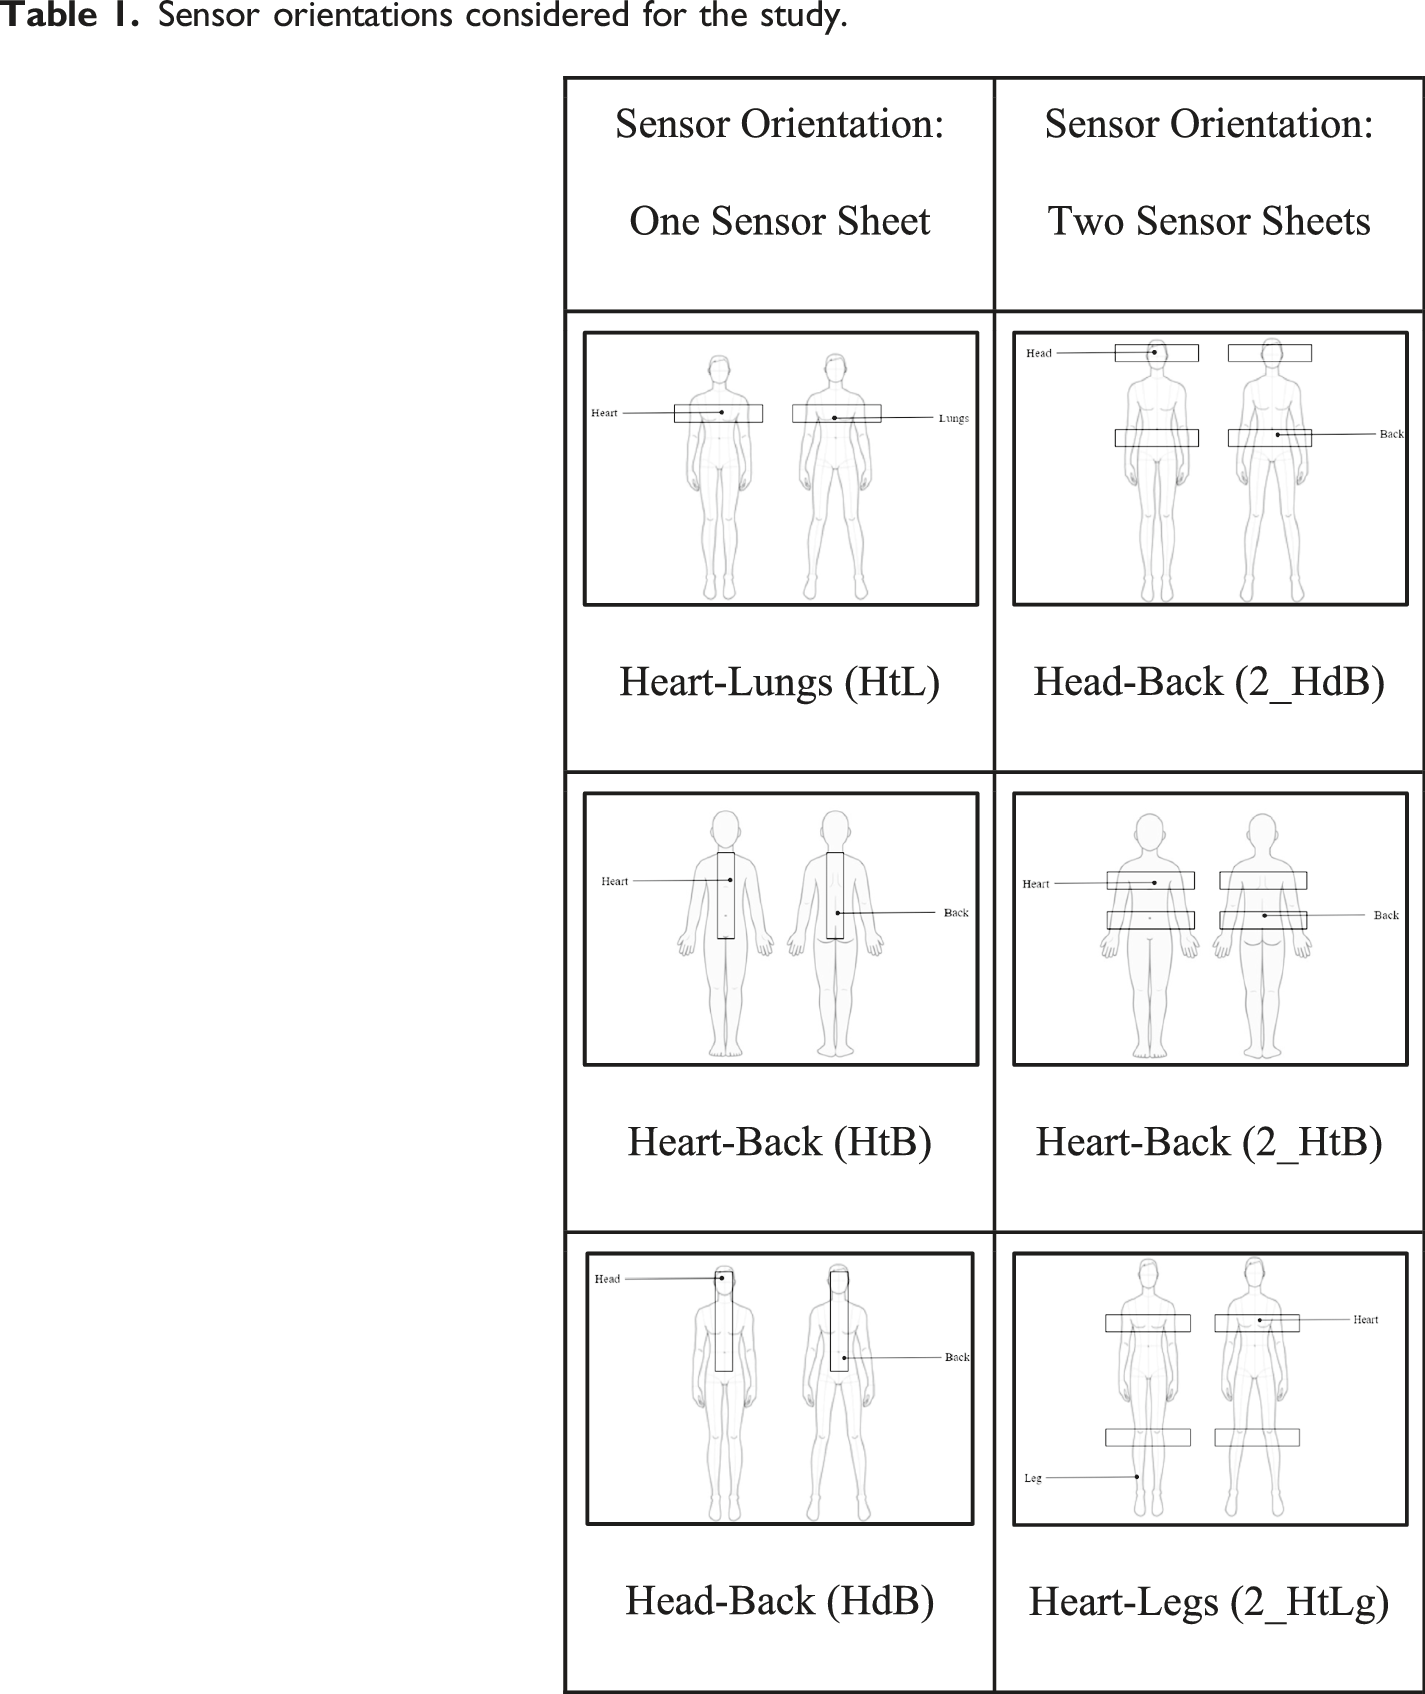
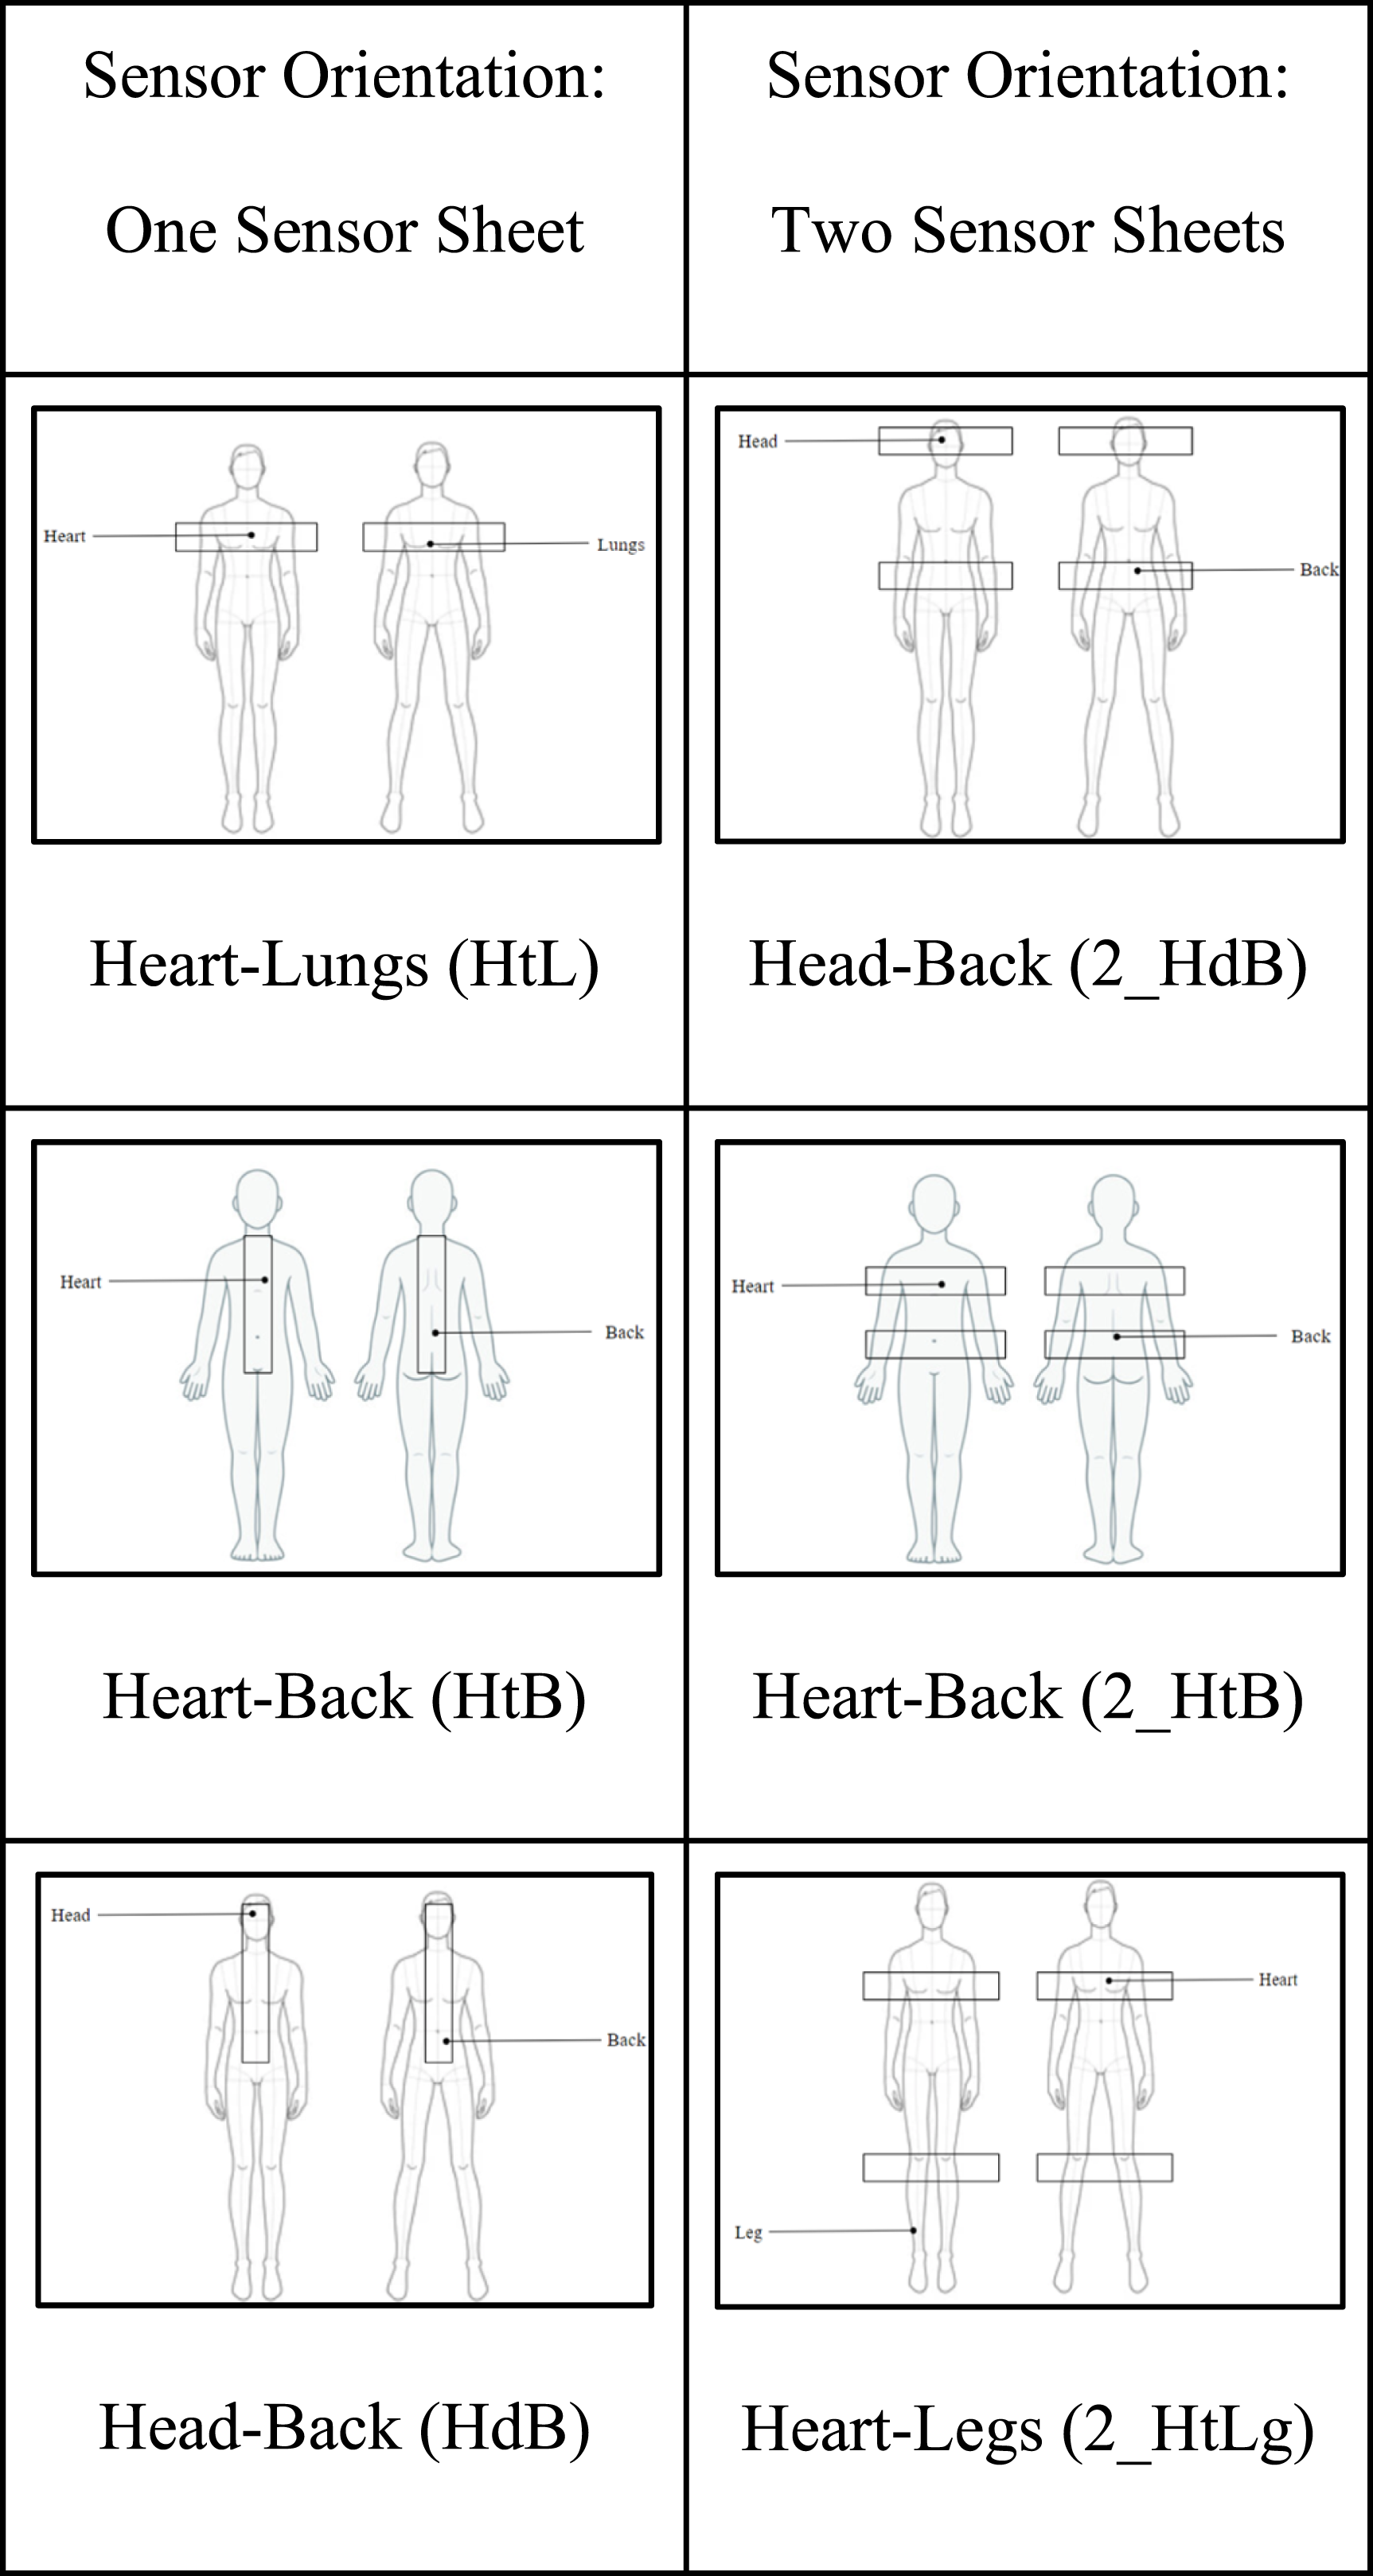
Sensor orientations considered for the study.
Study participants
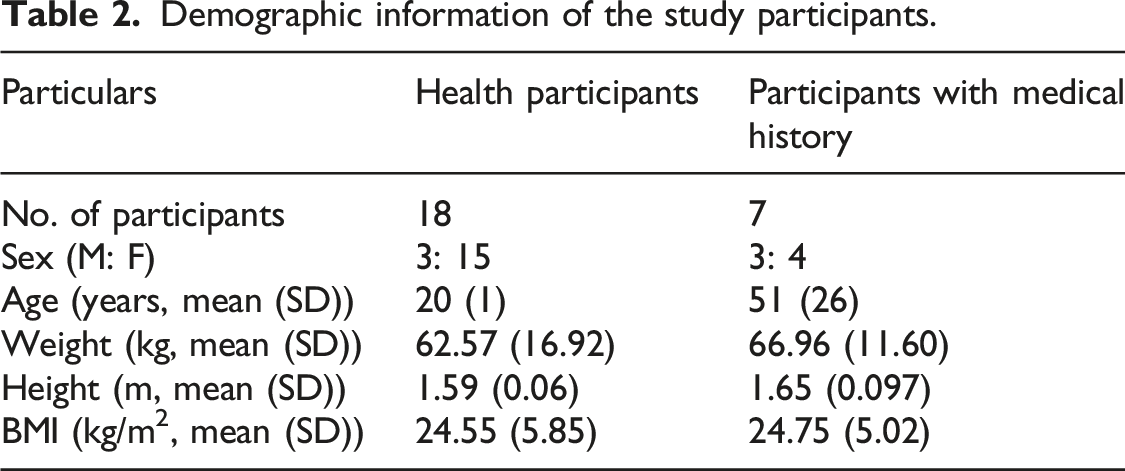
The BCG signals were recorded from two diverse demographic groups. The first group consisted of 18 healthy volunteers from B.M.S. College of Engineering, Bengaluru, India, recruited for the study through flyers and word of mouth. The age of the participants ranged between 19 and 22, and their BMI ranged from 16.7 to 35.91 kg/m2. The second group consisted of seven volunteers with different vascular conditions such as hypertension, a stent in the heart, varicose veins and people with a known genetic history of vascular conditions. The age of the participants in the second group of subjects ranged from 18 to 88 years, and their BMIs ranged from 20.9 to 34 kg/m2.
The signal acquisition experiments were carried out after the participants were informed about the project objectives, protocol, and procedure by the investigators. The study was approved by the Institute ethics committee. Informed consent was obtained from all the participants, and the BCG signal data were collected only from the participants who voluntarily accepted the terms and conditions. The participants were free to withdraw from the experiments at any point in time.
Dozee: The BCG device
In this study, we used devices from Turtle Shell Technologies, specifically the Dozee device, which is a contact-free health monitor designed to track vital signs and sleep patterns. This device is designed to be placed under the mattress and to acquire a Ballistocardiograph (BCG) to monitor heart and respiratory rates without requiring direct contact with the user. The equipment includes a vibroacoustic sensor sheet encompassed of polyvinylidene fluoride (PVDF)-based mesh that can identify both minuscule and large vibrations from the body, including those caused by breathing, heartbeats, snoring, and other movements. A data collection tool was linked to the sensor array. 7
The device’s gain was set to four for the following reasons: (a) to maintain consistency in measurement across all subjects, (b) to adequately amplify the signal for further processing without saturating the data, and (c) the system noise was observed to be minimal at this gain. The device is commercially available and approved by the FDA and other local regulatory bodies.
Heartbeat simulator
A model of a heartbeat simulator was built using the portable electronic DC motor, Raspberry Pi-pico, and LR7483 MOSFET control module (Figure 2(a)). The simulator had a two-fold application for the study. First, it helped simulate different heartbeat values to emulate various vascular heart conditions such as bradycardia, tachycardia and arrhythmia, which would have been otherwise difficult. Second, it helped to narrow the list of probable sensor orientations and different sensor placement combinations that would aid in effective vascular monitoring. (a) Electronic schematic of the heartbeat simulator using portable electronic DC motor. (b) State machine model of the heartbeat simulator.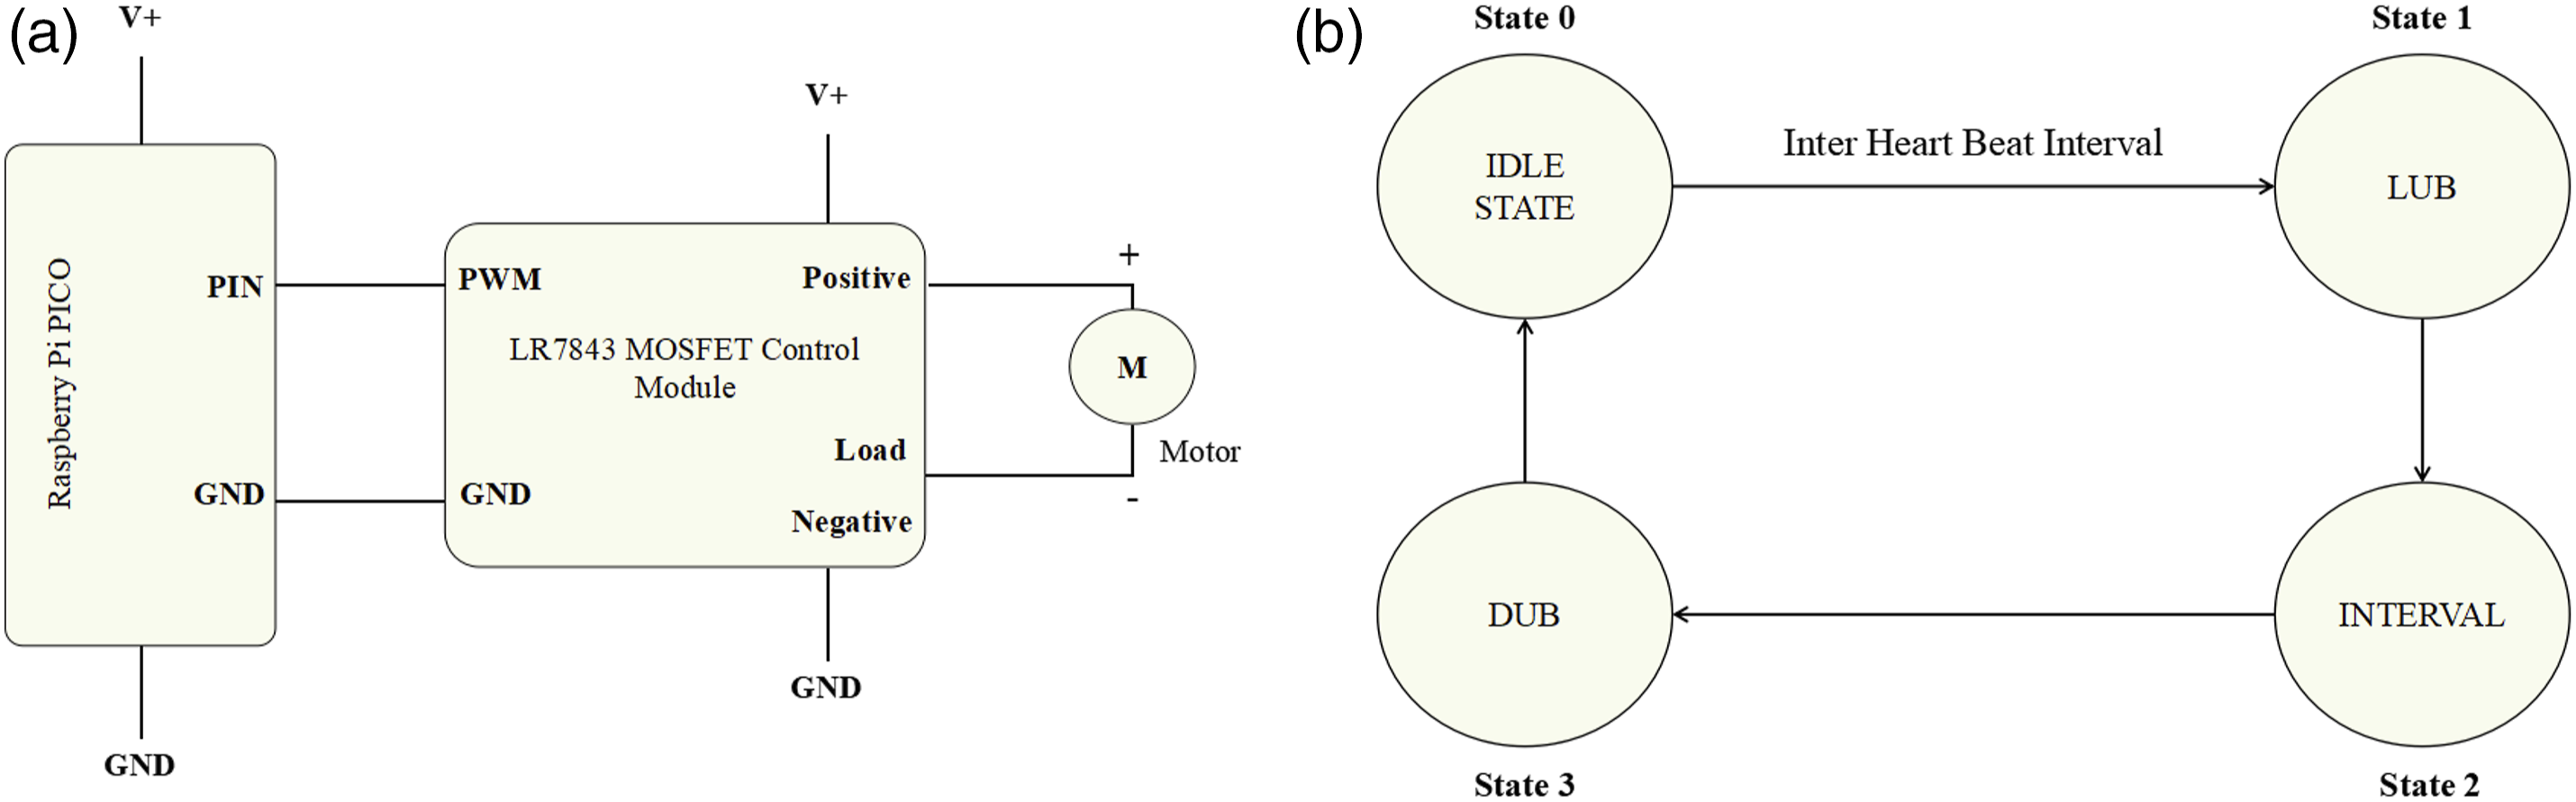
The simulator was programmed using Circuitpython after a four-state machine model. The states under consideration were named idle state—referring to the state of the heart between two consecutive heartbeats, lub state—the state corresponding to the ventricular polarization of the heart, interval state—referring to the duration between ventricular polarization and depolarization of the heart; and dub state—the state corresponding to the ventricular depolarization of the heart. These states were taken into consideration to program the simulator to mimic the natural heartbeats. The simulator was used primarily to refine sensor placements in a controlled environment by eliminating physiological variations that might arise due to posture, body composition, or movement artifacts. However, it is important to acknowledge that this approach assumes signal transmission remains unaffected by human tissue, which is a simplification of real-world conditions. The simulator provided preliminary insights into optimal sensor placements based on consistent and repeatable mechanical vibrations but cannot fully replicate the complexities of human cardiovascular physiology.
BCG data acquisition
The data was initially collected using a heart simulator as designed in the previous section to identify the optimal sensor placements for BCG signal acquisition. Initially the subjects were told to relax and not to move voluntarily till the experiment was completed and the investigators were monitoring for any movements and such data with noise were excluded from the study. The signals were acquired from different identified sensor combinations shown in Table 1. These six sensor orientations were chosen to ensure BCG signal acquisition from the thoracic and lumbar spine regions as well as from the body extremities, that is, head and legs. Additionally, the two sensor orientations also enabled simultaneous signal acquisition from the two halves of the body, allowing for separate analysis of these signals. Using the Heartbeat simulator, 14 BCG signals were simulated for different heart rates (in bpm) covering normal heart rates (60, 72, 80, and 100), persistent bradycardia (30, 40 and 50), and persistent tachycardia (120, 130, 140, 150, 170, 200, and 220). From the simulated signal, HR was derived from a 2-minute recording for each signal. The Dozee sensor sheet was placed beneath the mattress corresponding to the different sensor combinations as seen in Figure 1(b), and the heartbeat simulator was placed on top of the mattress at a point coinciding with the position of the heart.
Other sensor placements such as two sensor sheets placed across the torso (in an X formation) covering the superior and inferior vena cavas, the aorta and the pulmonary arteries were also considered. However, these placements had inherent drawbacks of noisy signals caused due to the overlap of two sensor sheets and hence these were not taken into account for the analysis of the experiments.
After identifying the sensor positions based on the visual analysis of the signals obtained by using the heartbeat simulator, the data was collected from the human participants. The data was collected over 4 minutes per orientation and visualized using ARGoS software which is compatible with Linux OS and Mac OSX.
Data processing
The signals acquired from the subjects were filtered using different libraries available in the Python programming on the Google Colab web IDE. The program uses Python libraries such as NumPy to carry out array operations, Matplotlib for visualization, and SciPy for signal filtering operations.
Initially the data was screened for any noise using visual inspection as a preliminary step and discarded if there was noise which could impact the analysis of the signal. Fast Fourier transform (FFT) was employed as a preliminary step to identify the frequency bands for heart rate and respiratory rate. Accordingly two digital filters were designed—a third order Butterworth bandpass filter in the frequency range of 1.5 Hz–15 Hz for extraction of heart rate signals, and a fourth order low-pass filter with a cut-off frequency of 1.5 Hz for extraction of respiratory rate signals.
13
The sequence of BCG signal data processing is as shown in Figure 3(a). (a). Block diagram of BCG data processing, (b) raw BCG signal, (c) filtered RR signal, and (d) filtered HR signal.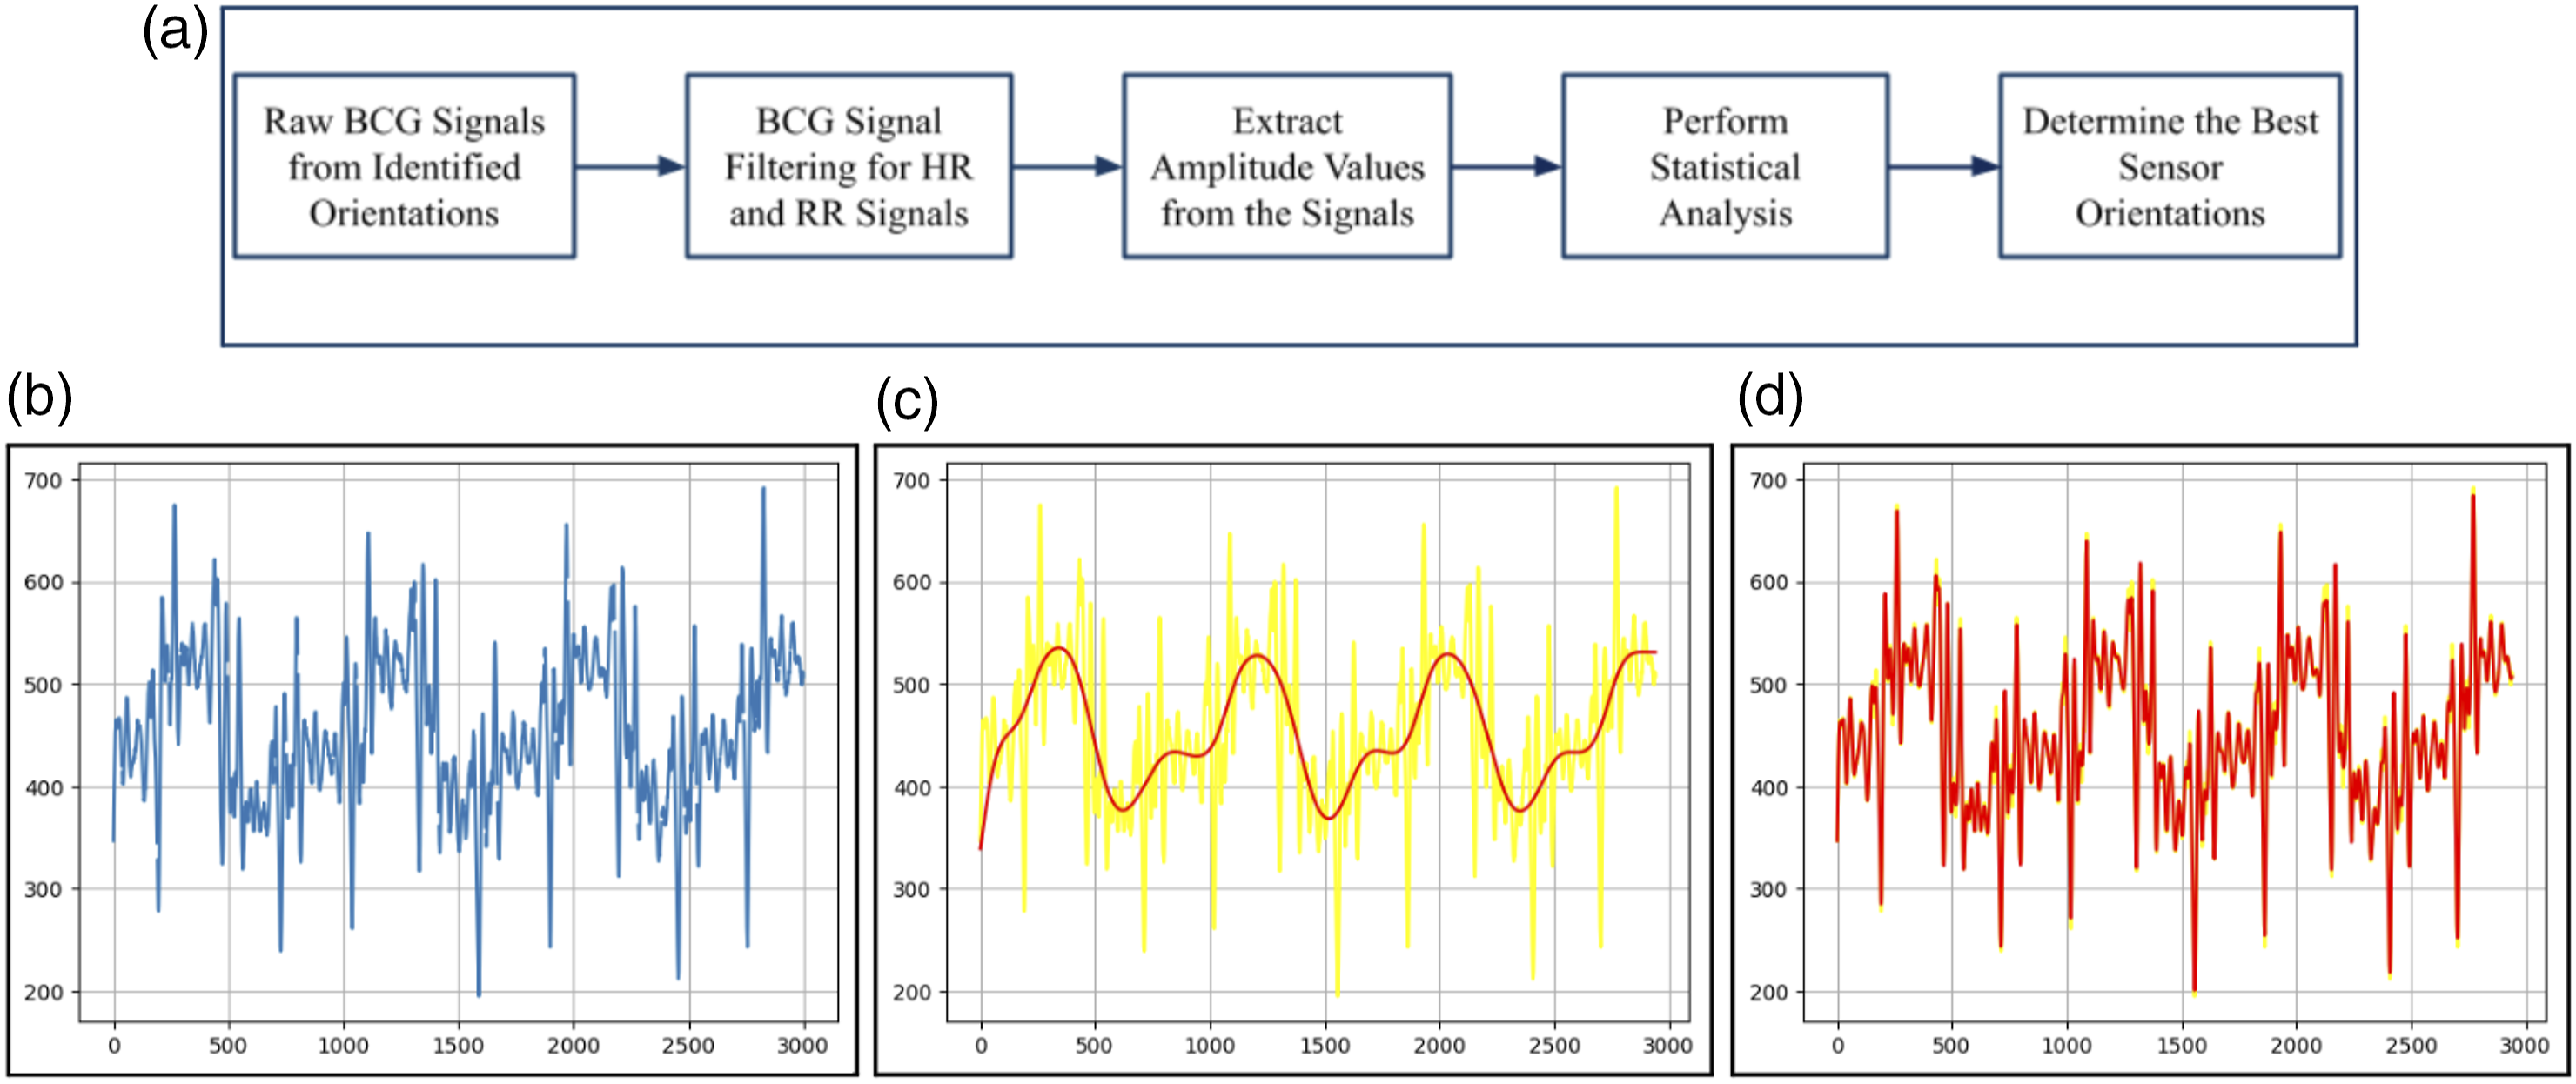
The amplitude values of the resulting signals were extracted for further analysis. Descriptive statistical methods were used to get further insights into the amplitude data. The results of the statistical analysis were then used to identify the best single- and double-sheet placements for effective vascular health monitoring.
Results
Subject demographics
Demographic information of the study participants.
Signal filtering and statistical analysis
The filtered signals for RR had distinct peaks corresponding to each breath of the individual, and the filtered signals for HR had peaks corresponding to the cardiac vibrations for every cycle. A sample signal is shown in Figure 3.
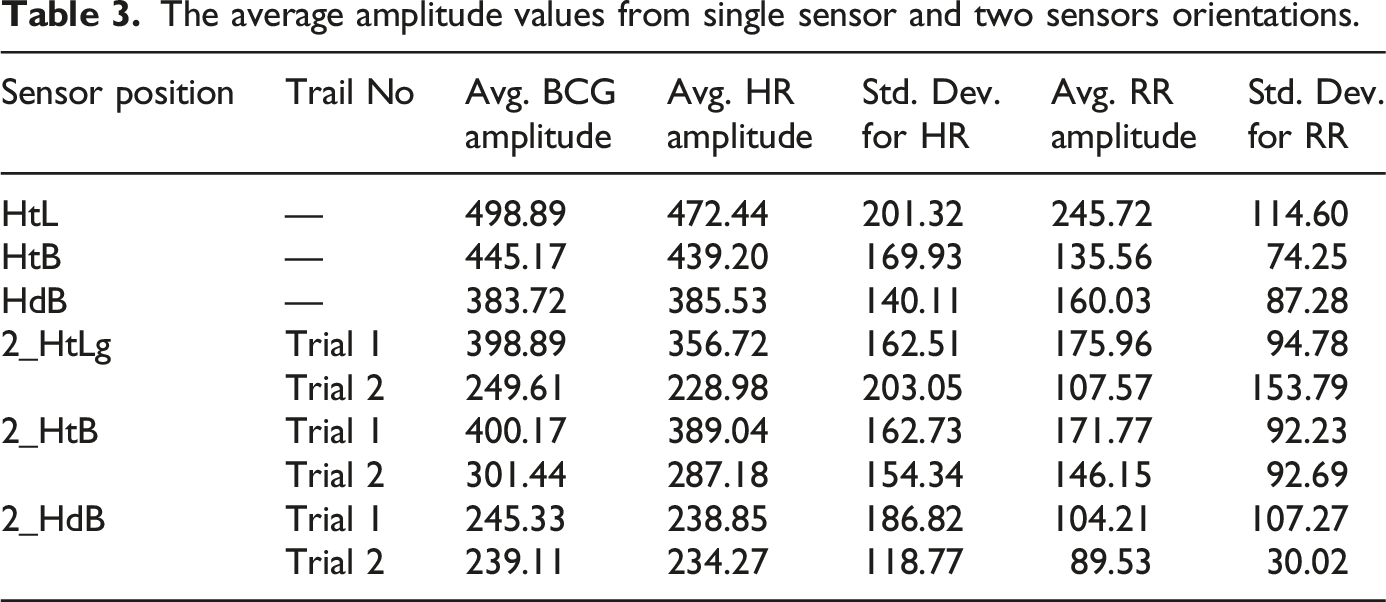
From the amplitude values obtained for all the identified sensor positions for the raw BCG, HR, and RR signals, it was observed that the single sensor sheet placed horizontally across the thorax region covering both the heart and the lungs (sensor orientation nomenclature (Heart and Lung): HtL) had the maximum amplitude for all the signals. The amplitude measurements were derived from peak-to-peak variations in the recorded signals. The baseline was set using a predefined quiet breathing phase, ensuring consistency in amplitude estimation. The single sensor sheet placed vertically along the thoracic and lumbar spine covering the heart, lungs, and back regions (sensor orientation nomenclature (Heart, Lung, and Back regions): HtB) had the second-best amplitude for all the signals, followed by the signals collected from the single sensor sheet placed vertically along the cerebral and spinal cord region covering the brain, heart, lungs, and back areas. The comparisons between the three single sensor orientations can be seen in Figure 4. The results are tabulated in Tables 3 and 4 with and without medical history. Comparison of amplitude values for different: (a) Single sensor orientations, (b) upper half sensor orientations, and (c) lower half sensor orientations. The average amplitude values from single sensor and two sensors orientations. The average amplitude values from one sensor and two sensors orientations for subjects with medical history.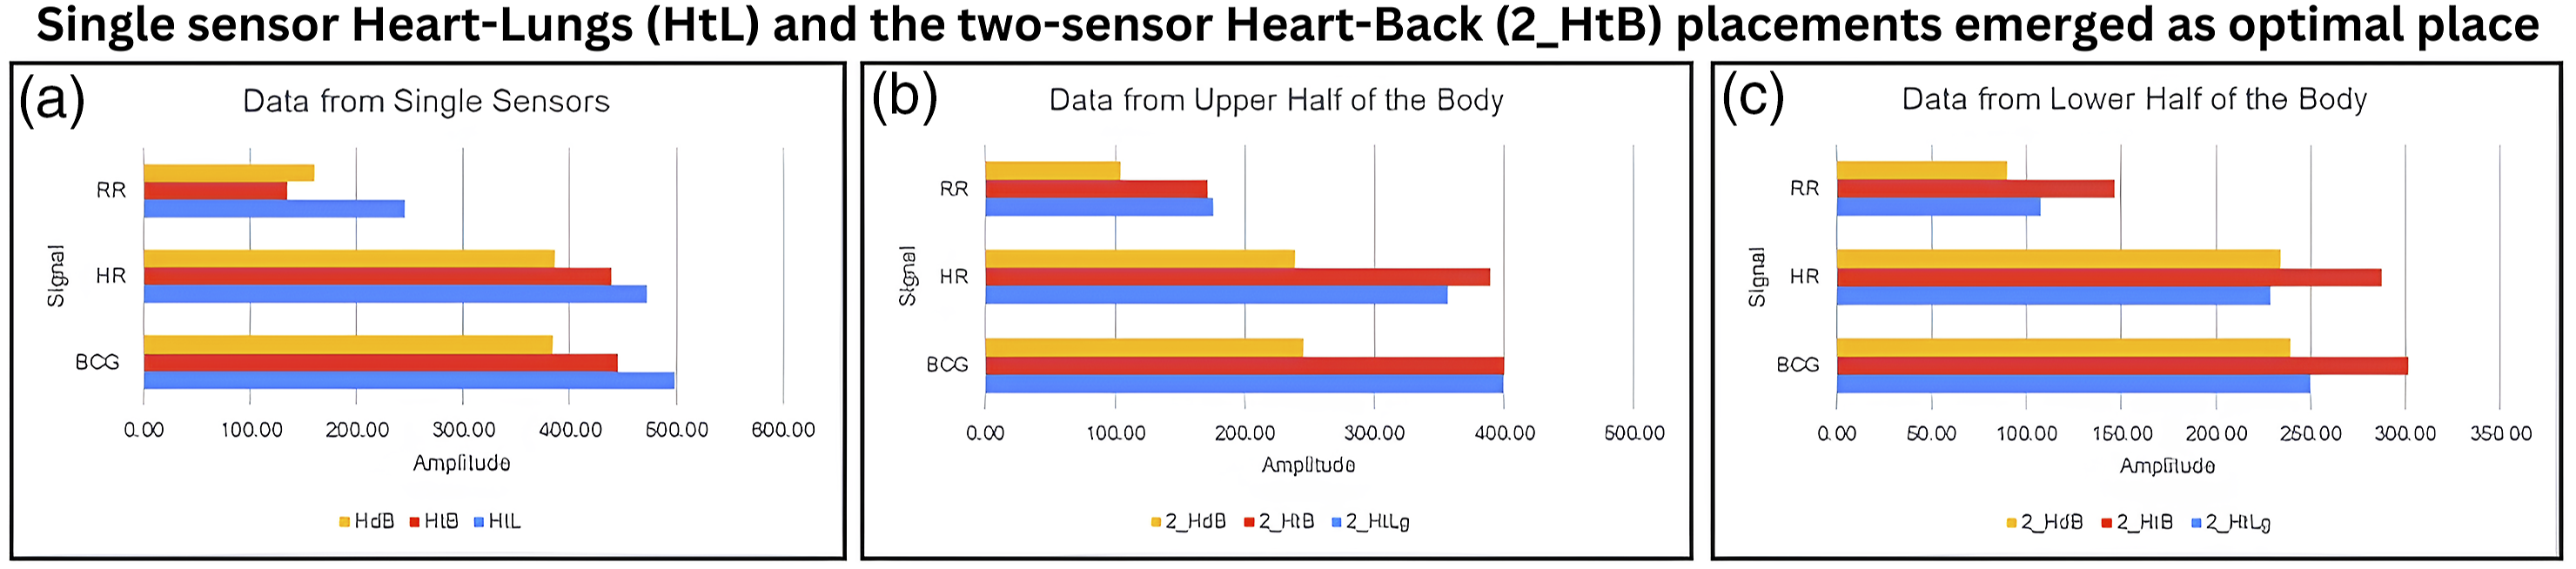
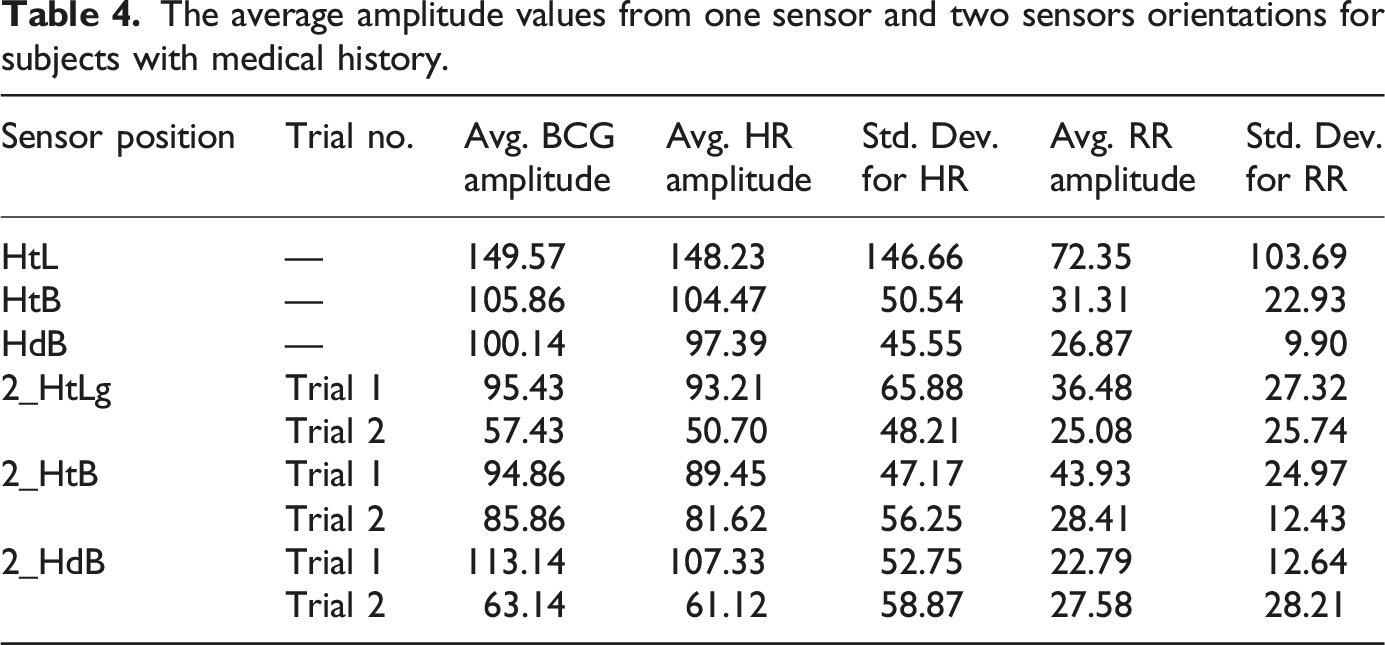
Among the two sensor sheet combinations, the sensors placed horizontally across the thorax and the lumbar spine had the maximum amplitude values for the raw BCG, HR, and RR signals from the upper and lower halves of the body, respectively. The signals collected from the cerebral region (head) and the legs had poor signals and low amplitude values. The comparison between the sensor orientations collecting signals from the upper and lower halves of the body can be observed in Figure 4.
The high standard deviation (SD) observed for the sensor sheet placed horizontally across all regions is indicative of individual variability in factors such as posture, weight, and sensor positioning. These factors have been shown to influence the amplitude of Ballistocardiography (BCG) signals. The standard deviation values of 40–50% of the amplitude values reflect this inherent variability across different subjects, as each individual may exhibit slight variations in their body position and movement during data collection.13,14 Furthermore, the baseline and gain adjustments made to optimize the signal for each subject can also contribute to this variability.
Discussions
Our research explored six sensor placements—comprising three single-sensor orientations and three two-sensor sheet orientations. The single sensor Heart-Lungs (HtL) and the two-sensor Heart-Back (2_HtB) placements emerged as optimal placement based on signal quality, amplitude, and minimal noise interference.
Through filtering and statistical analysis, it was discerned that the sensor placed on the thorax exhibited robust signals characterized by clean peaks and optimal amplitude values for both the heart rate (HR) and respiratory rate (RR). In contrast, the lumbar spine sensor, representing the lower back, showcased superior results among sensors positioned on the lower body. The selection of these two regions was based on their proximity to major arteries and organs, which generate strong, detectable micro-vibrations. In contrast, smaller blood vessels in peripheral regions such as the legs and cerebral area produce weaker vibrations, making them more susceptible to noise and external disturbances. Prior studies on BCG sensor placement have also indicated that chest-based sensor positioning yields higher signal amplitudes, supporting our findings. By focusing on regions with stronger mechanical activity, we aimed to maximize signal quality while minimizing noise artifacts, ensuring more reliable vascular health monitoring. However, signals derived from the cerebral region were compromised due to noise interference caused by hair and pillow use. Additionally, leg signals, although less distorted than head signals, appeared weaker compared to back signals, an expected outcome given their peripheral location.
In practical hospital scenarios where patient movement is frequent—such as adjustments to pillows or bed positioning—the signals from head and leg sensors showed diminished quality, resulting in loss of pivotal data. This pattern was consistent even when assessing subjects with a medical history. 15 The sensor sheet across the thorax demonstrated the highest amplitude for all signals, including raw BCG, HR, and RR, while the combination of thorax and lumbar spine sensors yielded the best results for two-sheet sensor placements.
There are few instances where the SD exceeds the averaged amplitude values, particularly in subjects with medical history, it is important to note that such deviations may not necessarily indicate erroneous data, but rather reflect the physiological differences and potential vascular anomalies present in non-healthy subjects. These anomalies, such as irregular heart function or abnormal blood flow, can lead to significant variations in the BCG signal, making the observed high SD values diagnostically relevant. In such cases, the high SD could be suggestive of an underlying health condition, and these variations may serve as an important indicator for future diagnostic research. 6 BCG is influenced by weight and position of the sensors. 16 However, it has to be carefully interpreted as the number of sample sizes is small for any definite conclusion. In addition, the data for the analysis is related to heart rate and respiration rate which are in the same range as the standard values. However, the previous studies have discussed the generalizability of usage of BCG and correlation of the data.17,18
Remarkably, a significant disparity was observed in the amplitude values from the upper and lower body halves, affirming the hypothesis of signal amplitude and quality differentiation between these two regions. To enhance device sensitivity and precision in vascular health monitoring, smaller dimensioned sensors can be strategically placed in areas with a high prevalence of vascular abnormalities. Ballistocardiography (BCG) is a technique that captures the ballistic forces produced by the heart due to blood inflow. The continuous redistribution of blood throughout the body during cardiac cycles influences the BCG signals, resulting in changes based on the BCG sensor placements. 19
Targeting specific vascular conditions, the heart and lungs sensor configuration can be beneficial for conditions like pulmonary embolism and cardiovascular diseases, while configurations around the heart and legs can be tailored for ailments like peripheral artery disease. The comprehensive monitoring of head, heart, and back can facilitate a more thorough collection of vascular data from the body. 14
However, several limitations of our study warrant attention. The sample size was relatively small, and it’s imperative to expand this to validate the findings more conclusively. The statistical significance testing helps in strengthening the robustness of our conclusions. However, due to the inherent limitations of our dataset, conducting meaningful statistical tests was not feasible. Our dataset consists of a limited number of subjects and trials, which reduces statistical power and increases the likelihood of Type I and Type II errors. The high inter-subject variability, especially in physiological parameters, makes it difficult to derive statistically meaningful comparisons without risking misleading interpretations. The primary objective of this study was to investigate signal patterns across sensor placements, rather than to establish definitive statistical relationships. Statistical analysis is to be explored in future studies which have larger sample sizes. There were disparities in the age range among volunteers, with a predominant representation of females. Although this study did not adjust for gender differences, the outcomes might remain consistent despite varied age and sex ratios. However, previous research using the Dozee device has shown no significant gender-related differences.
While posture of sleep, position over sensors and BMI can influence signals, the variability observed is more dependent on individual posture, weight, and positioning. 17 The high standard deviations are observed during the study for the amplitudes in different postures. The high SD is indeed influenced by inter-subject differences in anatomical structure, breathing patterns, and sensor contact pressure. To better account for this, future studies should explore alternative normalization methods, such as using an individual baseline reference, to improve comparability across subjects. It is observed that high SD is seen in healthy subjects as well and it reflects that such deviations may also arise due to instrumental sensitivity, motion artifacts, or subject-specific variations in sensor interaction, rather than only being attributed to medical conditions unlike the subjects with medical condition.
While the simulator was used to refine the sensor placements, it is important to recognize that its effectiveness has not yet been validated against real-world data. The use of a simulator allowed for controlled testing conditions, but real-world testing with human subjects is necessary to determine whether a better sensor placement exists based on real BCG signals. Future studies should involve validating the simulator’s results by comparing simulated sensor placements with real-world data. These real-world validations will be critical in refining sensor placement protocols.
Furthermore, the broad spectrum of medical conditions in the second volunteer group, while advantageous for our study’s breadth, may yield diverse results if assessed individually. Addressing comorbidities—interdependent medical conditions—was beyond this study’s scope, but it is recommended for future large-scale research.5,20
Conclusion
In this research, we explored the potential of Ballistocardiography (BCG) for vascular health monitoring, emphasizing the importance of optimal sensor placements. Our findings suggest that BCG offers a promising non-invasive and cost-effective alternative to traditional invasive diagnostic methods. However, while the initial results are encouraging, comprehensive clinical studies are crucial to further validate BCG’s efficacy. Future investigations should prioritize high-powered controlled studies, contrasting individuals with vascular disorders against those without, to ensure a robust and clinically applicable conclusion.
Footnotes
Acknowledgments
The authors acknowledge the valuable assistance provided by Senbagavalli S and Amrutha G R in facilitating the experimentation work.
Funding
The authors disclosed receipt of the following financial support for the research in this article: Authors acknowledge Department of Science and Technology, Government of India for financial support vide Reference No. DST/TDT/TDP-10/2022 under Technology Development Transfer to carry out this work. The award receipient is Abhishek Appaji. The funding agency is not involved in any part of experimentation or analysis.
Conflicting interests
The authors declared the following potential conflicts of interest with respect to the research, authorship, and/or publication of this article: Swarna Kedia, Umesh Mohan, Madhusmita Rawooth, and Pooja Kadambi are employees of Turtle Shell Technologies Pvt. Ltd., India. All opinions presented in this manuscript belong to the authors alone and not to any institution to which they are or were affiliated.