
Abstract
Patients who are mechanically ventilated in the Intensive Care Unit participate in exercise as a component of their rehabilitation to ameliorate the long-term impact of critical illness on their physical function. The effective implementation of these programmes is limited, however, as clinicians do not have access to a patient's
Keywords
Introduction
Patients who are mechanically ventilated in the Intensive Care Unit (ICU) as a result of critical illness are often left with a range of impairments, due to the pathological effects of critical illness and its treatments on nerve, muscle cardiac and respiratory function (Guarneri, Bertolini, and Latronico, 2008). This phenomenon is known as post-Intensive Care syndrome (Myers, Smith, Allen, and Kaplan, 2016) and can include a decline in physical, psychological and/or cognitive status. More than 224000 patients are admitted to Intensive Care in the UK every year (Intensive Care National Audit and Research Centre, 2019) and only
Rehabilitation sessions while the patient is still receiving mechanical ventilation in the ICU involve progressing patients through activities such as sitting over the edge of the bed and standing and walking, and are considered to be the best way to ameliorate the impact of critical illness and its associated treatments on physical function.
The current approach to ICU rehabilitation is based on the default assumption that the metabolic cost of individual rehabilitation activities does not differ across patients and is similar to that of healthy individuals, resulting in patients receiving a broad one-size-fits-all approach to rehabilitation. This assumption, however, was shown to be invalid by Black, Grocott, and Singer (2020), who found high levels of variation in absolute exercise intensity both between patients and within patients over time. This suggests that under the current approach to rehabilitation individuals with very different physiological profiles receive similar, and often sub-optimal, exercise programmes.
Consequently, patients are often being under- or over-exercised, in the former case receiving minimal benefit from rehabilitation and in the latter being subjected to severe physiological stress. To address these issues, a scientific method for quantifying the exercise intensity level of an individual patient in real-time is required.
Exercise load during rehabilitation can be quantified by measuring a patient's rate of oxygen consumption
While
The primary contribution of this article is to develop and validate a first-of-its-kind prediction model of
The structure of this article is as follows. We begin with a presentation of the data in Section 2, followed by a discussion of the model development process in Section 3. In Section 4 we present our results before assessing predictive performance in Section 5. We conclude with a discussion in Section 6.
Background and data
Rehabilitation in Intensive Care is considered fundamental to improving physical function outcomes for patients post-ICU. During rehabilitation, patients progress through a number of activities, including sitting up in bed, sitting over the edge of the bed and standing up. A key role of the clinician in these sessions is to ensure the patient is receiving the optimal level of exercise load at a given time and is not being over- or under-exerted. For example, they may finish an activity early if they believe a patient is being exposed to too much stress, or move onto more strenuous activities if a patient appears to be receiving no benefit from an exercise.
This is a challenging task, however, as due to the heterogeneous nature of the Intensive Care population the exercise load of each activity can vary dramatically from patient to patient, and for a given patient over their stay in the ICU (Black et al., 2020).
The standard measure of exercise load outside of critical care is rate of oxygen consumption expressed as
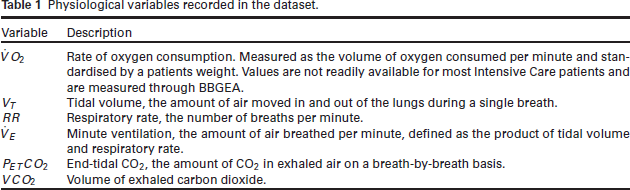
Physiological variables recorded in the dataset.
Physiological variables recorded in the dataset.
To measure
This motivates the primary objective of this work—to model and provide predictions of
In practice, breath-by-breath values of
The data are from the observational study conducted by Black et al. (2020), which used BBGEA to take measurements as mechanically ventilated ICU patients participating in various rehabilitation activities. All patients in the study had been persistently critically ill and/or mechanically ventilated for more than 7 days. BBGEA records measurements on a breath-by-breath basis, resulting in high frequency data consisting of 74332 measurements from 37 patients and 103 rehabilitation sessions. Individual measurements are therefore indexed by a continuous time index
Available physiological covariates are defined in Table 1. The data are dominated by lower values of
Finally the time since the start of the session was recorded, as well as the quality of session as assessed by the clinician running the study (classified as good, reasonable or poor), with poorer quality sessions being potentially more susceptible to measurement error in any of the physiological covariates, typically due to instability of the ventilator delivered oxygen levels and patients coughing.
Exploratory analysis
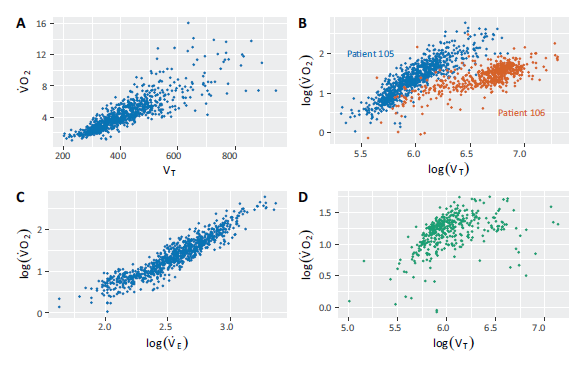
Exploratory analysis revealed a number of relationships between covariates in the data. Figure 1 features example plots of these relationships for individual rehabilitation sessions. Figure 1 (A) shows us that while there is a non-linear relationship between
Figure 1 (B) features
Relationships between
and the physiological covariates in the data, plots are colour coded by patient. (A)
against
. (B)
against
on the log-log scale for patients 105 and 106 to show the heterogeneity in the effect of
on
. (C)
against
on the log-log scale. (D)
against
on the log-log scale for patient 117, where the relationship is decidedly non-linear.
For both respiratory rate and PETCO2 there was weak evidence for linear relationships with
We briefly discuss some additional features of the data relevant to the analysis. First, patients were liable to cough during rehabilitation sessions, potentially disrupting the relationships between covariates. The effect of coughing on
Plots showing
and
over time for session 73, with disruption caused by a cough circled.
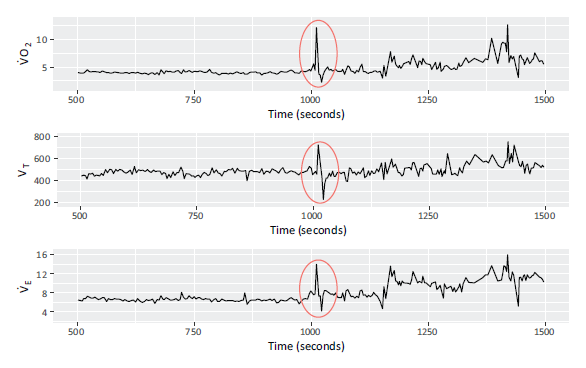
Plots showing
and
over time for session 73, with disruption caused by a cough circled.
Second, measurements were taken over time and on a breath-by-breath basis. The result is that as respiratory rate increases the rate of measurements increases and vice versa, resulting in inconsistent intervals between measurements.
The data were subject to measurement error from multiple sources. The BBGEA methodology is imperfect and may naturally lead to incorrect measurements for all the physiological covariates. The most obviously incorrect values these produced were removed from the data using set criteria, but incorrect values will still be present.
Finally, the patient population was relatively homogeneous in terms of age and BMI. Following the advice of the clinician who ran the study, two patients were removed from the analysis aged
Documented relationships already exist between
The relationship that has received the most attention in previous research is that between
The OUES is defined by the equation
Model development
We have developed a hierarchical model to predict
The model
We indicate the value of 
where
We then specify 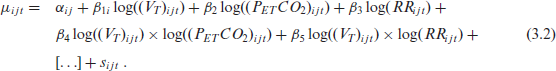
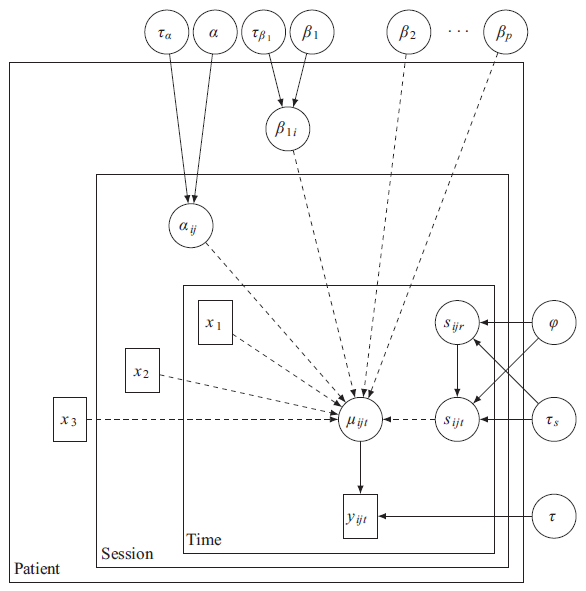
Figure 3 shows a directed acyclic graph representing the modelling assumptions. Note that in the above
A directed acyclic graph representing the model assumptions outlined in Section 3.1. Solid and dashed lines represent distributional and deterministic relationships respectively, and
and
represent vectors of covariates.
Covariates were included based on empirical findings and their clincial relevance as determined by a clinician. Although, as shown in Figure 1 (C),
All continuous covariates and
The remainder of this section is focused on defining hierarchical and temporal effects and their corresponding prior distributions to account for the structured nature of the data.
The between-patient and between-session heterogeneity in the model is accounted for through two terms in (3.2)—a session-level varying intercept term and a patient-level varying coefficient for the effect of
These individual coefficients would be unable to be inferred in a practical implementation of this model without available prior training data at the individual level. Their inclusion, however, ensures that the model accurately quantifies the uncertainty in marginal
The structured coefficients are defined as


with Normal (0,0.1) priors for
The structured intercept term in (3.3) is specified at the session-level. Figure 4 shows plots of predicted
Plots of predicted
against actual
for patient 112, coloured by session for models with individual intercepts at the patient (A) and session (B) level. There is clear between session heterogeneity in (A) which is only resolved with the session-level intercept in (B).
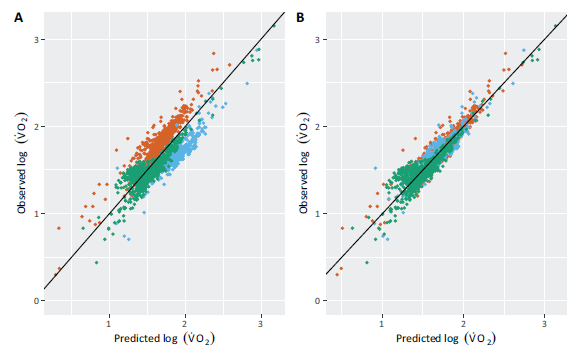
Figure 1 provides evidence for a heterogeneous relationship between
In (3.2) 
with

Further, if 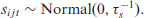
Here
Temporal dependence between observations is more commonly characterised using the discretetime analogue to the O-U process—the AR(1) process (Blangiardo, Cameletti, Baio, and Rue, 2013). The primary advantage of using the O-U process in this setting is that it naturally accounts for irregular intervals between observations, which arise from breath-by-breath measurements.
The specified model is subject to measurement-level variance from both the temporal effects and the iid error terms. Special cases of the model can be derived by: dropping the temporal effects and assuming observations within the same session are independent conditional on their covariates; setting
We will refer to the model including both the O-U process and Gaussian error as the full model and the special cases as the O-U only and iid error models. We consider all three models at the validation stage of the analysis, in Section 5.4.
Inference
There are two primary inferential challenges presented by this model. First, the varying intercept and
INLA approximates the marginal posterior distributions of interest via repeated, nested Laplace approximations and numerical integration over a low-dimensional hyperparameter space. In contrast to simulation based methods, the comparatively low cost of the Laplace approximations means the dimension of certain posteriors (such as those induced by the inclusion of temporal effects as outlined in Section 3.1.2) can grow with the number of observations with only a minor impact on computation time.
Numerical intergration over the hyperparameters means that complex dependencies between parameters and hyperparameters can be dealt with effectively albeit at the cost of enforcing that the dimension of the hyperparameters is low.
Oxygen uptake efficiency slope model
The previous state-of-the-art approach to this problem was a model developed based on the OUES (Section 2.2) and fitted using the
Let 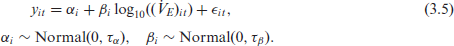
where
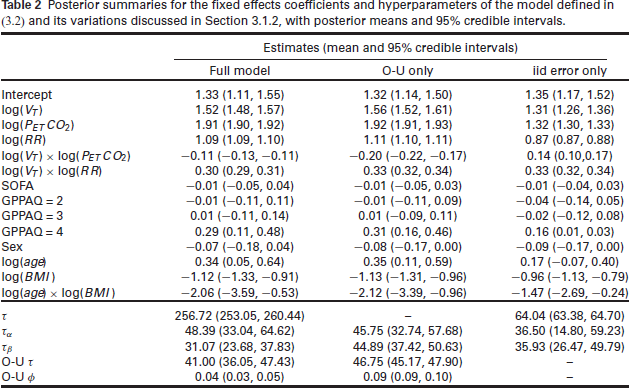
Table 2 shows posterior summaries for hyperparameters and the fixed effects for the full model, model with only the O-U process and the model with only the iid error terms. The posteriors for the coefficients of the physiological covariates indicate that the effect of each covariate on
Posterior summaries for the fixed effects coefficients and hyperparameters of the model defined in (3.2) and its variations discussed in Section 3.1.2, with posterior means and
credible intervals.
Posterior summaries for the fixed effects coefficients and hyperparameters of the model defined in (3.2) and its variations discussed in Section 3.1.2, with posterior means and
credible intervals.
The fixed effect marginal posteriors for the full and O-U only models are very similar, however the effect sizes of
It was noted in Section 2.1.2 that some of the covariates were potentially subject to an unknown degree of measurement error, with the clinician running the study able to classify rehabilitation sessions as poor, reasonable or good depending on the potential for this error to occur. If this measurement error is large enough, it may adversely effect the predictions of the model.
In the supplementary material we re-fit the model to a subset of the data excluding poor quality sessions and another smaller subset excluding both poor and reasonable quality sessions. A similar technique is commonly seen in study meta-analysis (Valentine, 2009). The resulting posteriors show no noticeable changes in the locations of the posteriors for the covariate effects or hyperparameters.
Validation
In this section we internally validate the predictive ability of the model. This is done, first, through in time posterior predictive checks, to understand how the model performs given maximal information, and then second, using leave-one-patient-out cross-validation to understand how the model performs in realistic conditions.
Posterior predictive checks
To perform posterior predictive checks in light of hierarchical and temporal structure we re-fit the model except for data from session
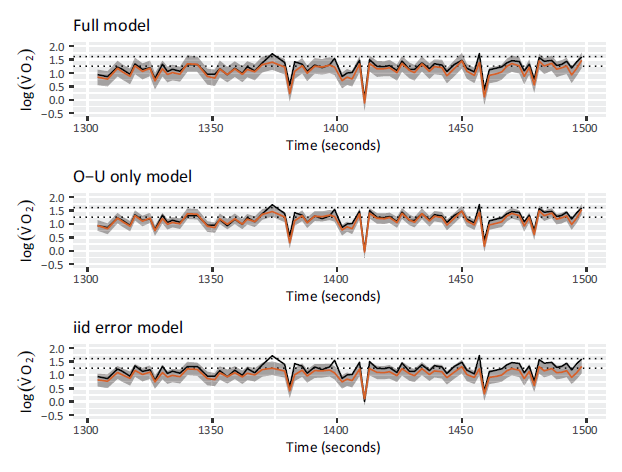
The outcome of these checks for patient 137 are shown in Figure 5, with observed (black) and predicted (red) values of
An example of posterior predictive checks using cross-validation in time for patient 137, for the three specifications of the latent Gaussian process. Orange lines indicate predicted
values with corresponding predictive intervals in grey. Black lines show the observed
values. Dotted lines represent the boundaries between rest and low, and low and medium exercise intensity classifications. Predictions are worse in the model excluding the O-U process and the inclusion of the iid error increases the predictive uncertainty.
Further, we note that the O-U only model has lower predictive uncertainty compared to the other models, which we believe is due to reduced flexibility when excluding the iid error term. We discuss the impact of model specification on posterior predictive uncertainty further in the Section 5.4.
In 2.1.2 we noted that patients coughing induces spikes in
The remainder of this section is dedicated to assessing how the model would perform under realistic conditions.
In practice, a clinician would require
Leave-one-patient-out cross-validation
To conduct cross-validation observations were left out at the patient-level, to account for similarity between observations within patients and prevent leakage. This resulted in 35 sets of observations to assess on re-fitted models. These were fit using the same specification as previously used.
Here the model is unable to learn individual coefficients, increasing the uncertainty in the classifications. Given that clinicians would not have access to
To obtain the posterior predictive densities for each point, 1000 samples were generated from the posterior of the model fit to data excluding each patient in turn. These samples were then used to make predictions for the excluded patient via the posterior predictive distribution, fully quantifying the uncertainty in the predictions.
Probabilities for each category were then easily generated using the proportion of samples from the posterior predictive density that fell into that category and, as this is the information that would be available to clinicians in practice, we classified the observations based on the category with the highest probability assigned to it.
Validation results
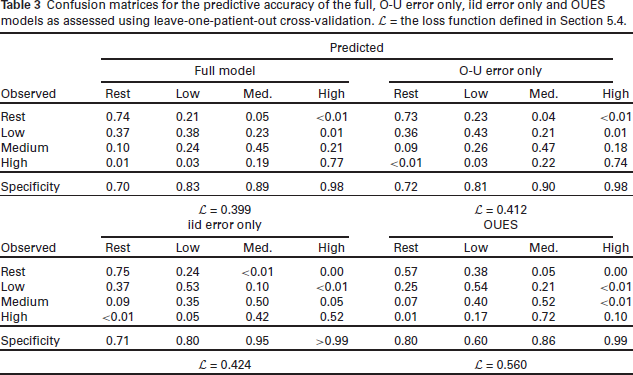
Table 3 presents the results of the cross-validation for the three Bayesian models and the current state-of-the-art OUES model. The performance of the models is quantified using a loss function
Confusion matrices for the predictive accuracy of the full, O-U error only, iid error only and OUES models as assessed using leave-one-patient-out cross-validation.
the loss function defined in Section 5.4.
Confusion matrices for the predictive accuracy of the full, O-U error only, iid error only and OUES models as assessed using leave-one-patient-out cross-validation.
the loss function defined in Section 5.4.
All three Bayesian models outperform the OUES model in terms of the loss function, with the fully specified model the best of the three. The models incorporating the O-U process have the best performance in terms of the loss function and noticeably higher accuracy for observed high observations in comparison to the iid error only model and the OUES model, with the drop-off in accuracy in the second model being particularly dramatic (10% vs. 77% in the full model).
We note that the OUES model has slightly higher accuracy than the Bayesian models for observed low values, however the specificity for low classifications is only 60% compared to 80–83% in the Bayesian models. This suggests this increase in accuracy is due to the model predicting low more often rather than the model having an improved ability to predict low
Compares predicted (with 95% credible intervals) values of
from the full model and observed values for two example sessions, one where the model performs well (session 15) and one where it performs poorly (session 109). Dashed lines indicate the boundaries between exercise intensity classifications.
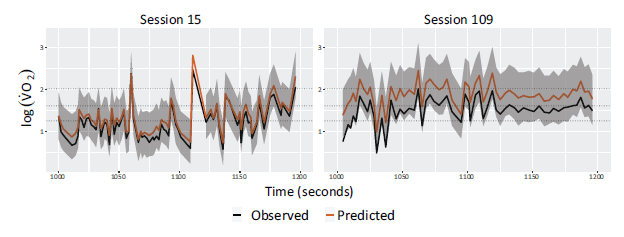
To further understand model performance we directly examined the predictions for
Probabilistic predictions
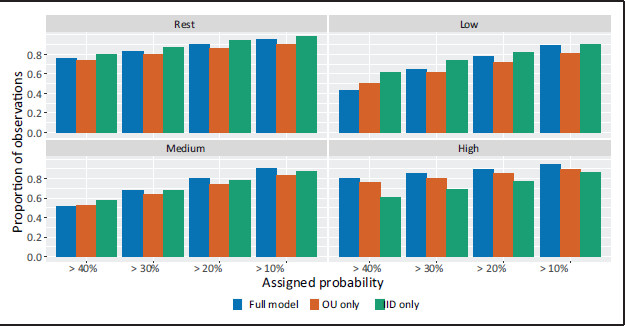
Until now, we have primarily assessed the single classifications provided by the model. Probabilistic statements about the classifications are also given, however, and these may carry important information for clinicians. In Figure 7 we assess the usefulness of this information by showing the number of observations within each category that the model assigns probabilities above a certain threshold. Heuristically, this is a way of assessing when the model considers the correct classification to be 'plausible', based on a set probability threshold for plausibility.
Graphs by observed exercise intensity category for the full model (blue) model with iid errors (red) and the iid error only (green) showing the proportion of observations for which the model considers the correct classification plausible, based on different plausibility thresholds.
Graphs by observed exercise intensity category for the full model (blue) model with iid errors (red) and the iid error only (green) showing the proportion of observations for which the model considers the correct classification plausible, based on different plausibility thresholds.
This is a weaker condition than seen in Table 3 and we naturally see a larger number of observations assigned as plausible. For example, at the 20% threshold for plausible observations, 84.3%, 81.7% and 83.0% of observations are plausible in the full, O-U and iid models respectively when averaging over classifications. This benefit is most notable for the Low and Medium categories, where over 80% of observations are assigned as plausible for the 20% threshold.
For resting and low observations the iid error only model marginally outperforms the full model and both models perform better than the model with only the O-U process. For medium observations, the full model performs best, but all three models have similar performance. Crucially, for high observations the full model, and to an extent the O-U only model outperform the iid only model.
To see how this information would be used in practice we can consider how a clinician would apply the output of the model. To avoid risks of over-exertion, a clinician may in practice apply an informal decision rule to lower a patient's exercise load once the probability they are at high intensity crosses a certain threshold.
This aligns exactly with the information showcased in Figure 7 where, given the rarity of high
This is only one example of how the full information from this model may be utilised and in practice a variety of rules may be implemented. It does indicate, however, that the full potential of the model is only realised once probabilistic statements about classifications are fully utilised.
We have developed and internally validated a first-of-its-kind prediction model for exercise intensity in mechanically ventilated Intensive Care patients, using Bayesian hierarchical modelling and covariates that are readily available in the majority of Intensive Care settings.
The model revealed a high level of heterogeneity between exercise rehabilitation sessions, meaning that resulting classifications based on using point estimates alone had an accuracy of 58.4%. The usefulness of the model dramatically increases in practical situations when the full information from the posterior distribution is utilised, in the form of probabilistic statements about classifications, allowing clinicians to make the correct decision around 90.0% of the time if appropriate decision rules are adopted.
We have presented three feasible Bayesian models based on various assumptions on the measurement-level variance, the best performing of which is the fully specified model with both an O-U process and iid Gaussian error. Without this temporal structure, the model is unable to reliable classify high values of
In practice application of the method presented here should be restricted to patients who are sufficiently similar to the sample used to develop the model, specifically patients over 50 years of age who have been mechanically ventilated for at least 7 days.
The ultimate aim of the modeling work presented here is the creation of a practical tool that can be widely implemented in critical care environments (although further data collection and external validation in clinical settings would be needed for this). The model here returns live predicted classifications of a patient's level of exercise intensity on a breath-by-breath basis, allowing clinicians to use this tool to provide personalised rehabilitation sessions by reactively increasing or decreasing the level of exercise, therefore optimising the benefit received from these sessions.
Supplemental material
The supplemental materials include additional exploratory data analysis, an extended description of established physiological relationships between covariates in the data, model results from additional models fit during model development and the results of the analysis using a smoothed version of the data. They are available from the journals page at https://journals.sagepub.com/home/smj .
Supplemental Material for A Bayesian hierarchical model for predicting rates of oxygen consumption in mechanically ventilated intensive care patients by Luke Hardcastle, Samuel Livingstone, Claire Black, Federico Ricciardi and Gianluca Baio, in Statistical Modelling
Footnotes
Acknowledgements
We would like to thank the editor, associate editor and two anonymous referees whose comments lead to a much improved manuscript. We would like to thank the UCL CHIMERA group, and in particular Professor Christina Pagel and Professor Rebecca Shipley for their invaluable comments and feedback.
Declaration of Conflicting Interests
The authors declared no potential conflicts of interest with respect to the research, authorship and/or publication of this article.
Funding
LH acknowledges support from EPSRC grant number EP/W523835/1 during part of this work. This work forms part of the research activity of the ESPRC UCL CHIMERA hub for Mathematics in Health Care (Grant number EP/T017791/1). CB was funded by a National Institute for Health Research Clinical Academic Training Fellowship. This report presents independent research funded by the NIHR. The views expressed are those of the author(s) and not necessarily those of the NHS, the NIHR, or the Department of Health.