
Abstract
Online surveys mostly replaced other well-established survey data collection methods. However, online surveys often result in low response rates and face other recruitment limitations, especially when it comes to rare populations. Thus, survey researchers and practitioners increasingly consider social media platforms for recruiting participants. Although social media recruitment provides access to an untapped and diverse participant pool, there are no best-practices or protocols ensuring sound participant recruitment. In this study, we contribute to the current state of research by investigating the effects of social media ad design on ad performance (e.g., survey completions), recruitment costs (e.g., costs per survey completion), and platform user engagements (e.g., number of comments). This is done in a cross-national research setting using social media ads that were launched in Germany and the USA in 2023. Our findings show differences across ad designs and countries. Although costs per survey completion are substantially higher for the USA, ads with strongly topic-related images result in the lowest costs per survey completion in Germany and the USA. At the same time, ads with strongly topic-related images result in the highest number of comments in both countries. Finally, our study provides novel insights into the design of social media ads for online survey recruitment in a cross-national research setting and offers valuable information on their effectiveness, efficiency, and monitoring and moderating demands.
Keywords
Introduction and research questions
With the rise of online surveys, the collection of survey data has undergone a major transformation. Compared to other established survey methods, such as in-person and telephone interviews, online surveys offer significant advantages in terms of cost- and time-efficiency (Callegaro et al., 2015; Schober, 2018). However, they also present new challenges, including low response rates (Daikeler et al., 2020; Lozar Manfreda et al., 2008) and sampling biases (Revilla & Höhne, 2020). Participant recruitment remains especially difficult when no sampling frames exist (Schonlau & Couper, 2017), forcing both survey researchers and practitioners to rely on non-probability samples, such as online access panels or river sampling approaches. While these methods are much more affordable than probability-based sampling, they still require substantial financial and time investments prior to fieldwork and data collection. For example, this includes finding and hiring an online panel, reconciling questionnaire programming and testing, setting specific thresholds when it comes to participant characteristics, and transferring fieldwork metrics and survey data.
Social media platforms, such as Facebook, present a promising way for efficiently recruiting online survey participants (see Zindel, 2023 for a detailed review of existing research). Social media recruitment is based on digital ads – comprising a brief text, an image or video, and an online survey link – to invite platform users to participate in online surveys. These ads can be launched at any time without much time in advance (Pötzschke et al., 2023). When clicking on the link in the ad, users are directed to the online survey for participation. Importantly, ads on these platforms can be targeted to specific participant groups, creating a form of quota sampling. Thanks to the billions of platform users, social media recruitment offers an easy and efficient way to access a broad and diverse group of participants, including hard-to-reach or uncommon populations, such as individuals with specific health conditions or sexual minorities (Kühne & Zindel, 2020; Pötzschke et al., 2023; Zindel, 2023).
Despite growing interest in social media recruitment, best practices for ad design remain unclear and there is a lack of empirical-driven fieldwork guidelines or protocols. In particular, little is known about whether and to what extent ads should include images that are thematically related to the online survey topic or not (Donzowa et al., 2025). This is accompanied by a lack of studies informing about ad performance (e.g., survey completions) and recruitment costs (e.g., costs per survey completion). Moreover, existing research has largely ignored user engagements with social media ads (e.g., number or content of comments). This is surprising for at least three reasons. First, user engagements are likely to affect ad performance by encouraging or discouraging other users to click on the ad for online survey participation. Second, user engagements with ads need to be monitored throughout the fieldwork (Kühne & Zindel, 2020) to, for example, detect (and delete) hateful comments. Third, the quantity (e.g., number of comments) and quality (e.g., disapproval of the survey topic) of user engagements may serve as a control measure for the recruitment campaign and potentially signal problematic ads or other fieldwork issues. Finally, only a few studies have examined social media recruitment across countries (Donzowa et al., 2025; Zindel et al., 2023). One exception is the cross-national study by Donzowa et al. (2025) reporting that the design of social media ads indeed affects data quality in terms of attrition, item-nonresponse, and non-differentiation.
This study addresses the previously described gaps in the survey literature by investigating social media recruitment in a cross-national context. Using data from two identical online surveys that were simultaneously conducted through Facebook ads in Germany and the USA in 2023, we examine (1) ad performance, (2) recruitment costs, and (3) user engagements with ads across different image designs. The online surveys dealt with immigration and climate change and were promoted through images with a strong relation, loose relation, or no relation (neutral design) to these topics. Unlike previous studies, we also analyze social media engagement data, such as ad-related comments. We address the following three research questions (RQs):
How do strongly topic-related, loosely topic-related, and neutral images in social media ads in Germany and the USA differ with respect to … … ad performance? (RQ1) … recruitment costs? (RQ2) … user engagement? (RQ3)
Addressing these research questions provides practical insights into the optimization of ad design for social media campaigns in the context of participant recruitment. Specifically, our findings contribute to a better understanding of campaign effectiveness (performance, RQ1), campaign efficiency (recruitment costs, RQ2), and fieldwork monitoring and comment moderation (user engagements, RQ3). Its cross-national scope distinguishes it from previous studies, making a valuable contribution to comparative survey research.
This study also contributes to the growing survey methodological discourse on social media recruitment. While the literature emphasizes its potential and describes its specific areas of application (Pötzschke et al., 2023; Zindel, 2023), systematic investigations of the effects of social media campaign characteristics on fieldwork outcomes and data collection efficiency remain rare. At the same time, this study offers a starting point for a discussion of a more active role of survey researchers and practitioners in the data collection process. Specifically, this includes aspects of interactions between researchers and platform users in case of comments that consist of offensive content and hate speech.
Method
Data collection and participant recruitment
We conducted two self-administered online surveys, recruiting participants through Facebook ads displayed in users’ newsfeeds. The first online survey took place in Germany from June 25, 2023, to July 2, 2023, while the second one, featuring the same questions translated into English, took place in the USA from June 25, 2023, to July 3, 2023. Both online surveys focused on immigration and climate change. Each ad consisted of an image, a brief text-based invitation to participate in the online survey, and a link directing users to the online survey. On the first online survey page, participants received information about the study procedure, topic, expected duration of the online survey, and adherence with existing data protection laws and regulations. Participation was voluntary without the provision of any incentives.
Ad images
We tested three types of Facebook ads, which differed only with respect to the image used: Images that were strongly related to immigration or climate change (strong topic-relation), images that were loosely related to immigration or climate change (loose topic-relation), and images with no relation to immigration or climate change (neutral design). In both countries, we launched ads featuring six strongly topic-related images, six loosely topic-related images, and three neutral images. The same images were used in Germany and the USA, except for two images containing text (German vs. English) and two images featuring flags (EU vs. USA) that were adapted for each country. Figure 1 presents examples of the ad images for Germany, the USA, and both countries. The Supplemental Online Material 1 (SOM1) includes an overview of the remaining images used in this study. Examples of the images used for the Facebook ads. Note. The ads included the following text (USA version): “Your opinion is wanted! Take our short online survey on the diversity of attitudes and opinions in the USA and be part of a nationwide study!”.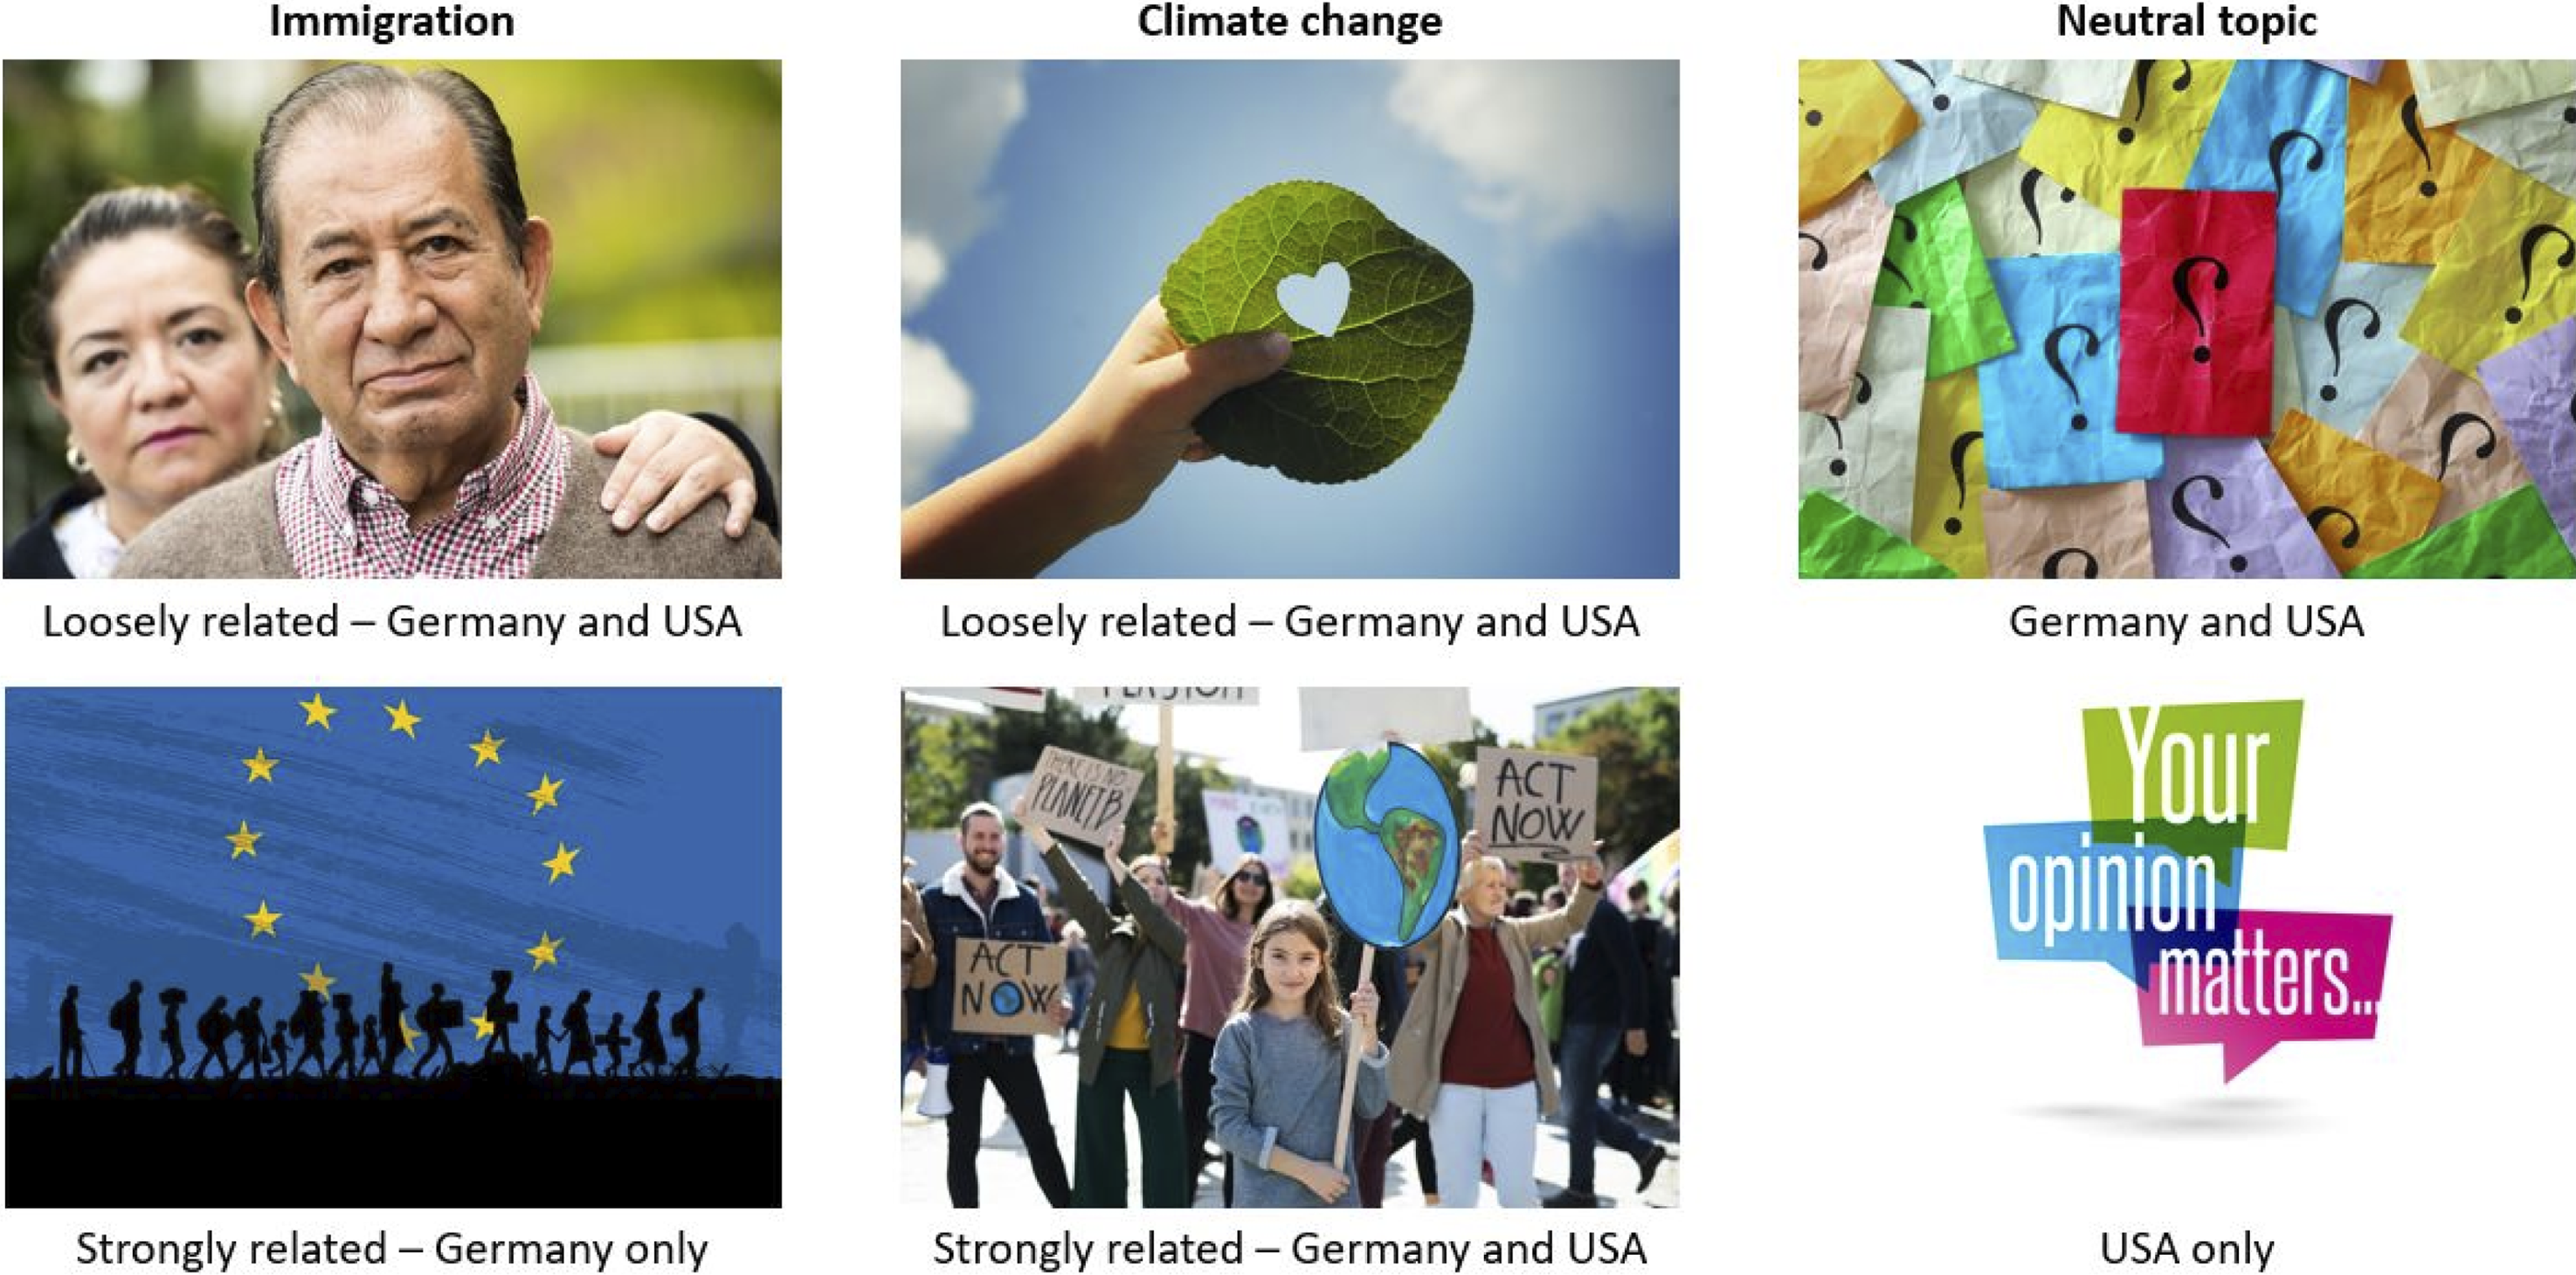
We utilized a three-step approach to select the ad images (see Donzowa et al., 2025). First, we compiled an initial set of 73 images from AdobeStock (https://stock.adobe.com/) and iStock (https://www.istockphoto.com/). Second, we conducted a survey among expert researchers in our scientific network, asking them to classify each image as strongly topic-related, loosely topic-related, or not topic-related. Third, we conducted a social media campaign pretest using the images in Facebook ads for participant recruitment. To assess image performance, we calculated the ratio of unique user accounts reached to link clicks for each ad. Based on these results, we selected the top six strongly topic-related, the top six loosely topic-related, and the top three neutral images for the final study.
Analysis
In a first step, we analyze ad campaign and online survey metrics: ad performance in terms of numbers of unique user accounts reached, unique link clicks, survey starts, and survey completions as well as recruitment costs in terms of total costs, costs per unique user account reached, unique link click, survey start, and survey completion. Moreover, we look at user engagements with ads in terms of number of likes, reactions, shares, saves, and comments. Importantly, for each of these metrics, we report mean values across neutral, loosely, and strongly topic-related ads.
In addition, we retrieved the comments from all Facebook ads using the Meta Graph API, yielding 301 comments from Germany and 580 comments from the USA. To this end, we authenticated with the API using a personalized access token to retrieve ad content. We then sent a GET request to the appropriate endpoint to obtain comments associated with the specific ads. In return, we retrieved structured data in the JSON format. The retrieved comments were manually coded by a student assistant: (1) “Positive survey reactions” (e.g., “Excellent survey”), (2) “Negative survey reactions” (e.g., “This survey is just a scam”), (3) “Topic reactions” (e.g., “Our country is doomed”), (4) “Offensive content” (e.g., “Fuck you liberal assholes”), and (5) “Unrelated content and nonsense” (e.g., “Uh oh!”). For comments that exclusively contained images or graphic interchange formats (GIFs) instead of text, we used an additional code: (6) “Images and GIFs.” Importantly, we utilized an inductive coding approach and developed the coding scheme based on the data instead of using preconceived codes. If a comment matched multiple categories, multiple codes were assigned. The second author re-coded a random subset of 10% (n = 88) of the comments. In case of disagreement, the second author and the student assistant reached a consensus through discussion, resulting in refined coding instructions. Based on the refined instructions, the student assistant went through all comments again and assigned the final codes.
Given the comparative nature of the study, we report results descriptively using frequencies, costs (Euro), and percentages. For replication purposes, all data and analysis code are available through Harvard Dataverse (see https://doi.org/10.7910/DVN/C9AK3G).
Results
In Germany, 71,609 user accounts were reached by the online survey ads. Of these, 5,720 users clicked on the link and visited the first online survey page. In total, 4,170 participants started the online survey by proceeding to the second page, and 2,495 participants completed the entire online survey. The overall costs for the Facebook ads in Germany were 890 Euros. In the USA, in contrast, 149,183 user accounts were reached by the online survey ads. Of these, 10,832 users clicked on the link and visited the first online survey page. In total, 5,469 participants started the online survey by proceeding to the second page and 2,520 participants completed the entire online survey. The overall costs for the Facebook ads in the USA were 3,457 Euros 1 . We provide further information on the German and USA samples in the Supplemental Online Material 2 (SOM2).
Ad performance, recruitment costs, and user engagements for Germany and the USA.
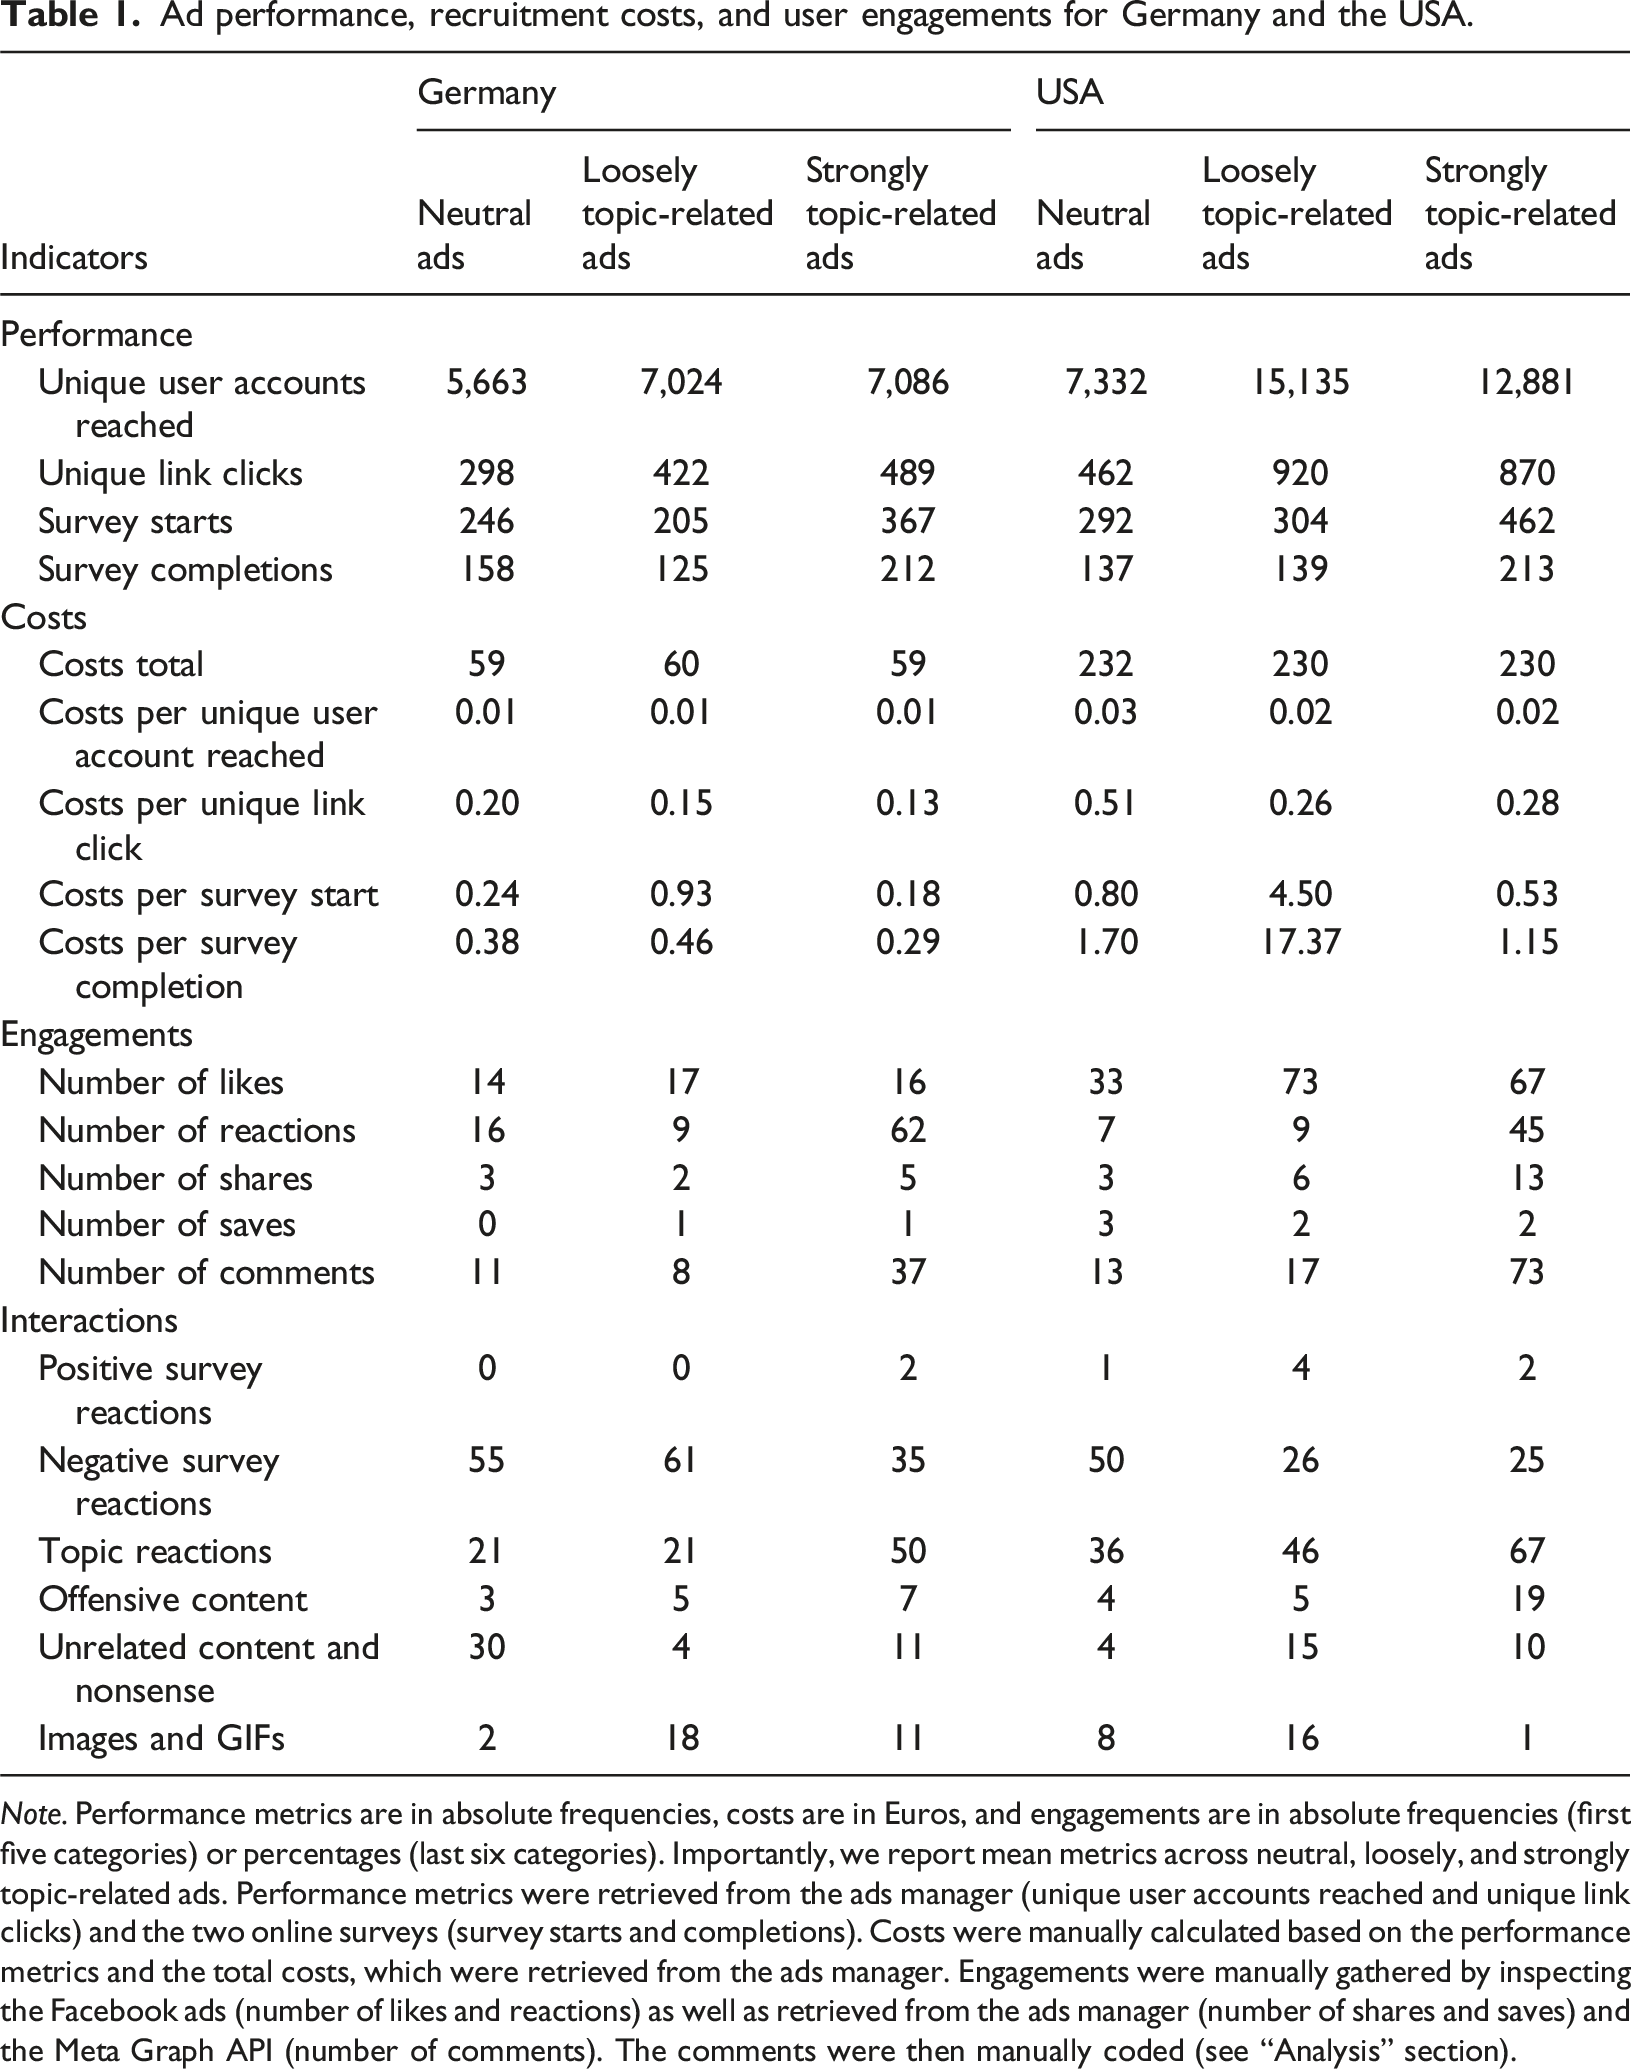
Note. Performance metrics are in absolute frequencies, costs are in Euros, and engagements are in absolute frequencies (first five categories) or percentages (last six categories). Importantly, we report mean metrics across neutral, loosely, and strongly topic-related ads. Performance metrics were retrieved from the ads manager (unique user accounts reached and unique link clicks) and the two online surveys (survey starts and completions). Costs were manually calculated based on the performance metrics and the total costs, which were retrieved from the ads manager. Engagements were manually gathered by inspecting the Facebook ads (number of likes and reactions) as well as retrieved from the ads manager (number of shares and saves) and the Meta Graph API (number of comments). The comments were then manually coded (see “Analysis” section).
When it comes to recruitment costs the total costs are similarly high across ad designs, but they are substantially higher for the USA. In Germany, the costs per link click differ between 13 Cents (strongly topic-related ads) and 20 Cents (neutral ads), whereas in the USA, the costs per link click differ between 26 Cents (loosely topic-related ads) and 51 Cents (neutral ads). The costs per survey start and completion are highest for loosely topic-related ads in both countries. However, in the USA, both metrics are extraordinarily high: 4.50 Euros (survey start) and 17.37 Euros (survey completion). The reason is that two loosely topic-related ad images only achieved very few survey starts and completions. When excluding these two ads, the costs per survey start and completion drop to 53 Cents and 1.16 Euros, respectively. Importantly, in both countries, the costs for survey completions are lowest for strongly topic-related ads.
User engagements in terms of likes do not vary much across ad designs in Germany. In the USA, in contrast, the number of likes increases from 33 (neutral ads) to 73 (loosely topic-related ads). The number of reactions is highest for strongly topic-related ads in both countries. In addition, the number of shares and saves are rather low in both countries with a peak of 13 shares for strongly topic-related ads in the USA. Finally, the number of comments is highest for strongly topic-related ads in Germany and the USA. In the USA, however, the number of comments is about twice as high as in Germany.
While there are almost no positive survey reactions across ad designs in both countries, there is a high percentage of negative survey reactions. The percentage of topic reactions is highest for strongly topic-related ads (Germany and USA). In contrast, in Germany, neutral ads result in the highest percentage of unrelated content and nonsense. In both countries, the percentage of offensive content is highest for strongly topic-related ads, while the USA shows an overall higher percentage of offensive content. Images and GIFs are most common for loosely topic-related ads in Germany and the USA.
Discussion and conclusion
This study aimed to assess the performance, recruitment costs, and user engagements of social media ads used for recruiting online survey participants. To answer our three research questions, we analyzed data from two Facebook-recruited online surveys on immigration and climate change that were conducted in Germany and the USA. The ads featured images with a strong relation, loose relation, or no relation (neutral design) to the online survey topic. Our findings show the importance of careful image selection for social media ads and shed light on cross-national recruitment differences.
Our first research question examined ad performance in terms of user accounts reached, link clicks, survey starts, and survey completions. Social media ads with strongly topic-related images convince through high campaign effectiveness, as they result in the highest number of survey starts and completions. This similarly applies to Germany and the USA. One possible explanation is that such images are more salient and resonate more effectively with users. However, we urge survey researchers and practitioners to keep in mind that if some specific subgroups are more likely to resonate with ads than others, this can increase the self-selection bias inherent to convenience or river sampling approaches (Lehdonvirta et al., 2021). For example, ads with strongly topic-related images on immigration may especially attract participants with preconceived and extreme attitudes towards immigration, potentially leading to sample imbalances that limit substantive conclusions. We therefore recommend systematically examining sample composition across ad designs before substantive data analysis and considering potential differences during results interpretation.
Regarding our second research question on recruitment costs, we analyzed total costs, costs per user account reached, link click, survey start, and survey completion. Our findings align with those on ad performance. Strongly topic-related images yielded the most cost-effective recruitment, producing the lowest cost per survey start and completion in both Germany and the USA. Users with strongly preconceived or extreme attitudes may be more likely to take part in online surveys dealing with specific topics. These participants might also be more willing to complete online surveys, ensuring that their opinions are represented. This underscores the importance of investigating the association between participant characteristics and ad design. Importantly, this does not only apply to the investigation of participant characteristics, such as age, education, and gender, but also to survey motivation and political attitudes, as these variables can significantly shift survey outcomes and completion rates.
Our third research question focused on user engagements with the ads including likes, reactions, shares, saves, and comments. Strongly topic-related images generated the highest number of reactions and comments in both countries. However, analyzing the content of the comments retrieved from the corresponding Facebook ads revealed a substantially higher percentage of negative survey reactions than positive survey reactions. In Germany, this is more common for neutral and loosely topic-related images, whereas in the USA this is more common for neutral images. In addition, topic reactions and offensive content are more common for strongly topic-related images, with a higher level in the USA than in Germany. From our perspective, these findings are of high value for survey researchers and practitioners considering online survey recruitment through social media platforms. On the one hand, survey and topic reactions inform online survey design, field work strategies, and topic framing, allowing for continuous improvement of online survey methodology. On the other hand, the presence of offensive content shows the need for active fieldwork monitoring and comment moderation. This is especially true as social media platforms, such as Facebook and Instagram, intend to reduce internal content moderation (The New York Times, 2025). We therefore strongly recommend that researchers allocate sufficient (human) resources to detect and manage offensive content throughout data collection, particularly when running large-scale, cross-national ad campaigns. In addition, offensive comments serve as early indicators of self-selection bias, suggesting that ads with strongly topic-related images disproportionally attract participants with preconceived or extreme attitudes. We therefore advocate for monitoring and, if necessary, moderating problematic comments by, for example, deleting or hiding them (Russomanno et al., 2019; Waling et al., 2022).
While our study provides valuable insights, it has several limitations that offer directions for future research. First, we exclusively focused on Facebook recruitment. Other social media platforms, such as Instagram and TikTok, also offer advanced advertising and targeting tools. We therefore recommend investigating ad performance, recruitment costs, and user engagements across different platforms. Cross-platform investigations can shed light on further challenges that may not be identified yet. Second, our study examined rather polarizing topics. It remains unclear whether and to what extent our findings hold for less polarizing topics. Investigating effects of topic sensitivity on social media recruitment outcomes would be a valuable next step. For example, a more systematic investigation of images in social media ads with respect to topic sensitivity helps to take a clear position on ad design and informs about the “real” challenges of user engagement. Third, the performance, recruitment costs, and user engagements of ads are co-dependent on Facebook’s internal algorithms. Although we held all aspects of our ad design constant, except for the image, it is impossible to fully isolate the effect of the ad images from Facebook’s internal ranking mechanisms.
By investigating ad performance, recruitment costs, and user engagements in a cross-national research setting, this study contributes to our understanding of online surveys recruited through social media. Importantly, it clearly shows that different ad designs are associated with similar effectiveness and efficiency levels across Germany and the USA. In addition, it shows that analyzing the comments of users is a crucial endeavor, as we found evidence for offensive content in both countries. We therefore urge survey researchers and practitioners not to neglect user engagement, as it is a highly valuable source of information. Even though ads with strongly topic-related images convince through high performance and low recruitment costs, they come with higher ad monitoring demands. This trade-off must be taken into account when designing social media ads for online survey recruitment.
Supplemental Material
Supplemental Material - Social media ads for survey recruitment: Performance, costs, user engagement
Supplemental Material for Social media ads for survey recruitment: Performance, costs, user engagement by Jan Karem Höhne, Joshua Claassen, Simon Kühne, Zaza Zindel in International Journal of Market Research.
Footnotes
Ethical consideration
The study presented in the manuscript was conducted in accordance with established ethical standards. The online survey received ethics approval form the Ethics Council of Bielefeld University (Application Nr. 2022–209).
Consent to participate
Online survey participation was voluntarily, and participants’ informed consent was obtained. All participants’ data was treated anonymously.
Funding
This study was partly funded with support from the Max Planck Institute for Demographic Research (MPIDR) in Rostock, Germany, which is part of the Max Planck Society.
Declaration of conflicting interests
The authors declared no potential conflicts of interest with respect to the research, authorship, and/or publication of this article.
Data Availability Statement
The data and analysis code are available for replication purposes via Harvard Dataverse (see “Analysis” section).
Supplemental Material
Supplemental material for this article is available online.