
Abstract
Keeping respondents engaged through various life stages is an important part of any longitudinal survey or panel. For older-aged respondents, two such transitions are retirement and declining health. We use the Household, Income, and Labour Dynamics in Australia (HILDA) Survey, a household panel survey collecting data since 2001, to examine the representativeness of sample members across three age groups: 55–64, 65–74, and 75 and over. We first examine the response rates, item non-response and the coverage of individuals in nursing homes. We then compare population estimates from the HILDA Survey to those from a range of official sources covering demographic, labour market, and health domains. We find that the response rates are reasonably high, with a notable drop in the two oldest cohorts during the COVID-19 pandemic. Item non-response is low and does not vary greatly by age. The coverage in nursing homes is very dependent on access and the individuals being able to provide an interview. We find overall strong alignment to official statistics for these three cohorts. A notable exception is health status, where the HILDA Survey respondents report lower levels of health, likely due to advantageous panel conditioning.
Introduction
Longitudinal surveys or panels involve repeated data collection from the same people over an extended period. They are crucial for studying ageing, the impact of life events, and evolving needs, preferences and behaviours over time. It is important to successfully keep respondents engaged so that accurate and reliable insights can be obtained across the life span.
The representativeness of the older-aged longitudinal sample members, in particular, is a significant concern due to initial wave non-response, attrition and cognitive decline. Non-response in the initial wave in this segment of the population, like cross-sectional surveys, may occur due to poor health, cognitive impairment, or lack of interest (Davies et al., 2010; Dibartolo & McCrone, 2003; Herzog & Rodgers, 1988). Attrition may then occur over time due to institutionalisation, relocation, or worsening health (Chatfield et al., 2005; Lugtig, 2014; Michaud et al., 2011; Watson & Wooden, 2009). Both initial wave non-response rates and attrition rates typically increase from around age 65 (Herzog & Rodgers, 1988; Lynn, 2018). Non-response and attrition lead to reductions in the sample size but when it is non-random it also leads to biases in the survey results. Further, cognitive decline over time may affect the respondent’s ability to provide accurate data. Previous studies examining item non-response have found that it generally increased with the age of the respondent and was associated with poor physical, cognitive, and psychological functioning (Colsher & Wallace, 1989; Gu, 2008).
These concerns can be mitigated in several ways. Weights are often used in analyses to adjust for non-response and attrition based on response modelling and known population characteristics (Lynn & Watson, 2021). Survey managers may also oversample in the initial wave or add refreshment samples to allow for the impact of non-response on the sample size or to maintain representativeness (Watson & Lynn, 2021). Further, some surveys employ the use of proxy interviews with a spouse, other relative or care giver to capture responses for the sample member (Weir et al., 2011).
Researchers using longitudinal data must carefully assess and address potential biases in their analyses and interpretations to effectively use the data to examine a wide range of often interconnected economic, demographic, health and social issues.
Comparing longitudinal surveys with contemporary official statistics can yield useful insights into the cumulative effects of non-response and attrition on the overall representativeness of the sample and highlight potential gaps and deficiencies. Analyses of various health and retirement studies provide some insights into the areas of concern for older-aged individuals. A comparison of the US Health and Retirement Study (HRS) to social security administrative data showed the distribution of earnings and benefits to be very similar overall, though some differences were identified for those with low-incomes (Meijer & Karoly, 2014). Using the HRS linked with Medicare records, Weir et al. (2011) finds that in the early years of the study there was no difference in the rates of dementia between respondents and non-respondents. However, a gap appears in the later years with respondents having better cognition than non-respondents. They also analyse the English Longitudinal Study of Ageing (ELSA) in the same way and find much greater differences between respondents and non-respondents. They conclude that part of the reason for fewer differences in the HRS sample is because of the much greater use of proxy interviews. Using the Chinese Longitudinal Healthy Longevity Survey, Gu and Dupre (2008) find that self-reported chronic disease prevalence rates are similar or higher than the official statistics, suggesting the quality of self-reports is high.
In this paper, we examine the data quality and representativeness of older-age sample members in a household panel survey in Australia. The Household, Income and Labour Dynamics in Australia (HILDA) Survey is similar to other household panels conducted in other countries (e.g., Germany, UK, US, Switzerland, China and Korea) which begin with a representative cross-sectional sample of the population and follows those individuals (and their households) through time. These studies typically employ multiple survey modes for the main interview component and often include a self-completion supplement. The HILDA Survey is primarily face-to-face with a self-completion supplement. Somewhat similar are the aging studies, such as HRS and ELSA, which screen households to identify those with a person over a particular age (e.g., 51) and follow them and their partner over time. While ELSA employs face-to-face interviewing along with a self-completion questionnaire, the HRS rotates the sample through telephone or face-to-face interviewing to collect physical and biological measurements along with a self-complete supplement when the interview is face-to-face (Institute for Social Research, 2017; NatCen Social Research, 2020). While most applicable to the household and ageing panels, the results from this study of the data quality and representativeness of the older-aged individuals in the HILDA Survey may also help inform the design and analyses of other panel studies wanting to represent this segment of the population.
Using the HILDA Survey which started in 2001, we assess four measures of data quality of three older-aged cohorts (aged 55–64, 65–74, and 75 and over). These measures are re-interview rates, response to the self-completion questionnaire (SCQ), item non-response, and the coverage of individuals in nursing homes. The representativeness of the three cohorts is then examined by comparing a range of demographic, employment and health estimates to four external data sources collected by the Australian Bureau of Statistics (ABS): the Census; the General Social Survey (GSS); the Multipurpose Household Survey (MPHS); and the National Health Survey (NHS). The GSS, MPHS and NHS are expected to provide good benchmark estimates for the three older-age cohorts as the data collection methods are similar to those used in the HILDA Survey. The Census is expected to provide good key demographic estimates. Other Census estimates may not be as good as the other ABS data sources due to differences in collection methodologies. All survey estimates used in these comparisons are weighted and standard errors account for the respective complex sample designs. The weights used for the ABS Surveys adjust for the probabilities of selection and non-response. Similarly, the cross-sectional weights used for the HILDA Survey estimates also adjust for the probabilities of selection, initial wave non-response, attrition and the inclusion of the refreshment sample in 2011 (Watson, 2012).
Data
Data sources
Comparison of survey features of the different sources.
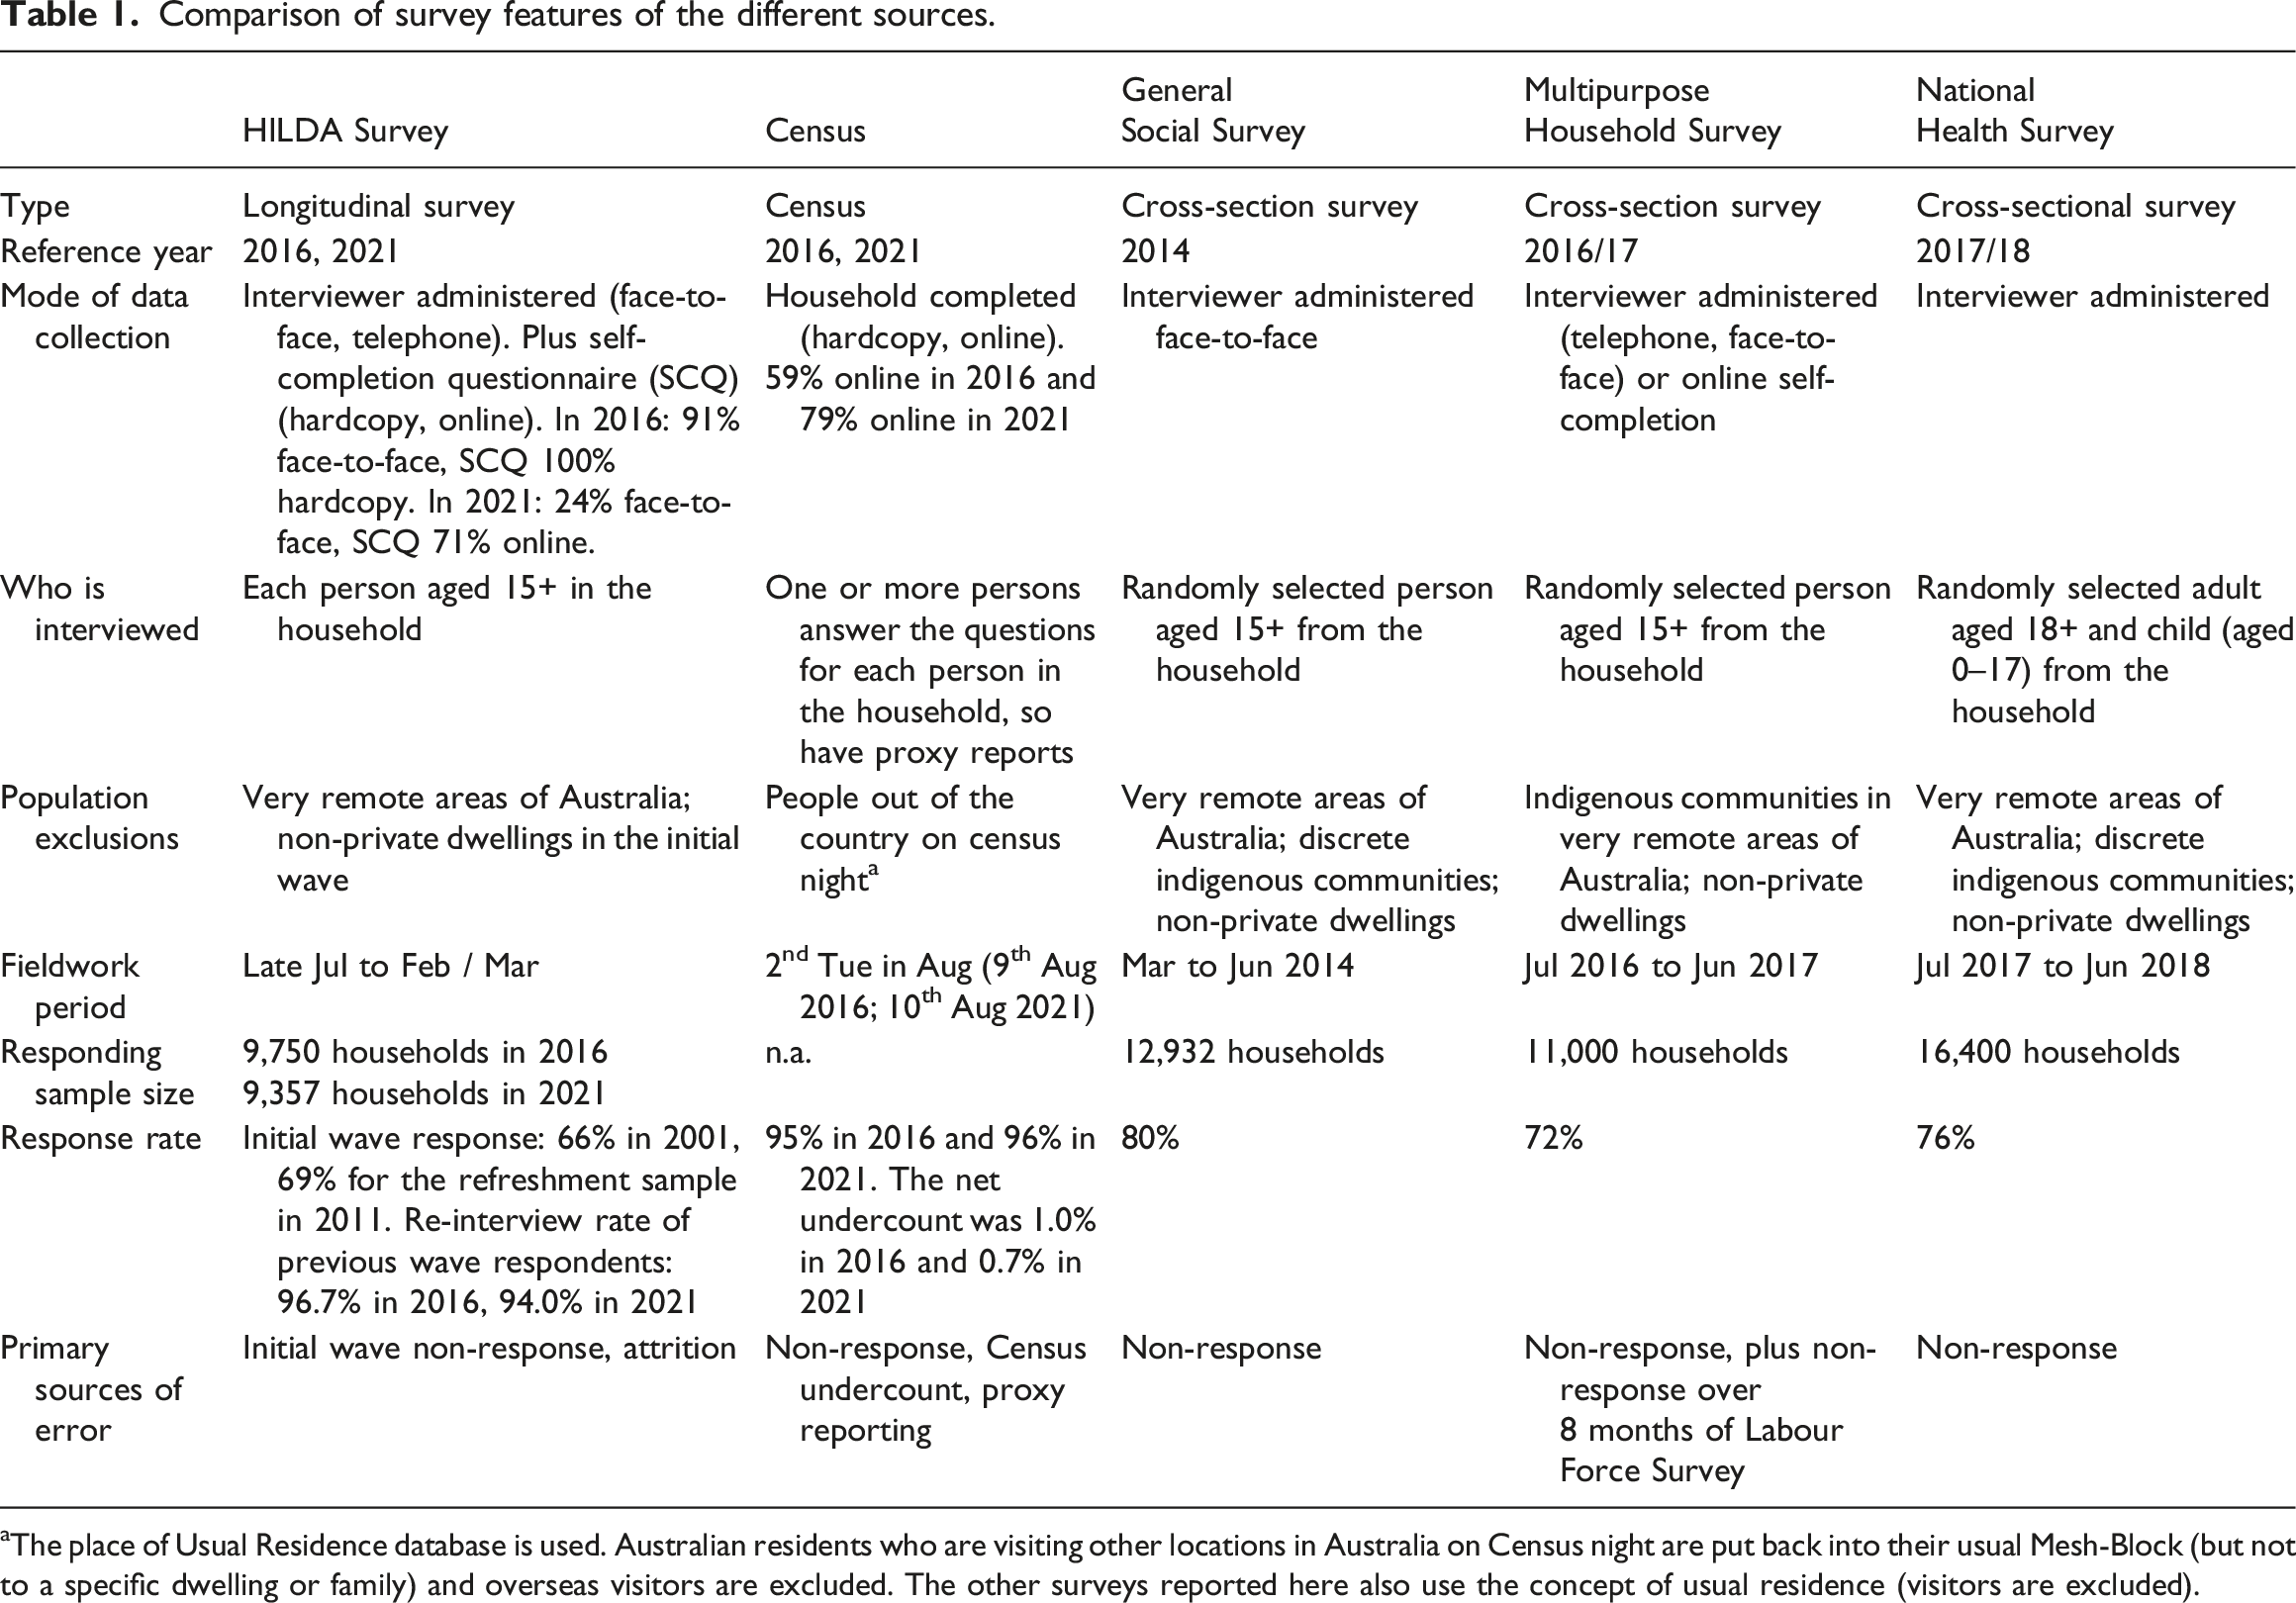
aThe place of Usual Residence database is used. Australian residents who are visiting other locations in Australia on Census night are put back into their usual Mesh-Block (but not to a specific dwelling or family) and overseas visitors are excluded. The other surveys reported here also use the concept of usual residence (visitors are excluded).
The HILDA Survey is a nationwide household panel survey that started in 2001 (DSS and Melbourne Institute, 2022; Summerfield et al., 2022). Annual interviews are conducted with all household members aged 15 years and over (proxy interviews are not used). These interviews are typically conducted face-to-face. A self-completion questionnaire is also completed in addition to the individual interview. The HILDA Survey sample has a multi-stage, stratified and clustered design with 7,682 responding households in wave 1 and a response rate of 66%. The sample was restricted to usual residents in private dwellings (i.e., not in institutions such as nursing homes) and excluded people in very remote areas. The wave 1 responding households incorporated 19,914 individuals (13,969 respondents, 1158 non-responding adults, 4787 children) who are tracked and interviewed over time. The sample is extended in subsequent waves to include other members of their household that were not part of the initial sample. If sample members subsequently move into an institution or very remote areas they are followed and interviewed where possible. 1 The sample was extended in 2011 with another general population sample which added 2,153 responding household with a response rate of 69%. By international standards, the HILDA Survey has one of the highest re-interview rates (Watson et al., 2018). For the original sample, the re-interview rates rise from 87% in 2002 (wave (2) to 96% or higher in 2009–2020 and was 94% in 2021. 2 For the refreshment sample, the re-interview rates rise from 92% in 2012 to 95% or higher for 2015 to 2019 and was 94% in 2020 and 2021.
The Australian Census of Population and Housing (referred to as the “Census”) occurs every five years on the second Tuesday in August. The estimates are drawn from the 2016 and 2021 Census. One or more persons in each household fills in the Census form on behalf of others in the household. In 2016, 59% of households completed the form online compared to 79% in 2021 (Harding et al., 2022). The dwelling response rate is very high (95% in 2016, 96% in 2021) and the net undercount is small (1.0% in 2016, 0.7% in 2021) (Harding et al., 2017, 2022). The ABS adjusts the Census figures for this undercount.
The General Social Survey (GSS) is a repeated cross-sectional survey conducted every four years on a range of topics similar to the HILDA Survey. The estimates are drawn from the 2014 survey, conducted from March to June. The GSS sample represents people living in private dwellings, excluding those in discrete indigenous communities or very remote areas. Smaller states and lower socio-economic areas are oversampled. One person aged 15 and older was randomly selected from each household, resulting in 12,932 interviews and a response rate of 80% (Australian Bureau of Statistics, 2015).
The Multipurpose Household Survey (MPHS) is conducted each financial year (July to June) as a supplement to the ABS’ monthly Labour Force Survey (LFS). It collects information on labour-related topics (such as barriers to the labour force, work, retirement, and qualifications) and other social topics (such as crime victimisation, physical activity, and use of technology). Each month one eighth of the households in the LFS are rotated out of the survey and around 80% of these household are then selected for the MPHS. After completing the LFS (by any responsible adult in the household), a person aged 15 years and over is randomly selected and is asked the additional MPHS topic questions in a personal interview. A response rate of 72% was achieved for the 2016/17 survey yielding approximately 11,000 interviews (Australian Bureau of Statistics, 2017).
The National Health Survey (NHS) is conducted every three years. The 2017-18 is conducted across the financial year and represents people living in private dwellings excluding those in discrete indigenous communities and those living in very remote areas. One adult (aged 18 and over) and one child (aged 0–17) were randomly selected from each household. A response rate of 76% was achieved yielding 21,300 interviews (Australian Bureau of Statistics, 2018).
Methods
Data quality measures
Several measures of data quality are considered in this paper. The first two measures focus on response rates. One way to examine the re-interview rates (aside from the annual re-interview rates mentioned earlier) is to calculate the proportion of the 13,969 sample members initially interviewed in wave 1 that are interviewed each wave, excluding people who have died or moved abroad. This indicates how engaged the sample members are with the study over time. Unfortunately, eligibility for each wave is not always known. Amongst the sample members where contact could not be made or no follow-up is attempted (i.e., due to past refusal, permanently incapable, lost after a move, etc.) some will have died or moved abroad. It is therefore important to adjust for unknown eligibility, particularly deaths, when considering response rates for the older-age cohorts. If this is not done, unknown eligibility will be treated as non-response and will disproportionately affect the response rates calculated for the older-age cohorts. Death registry matching of the HILDA Survey sample occurred early in 2014, and resulted in an additional 265 deaths being identified among the wave 1 respondents by wave 13 (Watson & Summerfield, 2014). Since then, no other adjustment has been made. To provide a more realistic response rate, we impute deaths of sample members in 2014 or later after their last known contact through the application of life table data. Moving abroad is expected to be a much smaller issue for the older-age groups and detailed permanent emigration statistics are not available.
A probabilistic method using age- and sex-specific death rates from official life tables is used to flag cases that are likely to have died (Australian Bureau of Statistics, 2022). These death rates are calculated by the ABS as the proportion of persons dying between age x and x+1, averaged over three years, and denoted as p
x
. These rates are used to calculate the probability of death between wave t and t + n for a person aged x at wave t: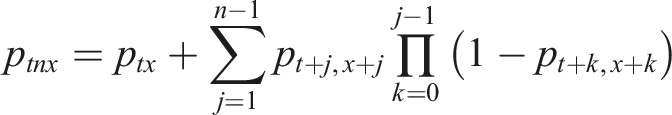
For example, the probability of a death between wave 13 and 16 is the sum of the probability of a death between wave 13 and 14, the probability of a death between wave 14 and 15 for those who survive to wave 14, and the probability of a death between wave 15 and 16 for those who survive to wave 15. Death rates, such as these, from official sources have been successfully demonstrated to correct for unknown eligibility in the construction of longitudinal weights for the HILDA Survey and the British Household Panel Survey (Sadig, 2014; Watson, 2016).
The re-interview rates of wave 1 respondents are calculated for each 10-year age cohort followed over time to 2021, both before and after imputing deaths.
The second measure of respondent engagement is the percentage of people interviewed who also return the self-completion questionnaire (SCQ). This is measured by 10-year age group each wave from 2001 to 2021.
The third measure of data quality is the level of item-missingness. This is measured for the core questionnaire content over the six most recent waves (relating to 2016–2021) which aligns with the waves used in the comparisons to official statistics (increasing the number of waves included would reduce the common set variables due to questionnaire changes over time). Item non-response rates are provided for those aged 15–34, 35–54 years, and the three older-age groups of particular interest to this paper: 55–64, 65–74, and 75 and over.
Finally, we assess the success of tracking people into nursing homes and compare a weighted estimate for the number of such people against Australian Institute of Health and Welfare data for 2016 and 2021. As individuals in nursing homes are not given a cross-sectional weight in the HILDA Survey, the weight that is used is the longitudinal weight for the pair of waves where the individual was in a private dwelling in one wave and a nursing home in the next and are not flagged as a death (imputed or non-imputed) by 2016 (or 2021 as appropriate).
Comparison of estimates
To assess the representativeness of the HILDA Survey’s older-age cohorts, a range of estimates for three cohorts are compared to ABS estimates. The estimates include: • Demographic variables – sex, state, indigenous status, marital status (in a registered marriage), partnered status (i.e., married or de facto), and year of arrival. • Employment variables – employment status, retirement status. • Health variables – health status, smoking status, body mass index, self-perceived body mass, and whether has a specific long-term medical conditions (asthma, arthritis or osteoporosis, cancer, diabetes, heart disease, depression, and anxiety).
External sources compared to HILDA survey estimates.
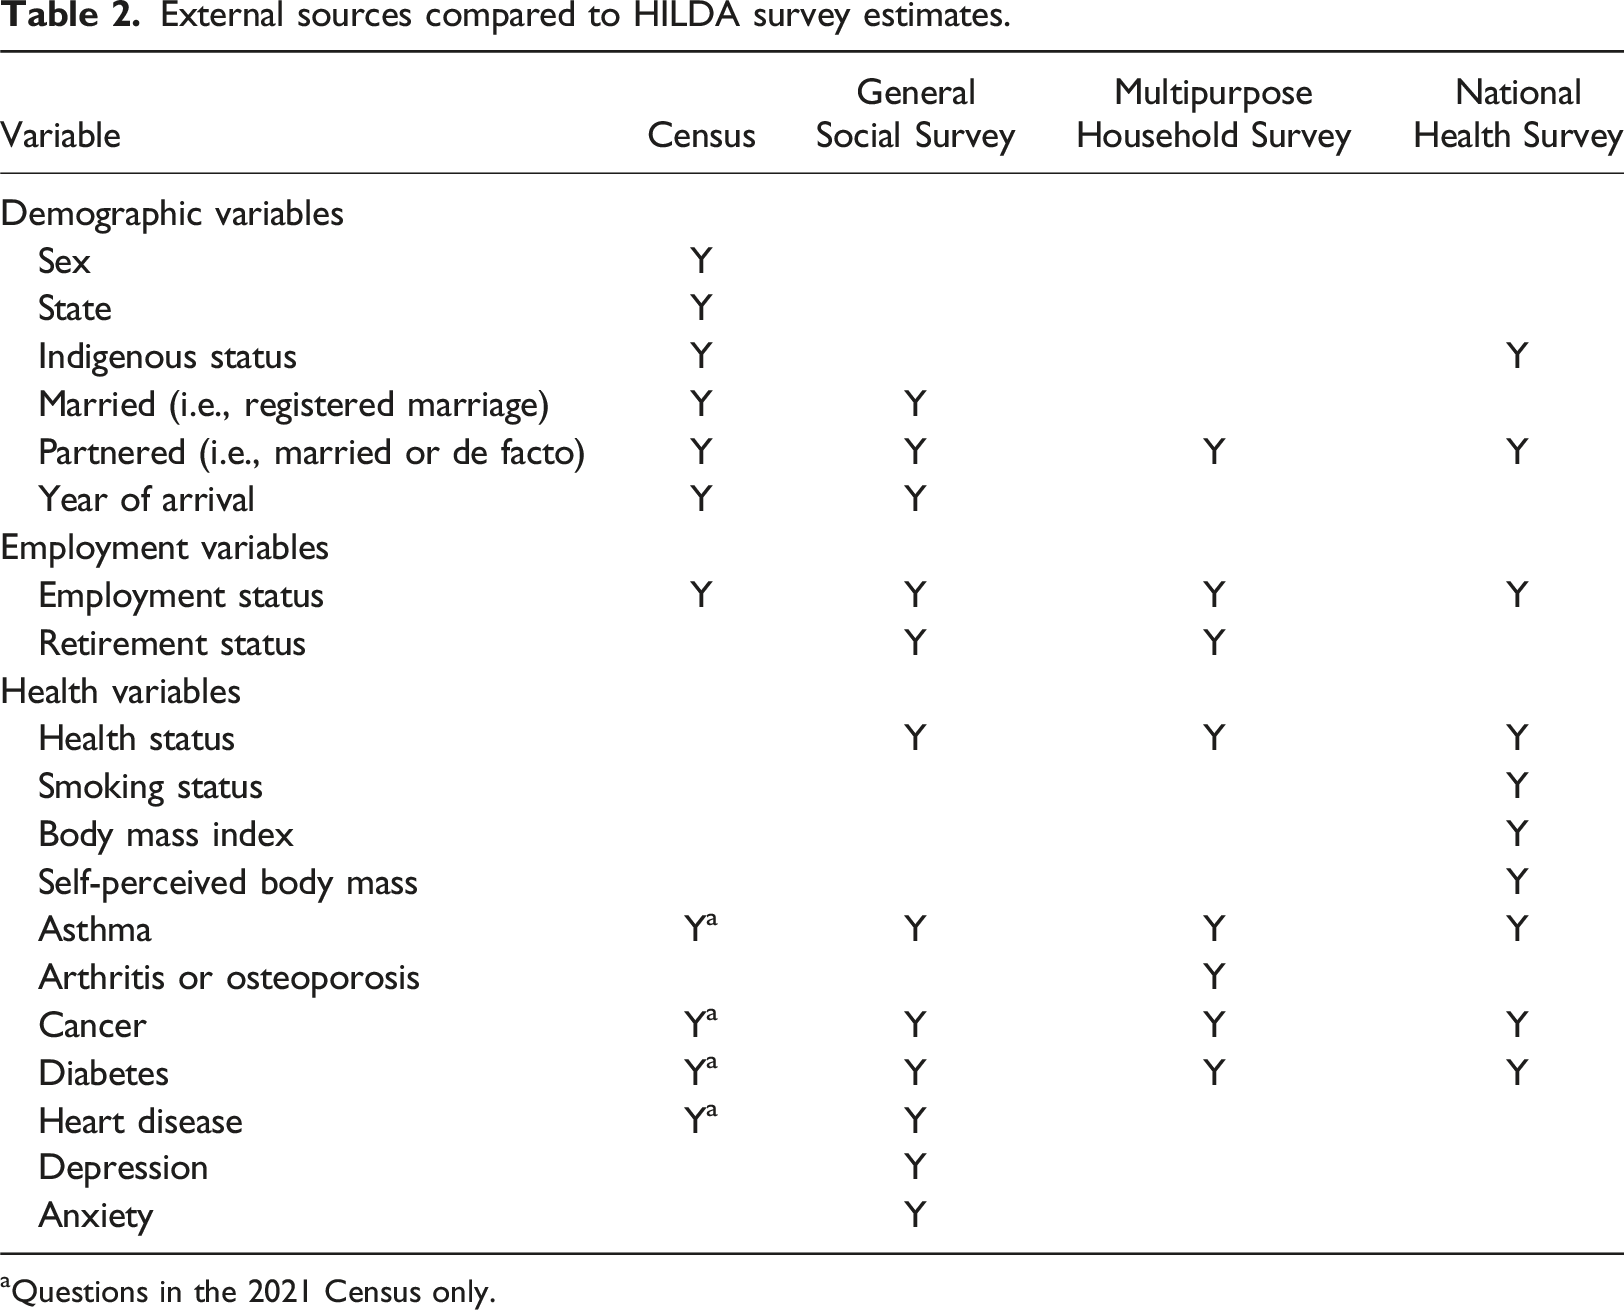
aQuestions in the 2021 Census only.
When comparing two estimates, 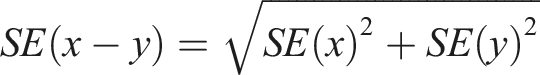
This standard error is used to calculate the 95% confidence interval of the difference between the HILDA estimate and the ABS estimate. Obviously, when the comparison is to the Census estimate, the standard error of the difference is simply the standard error of the HILDA Survey estimate.
Results
Response rates
The re-interview rates of wave 1 respondents for 10-year cohorts are given in Figure 1 (exact numbers are provided in Table A2 in the Appendix). As shown in the figure on the left, those initially aged 35–64 have the highest re-interview rates over the 21 waves. Also, those aged 65–74 in wave 1 have very high re-interview rates for the first 15 years, but then their response rates start to fall substantially. For those initially aged 75 and over, their response rates are the lowest of all age groups from wave 12 (at which stage they would be aged 86 and over). The low rates for the oldest groups are partly due to only excluding known deaths from the denominator of the response rate formula. Once deaths are imputed among sample members where there is no longer contact, the response rates are substantially improved (as shown in the right graph). Re-interview rates of wave 1 respondents over 21 years, before and after imputing deaths.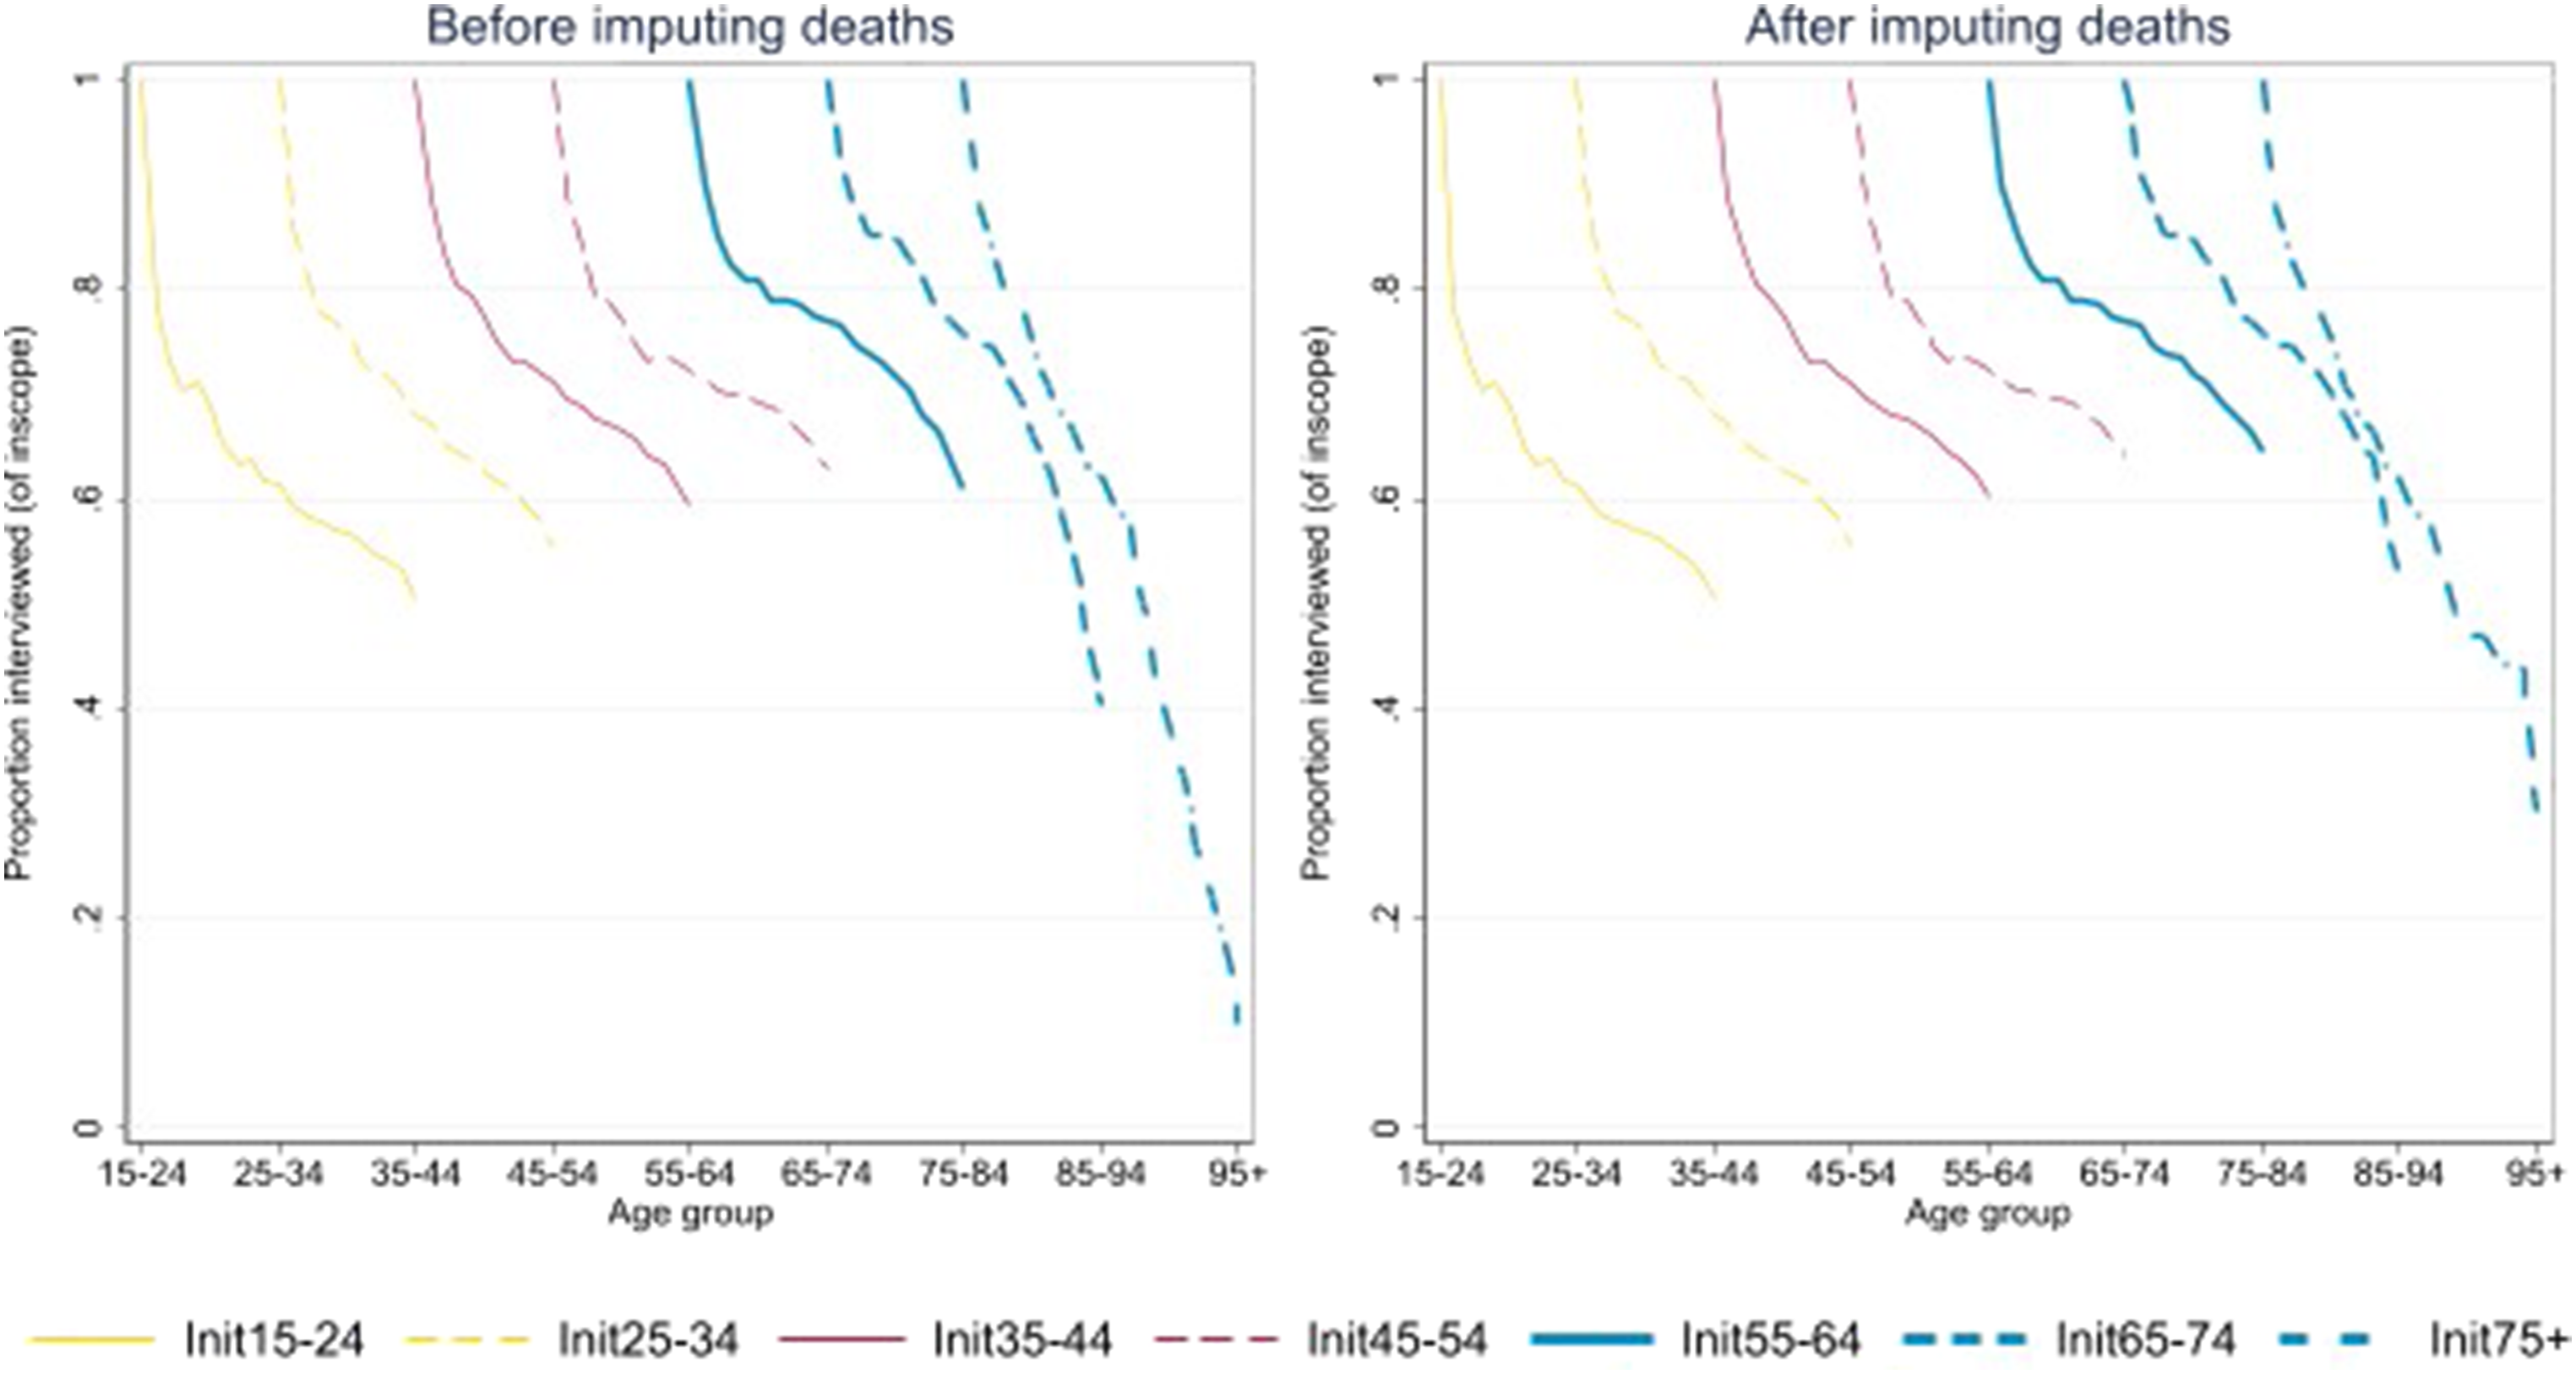
By wave 21, the number of deaths inferred by this process is 343 (being 79 people initially aged 55–64, 150 people initially aged 65–74 and 114 people initially aged 75 and over (this represents an increase of 21%, 25% and 17% respectively from the known deaths in these cohorts). There are fewer imputed deaths in the oldest age group because the 2014 death register matching would have identified many of the missing deaths at that time. It is also worth noting that in the waves conducted during the COVID-19 pandemic (wave 20 and 21), the response rates for the two oldest groups were lower than what might otherwise be expected given the trend in previous waves. This suggests that the greater use of telephone interviews during the pandemic (96% in wave 20 and 76% in wave 21) made it harder for the older sample members to participate.
In addition to the individual interview, respondents are asked to complete the SCQ. The proportion of respondents in each age group completing the SCQ is provided in Figure 2. Age is now measured as at 30th June each year, rather than their initial age in wave 1 as in Figure 1. People aged 55–74 have a fairly consistent SCQ response rate of around 95%, which is higher than other age groups. For those aged 75 and over, the SCQ response rate gradually declined from 91% in wave 1, reaching a low point in wave 11 of 86%, and then gradually improved to 93% in wave 21, somewhat similar to the changes in response seen for those aged 35–54. Those aged 75 and older may find the SCQ harder to complete than those aged 55–74 due to visual or cognitive impairments, physical limitations or fatigue. Various changes to the SCQ process have been made over time to increase the response rate, such as providing the SCQ when appointments are made for the individual interview rather than just after the interview (from wave 6), offering a prize draw (from wave 12), and adding an online option and a cash incentive (from wave 20). This has helped improve the response rates for many age groups (Summerfield et al., 2022; Watson & Wooden, 2015). Response rate to Self-Completion Questionnaire, by age group.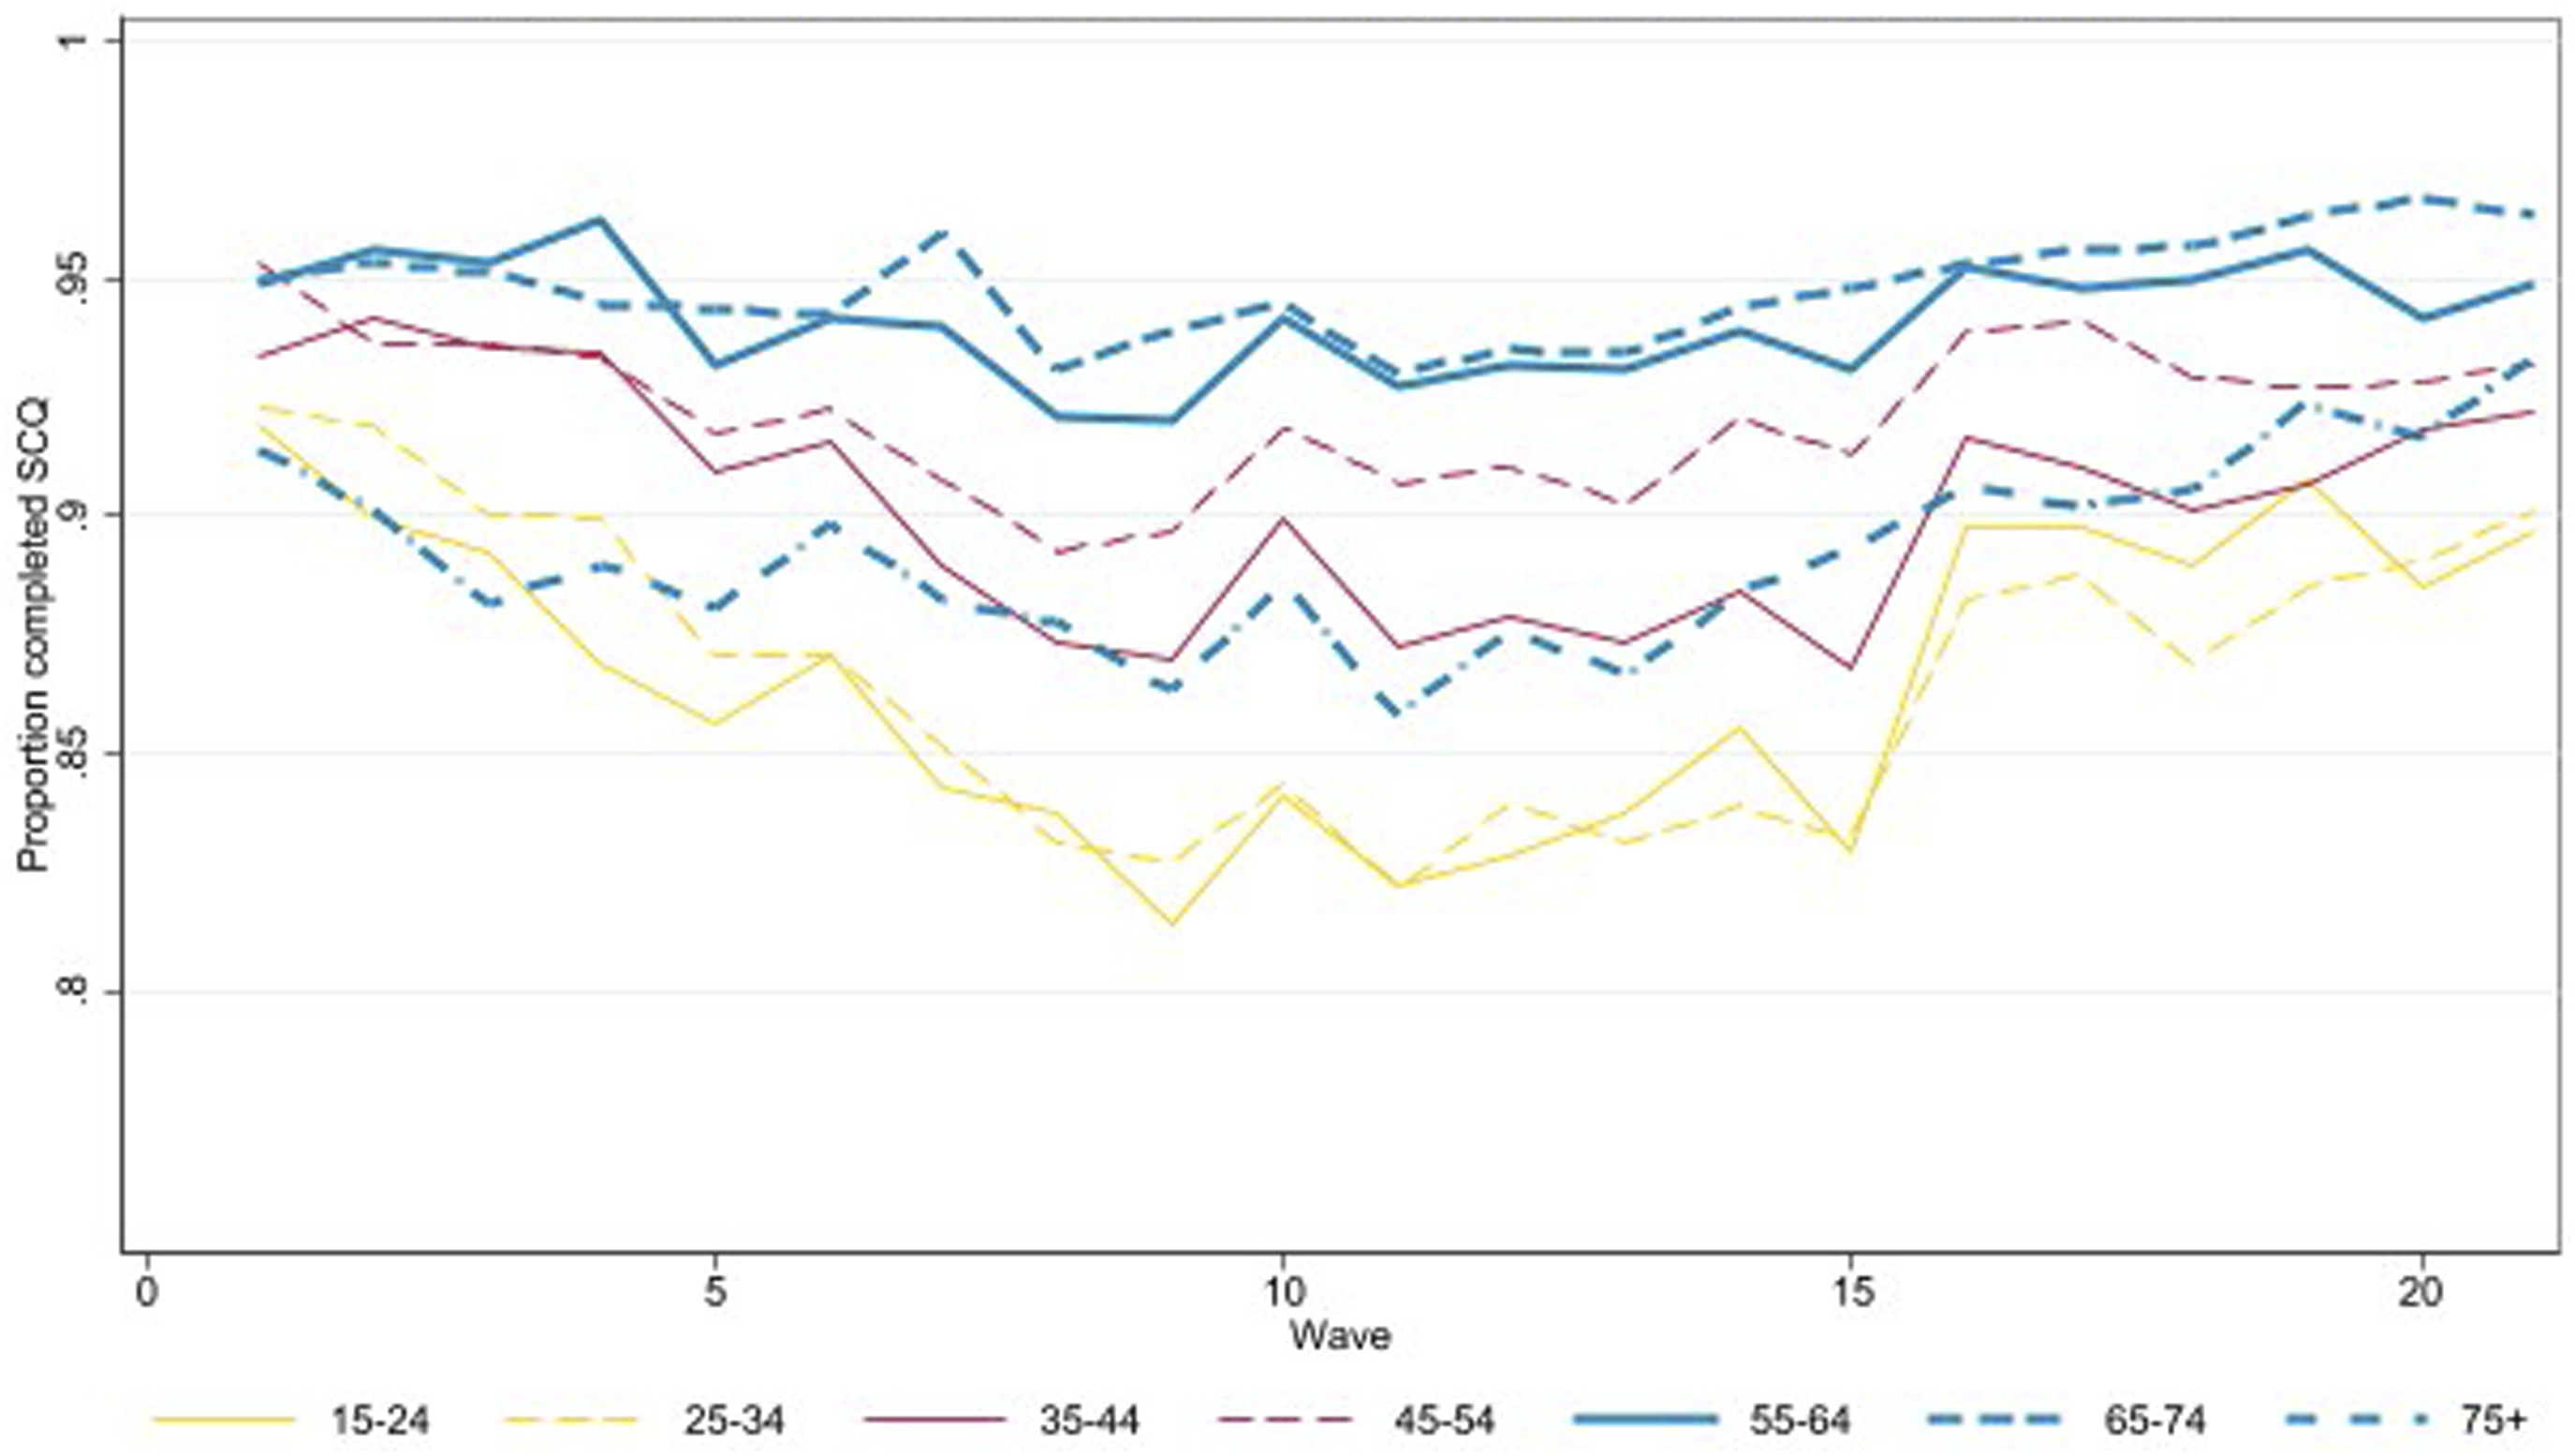
Item non-response
The next aspect of data quality we focus on are the item non-response rates. Figure 3 shows the average item non-response rates for the three older-age groups across waves 16 to 21. There are lower rates of item missingness in the individual interview (averaging 0.5% for those aged 55–64, 0.7% for those aged 65–74, and 0.6% for those aged 75 and over) compared to the SCQ (averaging 1.7%, 2.8% and 2.2% respectively). The topics with a higher rate of missingness cover children, health and finances. There is no clear pattern for missingness with respect to age: each age group have one or more topics they have a higher rate of missingness than other age groups. Regression analysis shows that there is a higher rate of missingness in the individual interview as people get older, for males, and those with low levels of education.
3
Missingness in the SCQ was similar but there was also a higher rate of missingness with low income. Proportion missing values for each section of the questionnaire, by age.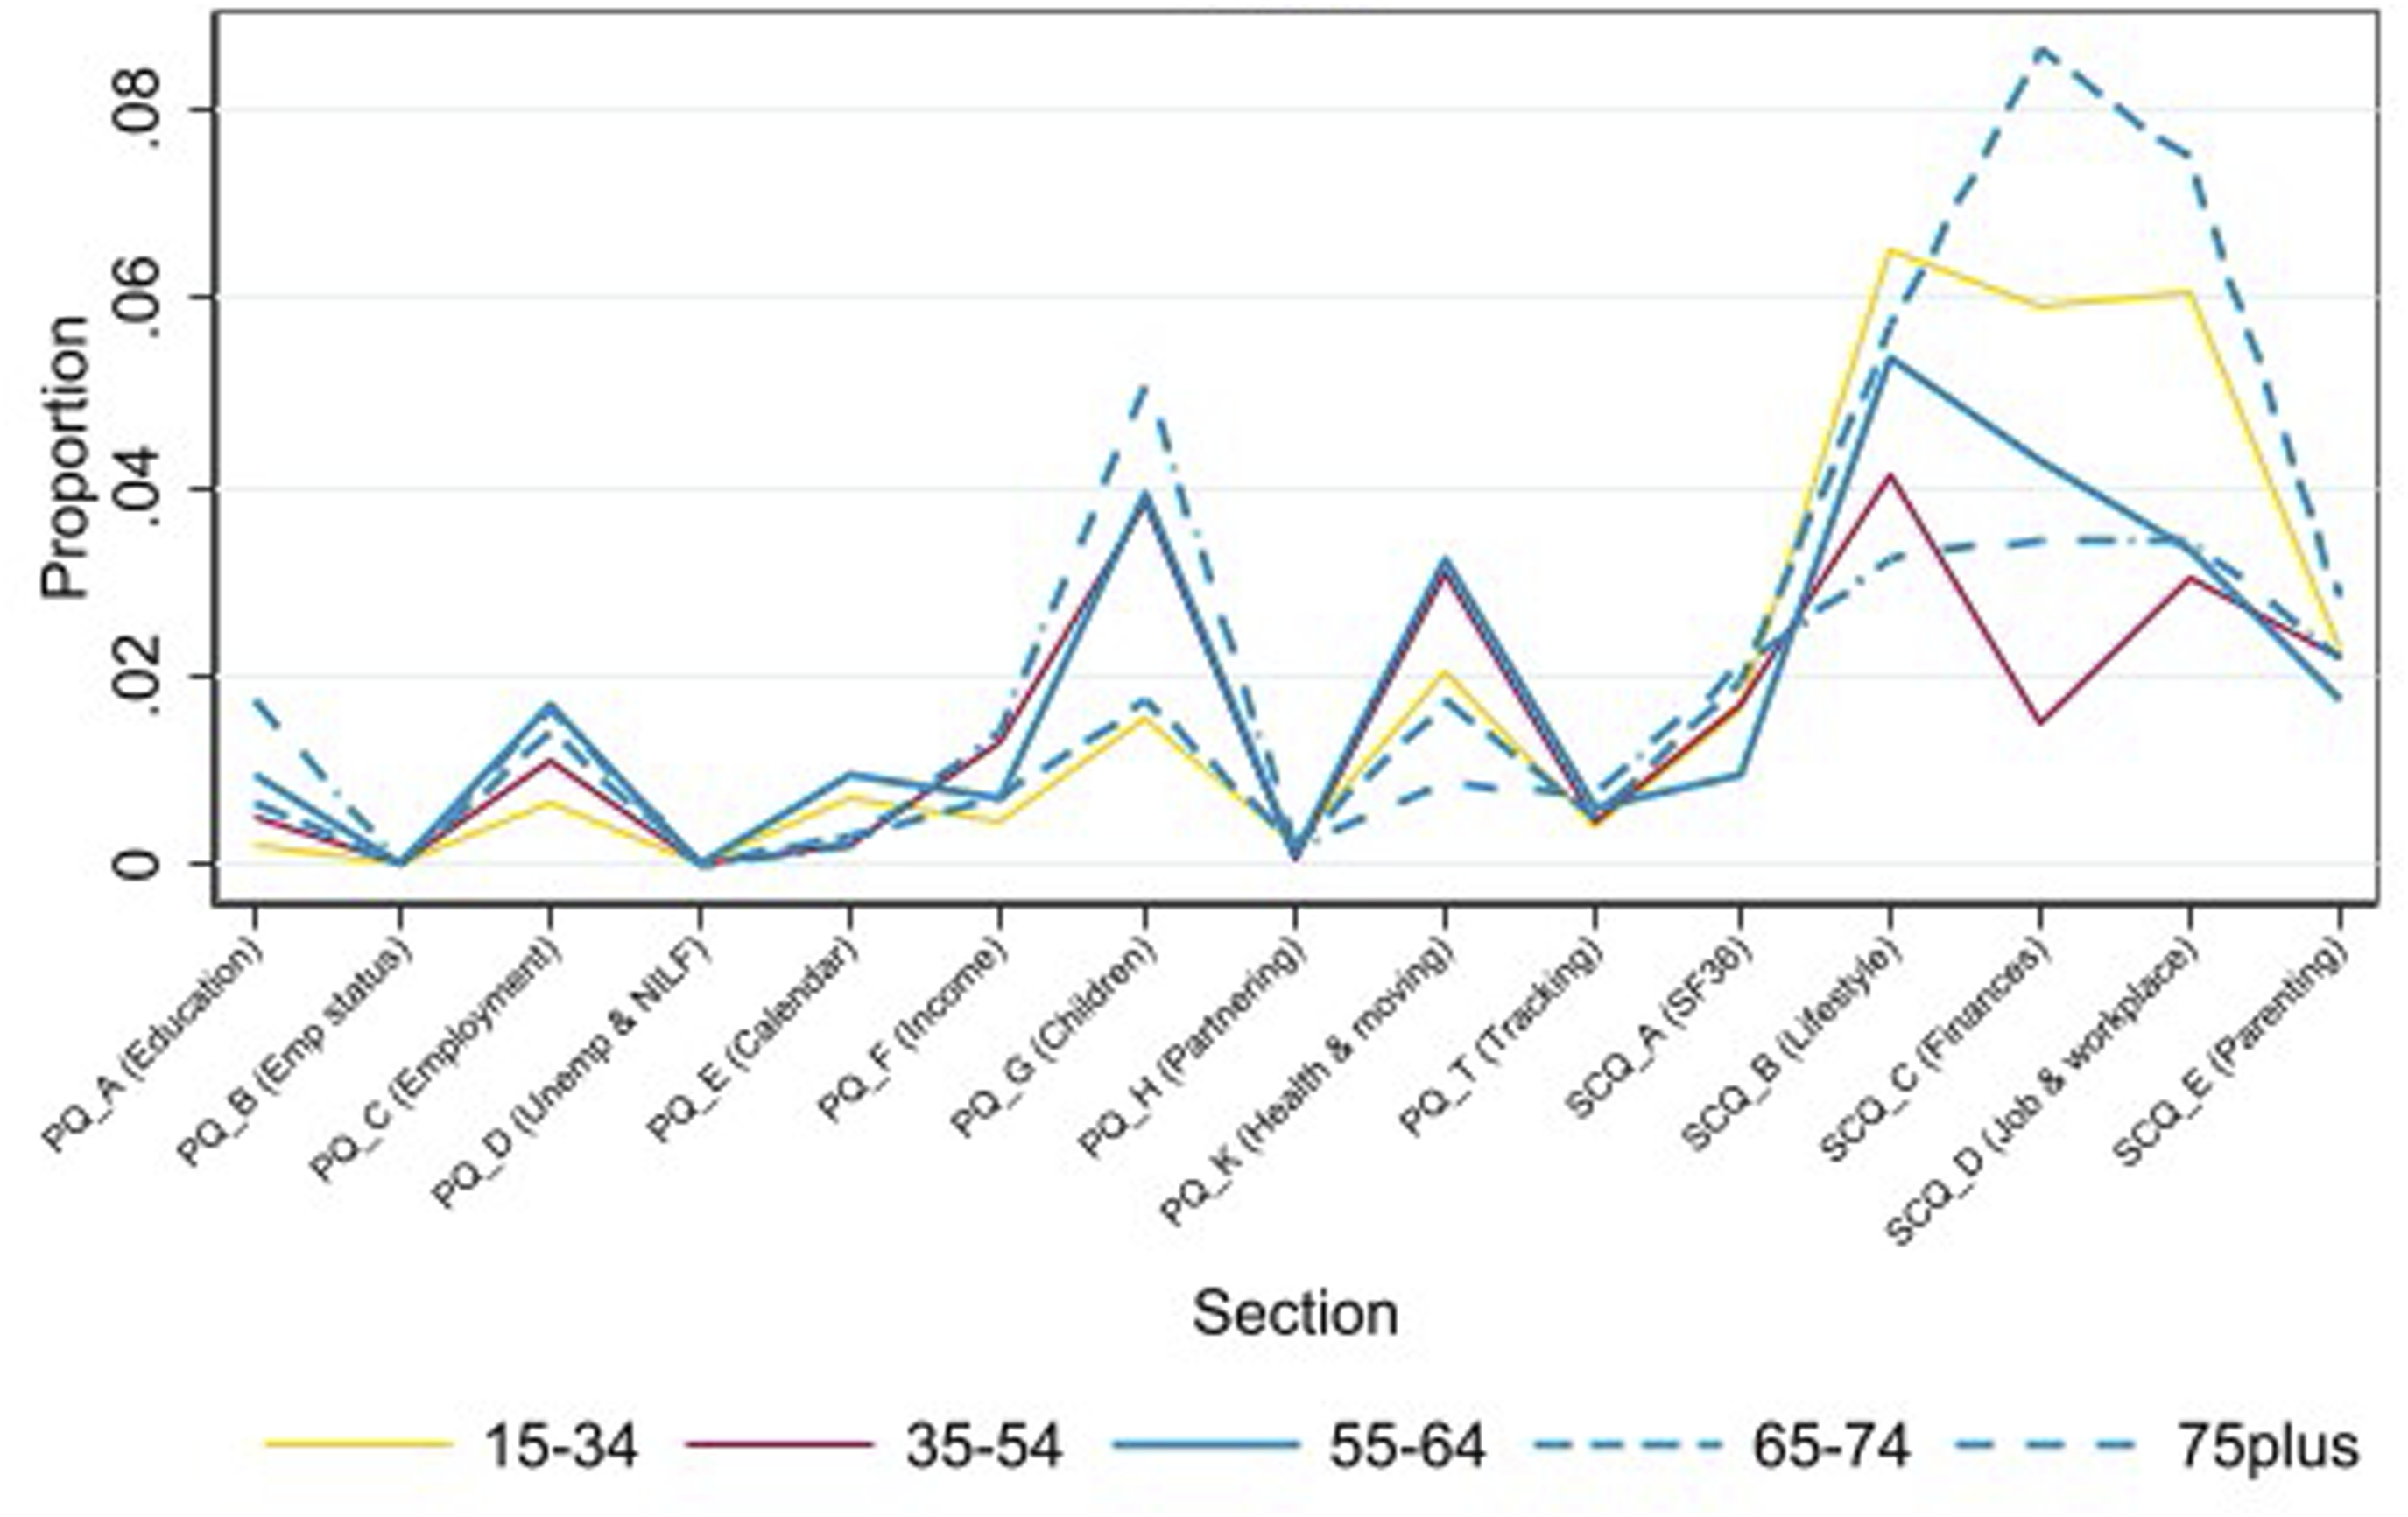
Coverage in nursing homes
Sample members who move into nursing homes are followed and interviewed where possible in the HILDA Survey. By 2016, the weighted estimate of the number of people who had made the transition to permanently living in a nursing home since 2001 (excluding known or imputed deaths) is 75,400. 4 The actual number of people living in residential care on 30 June 2016, as reported by the Australian Government, is 198,100 (Australian Institute of Health and Welfare, 2017). The HILDA Survey estimate is well below the actual number. Some loss is expected as some sample members will not be well enough to be interviewed or there may be greater obstacles in making contact with the sample member. A gap of 62% may seem large but is largely explained by the fact that more than half of the people living in nursing homes have dementia (Australian Institute of Health and Welfare, 2023). While the HILDA Survey does not exclude people with dementia, it may be possible to interview someone in the early stages of dementia but not in the later stages. Further, of those known to be in a nursing home in 2016, 76% were interviewed.
By 2021, the weighted HILDA Survey estimate of people living in nursing homes is 73,700, whereas the official figure is 191,000 (Australian Institute of Health and Welfare, 2022). Of those in a nursing home in 2021, only 50% were interviewed and most were interviewed by telephone due to COVID-19 restrictions. Another change that has occurred in Australia since 2018 is the greater availability of home support care which may help more people age in place for longer and rely less on nursing homes, potentially improving response rates among older individuals in the future.
Comparison of estimates
The differences between the demographic and employment variables from the HILDA Survey estimates and the Census, GSS, MPHS and NHS estimates are given in Figure 4. The HILDA Survey estimates themselves are provided in Table A3 in the Appendix. A positive difference indicates that the HILDA Survey estimate is higher than the ABS estimate and a negative difference indicates it is lower. Comparison of HILDA Survey estimates and ABS sources for demographic and employment variables.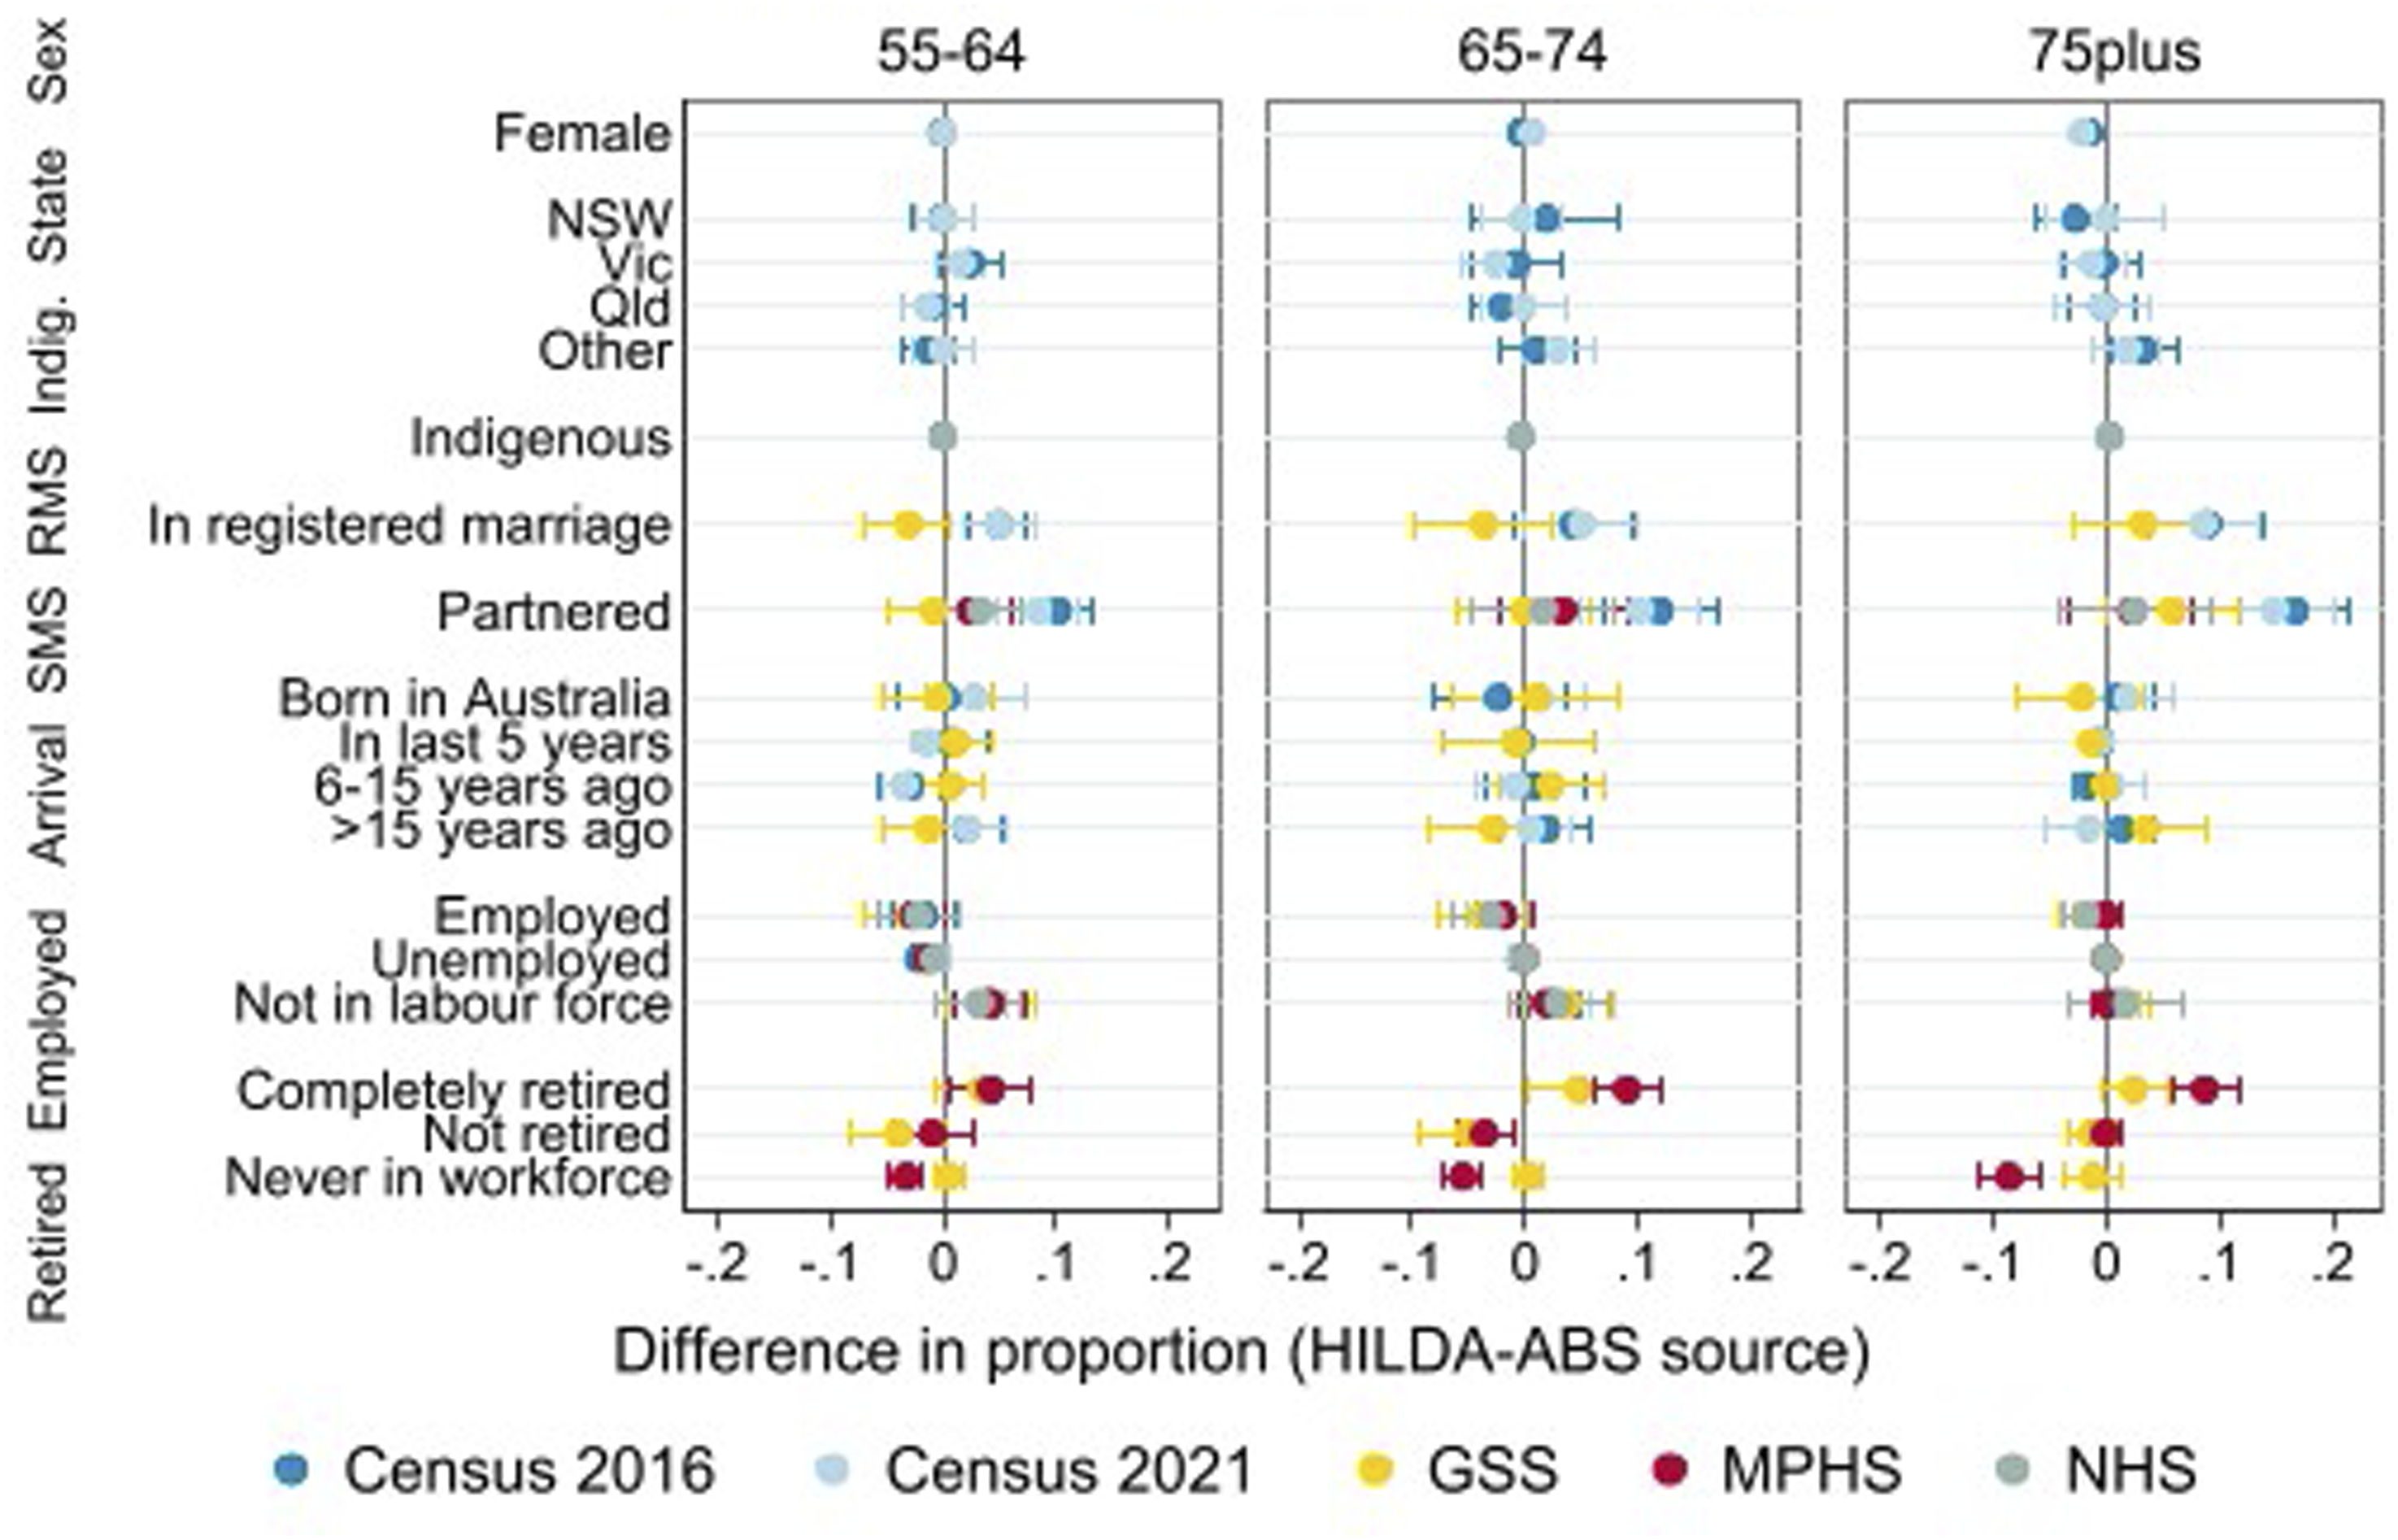
The HILDA Survey estimates align very well with the Census estimates for sex, area and indigenous status across the three age groups. This is expected for sex and area as the HILDA Survey weights are calibrated to the Estimated Residential Population (ERP) in the construction of the weights (Watson, 2012).
The HILDA Survey estimates for registered marital status and social marital status do not align well with the Census but do compare well to the other ABS surveys. It is important to consult other ABS sources besides the Census as certain questions such as an individual’s relationship to others in their household are not asked of those away from their usual residence on Census Night (e.g., in a non-private dwelling such as a hotel). This will result in the Census understating the proportion of people who are partnered, as we have found here. However, the HILDA Survey’s partnered estimate is consistent with the GSS, MPHS and NHS as they all use the same ‘usual residence’ concept to define a household (e.g., for those aged 55–64 the estimates are: HILDA Survey: 0.726; Census: 0.624; GSS: 0.734; MPHS: 0.702; NHS:0.693).
The next set of estimates compared in Figure 4 relate to the year of arrival where we find that the HILDA Survey estimates compare very well to other sources despite this being an area of potential weakness for the HILDA Survey. There is no natural way for recent immigrants (arriving since the 2011 refreshment sample) to be included other than if they move in with a HILDA household member. For this age group, however, the proportion of recent arrivals is relatively small (0.012) and they are more likely to be family migrants who may live with their Australian-based relatives when they arrive.
The last two variables presented in Figure 4 show that the HILDA Survey estimates align well with the other surveys on employment and are close to the GSS estimates for retirement status. It is unclear why the MPHS retirement estimates are different from the HILDA Survey estimates (and the GSS estimates). It may be that there are some differences in the MPHS retirement question (the questionnaire is not publicly available).
Figure 5 shows the comparison between the HILDA Survey and the 2021 Census, GSS, MPHS and NHS for the health variables. For the health rating, the question included in the different surveys is the same and is asked as part of the individual interview. We find that there are fewer people reporting ‘excellent’ health and more reporting ‘good’ health for those aged 55–64 or 75 and over in the HILDA Survey. Given the good alignment of most of the other variables examined here, these differences are likely due to the longitudinal nature of the HILDA Survey. The respondent and interviewer have built a rapport over time and the respondent likely feels more comfortable reporting their true state at this question – a form of advantageous panel conditioning (Struminskaya & Bosnjak, 2021). An alternative explanation could be selective non-response or attrition, but this would require those with poorer health to be more likely to stay in the study which seems unlikely given the other health related variables align reasonably well. Indeed, the health rating question in the HILDA Survey is also asked in the SCQ and a lower proportion of ‘excellent’ health is reported there than in the individual interview, as might be expected with the differences in mode. Comparison of HILDA Survey estimates and ABS sources for health variables.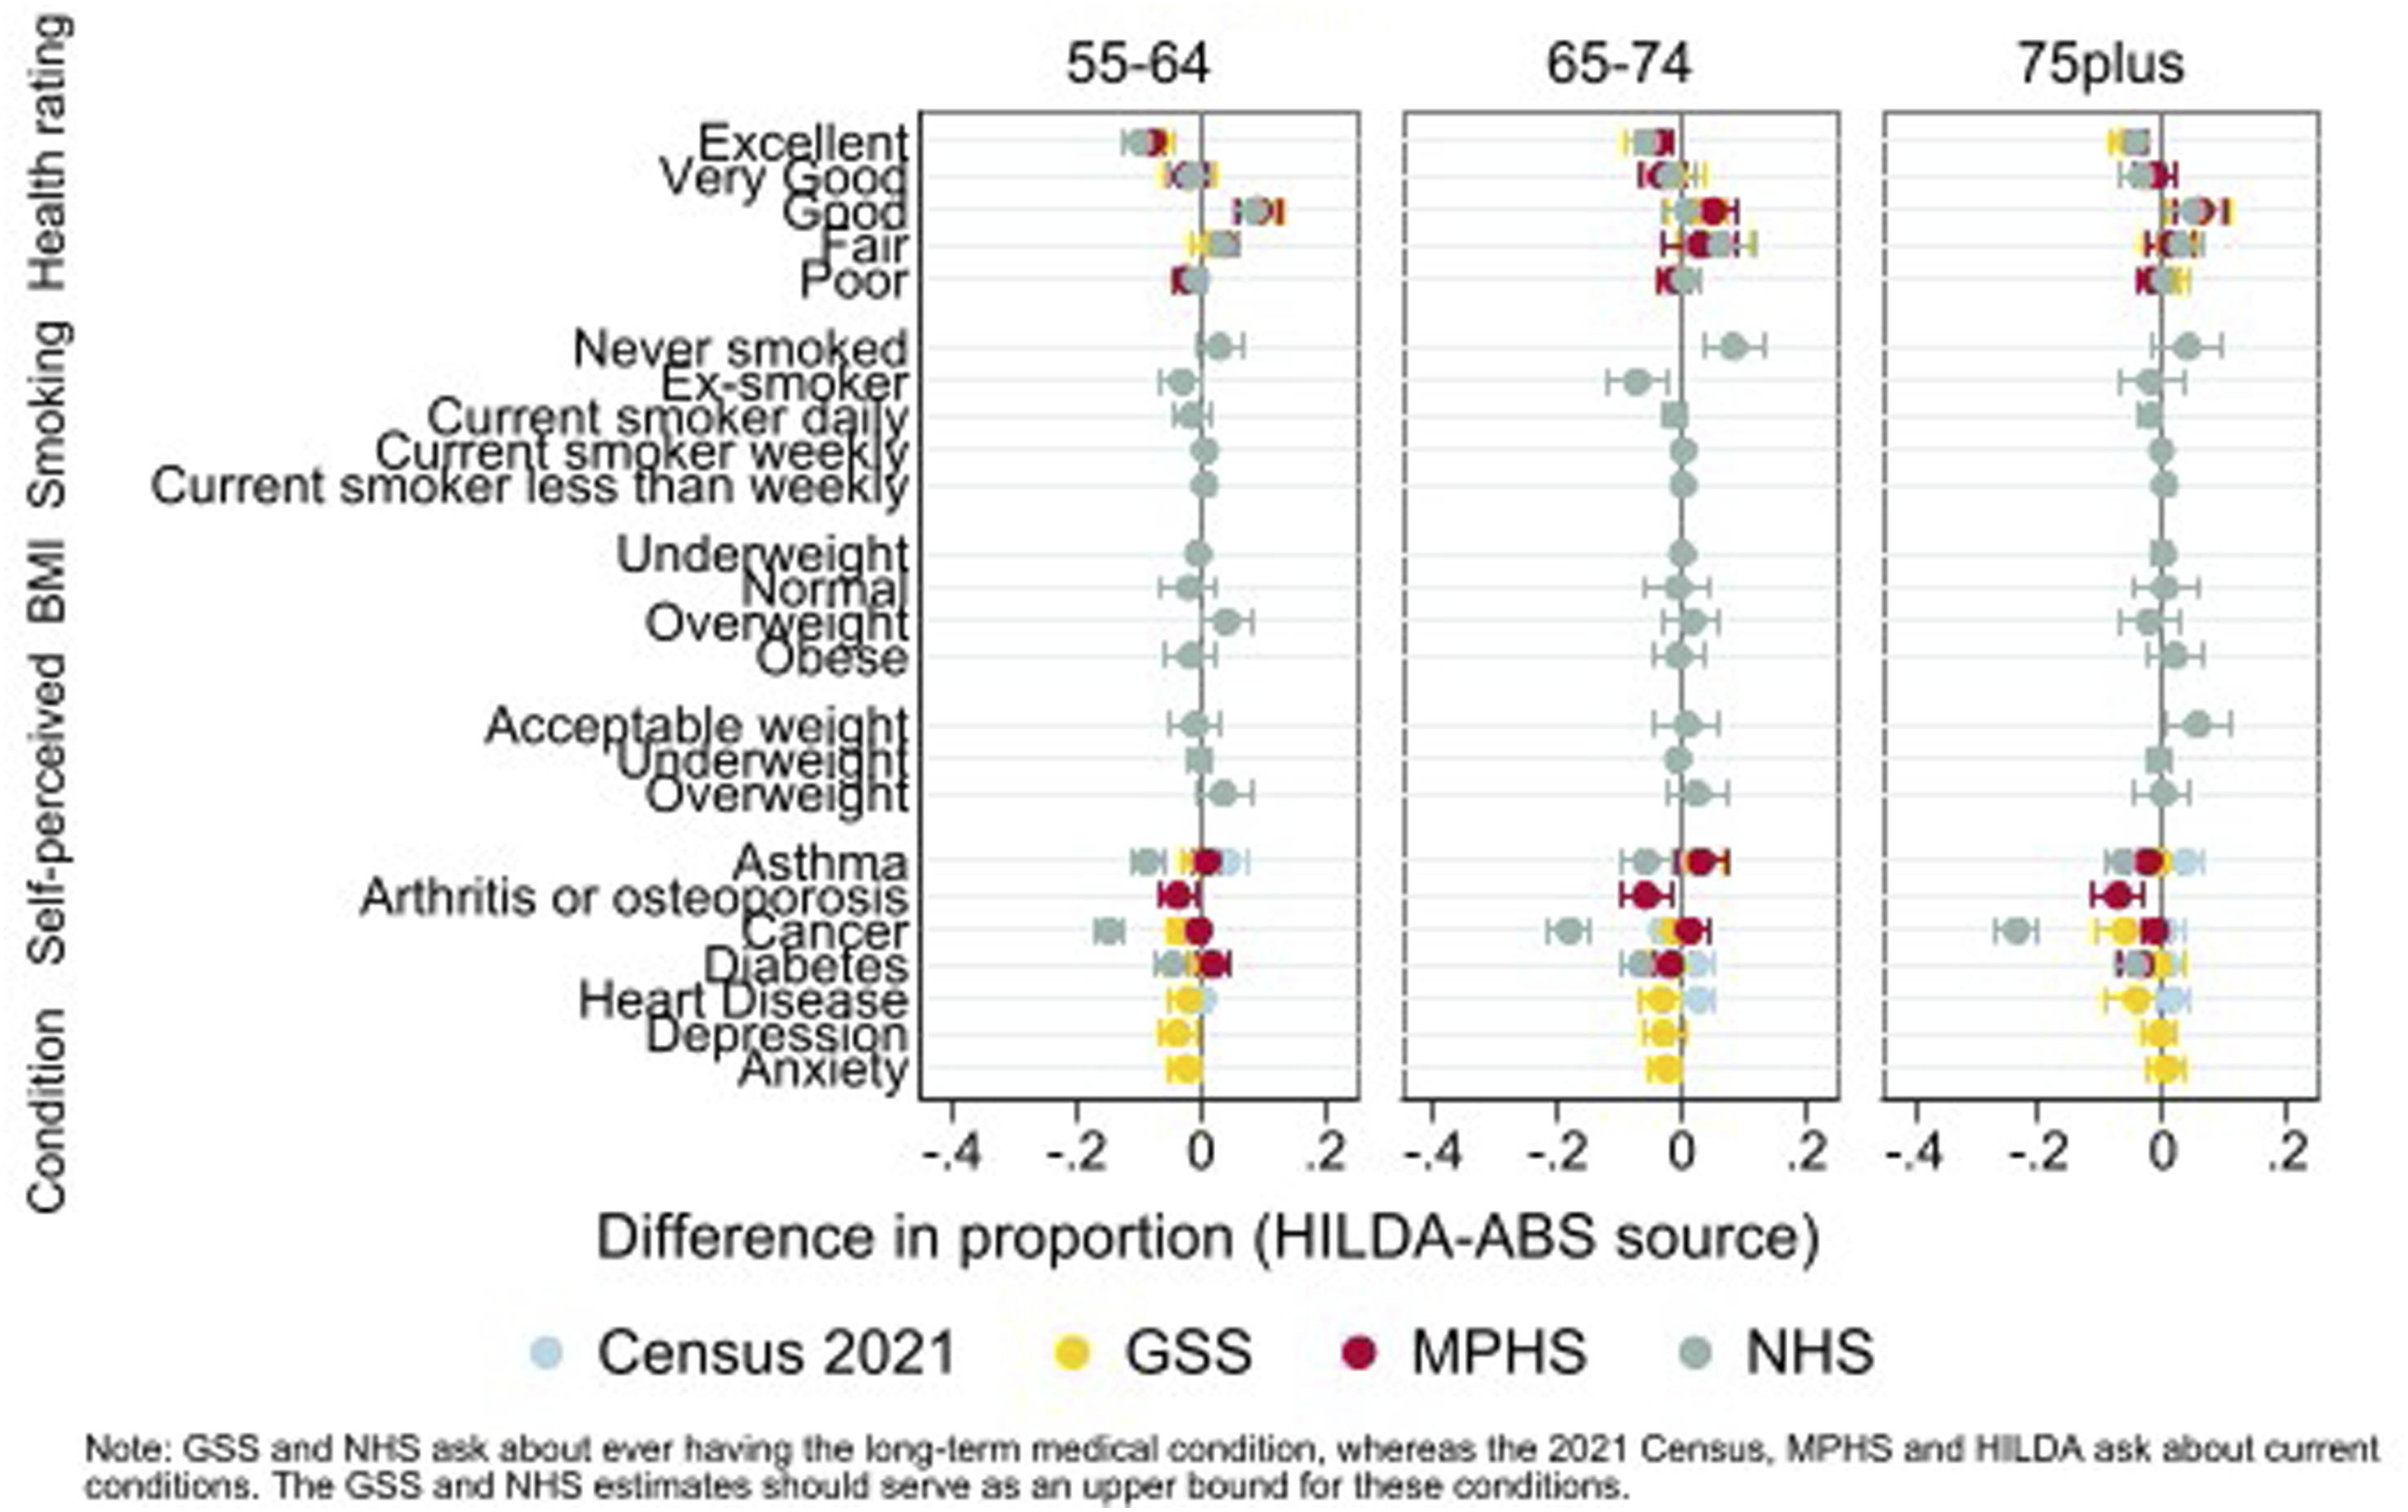
Regarding smoking behaviour, BMI, and self-perceived body mass, we see the estimates align very well. Only two smoking status estimates (for people aged 65–74 who have never smoked or are ex-smokers) and one self-perceived body mass estimate (for the acceptable weight category for those aged 75 and over) are significantly different. Some differences may be due to chance, given the number of comparisons made. A very conservative test of this is provided by applying Bonferroni-adjusted confidence intervals (see Figures A1 and A2 in the Appendix) which does not provide evidence against this assumption. The likely explanation for the differences in smoking status estimates is in the questions asked. The NHS use 6 questions to establish smoking status and, in the process, gathers information to define the ex-smoker category, whereas the HILDA Survey has a single question on smoking (without a definition of ex-smoker).
The last section of Figure 5 provides a comparison of the incidence of different long-term health conditions. The questions underlying this data are somewhat different (see Table A1 in the Appendix). The NHS and GSS ask respondents whether they have ever had the condition whereas the HILDA Survey, MPHS and 2021 Census ask whether they (currently) have the condition. The NHS and GSS estimates should therefore serve as an upper bound for each condition. There are also differences in how the question is asked. The NHS asks about each condition separately and whether the respondent had “ever been told by a doctor or nurse that [they] have …” the particular condition. The GSS asks the respondent “Thinking of conditions that last 6 months or more, have you ever been told by a doctor or nurse that you have any of these conditions” and lists 20 conditions on a showcard. The 2021 Census asks “Has the person been told by a doctor or nurse that they have any of these long-term health conditions?” and lists 11 conditions. The HILDA Survey question says “Looking at SHOWCARD K21, have you been told by a doctor or nurse that you have any of these conditions? Please only include current conditions that have lasted or are likely to last for six months or more.” The showcard lists 12 conditions. We have not been able to verify the question used in the MHPS so it is unclear how these various conditions are presented to the respondent.
We find that the NHS has the highest rates of the long-term medical conditions examined. These are higher than the GSS for the three sets of conditions that can be compared (asthma, cancer and diabetes) even though both questions are asking about “ever” being diagnosed. The list-style question in the GSS is probably causing this difference compared to asking about each condition separately as is done in the NHS. The HILDA Survey estimates tend to lie close to the GSS, MPHS and Census estimates. Although a larger gap might be expected due to different time horizons, it’s reassuring that HILDA Survey estimates align closely with the 2021 Census and MPHS, which focus on current conditions.
Conclusions
We assessed the data quality and representativeness of three oldest cohorts (people aged 55–64, 65–74, and 75 and over) in the HILDA Survey, a household panel survey conducted annually since 2001. In terms of data quality, we find that the re-interview rates and response rates to the SCQ are reasonably high, with the very oldest age group being the hardest to maintain in the sample. There was a noticeable drop in the response rates for the two oldest cohorts during the COVID-19 pandemic so it will be important for interviewers to re-engage with these sample members post-pandemic to minimise sample loss. Flagging potential deaths (through imputation) or actual deaths (though matching to the death register) is necessary as deaths were under-reported in the survey. Item non-response is very low in the individual interview but higher in the SCQ across all age groups. The coverage of nursing home residents is about 40%, due to challenges in tracking and interviewing individuals with significant health issues.
In terms of the representativeness of the sample, HILDA Survey estimates for the three oldest cohorts (excluding those in institutions) show strong alignment with official statistics. There is one area of disagreement worth reflecting on further, being the health rating. The HILDA Survey estimates of “excellent” health are below that reported in the GSS, MPHS and NHS for all age groups and the estimates of “good” health is higher for all but the middle age group (aged 65–74). We expect this is due to the longitudinal nature of the survey, rather than there being real differences, given how well other estimates compare. Respondents become familiar with the interviewer, the survey process, and trust builds, leading to more accurate reporting.
This paper has several limitations. First, we are limited as to the range of surveys and time points available from the ABS TableBuilder. Nevertheless, our comparisons represent at least 15 years of attrition, deaths and household composition changes which can influence the representativity of the sample. Second, we would ideally like to examine the HILDA Survey’s representativeness both longitudinally and cross-sectionally. That is, how well are the changes observed in the HILDA sample over time matching the population (for example, the onset of health conditions, changes in working hours, or health rating)? Longitudinal administrative data, such as the Person Level Integrated Data Asset (Australian Bureau of Statistics, nd), is emerging and would be useful for such comparisons though, of course, administrative data has its own limitations which may impact the comparisons (Smith et al., 2019).
Our findings are relevant to other panel studies that seek to represent the older-aged segments of the population. Flexibility may be required with the mode of the approach, the timing of the interview or how it is delivered (e.g. in multiple parts) to make it easier for the respondent to participate and lessen the cognitive load. It is also important to understand the differences identified in comparisons with official statistics as this may yield insights for questionnaire design, attrition bias, sampling and weighting adjustments. We have demonstrated some of the issues that may be confronted in these comparisons and the need to compare to multiple official sources to develop a more rounded picture of any differences.
Understanding and improving the representativeness and data quality of older respondents in longitudinal or panel surveys is important as it can influence public policy, health planning or marketing strategies. This will ensure that a diversity of voices and experiences of older-aged individuals are accurately captured and reflected in the data. Policy-makers and planners will have a better understanding of the unique needs and challenges of this group enabling more effective and targeted policies, programs and services that address the specific concerns of an ageing population.
Supplemental Material
Supplemental Material - Data quality and representativeness of older respondents in the HILDA survey
Supplemental Material for Data quality and representativeness of older respondents in the HILDA survey by Nicole Watson and Mossamet Kamrun Nesa in International Journal of Market Research.
Footnotes
Acknowledgements
This paper uses unit record data from the Household, Income and Labour Dynamics in Australia (HILDA) Survey. The HILDA Survey is conducted by the Australian Government Department of Social Services (DSS). The findings and views reported in this paper, however, are those of the authors and should not be attributed to the Australian Government, DSS, or any of DSS’ contractors or partners.
Author contributions
Nicole Watson, conceptualisation, analysis, writing – original draft, review and editing].
Mossamet Kamrun Nesa, analysis, writing – review and editing.
Declaration of conflicting interests
The authors declared no potential conflicts of interest with respect to the research, authorship, and/or publication of this article.
Funding
The authors received no financial support for the research, authorship, and/or publication of this article.
Ethical statement
Data Availability Statement
Supplemental Material
Supplemental material for this article is available online.
Notes
References
Supplementary Material
Please find the following supplemental material available below.
For Open Access articles published under a Creative Commons License, all supplemental material carries the same license as the article it is associated with.
For non-Open Access articles published, all supplemental material carries a non-exclusive license, and permission requests for re-use of supplemental material or any part of supplemental material shall be sent directly to the copyright owner as specified in the copyright notice associated with the article.