
Abstract
The effectiveness of Computer Assisted Telephone Interviewing (CATI) surveys relying on fixed telephone numbers has been eroded by the rise in mobile phone usage and the growing population reachable exclusively through mobile phones. As a result, telephone survey methodologists have had to come up with research designs capable of dealing with the coverage bias in CATI surveys caused by incomplete fixed phone directories. The methodological and operational issues of dual-frame surveys, namely those combining fixed phones and mobile phones, have been extensively investigated, but a comprehensive overview of the magnitude of mobile phone use in CATI surveys is lacking. The present study explores this research gap by analysing data from 675 CATI surveys conducted in European countries. Although a generalised scenario of single frame mobile phone designs is not yet visible, the predominance of mobile phone units over fixed phone units in dual-frame CATI surveys is evident. The sampling method and the target population are the survey-related features most strongly associated to the percentage of mobile phone units in the sample. Survey organisations in countries which continue to have a high number of fixed phone subscriptions tend to give less weight to mobile phone frames in their dual-frame designs.
Keywords
Introduction
When the number of mobile subscribers worldwide overtook the number of fixed-line subscribers in 2002, it marked a turning point in the history of telecommunications: mobiles became the dominant technology for voice communications (OWD, 2021). Since then, the rate of mobile phone ownership has been constantly on the rise and has now reached very high levels: for instance, almost 100% of the population in the EU27 now own a mobile phone (European Commission, 2021) and the number of mobile phone subscriptions per 100 people exceeds 120 (OWD, 2021). This comes at the same time as a decline in fixed equipment and, given that most of the people who own a fixed phone are over 55, this trend is likely to continue (European Commission, 2021, p. 13; OWD, 2021).
Aware of this changing environment, survey organisations conducting Computer Assisted Telephone Interviewing (CATI) surveys have moved to dual-frame designs where frames of fixed telephone numbers are supplemented with mobile phone number frames to produce probability-based samples representative of the general adult population (e.g. Dutwin & Lavrakas, 2016; Ipsos, 2021, p. 6; Mohorko et al., 2013; Pew Research Center, 2015, 2021; Slavec & Toninelli, 2015), thus reducing coverage bias. Combining fixed and mobile phone numbers in CATI surveys poses methodological and operational challenges. Although a number of these issues are discussed in a growing body of the literature, not all aspects of the topic have been adequately covered. While sampling (Boyle et al., 2010; Brick et al., 2007; Callegaro et al., 2011; Heckel & Wiese, 2012), weighting (Battaglia et al., 2010; Gabler et al., 2012; Lohr & Rao, 2000), call efficiency (Carley-Baxter et al., 2010; Kennedy, 2007; Schneiderat & Schlinzing, 2012; Shino & McCarty, 2020) and measurement error (Jablonski, 2014; Jackson et al., 2014; Lynn & Kaminska, 2013; Vicente et al., 2009) are well studied, the actual size of mobile phone usage (vs. fixed phone usage) in CATI surveys has been neglected. The foreseen steady decrease in the fixed phone coverage rate is likely to push survey organisations to gradually abandon Random Digit Dialling (RDD) fixed phone frames; they will rely increasingly on mobile phones and convert to single-frame mobile designs (AAPOR, 2017; Kennedy et al., 2018). However, the stage of this transition and the factors associated to mobile phone number frame adoption remain unknown. Mobile phone frame use in dual-frame CATI surveys is often only reported as descriptive information to justify the respective study or as a methodological sidenote to describe the data used. This lack of knowledge on the use of mobile phone frames in CATI surveys is unfortunate for several reasons. Firstly, the claim that mobile phone frames are steadily replacing fixed phone frames and may substitute them entirely is not based on comprehensive empirical evidence. Consequently, the motivation and rationale behind a significant strand of CATI survey research remains inadequately explained. Secondly, an examination of mobile phone frame utilisation would greatly benefit from cross-country data as this would provide a broad and comprehensive perspective of prevailing survey practices. In fact, the existing research on the use of mobile phone number frames in CATI surveys is mostly based on data from a single study or from a single country. Thirdly, it is important to acknowledge that while coverage and cost issues are extremely relevant when deciding on sample allocation in dual frame designs (e.g., Fahimi, 2014; Ghandour et al., 2018; Vehovar et al., 2012), survey-specific factors such as the target population or sampling design should not be overlooked. Therefore, a more refined understanding of the adoption of mobile phone number frames that anticipates scenarios for a transformation into single-frame mobile designs would empower survey practitioners to make well-informed decisions for future surveys and to allocate limited resources accordingly.
The present study explores the factors associated to the use of mobile phone frames in CATI surveys. For this purpose, we drew on data from 675 CATI surveys conducted in EU27 countries in the past five years as part of Flash Eurobarometer studies. The available data and paradata from these studies conditioned the predictors to be tested. Nevertheless, the outcomes are valuable as they provide comprehensive insights into the present state of mobile phone usage in CATI surveys.
Background
Mobile Phones in Dual-Frame CATI Surveys
Sample allocation is a key issue in dual frame CATI surveys. More specifically, how much of the initial sample should come from the mobile phone RDD frame and how much from the fixed phone RDD frame? Although the size of each frame must be taken into consideration, most survey researchers end up relying on ad-hoc assumptions to determine the mix of fixed and mobile numbers for their samples due to the unavailability of updated information on the size of each frame, notably the mobile-only population (Fahimi, 2014).
Societal and economic changes have led to the steady increase in mobile phone use and contributed to a progressive and generalised abandonment of fixed phones. Mobile phone calls used to be much more expensive than fixed phone calls, but the cost of mobile phone communications fell after the EU capped the price of international communications in 2019 (European Commission, 2022), thus breaking down one of the barriers to the mass use of mobile phones. Moreover, the quantitative growth of the mobile phone ownership rate has been accompanied by a significant qualitative evolution. Communication services nowadays need to keep pace with people’s increased mobility and fixed phones simply cannot compete with the convenience of mobile phones for communication on the go. While the major driver for bringing mobile phones to CATI surveys was to address the decreasing coverage rate of fixed phones, the current scenario and foreseen trend of a steady increase in the adoption and use of mobile devices (GSM, 2021) will make RDD of fixed phone numbers an inviable survey mode option for most general population surveys (AAPOR, 2017). If survey organisations embrace these societal and economic changes, we expect to see dual-frame CATI survey designs in which the mobile phone frame is allocated a larger share of the sample than the fixed phone frame. Therefore, our first proposition is:
The mobile phone number frame is given more weight than the fixed phone number frame when allocating the sample in CATI surveys.
Survey Design Features
Relevant factors for sample allocation decisions include survey characteristics, such as the research question, target population and sampling method, as well as practical restrictions like logistics, personnel, time, cost and other organisational issues (AAPOR, 2017; de Leeuw, 2005; Groves et al., 2004, p. 146). The declining ownership and use of fixed phones is also a challenge to reaching specific target audiences. According to the European Commission (2021), whereas most people aged 55+ (64%) have a fixed phone, less than half of those aged 15–24 years (43%) or 25–39 years (36%) have one, i.e., young people do not own fixed phones. Simultaneously, mobile phones are no longer merely a technical device but have become a vital ‘social object’ in every aspect of daily life. Many people, particularly the young, see mobile phones as fashion accessories rather than simple communication devices carried everywhere to perform a myriad of tasks (Srivastava, 2005). Evidence suggests that younger people (18–24 years) prefer the mobile to the fixed phone, i.e., mobile phone owners do not use the fixed phone even if they have one (Currivan et al., 2008). This led us to state that:
CATI surveys targeted at specific subgroups of the population, e.g., young people, allocate a larger share of the sample to the mobile phone frame.
Surveys with national coverage usually require a geographic stratification to ensure sample representativeness. The stratification is easier to implement with fixed phone numbers because the numbering system of fixed numbers allows to know in advance the potential respondent’s place of residence. Unlike fixed phone numbers, the prefix of a mobile phone number does not represent an area coding, which makes it impossible to know in advance the potential respondent’s place of residence. This requires a significant amount of screening for the address-eligibility of mobile phone numbers (Ghandour et al., 2018; Haeder et al., 2010).
Additionally, respondents’ selection is different in the two frames. A two-stage sampling design is required in a fixed phone frame: first, sampling of telephone numbers and then sampling of a single respondent from those eligible in the household, usually by means of the “last birthday” method. The selection of mobile phone respondents involves a simple random sampling design as it is always the person who picks up the phone that is interviewed (Soullier et al., 2022). Mobile phone RDD therefore has greater potential for larger sample sizes (AAPOR, 2017). Hence, we elaborate the following propositions:
CATI surveys with complex sampling designs allocate a lower share of the sample to the mobile phone frame.
CATI surveys with bigger sample sizes allocate a larger share of the sample to the mobile phone frame.
Call productivity and optimal scheduling patterns have been widely studied in CATI surveys, although without conclusive outcomes. Soullier et al. (2022) present evidence of mobile phones being more productive than fixed phones because fewer call attempts are required to get an interview, which ultimately reduces the duration of data collection. Similarly, Brick et al. (2007) and Carley-Baxter et al. (2010) sustain that respondents can be selected more quickly than in fixed phone samples because individuals can be reached anywhere anytime. In contrast, Kuusela et al. (2008), Barr et al. (2012) and Jackson et al. (2014) state that more calls must be made to mobile phones than fixed phones to establish a final contact. When scheduling calls, it is also important to consider the more productive time periods and days of the week (Ghandour et al., 2018; Shino & McCarty, 2020; Vicente, 2017) to increase call productivity. Although there are fewer studies on how the time of the year when a survey is launched affects call productivity, it should also be remembered that fixed phone calls are not as effective as mobile phone calls in periods when people are at home less, the summer, for example. The likelihood of successful calls is higher with mobile phones due to people’s increased mobility and time spent away from home at this time of the year. Therefore, we elaborate:
CATI surveys conducted in the summer allocate a larger share of the sample to the mobile phone frame.
Even though dual-frame designs have different frames, the questionnaire is necessarily the same for all sample units. Questionnaires in CATI surveys are generally relatively brief. The recommendation is for mobile phone surveys to be shorter than fixed phone surveys (ESOMAR, 2010, p. 5; Jablonski, 2014) due to the unpredictability of the location and context of mobile phone respondents at the time of the call. Hence, we elaborate:
CATI surveys with longer questionnaires allocate a smaller share of the sample to the mobile phone frame.
Fixed and Mobile Phone Ownership
While the rate of mobile phone ownership is consistently high across European countries, the rate of fixed phone ownership is very diverse. The European Commission monitors fixed and mobile phone coverage rates in European countries by means of regular Eurobarometer studies. The most recent study on this topic reveals that just over half of the households in EU27 countries have a fixed telephone (53%). However, proportions vary greatly between countries (European Commission, 2021). In Greece (87%) and Malta (86%), nearly nine out of ten households have a fixed telephone. At the other end of the scale, less than one in ten households in Poland (9%) have a fixed phone, with low levels also in Romania (11%), Latvia, Czech Republic and Finland (all 14%). By contrast, mobile telephone access is much more evenly distributed across the Member States: in the EU27 (as a whole), 96% of people aged 15 years or older report having a personal mobile telephone; while the lowest proportions are observed in Bulgaria (93%), Romania and Italy (both 94%), 100% of the adult population in Slovenia and Latvia report having a personal mobile telephone. The European mobile-only population is nearly 47%. While Finland has the largest share of individuals (90%) who state they have at least one mobile phone but no fixed phone in the household, less than 5% of the population in the Netherlands report this (European Commission, 2021). This scenario of telephone ownership led us to state the following propositions:
In countries with high rates of fixed phone ownership CATI surveys allocate a smaller share of the sample to the mobile phone frame.
In countries with high rates of mobile phone ownership CATI surveys allocate a larger share of the sample to the mobile phone frame.
Data and Methods
Flash Eurobarometer Studies
The Flash Eurobarometer (Flash EB) studies underpinning this research are described below. The selection of these studies is due primarily to their credibility as they are conducted by respected survey organisations at the request of the European Commission and comply with the best state-of-the-art methodological standards for social surveys. Flash EB surveys in EU Member States are mostly conducted on the telephone or online; they collect data on attitudes, beliefs and behaviours in the main areas of social sciences, such as politics, law & crime, and economics. Although the target population is usually those aged 15 years and over residing in each of the 27 Member States, Flash EB studies occasionally target specific subpopulations such as young people or other subgroups (European Commission, 2023).
The Flash EB surveys selected for this research were restricted to those covering all the current member states of the European Union, conducted under CATI surveying and where the individual was the unit of analysis (surveys on companies were excluded). The time range was set to the last five years to reflect the recent situation of CATI surveys. The global coordination of each Flash EB study is guaranteed by a single survey company that ensures methodological consistency across all countries and ultimately a representative sample of the EU 27 population; however, the fieldwork is implemented by local partner institutes in each country. New and independent samples are drawn using random sampling for each Flash EB survey. Each study administers the same questionnaire across all countries and collects specific topic-related data, using a standard set of questions that include mode of interviewing − fixed or mobile phone. The interviewing mode also reveals whether the participants are selected from a sampling frame of fixed phone numbers (if fixed phone is the mode of interview, the sampling frame is RDD of fixed phone numbers) or from a sampling frame of mobile phone numbers (in this case, the sampling frame is RDD of mobile phone numbers). Table A.1 (Appendix) presents the 25 selected Flash EB studies which meet the inclusion criteria previously described. Data from these studies are available for scientific purposes via GESIS-Leibniz Institute for the Social Sciences® website on free subscription.
Aggregated Data Set
To investigate the research questions, data from the 25 Flash EB studies were aggregated into one Flash EB*country level dataset. Each Flash EB*country entry is referred to throughout the text as “survey”; therefore, this dataset has 675 surveys, corresponding to 25 Flash EB × 27 country entries and contains the following data describing each survey: year of fieldwork, target population, sampling method, sample size, month of fieldwork, fieldwork length (number of days), questionnaire size (number of questions) and percentage of mobile phone units in the sample. Additionally, the following data was added to the dataset considering the year and country of each survey: i) number of mobile phone subscriptions per 100 habitants, and ii) number of fixed phone subscriptions per 100 habitants (The World Bank, 2022).
Analytic Strategy
To evaluate the size of mobile phone frame usage, we start with a descriptive analysis of the distribution of the percentage of mobile phone units in CATI surveys in general terms and across EU countries. Secondly, we explore the correlation between the percentage of mobile phone units and a set of survey design features.
In a second stage, the percentage of mobile phone units is examined with a separate three-stage sequential multivariate model: Stage 1 including only the year of the fieldwork (from 2019 to 2023) as a predictor, Stage 2 incorporating survey design features: target population [1 − specific subpopulation, zero − general adult population], sampling method [1 − multistage random (stratification by NUTS2 and urbanisation + RDD + respondent selection by the “last birthday rule for fixed phone numbers), zero − simple random], sample size and month of fieldwork [1 – summer months, zero – other months]. Finally, Stage 3 incorporating the above variables plus controls for the telephone context – number of fixed and mobile phone subscriptions.
A generalised linear modelling approach was used taking the percentage of mobile phone units in the CATI survey as the dependent variable. Each model was assessed for model fit using the log likelihood and the Akaike information criterion (AIC); collinearity of predictor variables was also assessed. Despite the 5-year time range, we do not perform longitudinal analyses because the number of studies each year varies greatly and there are no regular fieldwork dates (see Table A.1). The analysis is therefore made only at a cross-sectional level.
Results
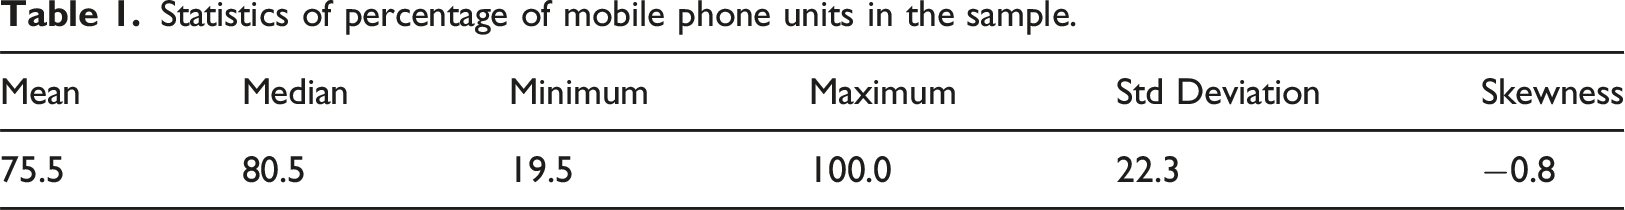
Statistics of percentage of mobile phone units in the sample.
While the overall mean of mobile phone sample units in Flash EB studies is likely to be near 75%, differences can be observed between countries. Countries such as Finland, Latvia, and Lithuania consistently exhibit very high mean percentages of mobile phone units in the samples, reaching almost 100%; this pattern is consistent across various Flash EB studies as the low-high range in these countries is small (Figure 1). In contrast, countries like Belgium, Germany and Netherlands have a lower mean share of mobile phone units in the samples, approximately 60%, which is below the overall mean. In these and other countries such as France, Luxembourg and Malta, the share of mobile phone units in the sample displays inconsistency across Flash EB studies, with high ranges of low-high values from around 30% to 100% (Figure 1). Despite the between-countries diversity, it is evident that at least one CATI survey was conducted exclusively with mobile phones in all countries. High-Low-Mean plot of percentage of mobile phone units in the sample by country.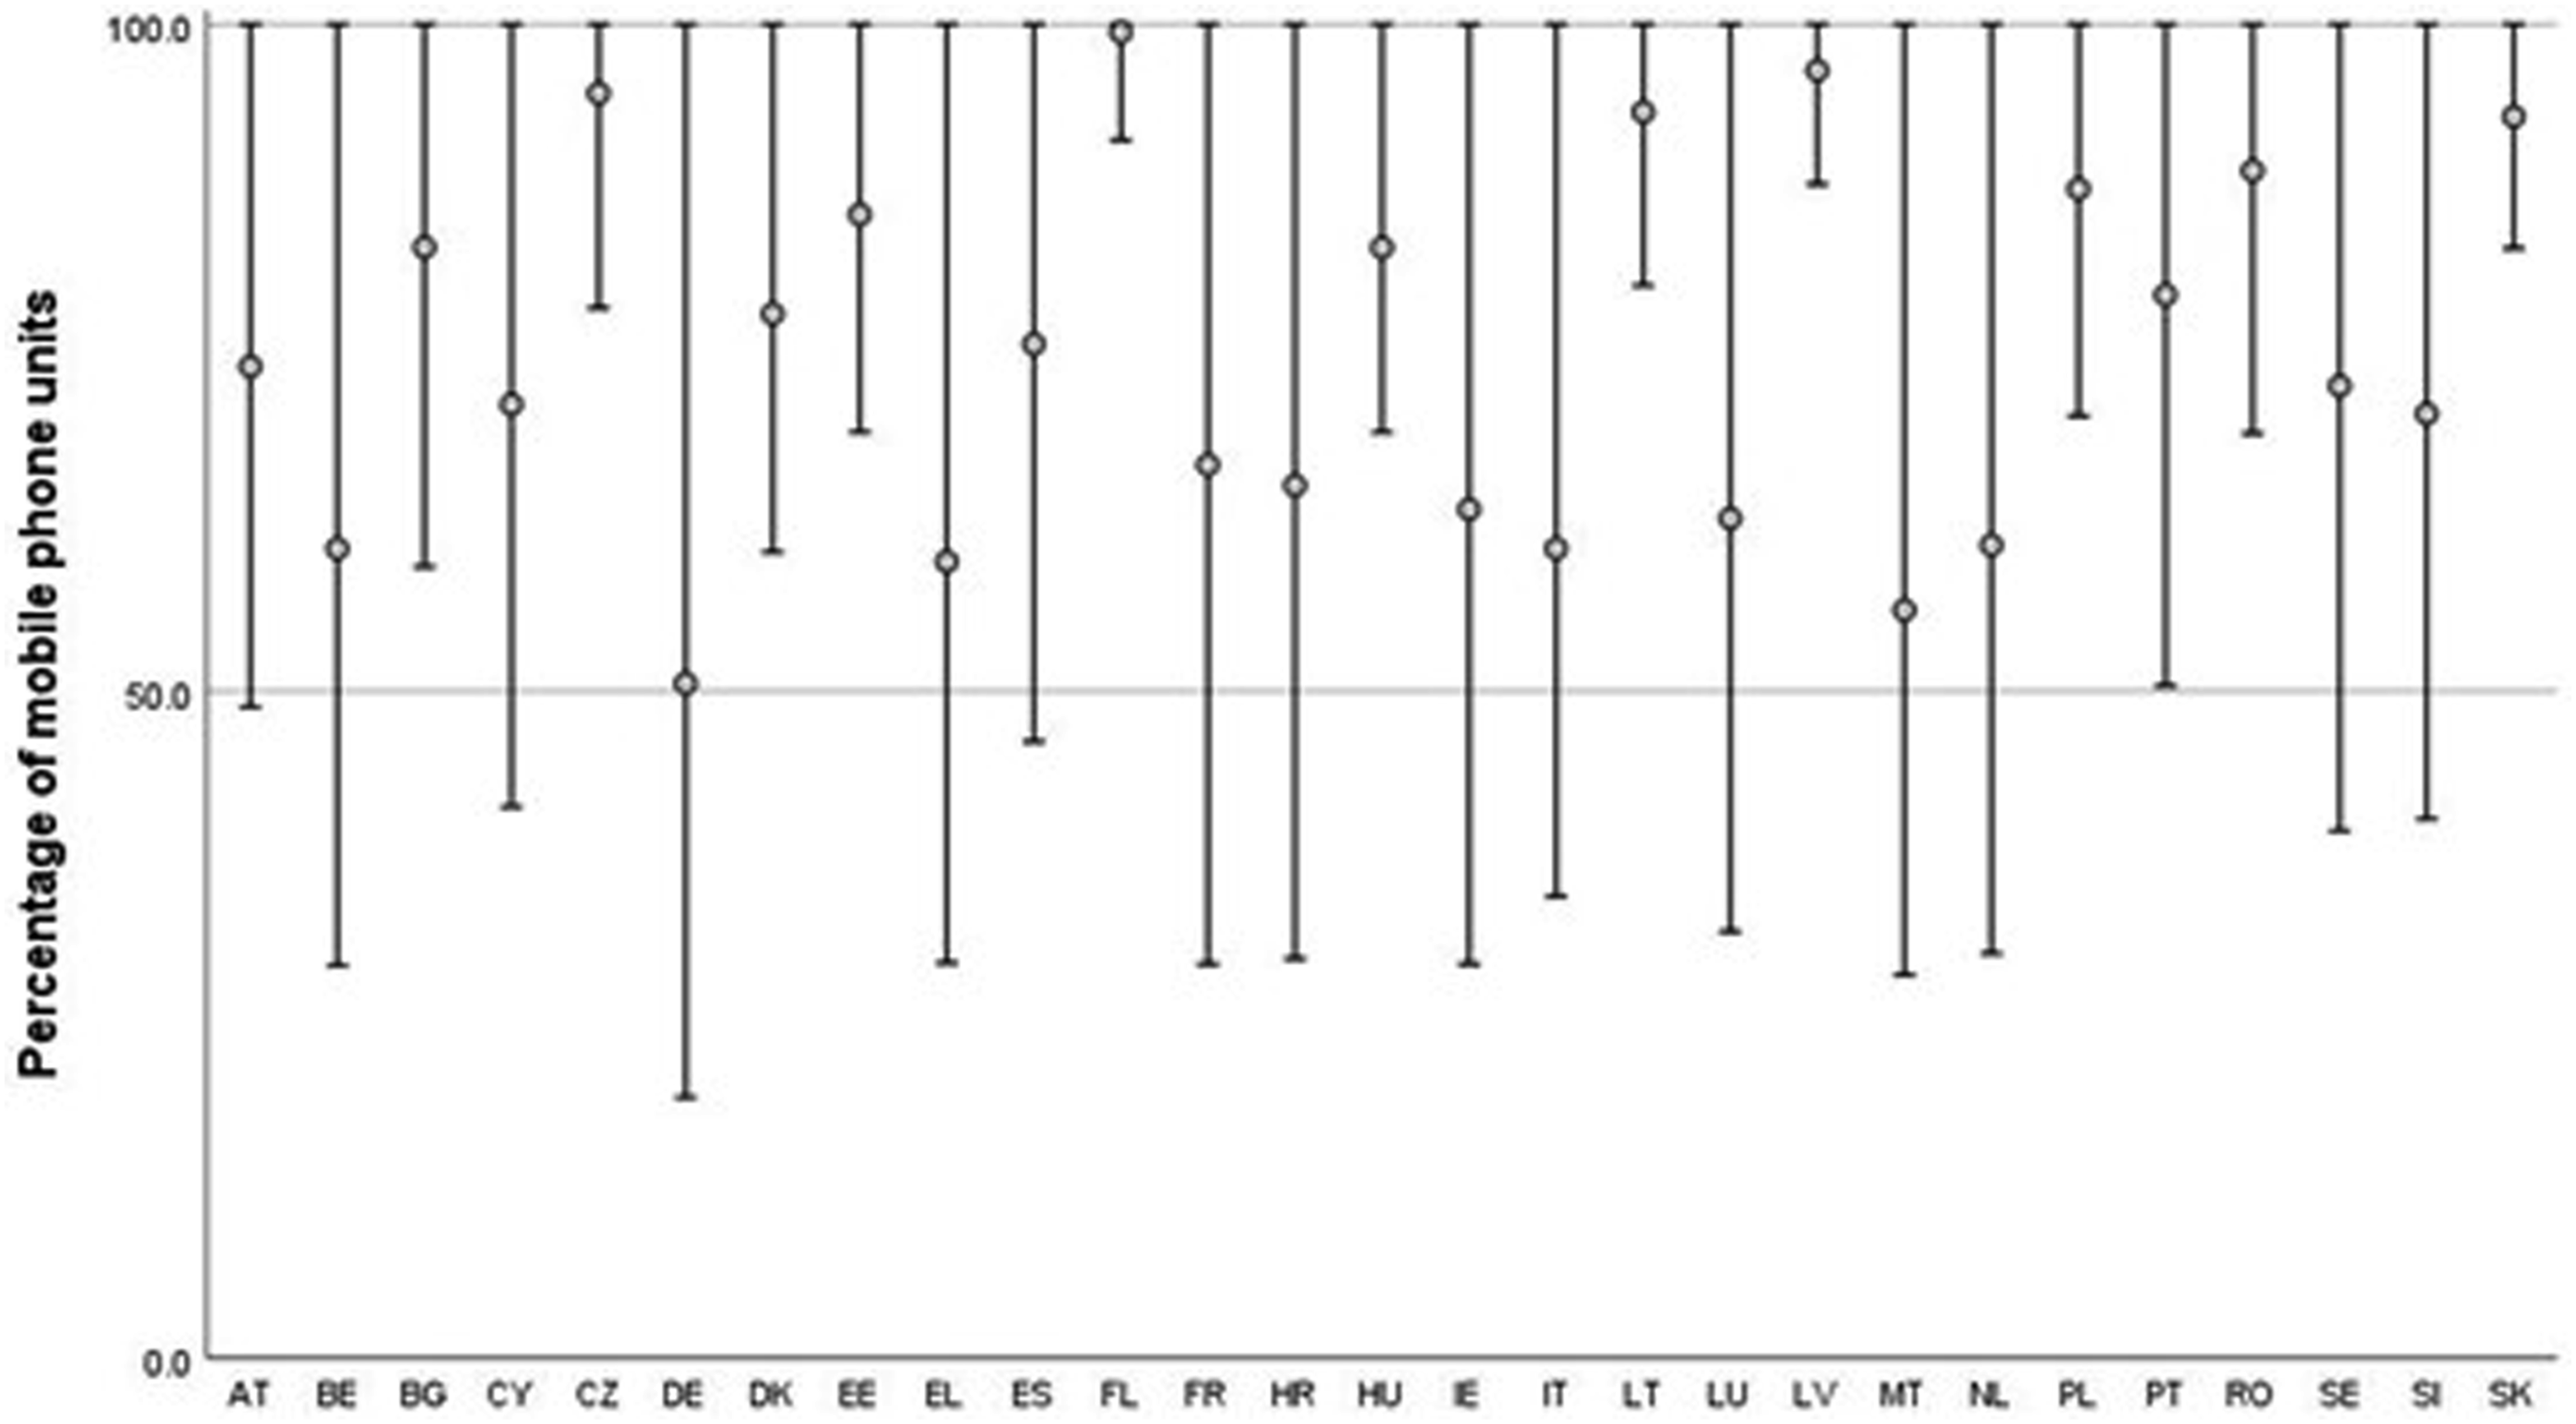
In summary, while the use of mobile phone frames rather than fixed phone frames is the general trend, there is significant heterogeneity across countries (Eta = 0.613, p < .001) and across Flash Eurobarometer studies (Eta = 0.673, p < .001), indicating varying degrees of mobile phone adoption.
Figure 2 presents the boxplot distribution of the percentage of mobile phone units across the 675 surveys (overall) and in each year of fieldwork. From 2019 to 2023, there is an upward trend in the use of mobile phone frames with the percentage of mobile phone units going from a median value of 59.9% in 2019 to 84.9% in 2023. Boxplot for percentage of mobile phone units in the sample of CATI surveys (overall and by year of fieldwork).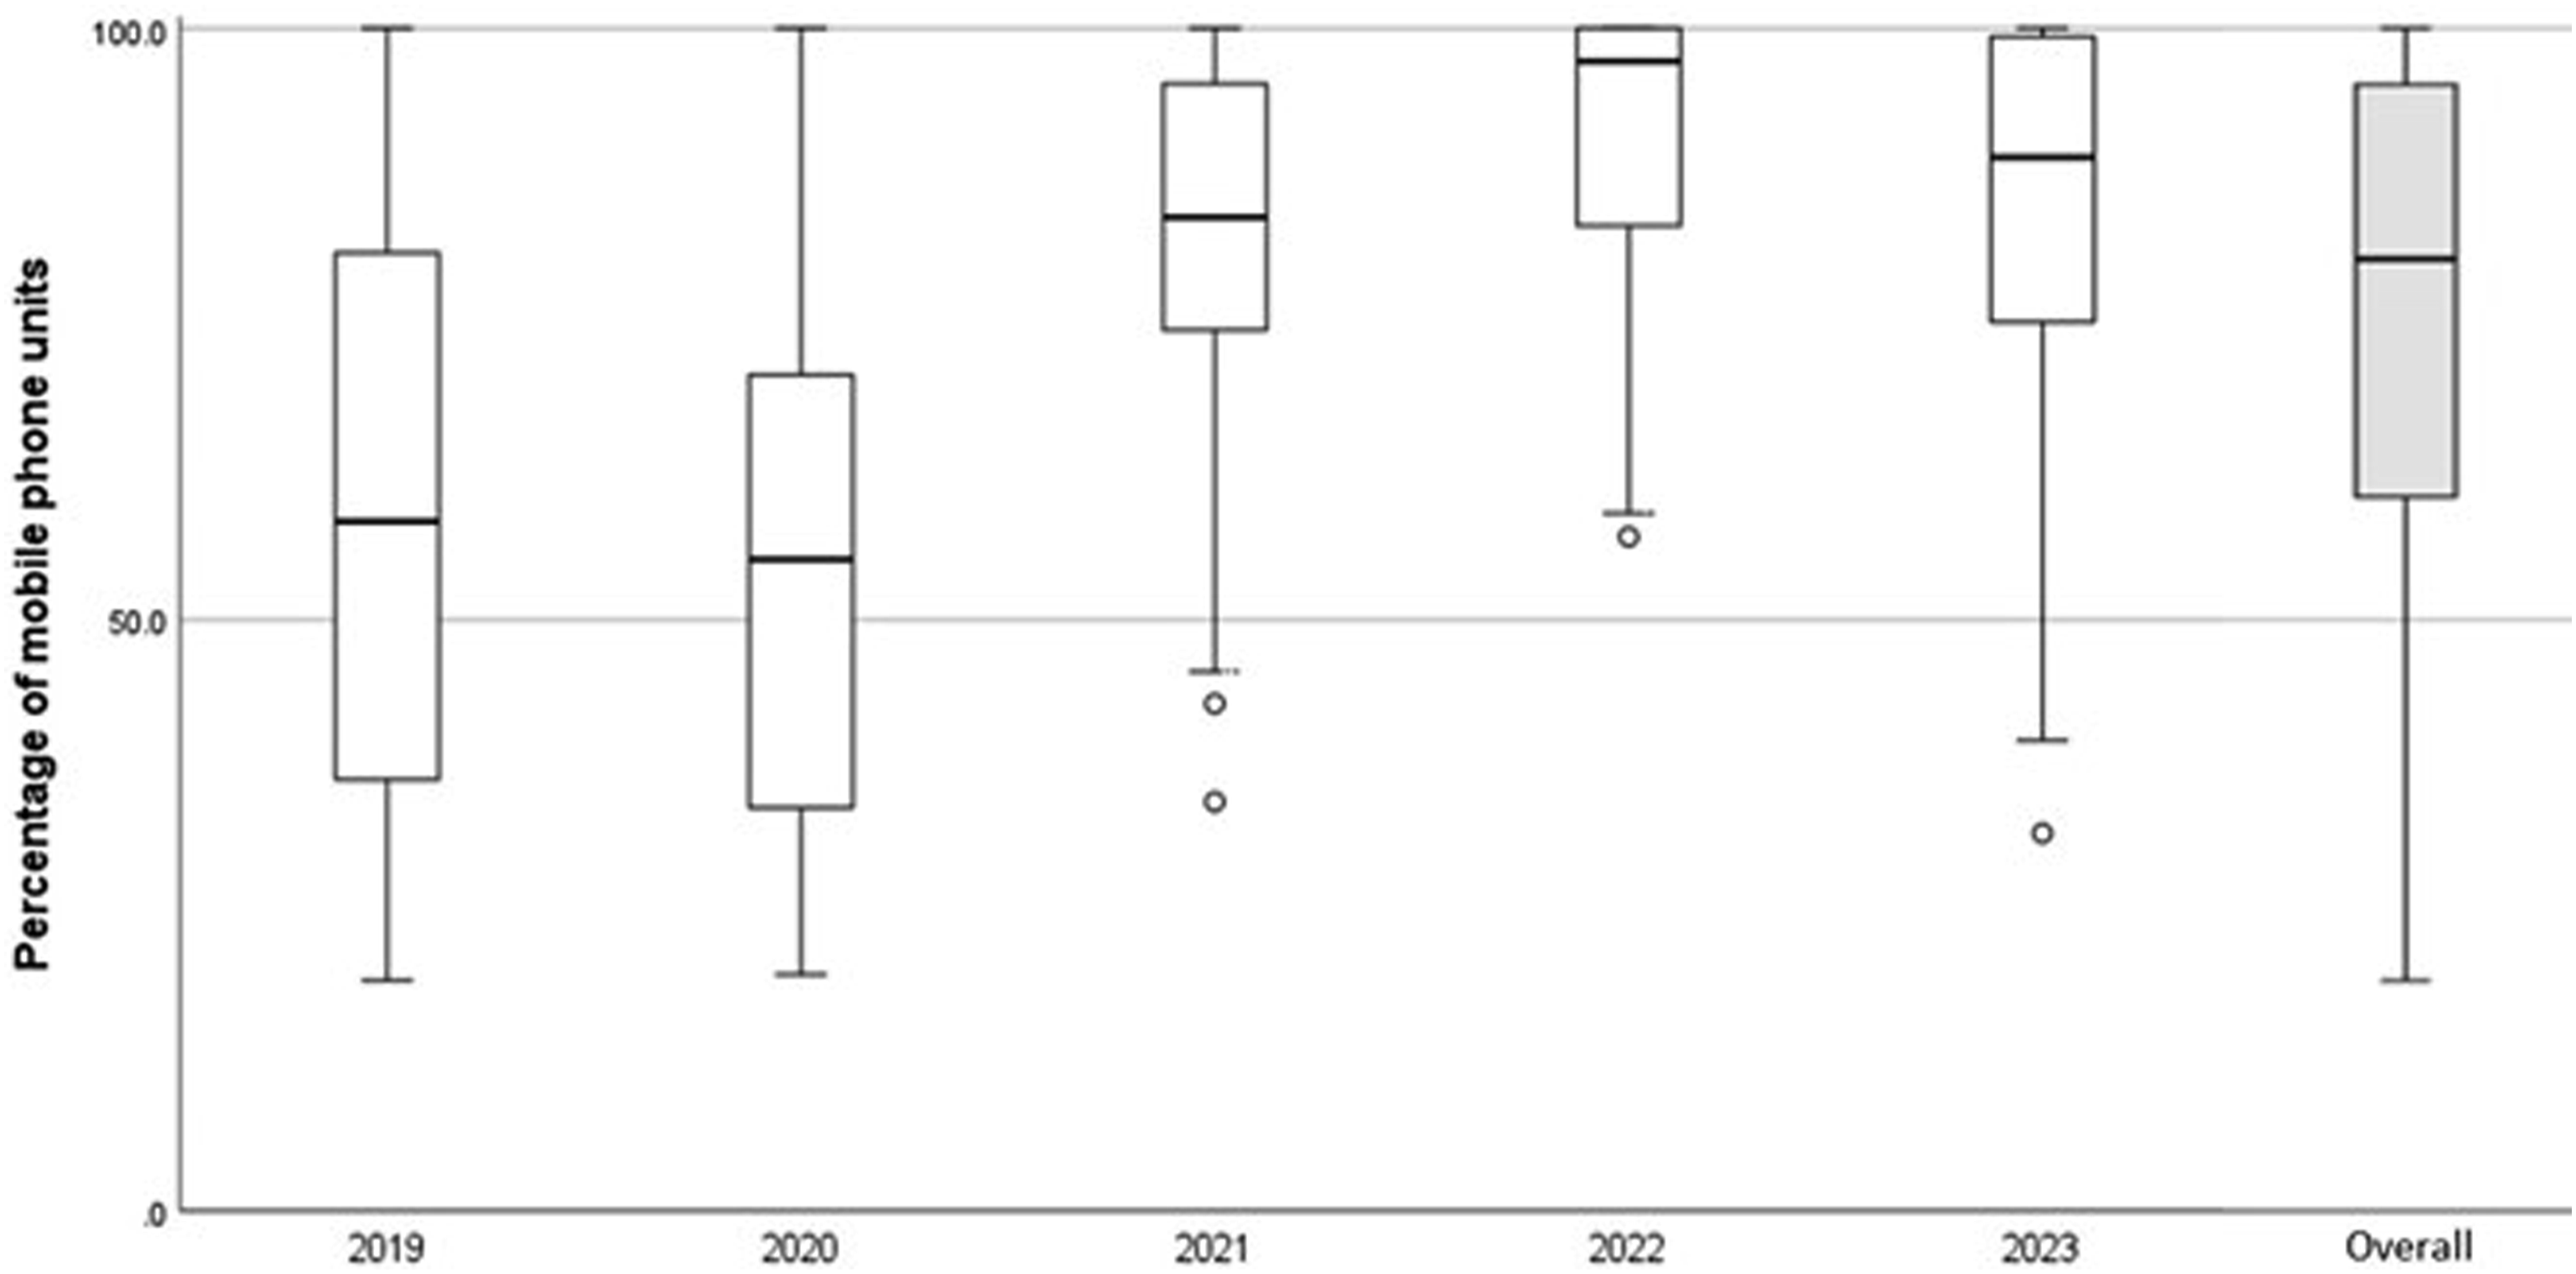
Correlation between the percentage of mobile phone units in the sample and survey design features.
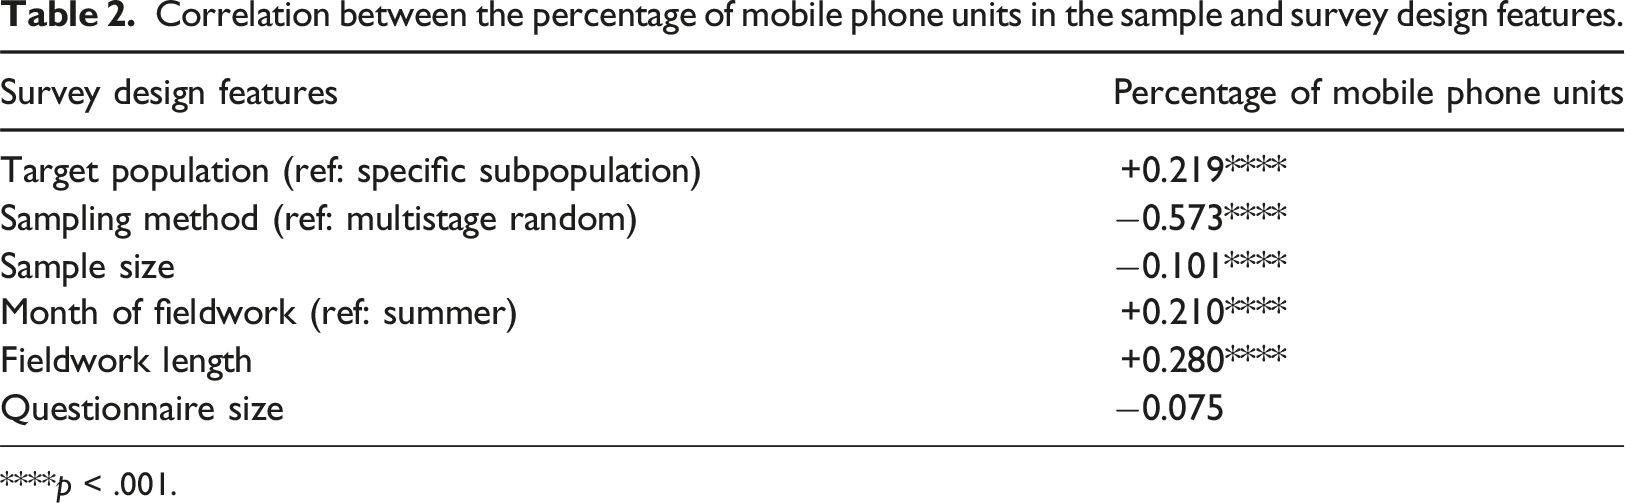
****p < .001.
The small magnitude (near zero) of the correlation with questionnaire size (measured by the number of questions in the questionnaire) suggests a likely nonsignificant effect of this factor, so we did not include this variable in the subsequent multivariate analysis. It was also decided not to include fieldwork length (measured by the number of days) in the list of predictors because we were unable to confirm (due to lack of information in the Flash Eurobarometer studies’ Technical Note) whether this survey design feature was defined prior to or was an outcome of fieldwork execution.
Multivariate Analysis
Results of Regression Model for Percentage of Mobile Phone Units in the sample (unstandardised estimates).
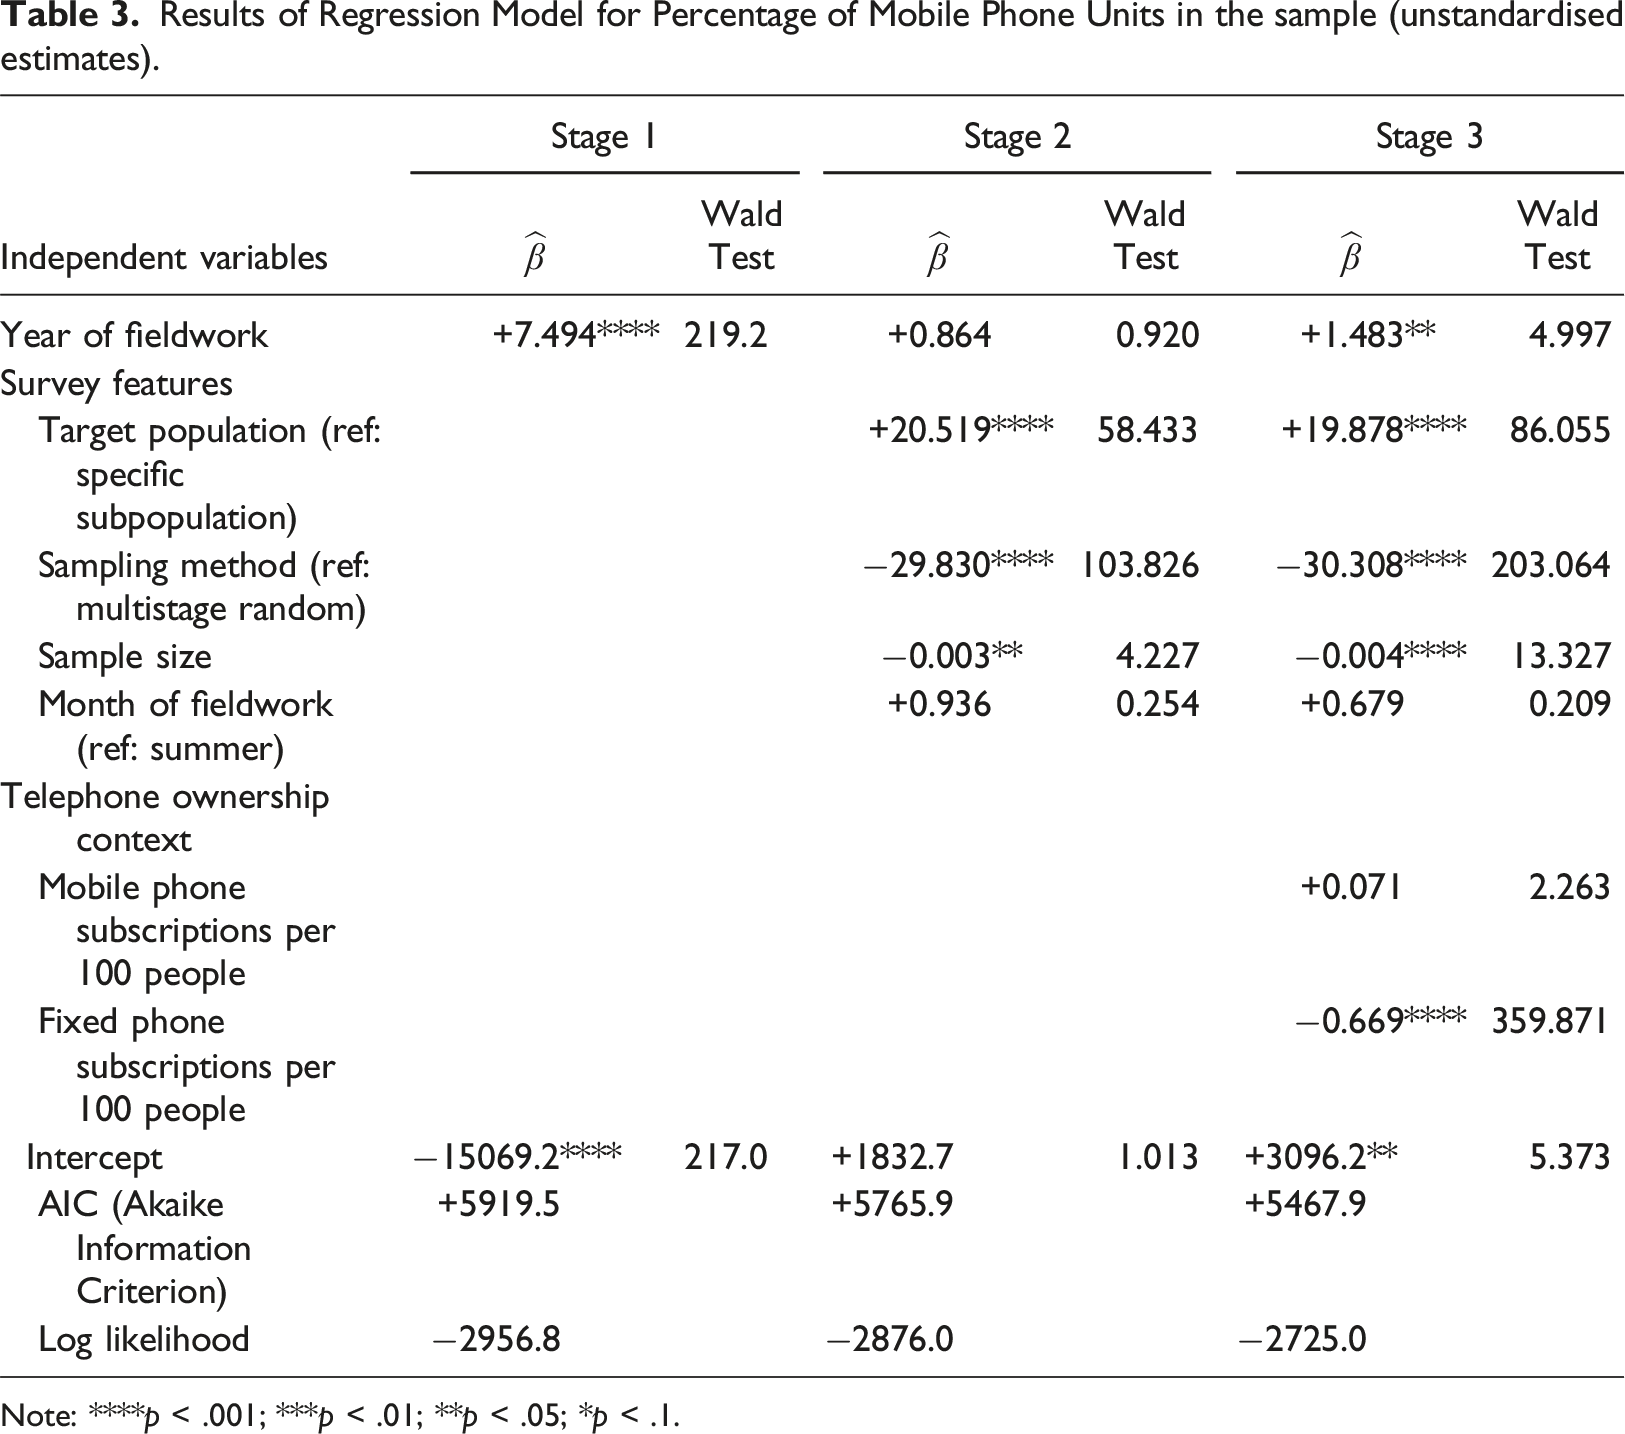
Note: ****p < .001; ***p < .01; **p < .05; *p < .1.
The stage 2 model shows that the share of the mobile phone sample tends to increase (
Target population, sampling method and sample size all remain significant (p < .001) after including controls (fixed phone and mobile phone subscriptions) (stage 3): the percentage of mobile phone units in the sample tends to be higher when targeting specific subgroups of the population and when simple random sampling is adopted, and it tends to be lower when sample sizes are bigger. Furthermore, there tend to be lower percentages of mobile phone units in the sample (
Discussion
Data gathered from Flash Eurobarometer studies revealed a mean percentage of mobile phone units in CATI surveys of 75.5%. Although the overall percentage in the EU27 countries ranges from 19.5% to 100%, only 25% of the surveys were conducted with a percentage of mobile phone units below 60%, while 50% of the surveys were conducted with more than 80% of mobile phone units. This means that survey organisations are giving more weight to mobile phones frames in their dual frame designs as announced in proposal 1.
Propositions and respective outcomes.
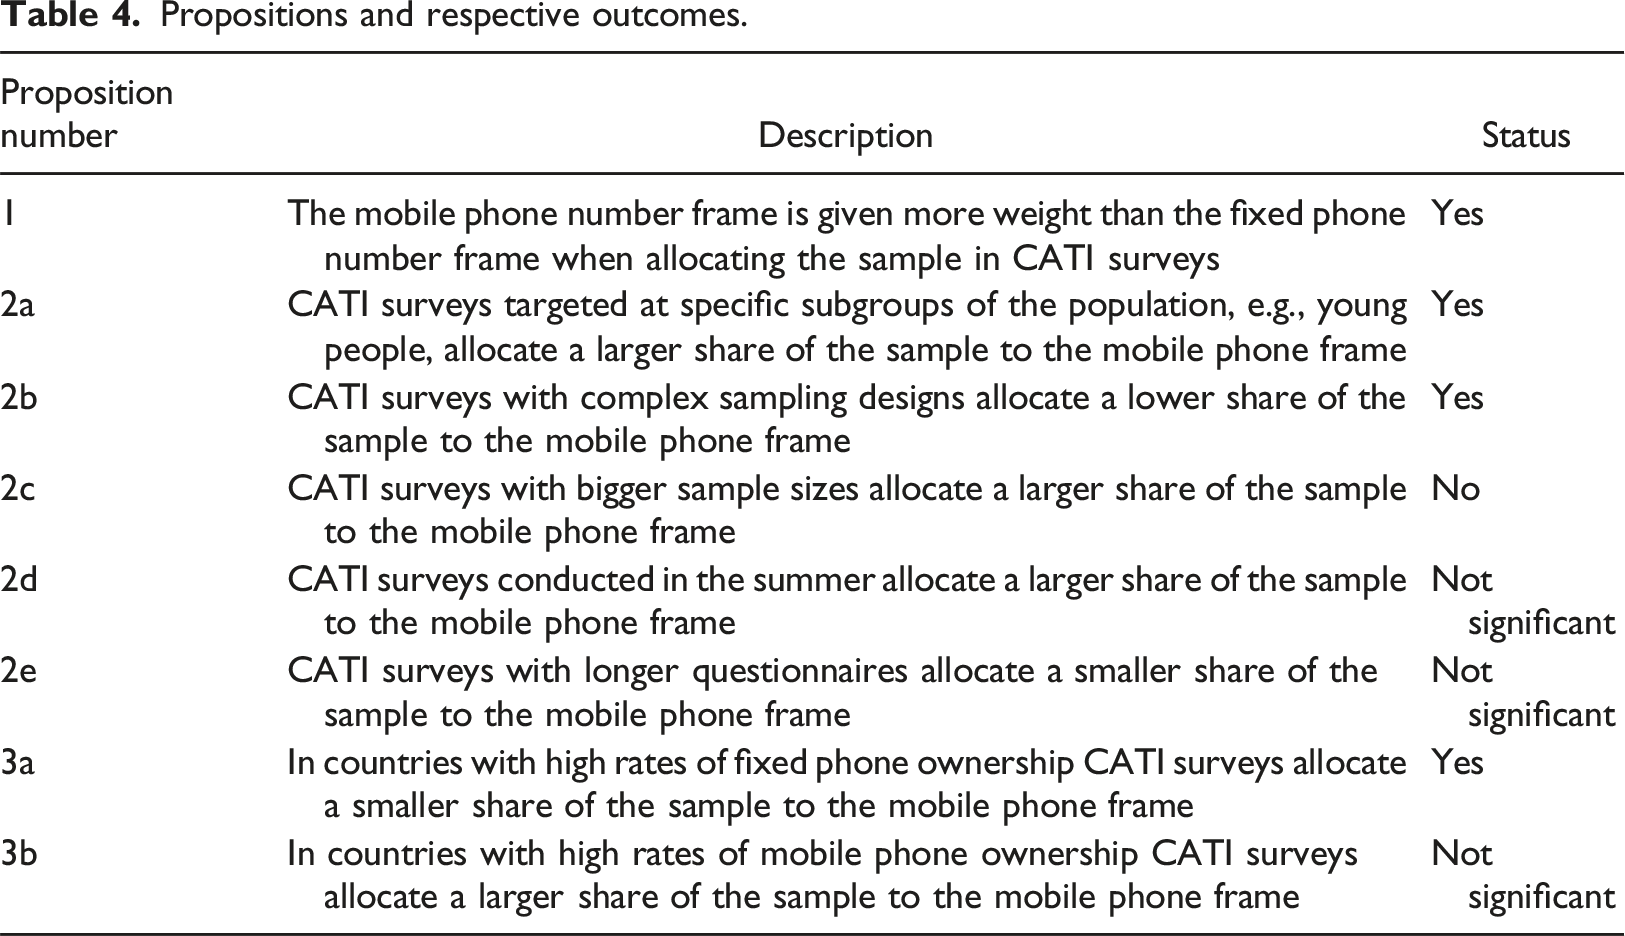
The number of fixed phone subscriptions per 100 people had the strongest explanatory power for the percentage of mobile phone units in the sample: the mobile phone frame in CATI surveys in countries with a high number of fixed phone subscriptions tends to have less weight. Mobile phone subscriptions did not have an impact on the magnitude of mobile phone units in the sample, probably because all countries have similar (very high) rates of mobile phone ownership. Proposition 3b is therefore not supported. Even though mobile phones provide near-complete population coverage, survey companies choose to give less weight to the mobile phone frame in contexts with high levels of fixed phone subscriptions, which is in line with proposal 3a.
Single-frame mobile phone designs are not yet the dominant design in CATI surveys, but they are already on the horizon. In the short/medium term, fixed phone number frame will lose importance given the foreseen evolution in the loss of fixed phone coverage together with the increased preference for mobile phone communications. Additionally, the levels of mobile phone coverage already achieved − near 100% in most European countries − indicate that RDD mobile frames are already capable of providing extensive coverage of the general adult population.
From a methodological point of view, the transition to single-frame mobile phone designs has two important advantages over dual-frame designs in CATI surveys. First, it is easier to define design weights as each respondent is sampled under a one-stage design, namely via a mobile phone number, and secondly, estimates are more accurate because of less variability in the design weights (due to the one-stage sampling process). Additionally, many of the barriers to wider usage of mobile phones in CATI surveys have been eliminated, e.g. the higher cost of mobile communications (European Commission, 2022). These conditions suggest that survey organisations should start preparing the transition to single-frame mobile phone designs.
Practical Implications
The smooth transition to single-frame mobile phone surveys requires survey companies to address two key issues: a) Nonworking numbers, and b) Geographic targeting. • •
To sum up, efficient and representative mobile phone samples require survey companies to have updated and informative sampling frames of mobile phone numbers. To meet this requirement, survey companies must either create and regularly check their own databases of mobile phone numbers or resort to large mobile phone number databases acquired from information services companies and containing demographic information such as addresses.
Limitations and Future Research
The present study has some limitations that open avenues for future research. First and foremost, the conclusions are based only on the EU27 countries that participate in the Flash Eurobarometer studies for the selected time range.
Secondly, this study is based on secondary data, which relies on data collection procedures used in the primary study that are not available for external users. The choice of the predictors of mobile phone frame use was conditioned by the available information in either the Technical Note of each Flash Eurobarometer study or the respective datasets. Other predictors that could be tested include the non-contacts or refusal rate per frame and interviewers’ performance, if available (ESOMAR, 2017, p. 14). Moreover, we do not have information on the initial sample of numbers randomly generated in each frame, only the distribution of mobile versus fixed units in the sample of respondents. While we assume that this may be a good proxy of the sample allocation decisions, the effect of nonresponse impedes a precise identification of the effective mobile versus fixed frame distribution.
Third, as the surveys only covered social sciences topics, our survey sample has a quite homogeneous survey topic which makes it difficult to explore the effect of this factor. It would be beneficial to go one step further by taking commercial surveys into account, namely through replications investigating mobile phone sampling for commercial CATI surveys within and across countries.
Finally, we only explored the outcome that higher percentages of mobile phone units are associated to longer fieldwork completion times from a descriptive perspective. However, caution is required when reading this result; it does not necessarily mean that mobile phones are not good if we want shorter fieldwork duration. Firstly, we do not know if fieldwork duration was defined in advance or whether it was a consequence of sample selection; secondly, fieldwork duration is also connected to call productivity, but we could not assess the effect of this factor due to a lack of information. This topic undoubtedly deserves investigation, namely because CATI surveys are typically chosen when results are needed quickly.
Although our research used a quantitative approach, this topic may benefit from a qualitative approach by inquiring survey organisations on the reasons and drivers of their decisions on the weight given to the mobile phone RDD frame in dual-frame CATI surveys.
Footnotes
Declaration of Conflicting Interests
The author(s) declared no potential conflicts of interest with respect to the research, authorship, and/or publication of this article.
Funding
The author(s) disclosed receipt of the following financial support for the research, authorship, and/or publication of this article: This work was supported by Fundação para a Ciência e Tecnologia, Grant UIDB/00315/2020. DOI: 10.54499/UIDB/00315/2020.
Correction (September 2024):
This article has been updated with corrections in affiliation.
Appendix
Flash Eurobarometer studies conducted under CATI survey design, in EU27 Member States in the 2019–2023 period.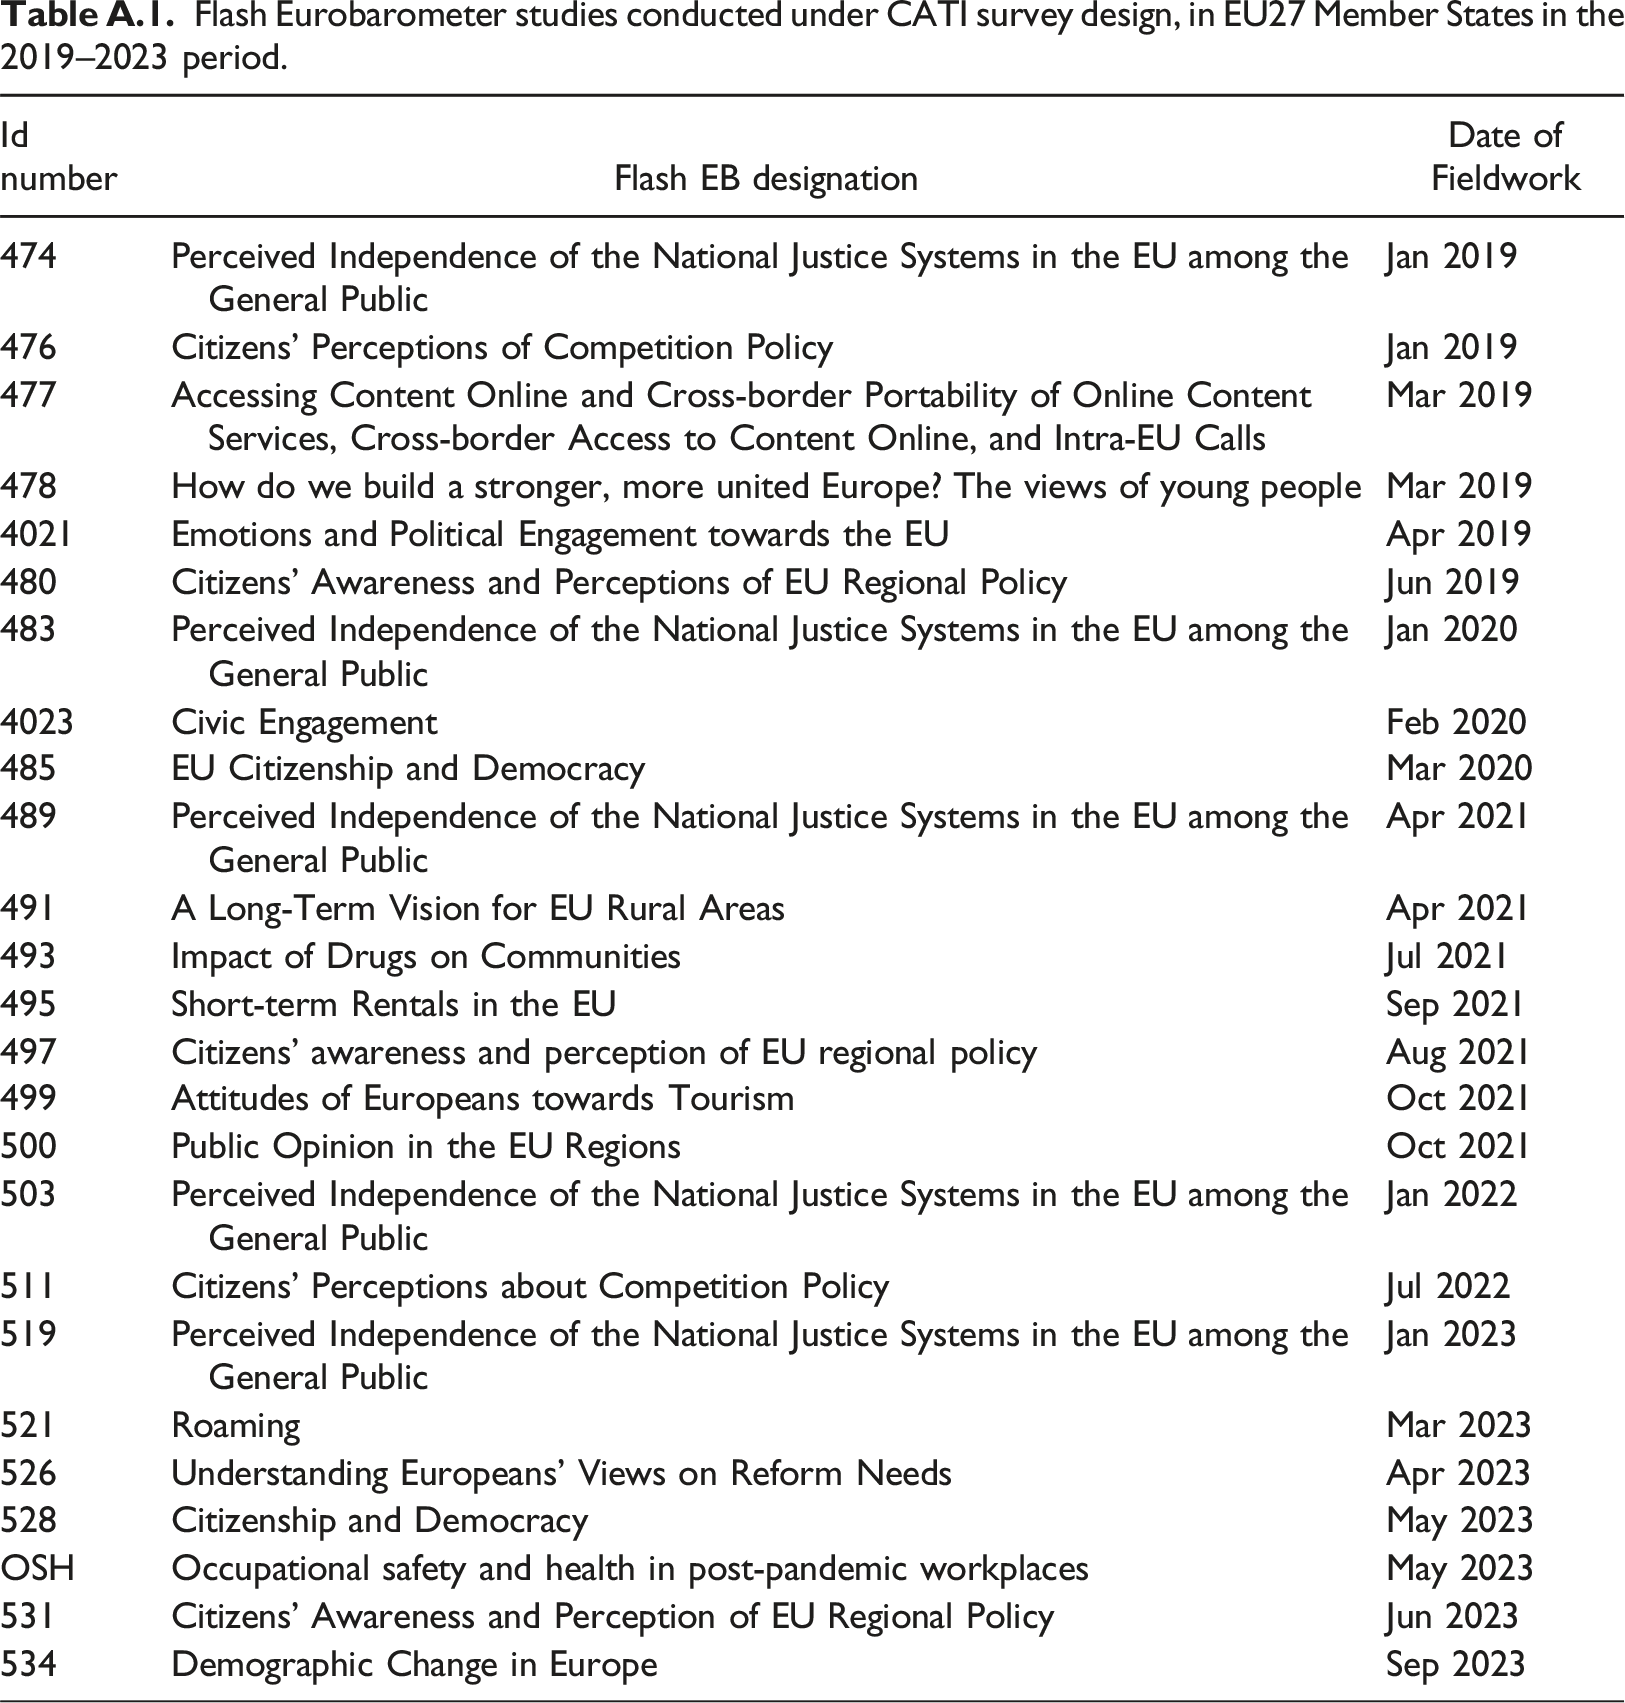
Id number
Flash EB designation
Date of Fieldwork
474
Perceived Independence of the National Justice Systems in the EU among the General Public
Jan 2019
476
Citizens’ Perceptions of Competition Policy
Jan 2019
477
Accessing Content Online and Cross-border Portability of Online Content Services, Cross-border Access to Content Online, and Intra-EU Calls
Mar 2019
478
How do we build a stronger, more united Europe? The views of young people
Mar 2019
4021
Emotions and Political Engagement towards the EU
Apr 2019
480
Citizens’ Awareness and Perceptions of EU Regional Policy
Jun 2019
483
Perceived Independence of the National Justice Systems in the EU among the General Public
Jan 2020
4023
Civic Engagement
Feb 2020
485
EU Citizenship and Democracy
Mar 2020
489
Perceived Independence of the National Justice Systems in the EU among the General Public
Apr 2021
491
A Long-Term Vision for EU Rural Areas
Apr 2021
493
Impact of Drugs on Communities
Jul 2021
495
Short-term Rentals in the EU
Sep 2021
497
Citizens’ awareness and perception of EU regional policy
Aug 2021
499
Attitudes of Europeans towards Tourism
Oct 2021
500
Public Opinion in the EU Regions
Oct 2021
503
Perceived Independence of the National Justice Systems in the EU among the General Public
Jan 2022
511
Citizens’ Perceptions about Competition Policy
Jul 2022
519
Perceived Independence of the National Justice Systems in the EU among the General Public
Jan 2023
521
Roaming
Mar 2023
526
Understanding Europeans’ Views on Reform Needs
Apr 2023
528
Citizenship and Democracy
May 2023
OSH
Occupational safety and health in post-pandemic workplaces
May 2023
531
Citizens’ Awareness and Perception of EU Regional Policy
Jun 2023
534
Demographic Change in Europe
Sep 2023