
Abstract
The present study introduces the concept of validating data quality indicators through re-classification. We use the term re-classification to mean the evaluation of how well an indicator detects the quality of different versions of a survey question for which the quality is known a priori. We illustrate its application with two examples. In both, we make use of 12 questions from prior experiments that manipulated text features of questions to create ‘low’ and ‘high’ quality versions of each question. In the first example, we coded each question version in SQP 2.1 to obtain indicators of validity, reliability, and quality. We compared these indicators between the two versions of each question to assess whether the SQP outcomes were sensitive to text features. In the second example, we used a pretest survey to obtain three indicators of survey quality: response latencies, item nonresponse, and consistency over time. Again, we compared these indicators between question versions to assess whether the indicators were sensitive to text features. We give recommendations for applying re-classification and an outlook for future research opportunities.
Introduction
To assess the quality of survey questions, different methods and indicators have been proposed. In survey-based market and social science research, several pretesting methods exist, including cognitive pretesting (e.g., Willis, 2005), expert reviews (e.g., Olson, 2010), split-ballot experiments (e.g., Petersen, 2008; Schuman & Presser, 1981), or eye-tracking studies (e.g., Neuert & Lenzner, 2016). A more general approach is to run a pretest survey (with a comparatively small number of cases) to assess the quality of questions based on indicators such as item nonresponse (e.g., Olson et al., 2019; Shoemaker et al., 2002), non-differentiation (e.g., Krosnick & Alwin, 1988; Roßmann et al., 2018), response latencies (Bassili & Scott, 1996; Hillygus et al., 2014), or attention check questions (e.g., Gummer et al., 2021; Meade & Craig, 2012). The Survey Quality Predictor (SQP; Saris & Gallhofer, 2007) is a program which allows researchers to test questions without performing a dedicated data collection. SQP provides information on three quality indicators: reliability, validity, and question quality. The estimation of these indicators is based on a meta-analysis of multitrait-multimethod (MTMM) experiments testing question formulations and characteristics. To compute the three indicators, researchers can manually enter the question to be tested in the SQP web application and code its characteristics, following the coding instructions, to receive a quality prediction (Zavala-Rojas, 2016).
New pretesting approaches and indicators to assess question quality have been developed regularly, with web probing (e.g., Lenzner & Neuert, 2017; Meitinger, 2017) and more sophisticated non-differentiation indicators (e.g., Kim et al., 2018) receiving considerable attention in recent years. Often, indicators used to assess questions are deduced from theoretical frameworks such as the model of the cognitive response process (Tourangeau et al., 2000) and the satisficing theory (Krosnick, 1991; 1999); most common in survey research are indicators which are considered both indicative of low quality response behavior and the result of specific question characteristics. Examples include non-differentiation, which indicates response behavior that leads to little variation in answers; the share of respondents selecting ‘don’t know’ options as cognitive shortcuts; or response latencies to identify superficial processing of the question. Similarly, eye-tracking studies are used to evaluate the effects of question wording on question comprehensibility (e.g., Kamoen et al., 2017; Lenzner et al., 2011). We argue that survey researchers will continue to propose new indicators and approaches. These new indicators, methods, and approaches need to be evaluated to determine whether they detect what they are supposed to detect. In other words, researchers who deduce and propose these methods must make sure that they successfully identify those issues in questions that cause low data quality. In this regard, it is important to establish which indicators are most effective in investigating a specific problem. This knowledge will enable researchers to make educated decisions as to which indicators to use in their analyses (e.g., in which instances to rely on response latencies or non-differentiation indicators).
In the present study, we focus on how existing and new methods and indicators for question quality can be validated (i.e., we test whether they measure what they are purported to measure). For this purpose, we detail an approach that we term ‘re-classification’ and that we find underused in survey research. In this approach, we evaluate an indicator based on its success in correctly classifying the quality of at least two different versions of a survey question for which the quality is known a priori and which has been experimentally varied. In other words, re-classification assesses whether indicators or methods detect what they are supposed to detect.
Validation through re-classification has several advantages that make it a viable supplement to other methods. First, re-classification can draw on existing experiments that have been developed, evaluated, and used in prior studies. The reuse of existing work is not only prudent in terms of resource-efficient research, but also contributes to replicability in particular and open science in general. Second, drawing on question experiments that consist of versions explicitly been designed to represent ‘low’ or ‘high’ quality questions is based on a rather weak assumption: that the design works as intended (e.g., complex question wording is indeed complex). Third, reusing an experiment means that the researcher is fully in control of which aspects are validated in their study. For instance, when selecting questions, one might select those that vary with regard to the complexity of their syntactical structure. In the subsequent analyses, indicators of interest can then be evaluated in how well they detect overly complex syntactical structures in question wordings. Ultimately, the results of these analyses allow researchers to select evaluation methods in a more targeted manner (i.e., to select the indicator most sensitive for detecting an issue of interest).
With the present study, we aim to close an existing research gap and to illustrate the use of re-classification. We show how existing experiments can be reused for this purpose based on two illustrative examples. In the first example, we drew on the well-known SQP program that is used by large-scale surveys such as the European Social Survey (ESS) during questionnaire development and translation processes. We apply the proposed method to show how insights could be gained from re-classification to advance indicators or programs such as SQP. To this end, we drew on 12 survey questions from prior experiments that have one ‘low quality’ and one ‘high quality’ version. We coded each using SQP and analyzed its output. At the time of data analysis, SQP was available to the public as version 2.1 but has now been upgraded to version 3.0 (Weber & Revilla, 2021).
In the second example, we drew on a pretesting survey which implemented the same 12 survey questions as part of a web survey. We then computed two indicators: item nonresponse and response times. In this example, we showcase the use of re-classification to examine the applicability of both indicators when investigating data quality. Here, we analyzed how well the indicators classified the different versions of the survey questions in terms of data quality. Re-interviewing the respondents in a second survey with the same 12 survey questions allowed us to further investigate consistency over time as a third indicator. Again, we analyzed how well this indicator classified the different versions of the 12 survey questions.
Our study is structured as follows. In the next section, we introduce re-classification, then present our two illustrative examples. We close with practical recommendations on how to validate quality indicators through re-classification and an outlook for future research.
Re-Classification
Re-classification relies on using one or more survey questions that are available in at least two versions: one that is of low quality (
Re-classification follows a two-step process detailed in Figure 1: (i), application of the quality indicator Schematic of validation through re-classification.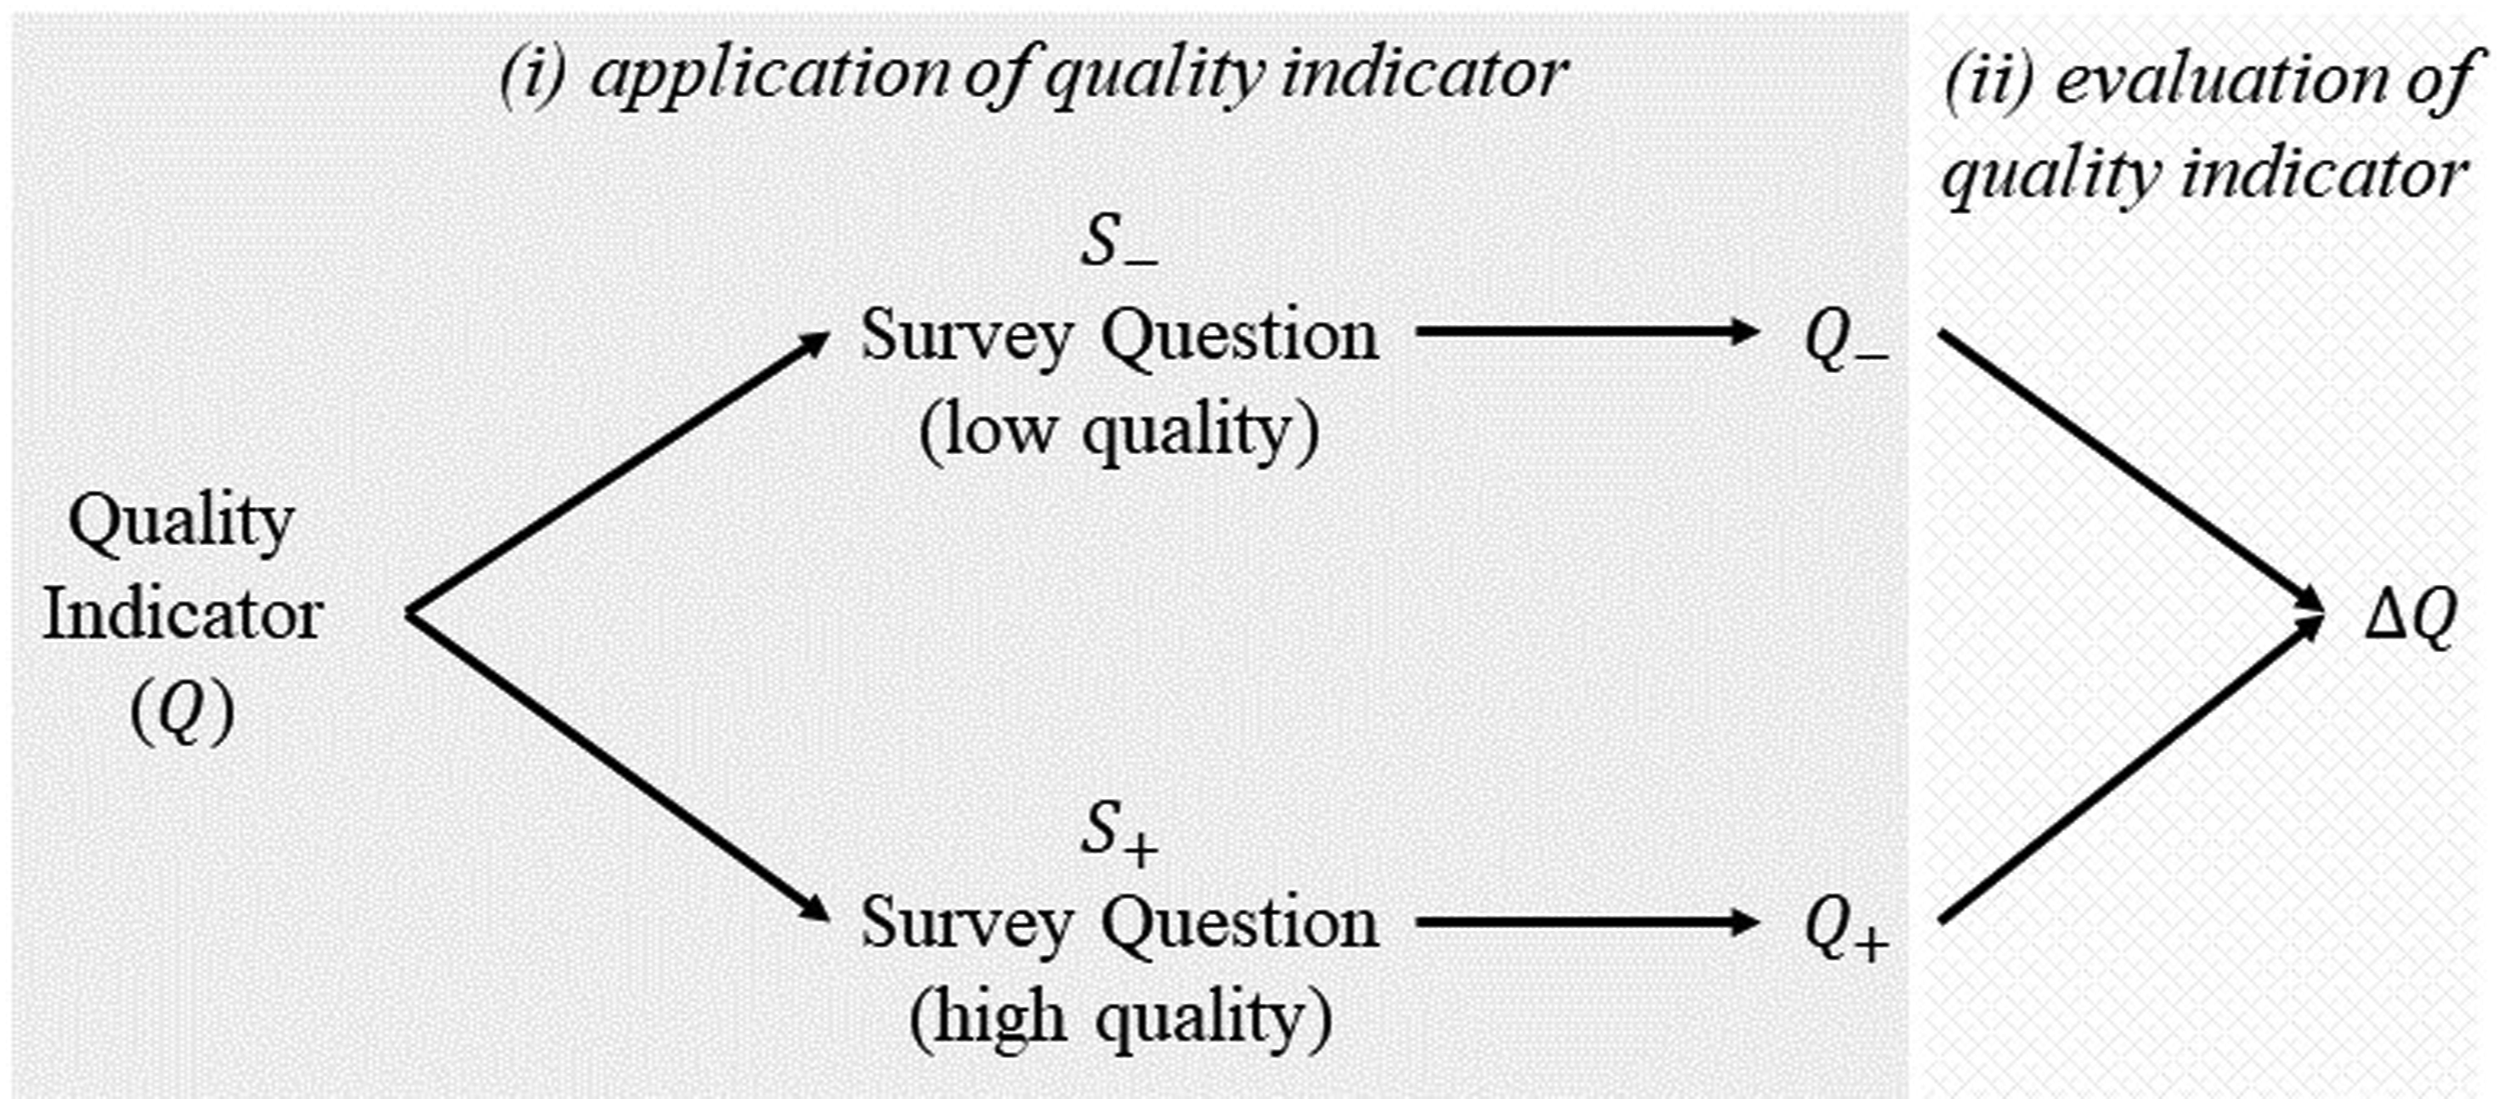
Moreover, for a successful re-classification, this difference should be in the correct direction, that is, it should indicate low quality for the low-quality version of the question and high quality for the high-quality version. If re-classification is successful, this means that the data quality indicator is correctly measuring the aspect of data quality manipulated in the survey experiment (e.g., complexity of question wording). Thus, a successful re-classification provides support that the quality indicator works as intended.
Illustrative Examples
Example 1: SQP
SQP is a program developed by Saris and Gallhofer (2007) that can be used to predict the quality of survey questions based on their characteristics without needing to collect new data. SQP uses cumulative data from past MTMM experiments for a meta-analysis to investigate the effect of questions’ characteristics on the reliability and validity of these questions. The idea behind SQP is that a meta-analysis of MTMM experiments can be used together with characteristics of questions to predict the quality of new questions. Researchers need to code the characteristics of the new question following a coding scheme in a web application and then receive SQP-specific measures of reliability and validity, as well as an overall question quality, which is the product of reliability and validity.
Data & Method
We re-used a set of 12 question pairs that had been experimentally manipulated to be either well-formulated or not by Lenzner et al. (2010) and Lenzner et al. (2011). The low-quality versions (text feature condition) contained problematic linguistic text features (e.g., a vague or ambiguous noun phrase), which have been shown to undermine question comprehensibility, while the questions in the control condition did not contain this text feature (Lenzner et al., 2011). We selected questions containing six problematic linguistic text features (low frequency words, vague or imprecise relative terms, vague or ambiguous noun phrases, complex syntax, complex logical structures, low syntactic redundancy) and two questions per text feature. Vague or imprecise relative terms, for instance, are words like ‘many’ or ‘often,’ which are frequently used in survey questions (Schaeffer & Dykema, 2020). To manipulate the questions in the text feature version, a vague quantification term was, for instance, added to the question. Questions with complex logical structures contain, for example, numerous logical operators like ‘or’ to connect subsentences (see Lenzner et al. (2010) for a detailed description of the different text features and question manipulations). In Table A.1 in the online supplemental material, we provide an overview of the 12 questions and the 24 low-and high-quality versions.
The two authors independently coded the 24 question versions in SQP 2.1 following the coding instructions provided on the SQP website (SQP, 2017). The coding scheme of this SQP version contains more than 60 formal and linguistic characteristics to be coded, such as the polarity of questions, the use of response labels, the position of the question in the questionnaire, or the number of words in the question text and response options. After coding the first questions, the authors discussed experiences and discrepancies in assigning codings to SQP characteristics, in order to avoid systematic differences. The average intercoder agreement was 81% but varied between 63% and 96% for the individual questions. To determine the final codes, the two coders discussed incidences of mismatching codes and made the final decision about the appropriate codings together.
Results
SQP Estimated Indicators for Control (C) and Text Feature (TF) Versions of the Questions.
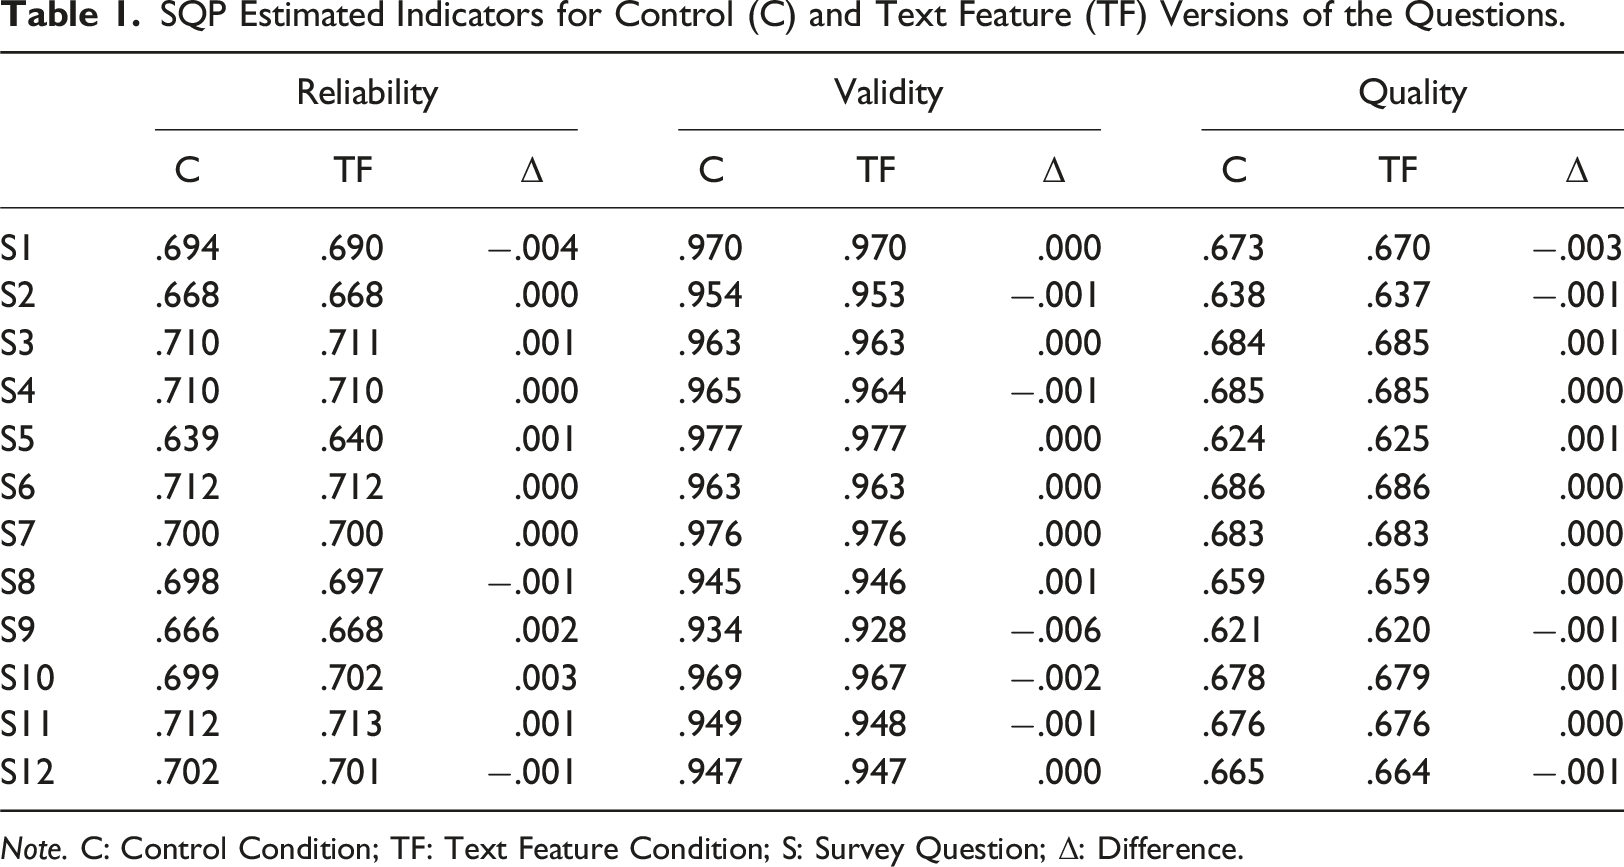
Note. C: Control Condition; TF: Text Feature Condition; S: Survey Question; Δ: Difference.
Overall, we did not find substantial differences between means of reliability, validity, and quality. In summary, by applying validation through re-classification, we found that the three quality indicators provided by SQP 2.1 were not sensitive to detecting low or high question quality resulting from problematic text features. Accordingly, the re-classification was not successful, and the indicators are thus not to be deemed suitable for detecting the impact of the text features used in the experiments on data quality.
Example 2: Pretesting Web Survey
As a second example, we conducted a web survey in which we implemented the same set of 12 question pairs. We compared the question pairs using item nonresponse and response times as data quality indicators. Respondents who completed the survey were invited to participate in a second survey about 3 weeks later, in which the same questions were administered to assess the consistency over time of the responses.
Data & Method
The pretest survey was conducted between November 11th and November 21st, 2021, with respondents from a German opt-in online panel operated by the survey company Respondi AG. The web survey used quotas for gender, age (18–39; 40–59; 60 and older), and education (with and without university entrance qualification). Overall, 2257 panelists accepted the survey invitation, of whom 64 broke off, and 2193 completed the survey. The mean and median duration of the questionnaire completion was 6 minutes and 55 seconds and 4 minutes 58 seconds, respectively. Respondents were randomly assigned to either the well-formulated question version or to the version containing one of the six text features. To evaluate possible differences in the sample composition between the two experimental conditions, χ2-tests were conducted. The results showed no statistically significant differences for gender (χ2 = .366; df = 2; p = .833), age (χ2 = 4.442; df = 4; p = .336), and education (χ2 = 3.848; df = 6; p = .697).
The second survey was fielded between November 30th and December 2nd, 2021. Overall, 1732 participants of wave one accepted the second survey invitation, 26 participants broke off, and 1706 completed it (75.6%). Another 12 participants had to be removed from the analyses because they could not be assigned to the first wave, resulting in 1694 completes (833 in the control and 861 in the text feature condition). Of those, 49.4% were female; 28.4% were between 18 and 39 years, 34.0% were between 40 and 59 years, and 37.6% were 60 years and older. Respondents in the second survey did not differ between the two conditions with regard to gender (χ2 = 1.255; df = 2; p = .534), age (χ2 = 4.0 df = 4; p = .406), and educational attainment (χ2 = 3.625; df = 6; p = .727).
All statistical analyses were performed with Stata (version 16.1). To compare response times, we report two sample t-tests and present p values for two-sided tests. When differences were in the hypothesized direction, we interpreted p < .100 as significant (i.e., converting a two-sided test to a one-sided test by dividing the p-value in half for directional differences consistent with our hypothesized direction).
Data Quality Indicators
For item nonresponse, we calculated the proportion of respondents who left a question blank before proceeding to the next question. For each question, we summed up the total number of item nonresponses under each experimental condition divided by the sample size for the condition and multiplied by 100. We applied χ2-tests to compare item nonresponse per question and a Kruskal–Wallis rank test to compare overall item nonresponse between conditions.
Response times were measured using server-side response times (in seconds). Respondents who had response times which were two standard deviations above or below the mean were excluded from the analyses (Mayerl, 2013). Because the distribution of response times was still skewed, we also applied logarithmic transformations (Fazio, 1990).
To calculate consistency over time across the two web surveys, we analyzed the gross error rate (Poe et al., 1988). The gross error rate was defined as the number of respondents for whom the response to the second survey differed from the response to the first survey, divided by the total number of respondents. We calculated the gross error rate for each question.
Results
Provided that the quality indicators are sensitive in terms of data quality, the text feature versions should theoretically yield higher item nonresponse due to respondents skipping the questions because of their higher complexity (or lower comprehensibility). Similarly, text feature versions should take longer to answer than questions without text features, because of the higher effort needed for cognitive processing, and item consistency should be lower. In these cases, re-classification will be successful.
Across all questions, response times were significantly shorter in the control than in the text feature condition (Mc = 1967.8, Mtf = 2301.6, t = −1.4595, p = .008). Cohen’s d indicated a small effect size (d = −.069). Overall, item nonresponse was low, amounting to 3.1% in the control and 1.9% in the text feature condition; nonresponse did not differ significantly. On average, respondents did not respond substantively to .16% of questions with a text feature; however, they failed to offer substantive responses to .26% of questions in the control condition containing no text feature (χ2 = .004; df = 1; p = .952).
The average gross error rate across all 12 questions was significantly higher in the text feature condition (37.4%) than in the control condition (35.4%), indicating that the text feature questions reduced the consistency of responses over time (χ2 = 5.84, df = 1, p = .016).1 On the level of the individual questions, the differences were significantly higher in the text feature condition in four out of 12 questions (S4: χ2 = 8.60, df = 1, p = .003; S6: χ2 = 5.03, df = 1, p = .025; S9: χ2 = 5.00, df = 1, p = .025; S11: χ2 = 7.37, df = 1, p = .007).
In summary, when applying re-classification we found that response latencies and consistency over time were effective in the detection of low or high question quality, when this difference in quality was the result of text features. We found that item nonresponse was not sensitive to these variations in our study. The results of our re-classification for item nonresponse suggest that further analyses are warranted to study what caused these issues (e.g., the omission of a “don’t know” category leading to respondents providing non-substantive responses). In general, the re-classification analysis determined that response latencies and consistency over time were appropriate indicators to detect issues in questions that derive from text features.
Conclusion
With the present study, we introduced and illustrated re-classification as a method for evaluating data quality indicators. We argue that this method has been underused in survey-based market and social science research to date, despite it representing a legitimate complement to traditional validation methods. Re-classification involves evaluating an indicator based on how well it detects the quality of (at least) two different versions of a survey question for which the quality is known a priori.
We have presented the application using two examples to illustrate that not every indicator is suitable to detect every aspect of data quality, and thus re-classification may be an easily implementable method to determine these limitations. Our first illustrative example showed that SQP version 2.1 has issues detecting changes in question wordings that impaired question comprehensibility. Overall, the differences in the indicators obtained via SQP were very small and did not allow for a differentiation in quality. In our second illustrative example, we assessed how three data quality indicators (item nonresponse, response latencies, and consistency over time) performed in detecting the same quality issue in the same 12 survey questions based on data from a pretest survey. Analyzing the pretest data showed that response latencies and consistency over time were indicative of the differences in the questions’ quality, while item nonresponse was not.
In summary, re-classification can be used to determine how well an indicator is suited to assessing a specific aspect of question quality. Consequently, the method can help us to better understand the still growing landscape of data quality indicators, and specifically to help us validate selected indicators. When quality indicators or pretesting methods are compared, diverging or even contradictory findings may arise. We may consider response latencies as an example, where difficulties could lead to slower response times because solving the task requires processing time, but also to faster responses (e.g., speeding), when respondents engage in satisficing response behavior by not taking enough care with their answers (e.g., Bassili & Scott, 1996; Zhang & Conrad, 2014). The proposed method has the potential to better select indicators for specific research questions on a fit-for-purpose basis. Moreover, re-classification can draw on existing survey experiments that systematically vary question characteristics, and thus promotes the re-use and replication of previous studies. Not only does this fit well with the increasing demand for open science practices in market and social science research, but it also encourages resource-efficient research practices that utilize existing work.
The present study is intended to introduce a method we perceive as underused in survey-based market and social science research and to illustrate its application. We invite further research to apply the re-classification approach to existing indicators and research questions. Contributing experimental research and knowledge on data quality indicators will help researchers select the appropriate indicator(s) or method(s) for their specific research goal. Besides enriching our understanding of existing indicators, we see special merit in the proposed method when it comes to developing new data quality indicators. Here, re-classification can be applied to gauge which aspects of question quality an indicator is genuinely able to measure, to establish where further development is needed, or to identify an indicator’s limitations.
Supplemental Material
Introducing the Validation of Data Quality Indicators Through Re-Classification: The example of SQP and pretest surveys
Supplemental Material for Introducing the Validation of Data Quality Indicators Through Re-Classification by Cornelia E Neuert, and Tobias Gummer in International Journal of Market Research.
Footnotes
Acknowledgments
We would like to thank Ranjit Singh for his thoughtful comments and suggestions that helped to improve the manuscript and Timo Lenzner for providing the translations of the questions in English.
Declaration of Conflicting Interests
The author(s) declared no potential conflicts of interest with respect to the research, authorship, and/or publication of this article.
Funding
The author(s) disclosed receipt of the following financial support for the research, authorship, and/or publication of this article: Funded by the Deutsche Forschungsgemeinschaft—Project number 491156185.
Supplemental Material
Supplemental material for this article is available online.
Note
References
Supplementary Material
Please find the following supplemental material available below.
For Open Access articles published under a Creative Commons License, all supplemental material carries the same license as the article it is associated with.
For non-Open Access articles published, all supplemental material carries a non-exclusive license, and permission requests for re-use of supplemental material or any part of supplemental material shall be sent directly to the copyright owner as specified in the copyright notice associated with the article.