
Abstract
As global material wealth rises and young people are heavily exposed to advertising across a range of channels, including rapidly developing social media where material goods are flaunted as symbols of a happy and successful lifestyle, materialism levels across the world seem likely to rise. Given consistent research showing the correlation between materialism and low well-being, this gives cause for concern. However, no studies have so far tested whether current measures of youth materialism are generalizable across different countries and cultures. Our article fills this gap by exploring through a range of internal and external validity tests whether the popular Youth Materialism Scale (YMS) can be used with confidence across China, France, Belgium, Poland, the United Kingdom, and the United States. We show that a 5-item version of YMS is invariant across the countries (internal validity) and that it broadly correlates in expected ways with six different theoretically related constructs: Self-Esteem, Life Satisfaction, Attitude to Advertising, Parental Support, TV Use, and Internet Use (external validity). We believe that researchers and policy makers can confidently use this 5-item version of the scale in international contexts.
Keywords
Introduction
Before the 2020 pandemic, global material wealth had risen by US$14 trillion in 1 year alone to a total of US$417 trillion (Credit_Suisse, 2018). At the same time, across the globe, young people’s media use has shifted to digital/mobile, with time spent on platforms such as Instagram, Weibo, WhatsApp, or Snapchat (Ofcom, 2019; Statista, 2019). Social media are places where people tend to only portray the most positive aspects of their lives, and where material possessions play an important role in embellishing profiles.
Social media are heavily funded by and lend themselves readily to very targeted advertising which can have a dark side. A substantial body of previous research shows a consistently strong relationship between exposure to advertising and materialism (e.g., Buijzen & Valkenburg, 2003; Opree et al., 2014). In particular, materialism is likely to be high for teenagers, who are in a turbulent life phase where they are searching for their identity and are extremely sensitive to affirmation from relevant others (Zawadzka et al., 2019). Although Gentina et al. (2018) and Burroughs and Rindfleisch (1997) showed a positive side to youth materialism as a coping mechanism (when sharing with others to reduce loneliness), the vast majority of research on young people shows a negative correlation between materialism and a wide range of well-being measures (Ahuvia & Wong, 2002; Buijzen & Valkenburg, 2003; Chaplin & John, 2007; Cohen & Cohen, 1996; Goldberg et al., 2003; Kasser et al., 2014; Manolis & Roberts, 2012; Nairn et al., 2007; Opree, et al., 2014; Schor, 2004; Tsang et al., 2014; Twenge & Kasser, 2013; Williams et al., 2000).
This is an issue that has vexed policy makers. For example, alarmed by UNICEF’s Report Card 7 (2007) that put UK youth at the bottom of the well-being league for rich countries, the UK government commissioned a study on youth materialism on behalf of UNICEF UK (Nairn & IpsosMORI, 2011). Using in-depth video ethnography, the researchers explored materialism in the lives of young people and their families in the United Kingdom and compared this with Spain and Sweden whose young people fared better. The findings highlighted the tension and discontent brought into the lives of UK youth by the desire for and social use of highly advertised status clothing and technology brands. Materialism had become negatively enmeshed in UK young people’s family relationships with parents extending themselves financially to buy desired goods and thus putting the family under stress. The same dynamic was not found in Spain where commercial television is much more recent and extended family exerts a stronger influence, or in Sweden where the strong ethos of citizen equality moderates the effects of social comparison.
While highly indicative, these findings could not easily be quantified or compared meaningfully across the world as no measure of youth materialism has been tested for global suitability. The purpose of this article is thus to conduct the first tests of a youth materialism scale to assess if it is reliable and valid to use across a range of countries and thus whether researchers and policy makers can use it with confidence to track materialism in international settings.
The scale we test in this article is the YMS (Goldberg et al., 2003) and we test it across six countries (China, the United States, Poland, the United Kingdom, Belgium, and France). A number of tools exist to assess scales and their validity, a concept which itself has a range of forms and types (e.g., Brislin, 1976; Cronbach & Meehl, 1955; McIntire & Miller, 2005). In this study, we were primarily interested in whether the items and underlying factor structure of the scale itself are equal across all six countries (i.e., internal validation), but we also wanted to test whether in each country the scale demonstrates distinct associations with a range of other constructs in the manner we would expect given previously established and tested theories (i.e., external validation).
Defining youth materialism
Although the existing literature on materialism offers multiple definitions (e.g., Belk, 1984; Grouzet et al., 2005; Mukerji, 1983; Richins & Dawson, 1992; Ward & Wickman, 1971), the majority of research on materialism builds on a definition either in terms of a personality trait (Belk, 1984) or of a personal value (Richins & Dawson, 1992). Adult scales exist to measure both of these conceptualizations. Belk’s (1984) scale conceptualizes materialistic people as possessing a set of three personality traits, namely non-generosity, possessiveness, and envy, who focus on possessions and accumulating wealth. Richins and Dawson’s (1992) scale assumes that materialistic people hold the following three enduring beliefs: that acquiring possessions is a central life goal, that possessions are important for happiness, and that possessions signal success. The YMS (Goldberg et al., 2003) is based on both materialism as a personal value and also, to some extent, a personality trait. Goldberg et al. (2003) adapted items from both Belk’s (1984) and Richins and Dawson’s (1992) scales for young people. This resulted in 10 items including “I really like the kids that have special games and clothes” (Success), “When you grow up, the more money you have, the happier you are” (Happiness), and “I would rather spend time buying things, than doing almost anything else” (Centrality). The YMS is conceived of as a uni-factorial construct and has been validated in a range of studies including with UK and US teenagers (Bottomley et al., 2010; Goldberg et al., 2003). However, no study has previously set out to measure whether the scale has the same structure, meaning, and external validity across very different countries. This is what we set out to accomplish.
Sample, materials, and procedures
Selecting sample countries (collectivism vs. individualism and national wealth)
First of all, we had to select the countries to include in our sample. We chose them with a view to include (1) a range on Hofstede’s (1990) collectivism–individualism continuum and (2) a range in national wealth. Only a very limited body of research has studied materialism in a cross-cultural context (e.g., Clarke & Micken, 2002; Eastman et al., 1997; Ger & Belk, 1996) and like most materialism research this has concentrated on adult populations. Schaefer et al. (2004) conducted one of the very few cross-cultural adolescent studies into materialism where they explored the relationship between materialism and fashion consciousness across China, Japan, and the United States. The study aimed to ascertain the existence of the “global teen” as a market segment with a shared set of values that could be targeted and thus be attractive to marketers, particularly in relation to branded fashion and lifestyle items (e.g., Meredith & Schewe, 2002; Wee, 1999; Wysocki, 1997). Previous research had shown mixed results with Tully (1994), for example, suggesting that it was relatively easy to form a global teen marketing strategy but Wee (1999) casting doubt on this in the light of studies such as one in Singapore (75% of population ethnic Chinese) where collective family and cultural values were seen to be more important than the individualistic values nurtured in the United States (Taylor & Cozens, 2002). Schaefer et al. (2004) also showed a substantial difference in both materialism and fashion consciousness between Chinese and US young people and suggested that there might be a difference in materialism between collectivist and individualist cultures as originally defined by Hofstede (1990, 2001). In view of this previous (admittedly scant) research, we decided to select countries at a range of points on Hofstede’s scale ranging from high in individualism (The United States = 91; The United Kingdom = 89), mid-range in individualism (Belgium = 75, France = 71, Poland = 60) and high in collectivism (China = 20; Hofstede Insights, 2019).
Other research maintains there is a link between national wealth and materialism, but that this might work in two different ways. On one hand, in line with the compensatory consumption theory (Inglehart, 2008), in less wealthy countries, difficulties in satisfying people’s needs may increase materialism. On the other hand, the social modeling theory (Kasser, 2005) would suggest that in more wealthy countries, ubiquitous wealth, and intense marketing activity that stimulates consumption may boost materialism (Campbell & Mankin, 1991). Thus, we selected both wealthy and less wealthy countries as measured by average household net disposable income per capita in US dollars (Statista, 2019). The figures at the time of the study were as follows: US = US$41,071, France = US$29,759, Belgium = US$28,700, UK = US$26,687, Poland = US$17,820, and China = US$4,677.
Selecting sample schools
Having selected our countries, we aimed to survey 200 adolescents aged 13–17 (following Achenreiner, 1997) per country with an equal split of boys and girls. In the event, with some parents opting out, we finally surveyed 1,778 youngsters (895 boys, 883 girls): Belgium (n = 295, 43.1% boys, 56.9 % girls, aged M = 13.38, SD = 1.17), China (n = 229, 53.3% boys, 46.7% girls, aged M = 13.78, SD = 0.73), France (n = 322, 48.8% boys, 51.2% girls, aged M = 14.69, SD = 0.95), Poland (n = 300, 50% boys, 50% girls, aged M = 13.61, SD = 0.81), the United Kingdom (n = 456, 56% boys, 44% girls, aged M = 14.48, SD = 0.60), and the United States (n = 176, 47.7% boys, 52.3% girls, aged M = 14.72, SD = 0.45).
We collected data only in schools in affluent areas in each country to minimize the noise that could be introduced by including young people from a range of socio-economic backgrounds as previous research has shown substantial differences in materialism levels by socio-economic status (Nairn et al., 2007). To check for consistency in affluence level across the sample we used the family affluence scale (FAS; Currie et al., 1997, 2008), which was developed in the international context of the World Health Organization’s (WHO) Health Behaviour of School-Aged Children (HSBC, 2020) study that has run across the globe since 1982. It asks four simple questions: does your family own a car, van, or truck? Do you have your own bedroom for yourself? During the past 12 months how many times did you travel away on holiday with your family? How many computers does your family own? The vast majority of respondents were in the highest affluence category (83.7%) with 15.3% in the middle affluence category and only 1% in the lowest affluence category. In addition, for the majority of the participants (88.7%), either one parent (35.39%) or both parents (53.31%) worked full-time. All questionnaires were completed properly in all groups and included no missing data.
Material
The international team of researchers authoring this article prepared the questionnaire. We translated the original French version into Chinese, Flemish, English, and Polish in consultation with language experts (native speakers) and we used a translate-back-translate procedure to ensure the quality of the translations (Brislin, 1970).
We measured materialism with the Goldberg et al. (2003) YMS that consists of 10 statements, for example, I would be happier if I had more money to buy more things for myself and to which respondents answered questions on a 5-point scale: 1 = strongly disagree to 5 = strongly agree.
We ascertained the external validity by testing whether the YMS was correlated in theoretically expected ways with a range of six other related constructs. First, in the light of previous studies by Buijzen and Valkenburg (2003) and Opree et al. (2014), we expected materialism to be positively related to believing and liking advertising. This was measured with the commonly used 6-item Attitude to Advertising scale (Derbaix & Pecheux, 2003) (e.g., I believe what they show in advertising). Respondents answered questions on a 5-point scale: 1 = strongly disagree to 5 = strongly agree. The internal reliability of the Attitude to Advertising scale was satisfactory across all countries with Cronbach’s α ranging from .85 to .94.
We also expected that time spent on the highly commercialized media of TV and Internet would be positively related to materialism given studies over many years and countries that show how media cultivate perceptions of reality that tend to exaggerate the importance and commonality of material possessions (e.g., Morgen & Shanahan, 2010; Shrum et al., 2005). Thus, our second and third constructs were TV usage and Internet usage respectively, measured with a 4-item scale developed by Nairn et al. (2007) and validated by Bottomley et al. (2010). The reliability of the TV and Internet Usage Scales were satisfactory across all countries, with α ranging from .82–.92 and .89–.94, respectively.
As noted at the beginning of the article, well-being is a known correlate of materialism. We used Self-Esteem and Life Satisfaction as our fourth and fifth constructs to measure external validity. For the former, we used the well-known 10-item Rosenberg’s Self-Esteem Scale where participants rated their answers to statements using a 5-point scale: 1 = strongly disagree to 5 = strongly agree. We used popular and well-performing native language versions for each of the tested countries (Chinese version—Farruggia et al., 2004; Dutch version—Franck et al., 2008; French version—Vallières & Vallerand, 1990; English version—Rosenberg, 1965; Polish version—Łaguna et al., 2007). Beyond this, because research has shown that children and young people, and also some nationalities have a problem with negatively worded statements (Marsh, 1996; Wong et al., 2003), we subsequently removed these from our analysis and used only the five positively worded items. The reliability of this shorter Self-Esteem scale was satisfactory α = .81–.90 for all countries. Our second well-being measure was Life Satisfaction based on the adjusted and simplified version of Huebner’s (1994) scale. This consists of 40 items measuring young people’s satisfaction with the following five domains: family, friends, school, living environment, and self. Given that we already measured self-esteem, we decided to drop the “self” life domain. Following Opree et al. (2011), we used single items in which adolescents had to indicate how satisfied they are with these four other life domains, ranging from not at all (1) to very happy (5). These four items were then summed to extract a general life satisfaction score. The reliability of the Life Satisfaction scale was satisfactory across two countries (US = .75, China = .90) and near satisfactory for the other countries with α ranging from .62 to .67.
Finally, we expected Parental Support to be negatively related to materialism, in other words, teens who feel encouraged and supported by their parents are less likely to feel the need to fill an emotional void with material goods. Previous studies have shown that cold, controlling, punitive, and inconsistent parenting is positively related to adolescents’ materialism (Cohen & Cohen, 1996; Kasser et al., 1995; Williams et al., 2000) and that supportive parenting is negatively related to materialism (Chaplin & John, 2010; Rindfleisch et al., 1997). We measured Parental Support with the 9-item Parental Support Scale (Armsden & Greenberg, 1987) (e.g., My parents accept me as I am). Respondents answered questions on a 5-point scale: 1 = strongly disagree to 5 = strongly agree. The reliability of Parental Support scale was satisfactory across five countries (Belgium, China, Poland, the United Kingdom, the United States), with α ranging from .70 to .86 and near satisfactory for France (α = .65).
Procedure
We conducted this study as part of an international project on adolescent materialism and we followed the same procedure in each country. First, we obtained ethical consent from the ethics committee or Institutional Review Board (IRB) within the respective universities. Next, we contacted schools to ask permission for data collection. In participating schools, the young people were sent a letter with information about the study and an active parental consent form. Only those who received explicit consent from their parents could participate. Next, we asked the teenagers for informed assent. In this stage, participants could decide for themselves whether they wanted to participate. All those whose parents agreed participated in the study. Participants sat in a classroom in silence to complete the survey individually. They were not allowed to interact during data collection. The survey started with socio-demographic data: age, gender, type of school (public/private), school grade, family living situation, occupation of parents, and family affluence (Currie et al., 2008). Next, participants filled in a set of scales on consumer attitudes and well-being that included the YMS, Attitude to Advertising, TV and Internet Usage, Self-Esteem, Life Satisfaction and Parental Support.
Data analysis
The data analysis and results are presented below. The analysis process is displayed graphically in Figure 1. First, we verified the reliability of the data (1.1) and proceeded to build a confirmatory factor analysis (CFA) for the six countries separately (1.2). Next, we built a multigroup CFA (2.1) and conducted three nested internal validation tests (2.2). First, configural invariance to test whether the factor pattern is the same across all six countries or in other words if the same statements load onto the same number of factors allowing us to ensure the six countries can be represented by the same model structure (2.2.1). Second, metric invariance to assess whether the factor loadings are the same across countries which means that young people in each country respond to the statements in same way or in other words that the magnitude of the relationship with the statements is the same across countries. If metric invariance is demonstrated, this also means that the scale can be reliably used to do correlation analysis with other external constructs (2.2.2). Third, structural covariance invariance is a test to give us confidence that the model had the same internal consistency across the six countries (2.2.3).
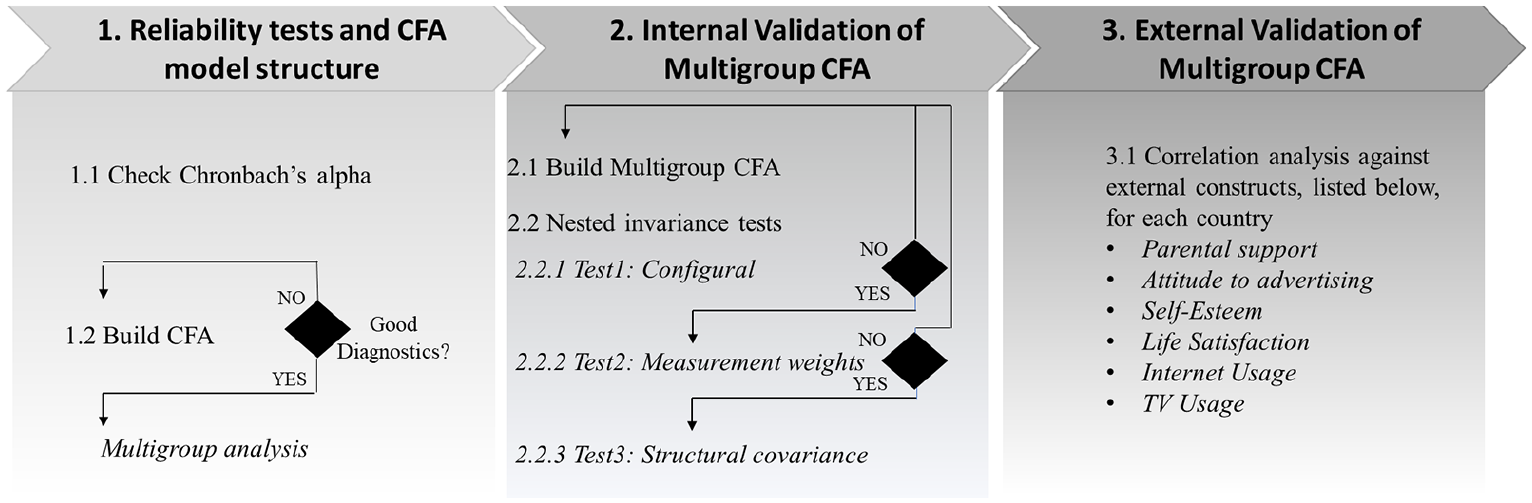
Overview of the analysis process.
Finally, we conducted external validation tests aimed to investigate if the model was sensible in terms of its association with other theoretical constructs in the data, that is, Self-Esteem, Life Satisfaction, Attitude to Advertising, Parental Support and TV and Internet Usage (3.1).
Result of reliability tests and CFA model structure
We first assessed the reliability of the YMS in each country by calculating Cronbach’s alpha in SPSS. Cronbach’s alpha tests the reliability among a set of items and indicates whether this set of items consistently measures an underlying construct (Streiner, 2003). We found it to be reliable in every country with α ranging from .75 to .89 (Streiner, 2003). These results echo previous reliability tests conducted in the United States and United Kingdom (Bottomley et al., 2010; Chaplin & John, 2010; Goldberg et al., 2003).
Next we conducted CFA (maximum likelihood estimation) which checks the factor structure of a construct (in this case, the assumed uni-dimensionality of the YMS) and indicates whether a latent variable model fits the observed item scores in the data (De Roover et al., 2014). The CFA model was constructed using AMOS 26. We created a conceptual model in AMOS in which the latent construct “materialism” was structured onto one factor reflecting the YMS (see Figure 2).
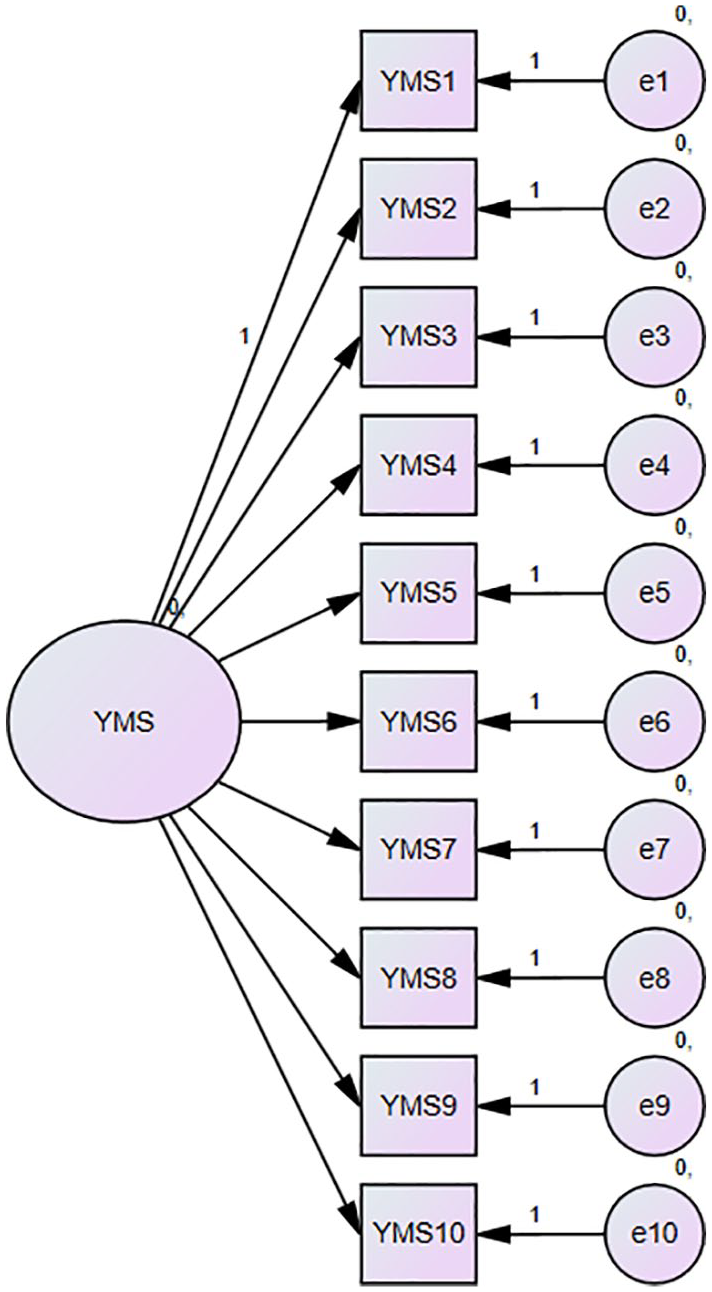
YMS CFA structure.
The first stage was to determine if the YMS set of 10 statements formed a suitable representation of the underlying latent dimension of the YMS structure. Hence, the YMS variables were loaded onto a single factor structure. The individual country models were run (labeled Model 1a through Model 1f) and the results are displayed in Table 1. The models are, generally, of an unsatisfactory fit, given that (1) the Comparative Fit index (CFI) and TLI < 0.9 for most models, (2) there are unacceptably high root mean square error of approximation (RMSEA) values (Byrne, 2010), and (3) CMIN/df (chi-square mean/degree of freedom) is unacceptably high (> 5) for 3 out of 6 of the models (Kline, 1998), (4) although the p-value significance is < .05, this test has been deemed unreliable for these sample sizes (Bottomley et al., 2010).
Model 1 fit statistics.
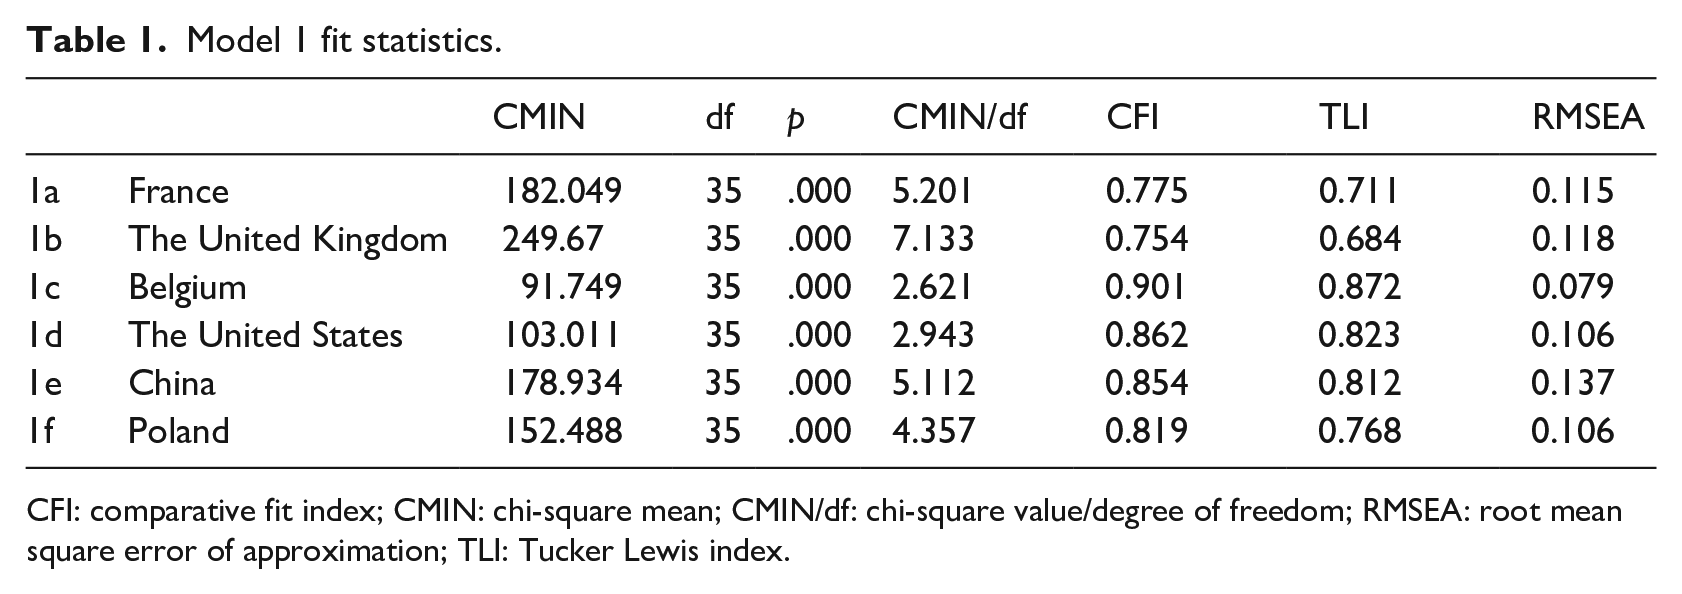
CFI: comparative fit index; CMIN: chi-square mean; CMIN/df: chi-square value/degree of freedom; RMSEA: root mean square error of approximation; TLI: Tucker Lewis index.
On inspecting the models’ modification indices, many of the between-error indices were high, challenging the assumption of independence for a number of the pairings. Therefore, the models were re-run to introduce covariance between pairs of error terms with high modification indices. Given the final intention was to create a model which would be suitable for all countries, an attempt was made to be as consistent as possible across countries in terms of which pairs were covaried. This resulted in the covarying of the following pairs of errors, e1:e4, e2:e8, e4:e7, e6:e10, e8:e9. In addition, the UK model also introduced covariance terms for e7:e10 and China additional covariance terms for e1:e2 and e2:e3. These are labeled as Model 2a through Model 2f and the fit statistics can be found in Table 2.
Model 2 fit statistics.
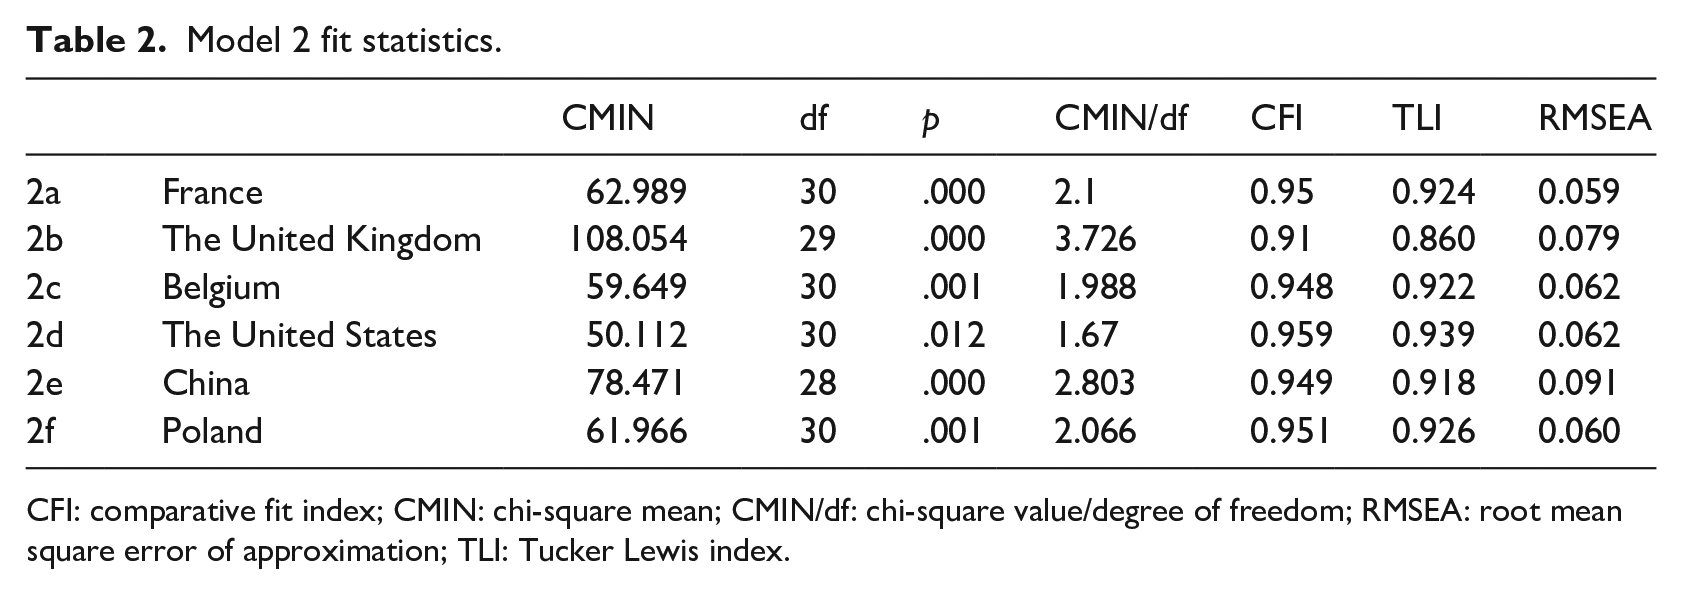
CFI: comparative fit index; CMIN: chi-square mean; CMIN/df: chi-square value/degree of freedom; RMSEA: root mean square error of approximation; TLI: Tucker Lewis index.
These models performed much better. All CFI values were acceptable (> 0.9). All but one Tucker Lewis index (TLI) > 0.9, RMSEA values were acceptable (China is a little high but acceptable at this stage to allow progress). The CMIN/df was also acceptable for all models (< 5) and good (< 3) for all but the United Kingdom (Kline, 1998). The statistics described earlier demonstrated that there was sufficient evidence to proceed to the next stage.
Internal validation
The purpose of the internal validation was to investigate whether the YMS could be represented using a latent structure model and whether this model was suitable across all six countries and all 10 YMS statements. In order to test this, we used a multigroup CFA together with three increasingly restrictive tests to test the invariance of the model across the six countries, in line with past studies (e.g., Bottomley et al., 2010). Given that these are nested, the first test must be passed in order to proceed to the second and similarly to the third. The first tests whether we have the same number of factors and a similar loading pattern across countries (Byrne, 2010). If this configural model test is passed then the next tests, in addition, whether the measurement weights are invariant across countries. Finally, the third tests, in addition, if the structural covariances are equivalent across countries (Byrne, 2010).
The nested nature of the tests suggested a chi-square difference would make an appropriate test. However, it has been demonstrated that this test alone may be unreliable given its sensitivity to sample size, making it prone to Type 1 errors (i.e., incorrectly rejecting the underlying hypotheses of invariance in the tests; Cheung & Rensvold, 2002). Bottomley et al. (2010) also Cheung and Rensvold (2002) suggest observing the changes in CFI where a change of < 0.01 would indicate the model to be statistically equivalent in fit. Both the chi-square and CFI were taken into account for this study. The analysis of the nested tests is reported in turn below.
Test 1: configural invariance of the 10-item YMS
Given the nature of this test (whether the same number of factors and similar factor loadings apply), we imposed no constraints other than that the structure should mirror that of Model 2 (Byrne, 2010). Given that the model parameters are fitted simultaneously for all countries, an overall satisfactory fit is sufficient to assume configural invariance (Byrne, 2010). The results are shown in Table 3. The CFI (> 0.9), CMIN/df (< 3), and RMSEA (< 0.05) demonstrated a good model fit with TLI at 0.899 which we considered good enough (usual requirement > 0.9). The model thus offered configural invariance across the countries and the analysis proceeded to the second test.
Model 3 configural invariance test statistics.
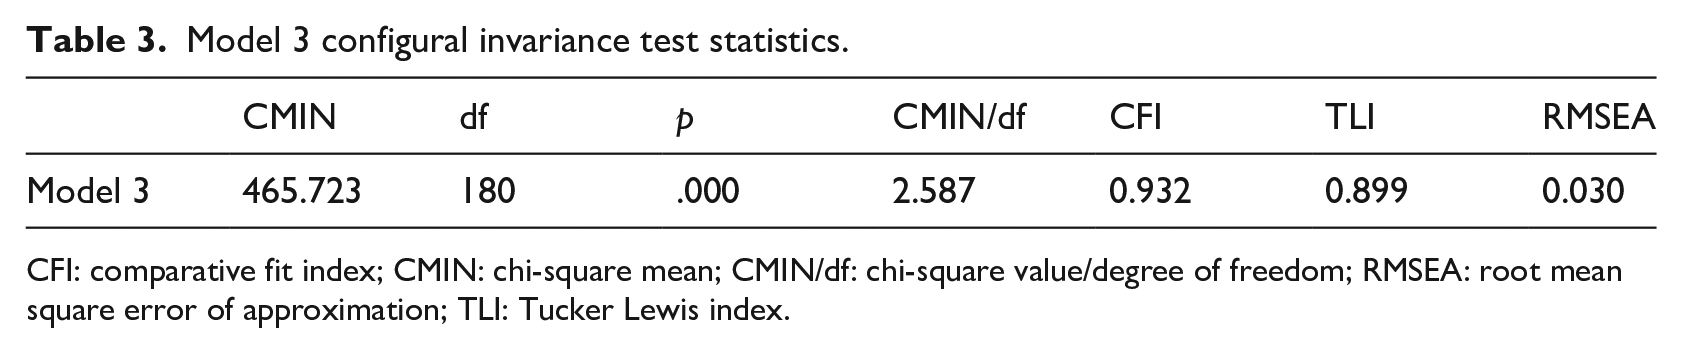
CFI: comparative fit index; CMIN: chi-square mean; CMIN/df: chi-square value/degree of freedom; RMSEA: root mean square error of approximation; TLI: Tucker Lewis index.
Test 2: measurement invariance of 10-item YMS
In order to determine if the measurement weights were invariant across the six countries, the change in chi-square statistic and the change in CFI statistics were considered as discussed earlier. The results are shown in Table 4. Here, we observed a X2 (df 45) = 165.306 (p < .001) and ΔCFI = 0.028 (> 0.01). Both tests suggested the measurement weights are not invariant across countries.
Model 3 measurement invariance test statistics.
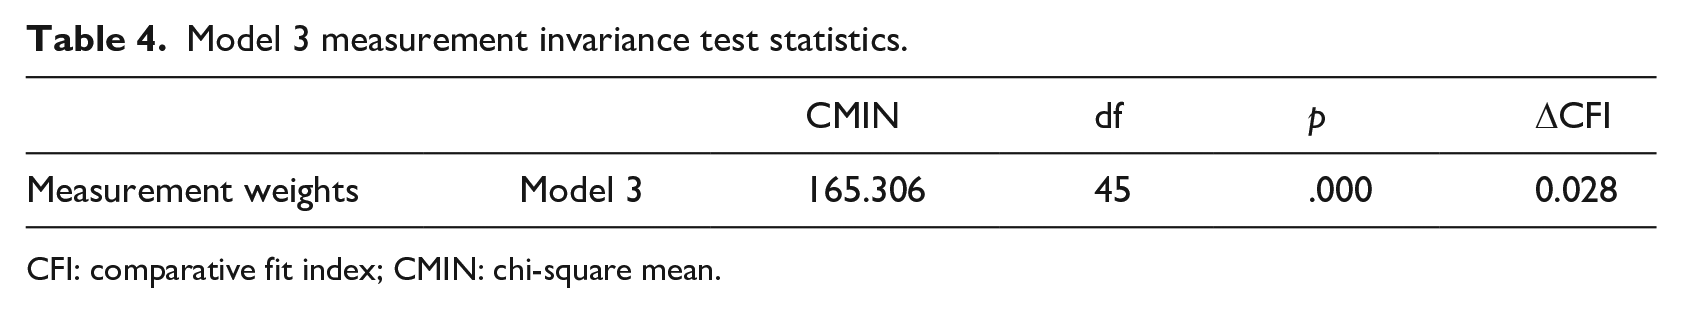
CFI: comparative fit index; CMIN: chi-square mean.
As Test 2 is not satisfied, we concluded that young people in each country did not respond to the 10-item YMS CFA model in the same way and therefore that it was not an appropriate representation statistically across the six countries. The analysis thus turned to explore whether a subset of YMS statements might offer a better representation.
Consideration of subset of YMS statements
It is worth reflecting on the requirements of these invariance tests. For the measurement weights to be invariant, this would mean that each and every one of the 10 statements would need to be statistically equivalent across all six countries, which is a high bar to meet. Consider the study by Bottomley et al. (2010) whereby the authors used the YMS to verify the construct validity of their Consumer Involvement Scale. They found that the inclusion of just five of the items of the YMS scale proved sufficient to successfully represent youth materialism. The items retained by Bottomley et al. (2010) were “I would be happier if I had more money to buy more things for myself,” “When you grow up, the more money you have, the happier you are,” “I would love to be able to buy things that cost lots of money,” “I really like the kids that have very special games or clothes,” and “The only kind of job I want when I grow up is one that gets me a lot of money.”
Therefore, the next stage in our study was to explore whether the reduced 5-item YMS provided a suitable structure across the six countries. The CFA was reconstructed using these five statements. This is labeled as Model 4. We applied the same nested testing structure to the new CFA structure across the six countries.
Test 1: configural invariance of shortened five-statement YMS
The configural invariance test statistics are shown in Table 5. The fit statistics for the multigroup model were X2 (df 24) = 53.370, CFI = 0.986, TLI = 0.964, RMSEA = 0.027 CMIN/df = 2.224. Hence, the configural invariance is ascertained across the six countries and the second test can be considered.
Model 4 configural invariance test statistics.
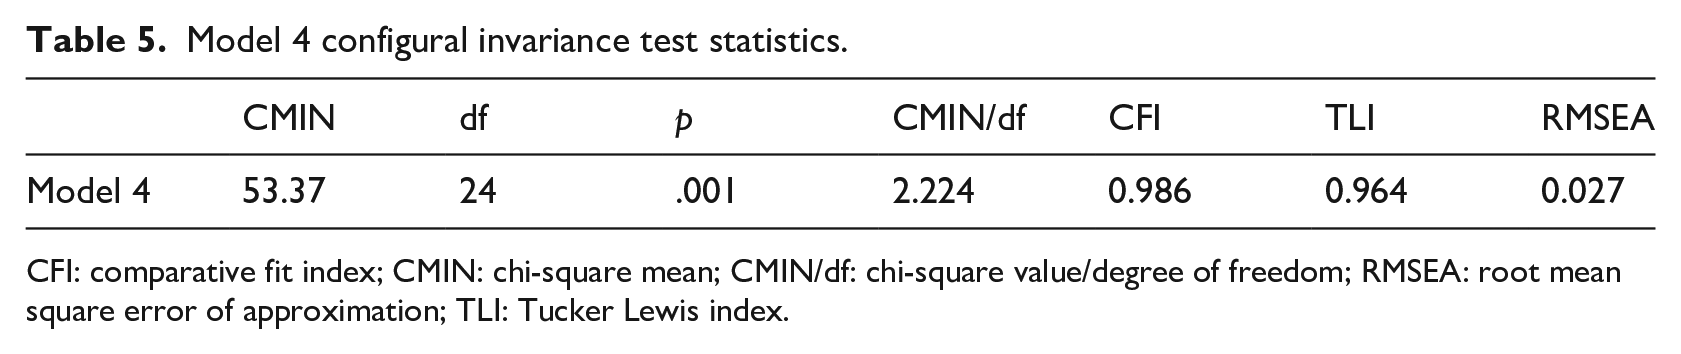
CFI: comparative fit index; CMIN: chi-square mean; CMIN/df: chi-square value/degree of freedom; RMSEA: root mean square error of approximation; TLI: Tucker Lewis index.
Test 2: measurement invariance of shortened YMS
The next stage was to test for measurement invariance and the results are shown in Table 6. However, the X2 (df 20) = 55.939 (p < .001) along with the ΔCFI of 0.018 again determined a lack of invariance for the 5-item scale across the six countries.
Model 4 measurement invariance test statistics.
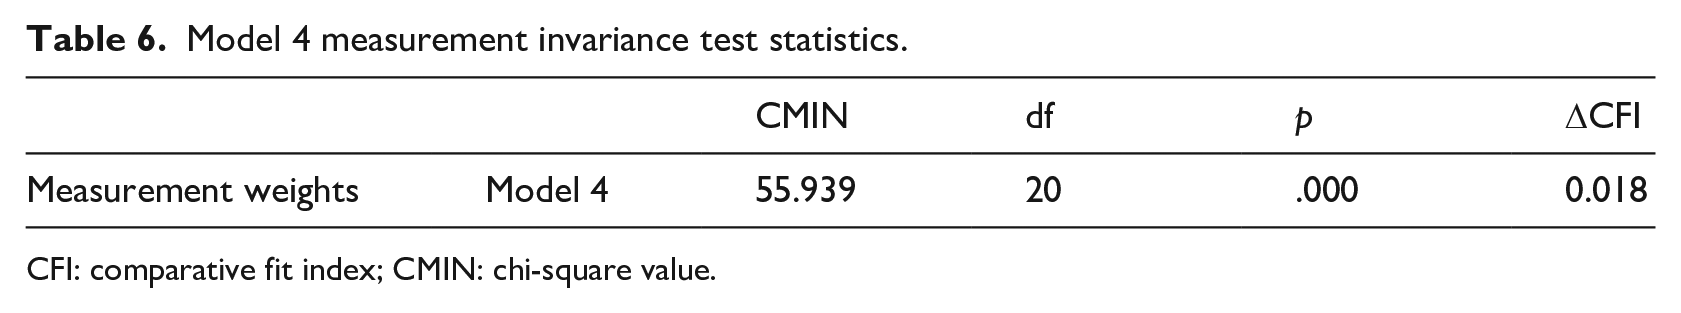
CFI: comparative fit index; CMIN: chi-square value.
We then considered one of the items included in the Bottomley et al. (2010) 5-item YMS, namely “I would love to be able to buy things that cost lots of money” and noted that there is another statement within the YMS which also refers to “buying,” namely “I’d rather spend time buying things than doing anything else.” Figure 3 shows the frequency of responses to the Likert-type scale across the six countries. It is apparent that the latter of these two statements shows more discrimination in levels of agreement, probably due to the more strongly worded statement, that is, “I’d rather spend time buying things than doing anything else.” It also shows a more consistent pattern across the six countries indicating better suitability as a cross-country statement. This may make this variable more appropriate for use within the YMS 5-item structure, although maintaining the “buying” nature of the statement used by Bottomley et al. (2010).
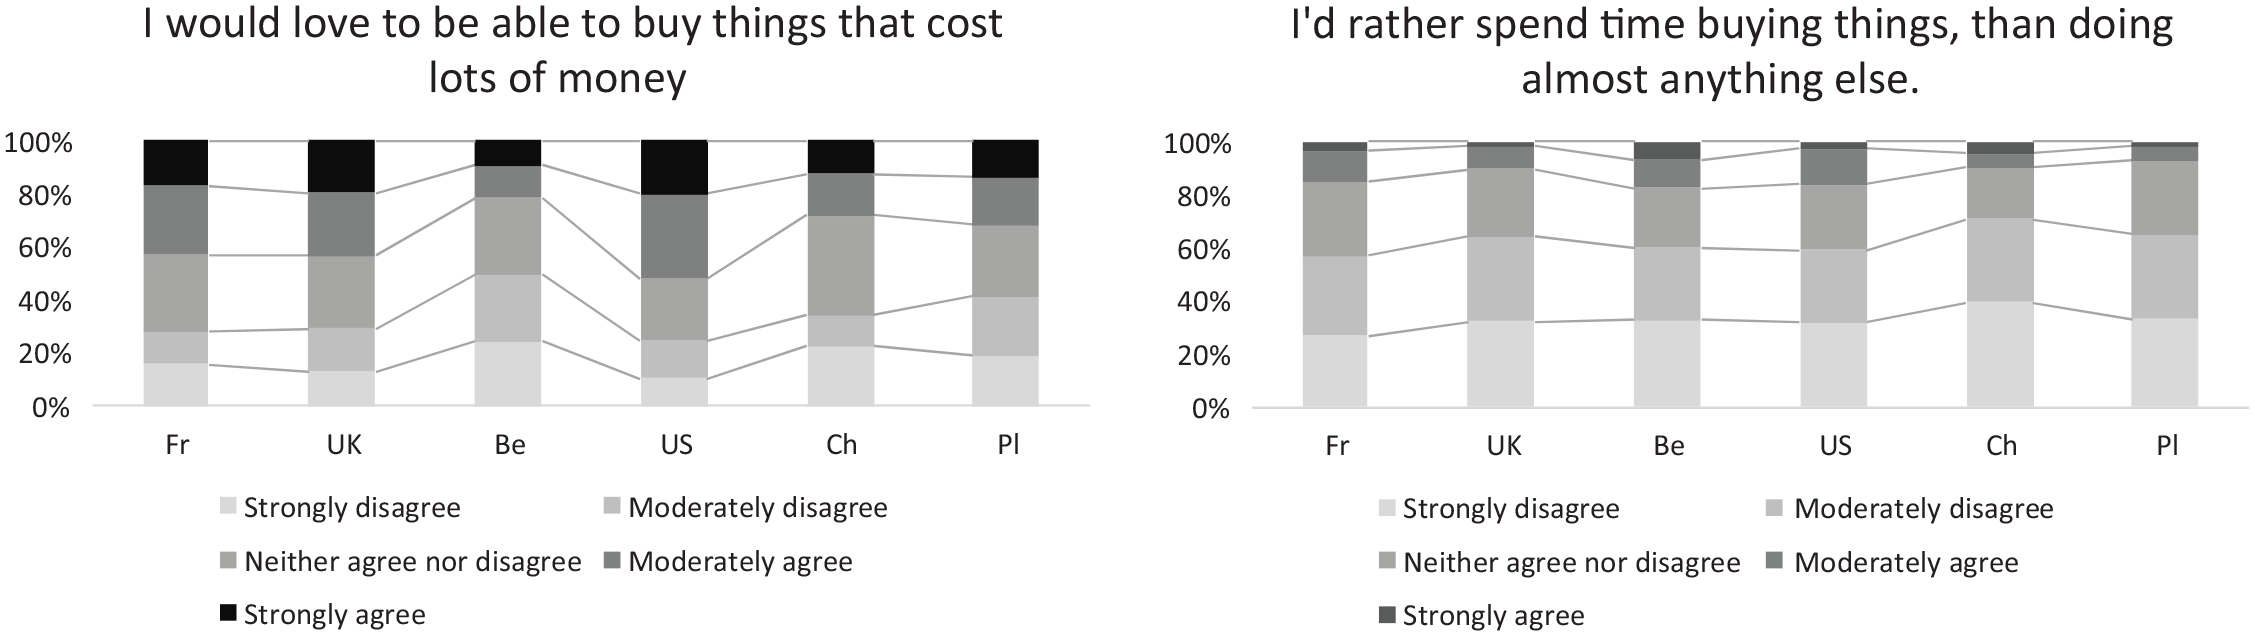
The YMS “buying” statements frequency distribution.
Hence, the next stage was to revisit the 5-item YMS, substituting the statement “I would love to be able to buy things that cost lots of money” with “I’d rather spend time buying things than doing anything else.” This is labeled as Model 5. We subjected this model to the same nested set of tests for invariance.
Test 1: configural invariance of second shortened version of YMS
The configural invariance test statistics for Model 5 are shown in Table 7. The fit statistics were X2 (df 24) = 76.768, CFI = 0.969, TLI = 0.923, RMSEA = 0.036, CMIN/df = 3.199. These statistics demonstrated that configural invariance is ascertained across the six countries.
Model 5 configural invariance test statistics.
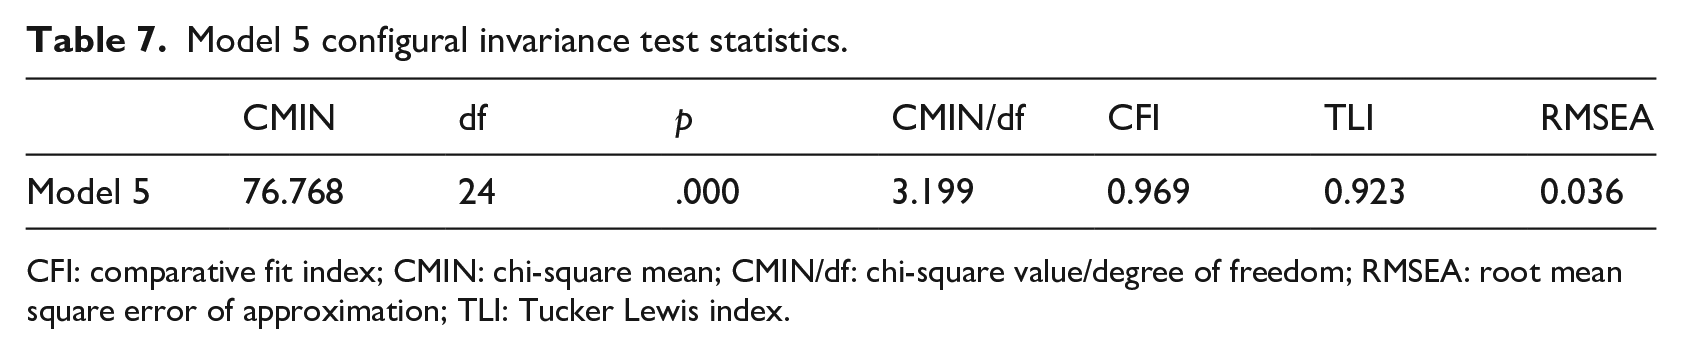
CFI: comparative fit index; CMIN: chi-square mean; CMIN/df: chi-square value/degree of freedom; RMSEA: root mean square error of approximation; TLI: Tucker Lewis index.
Test 2: measurement invariance of second shortened YMS
The next test was that of measurement invariance and the results are shown in Table 8. This time X2 (df 20) = 23.695 (p = .256) demonstrating that there is no evidence to reject H0 that the models were invariant, despite the stringent nature of this test (Byrne, 2010). Moreover, the ΔCFI of 0.002 gave additional evidence of measurement invariance across all six countries. Hence, young people in all six countries respond to this 5-item scale in the same way.
Model 5 measurement weights invariance test statistics.
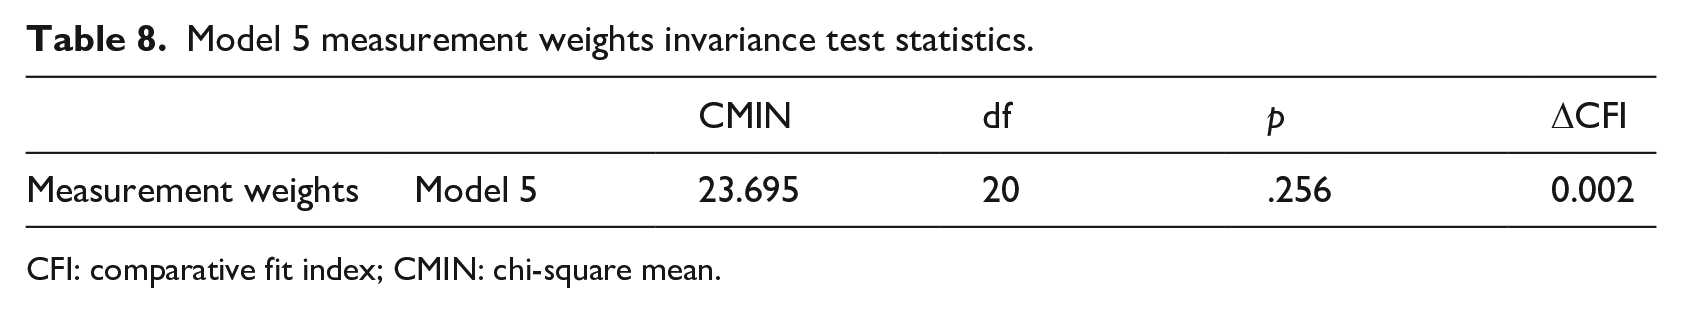
CFI: comparative fit index; CMIN: chi-square mean.
Test 3: structural covariance invariance of second shortened YMS
We were now confident to apply the third test, that of ascertaining the structural covariance invariance of the model which gives us additional assurance of the internal consistency of the model. The statistics relating to structural covariance are shown in Table 9 and reported as X2 (df 5) = 45.053.695 (p = .008) and ΔCFI = .010. These statistics determine borderline evidence to suggest structural covariance invariance for Model 5 which is reassuring.
Model 5 structural covariance invariance test statistics.
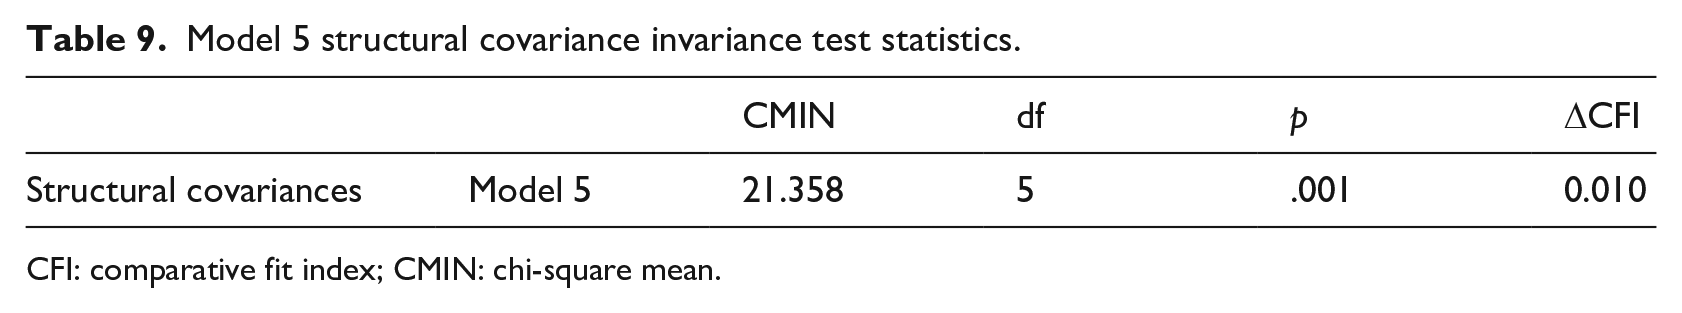
CFI: comparative fit index; CMIN: chi-square mean.
Thus, through iterative analysis of the YMS and drawing on past studies of Bottomley et al. (2010), we had established a 5-item YMS that, for the six countries in the study, demonstrated configural invariance, measurement invariance and borderline structural covariance invariance. In view of the fact that we have demonstrated measurement invariance, we could then proceed confidently to external validity tests.
External validation
Our study continued by exploring the six external construct validations. Latent variables were constructed for each country for the group of statements relating to Parental Support, Attitudes to Advertising, Self-Esteem, Life Satisfaction and TV and Internet Usage. In line with Bottomley et al. (2010) and Heikamp et al. (2014), these latent factors were then correlated with the 5-item YMS with the results shown in Table 10. The correlation analysis demonstrates that this version of YMS shows logical and sensible statistical relationships in line with previous literature. The correlations are statistically significant for virtually all the countries and for all YMS latent constructs. The few non-significant results (in gray) are directionally consistent with the other countries.
Correlating the YMS with latent constructs.
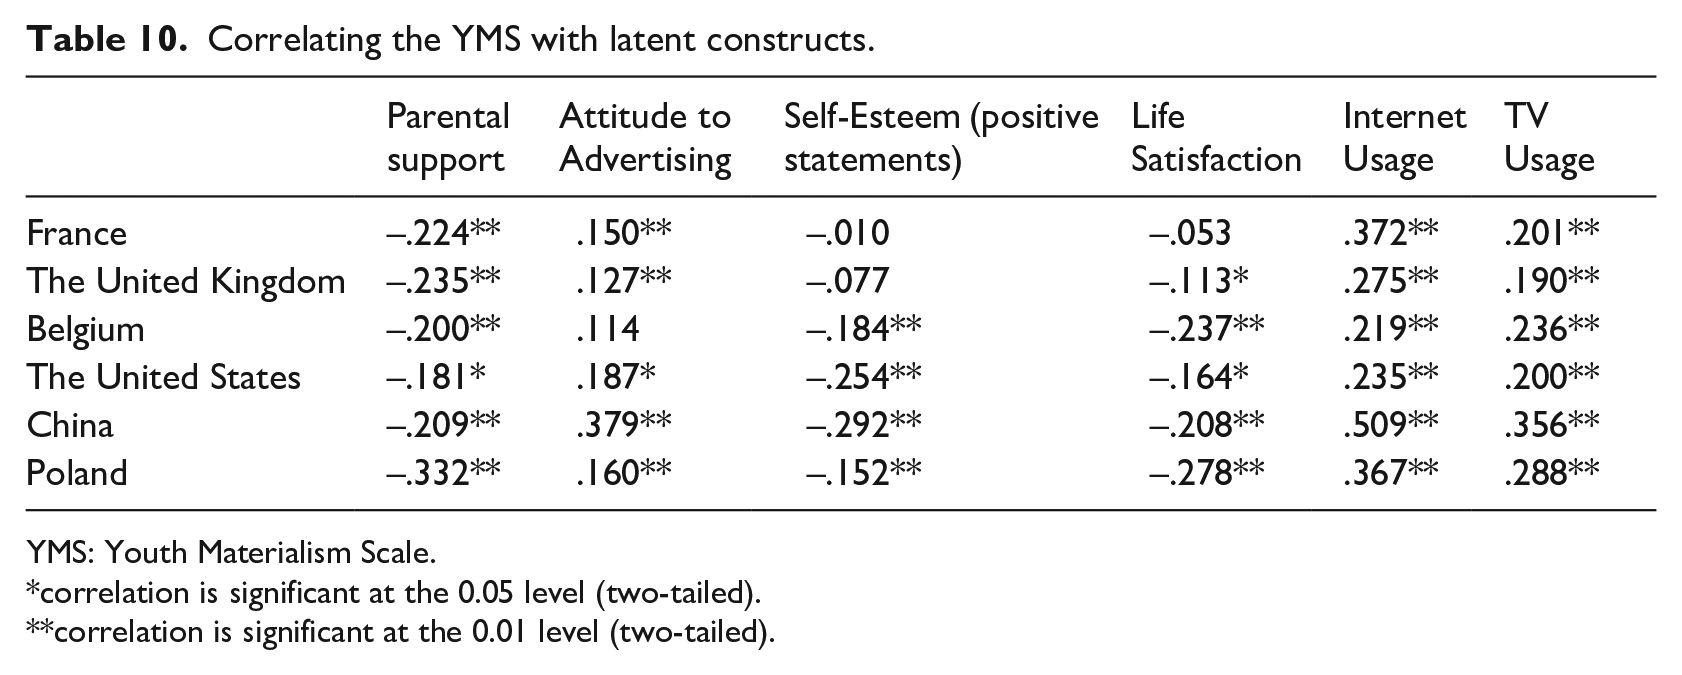
YMS: Youth Materialism Scale.
correlation is significant at the 0.05 level (two-tailed).
correlation is significant at the 0.01 level (two-tailed).
Conclusion and discussion
The negative connotation of youth materialism is a global issue for researchers and policy makers alike. However, no study has previously set out to measure whether a YMS has the same structure, meaning, and external validity across very different countries. We, therefore, tested the YMS across six countries that differed both in terms of material wealth and their position on Hofstede’s collectivist/individualist scale. Through our analysis, we have demonstrated a 5-item YMS that can be used across these countries. Beyond showing the internal reliability of the scale across countries, we have validated it in two ways. First, multigroup CFA tests have demonstrated that the YMS is invariant by the following three stringent nested tests: configural invariance demonstrating that the factors load onto one single factor in each country, measurement invariance demonstrating that teenagers in each country respond to the items in the same way and allowing future researchers to conduct correlation analysis across countries, and covariance invariance giving researchers added confidence that they are using a statistically relevant model internationally. Second, the YMS has been validated by correlation analysis with other external constructs in each country. The vast majority of these correlations are both statistically significant and concur with accepted theory in their directionality (positive or negative correlated). In the very few instances where the correlations are not statistically significant, the direction of the correlation is as expected: Self-Esteem, Life Satisfaction, and Parental Support are all negatively correlated, whereas TV and Internet usage and attitude to advertising are positively correlated. We, therefore, conclude that this 5-item YMS can be used confidently by future researchers in global research on youth materialism.
Nonetheless, the small aberrations in the external validity analysis do also throw up some interesting findings that merit further research. In particular, whereas the 5-item YMS does produce the expected negative correlations with Self-Esteem in all countries, it is not significant in either France or the United Kingdom. Moreover, the correlation between Life Satisfaction and YMS is not significant in France either. This could indicate that materialism is not (strongly) related to certain measures of well-being in France and future research should further explore what can drive these different effects in France compared to the other countries as this is out of keeping with previous theory.
Beyond this, the results of our correlation analysis shows a very strong relationship between materialism and TV and Internet Usage in every country, with teenagers who watch more TV and spend more time on the Internet being significantly more materialistic than those who spend less time. Given that this television use is often used as predictor for advertising exposure (cf. Opree et al., 2011), our study gives further evidence of a positive relationship between advertising exposure and materialism and that this is significant across six very different countries.
Limitations and directions for future research
Our study has a few limitations and, therefore, presents a range of opportunities for future research. First of all, we only included teenagers from more affluent families. Thus, it would be interesting to test the applicability of the 5-item YMS to research young people from less affluent families. Second, our sample only included teens aged from 13 to 17. It would, therefore, be interesting to examine whether the shortened YMS can be used among a younger child sample across countries. Third, although we included a range of countries in terms of both wealth and individualism/collectivism, a wider range of countries could certainly be included in future studies. Fourth, our US sample size was below 200 which can have an effect on the chi-square statistic. Although this was successfully mitigated by using ΔCFI which is independent of model complexity and sample size and ΔCFI less than 0.01 indicates invariance (Cheung & Rensvold, 2002; Meade et al., 2008), future research could certainly ensure inclusion of sample sizes above 200. Fifth, although we correlated YMS and six constructs with which we expected it to be associated, we did not conduct a discriminant validity test where we also compared YMS with constructs with which we did not expect an association, for example, the relationship between materialism and a child’s height or eye color. Sixth and finally, this study is a snapshot in time and our correlations are just that—they do not show any causation. Given the very strong relationship, we found between TV/Internet Usage and materialism, future research using a longitudinal design, or an experiment could explore if putting restrictions on television or Internet use can lower materialism across all countries.
Footnotes
Funding
The author(s) disclosed receipt of the following financial support for the research, authorship, and/or publication of this article: The Polish part of this research project was sponsored by National Science Centre (Narodowe Centrum Nauki NCN [PL]) with grant number 2015/17/B/HS6/04187.