
Abstract
This study uses a multimodal approach, combining visual content analysis and textual analysis of tweet content to explore the virality of climate imagery on Twitter. Employing a combination of methods, including content analysis, latent class analysis, and automated text and sentiment analysis, the research the visuals, user information and public engagement of climate change related tweets shared between 2019 and 2022. The findings reveal a diverse array of viral visual content characterized by various formats, subjects and settings, identifying five frames related to celebrities, protests, politics and the visualizations and effects of climate change. These frames differ in terms of public engagement and sentiment expressed in user comments. Despite the democratic potential of online discourses, the study finds parallels with traditional media, including the underrepresentation of marginalized groups and themes such as adaptation and mitigation strategies. A lack of diversity is also evident in the users shaping viral visual climate change discourses on Twitter. Despite the platform’s potential for diverse contributions, accounts from the US dominate, along with accounts by media and political entities with above-average followers.
Introduction
Social media have become increasingly crucial in shaping public discourse on climate change as it supersedes traditional media in how people learn about the topic and in how they consume and produce climate images (Pearce et al., 2019; Wang et al., 2018). The shift to social media is thought to democratize public discourse by providing a platform for a wider range of voices and perspectives, thus promoting more inclusive dialogue and diverse representations of climate change (Boulianne et al., 2020; Hopke and Paris, 2021). While there is a growing body of research on climate change visual communication, including studies on social media platforms, systematic large-sample analyses of visual representations of climate change remain relatively limited (O’Neill and Smith, 2014; Schäfer, 2020; Schäfer and Yan, 2023). To date, comprehensive studies that systematically engage with this topic are still scarce (DiFrancesco and Young, 2011; O’Neill, 2013; Smith and Joffe, 2009). Notably, most of these studies were conducted more than a decade ago, examining traditional news media outlets, with only a few recent examples exploring climate change images on social media (e.g. León et al., 2022; Mooseder et al., 2023).
This study examines the online visual representations of climate change through the lens of ‘virality’, a critical concept in social media logics that describes the rapid and widespread diffusion of content (Nahon and Hemsley, 2013). We analysed the 10 most viral climate change-related tweets with visual content of each month from 2019 to 2022 (N = 662). While centred on visual elements, our approach acknowledges the multimodal nature of social media communication by considering accompanying text and replies to tweets, providing context and enriching our understanding of the visual content.
By employing a variety of methods, we delineate the diverse attributes of viral climate change visuals on Twitter. Our findings reveal significant diversity in visual climate content on Twitter, characterized by a wide range of formats and content. However, we also uncover persistent continuities with traditional media, notably the overrepresentation of certain groups and themes (e.g. politicians, celebrities, consequences of climate change) and underrepresentation of others (e.g. Global South, farmers, adaptation and mitigation strategies). These results underscore that, while social media offer new avenues for representation, traditional media’s dominant visual discourses continue to prevail, indicating that the potential for social media to democratize visual climate communication has yet to be fully realized.
Climate Change Visuals and the Role of Social Media
Studies on climate change visuals have traditionally focused on recurrent images published in traditional news media outlets (DiFrancesco and Young, 2011; O’Neill, 2013; Smith and Joffe, 2009) and highlighted the prominence of politicians, celebrities, activists and protesters (Metag et al., 2016; O’Neill, 2013; Smith and Joffe, 2009). Common visual themes also include the causes and consequences of climate change, depicted through images of natural disasters and data visualizations like the ‘hockey stick’ graphs, and representations of solutions such as renewable energy technologies (DiFrancesco and Young, 2011; Hayes and O’Neill, 2021; Schäfer, 2020). These recurrent visual themes form what can be described as climate change’s visual discourses, an everyday visual lexicon that recurrently conveys dominant cultural narratives around the issue (O’Neill and Smith, 2014).
In contrast, climate change images on social media have been relatively unexplored (for exceptions, see León et al., 2022; Mooseder et al., 2023) despite the substantial impact of social media on shaping the climate change debate in recent years (Pearce et al., 2019; Wang et al., 2018). Social media disrupt traditional gatekeeping models employed by newspapers and television, introducing a diverse array of new actors into the creation, dissemination and framing of climate change narratives (Chen et al., 2022; Weitkamp et al., 2021). This has empowered new and diverse actors, exemplified by the rise of youth initiatives such as School Strike 4 Climate, which have gained prominence and shaped public opinion (Boulianne et al., 2020).
Social media platforms’ interactive nature democratizes access to climate-related information, sparking instant engagement and discussion, especially during significant events like climate summits or severe weather occurrences (Hopke and Hestres, 2018; Mooseder et al., 2023). However, the algorithmic curation and network structures on these platforms can also fragment dialogue, creating subcultures or echo chambers that may circulate disinformation (Brossard and Scheufele, 2022; Treen et al., 2020). Influencers play a crucial role in this ecosystem, leveraging their extensive reach and engaged audiences to significantly impact public opinion and discourse on climate change (Dekoninck and Schmuck, 2022). Moreover, social media’s affordances for engagement through mechanisms such as likes, shares and comments (Bucher and Helmond, 2018) have transformed how people interact with and disseminate climate-related content (León et al., 2022), potentially catalysing novel climate representations.
Consequently, the circulation of climate change images on social media is influenced not only by the content but also by the complex interplay of social actors and the unique characteristics of the platforms themselves. These dynamics are magnified by the digital environment’s speed in the creation, mutation and dissemination of images (Rose, 2016). Unlike traditional media, where distribution channels are more controlled, the vast majority of images on social media are transient, reaching only a limited audience. However, a few images will go ‘viral’, becoming touchstones in the online conversation on climate change (see Hawkins et al., 2019). The widespread visibility of these viral images grants them substantial influence over public perceptions of climate change, shaping the cultural landscape through which people interpret and experience the phenomenon (Nicholson-Cole, 2009).
Understanding Viral Images
The concept of virality describes the accelerated spread and expansive reach of information or content within and across digital platforms, often driven by user engagement, specifically liking and sharing, and its consequential effects on societal perceptions and discourses (Alhabash and McCalister, 2015; Denisova, 2020). This phenomenon encapsulates the logics of social media, characterized by network connectivity and data-driven visibility (Nahon and Hemsley, 2013; Van Dijck and Poell, 2013).
Research on virality in social media has examined the many characteristics of a post’s content that explain their spread. Investigations have observed how denotative attributes of a post, such as the use of hashtags, hyperlinks and surface-level components of images, contribute to its virality (e.g. Nanath and Joy, 2023; Tellis et al., 2019). Additionally, connotative elements, such as emotional resonance and moral appeals, have been shown to significantly influence viral trends (e.g. Berger and Milkman, 2012). In the context of viral climate change imagery, we thus pose the question: What are the visual characteristics of viral climate change images on Twitter (RQ1)?
Furthermore, research has examined the influence of user attributes on engagement and virality, exploring explicit factors like occupation, age and geographic location, as well as implicit traits such as perceived trustworthiness and attractiveness (e.g. Han et al., 2020; Kamiński et al., 2021). The significant network effects generated by high-profile accounts and influencers, who possess large followings, can dramatically amplify the reach and impact of posts, typically outperforming content from lesser-known users (Goel et al., 2016). This leads us to the question: What are the characteristics of the users posting viral climate change images on Twitter (RQ2)?
Climate Visual Discourses
Climate visual discourses and their circulation are manifestations of particular cultural experiences (e.g. Born, 2019). Content creators, drawing upon their own cultural backgrounds, curate and share images in ways to evoke a preferred reading aligned with their worldview (see Hall, 1980). These visual discourses not only reflect creators’ intentions but are also interpreted through the cultural and social lenses of the viewers. Depending on their backgrounds, viewers may affirm, question or contradict the worldviews conveyed, which impacts how they perceive and engage with the content (O’Neill et al., 2023).
The design and affordances of digital platforms provide distinct possibilities for this response. Features of these platforms, such as sharing, liking and commenting, provide users with opportunities to express their interpretations and actively engage with the visual discourses in a distinct manner (Bucher and Helmond, 2018). Importantly, the popularity of a discourse is not static but evolves over time. This temporal dynamic is influenced by societal changes and global events (Roxburg et al., 2019). Such shifts in visual discourse popularity underscore the fluid nature of climate change narratives and their alignment with contemporary cultural and social contexts.
By identifying these visual discourses, their content, the people who post them and the ways in which they are engaged through the affordances of social media, we gain insights into the kaleidoscope of cultural experiences surrounding climate change visuals online. This analysis should not only capture static elements of these discourses but also acknowledge their dynamic nature, reflecting how societal changes and global events influence the popularity and prevalence of certain visual themes over time. This prompts us to address two more research questions: What visual discourses are prevalent in viral climate change imagery on social media (RQ3)? How do these visual discourses vary in terms of their content features, the profiles of the contributors, the temporal dynamics of their popularity and the interaction affordances utilized (RQ4)?
Methodology
Data and sample
Utilizing the ‘AcademicTwitteR’ package in R (Barrie and Ho, 2021), we gathered data via the Twitter Academic API v2. This collection occurred before new access restrictions were implemented following Elon Musk’s acquisition of the platform. Our dataset specifically included tweets 1 from the period between 2019 to 2022 that contained any of the terms ‘climate change’, ‘climatechange’, or ‘#climatechange’. Each tweet in our selection was required to include at least one image or GIF. 2 To operationalize virality, we identified tweets that garnered the most engagement, specifically we selected the top 10 tweets for each month ranked by the highest combined totals of likes and retweets, indicators recognized in the literature as measures of virality (see Muñoz et al., 2022). Our final dataset consisted of 480 tweets with 662 images, 3 shared by 351 unique users. We also collected the accompanying metadata from each tweet, including information about the users (e.g. followers), as well as engagement metrics (i.e. likes, replies, retweets). Additionally, we analysed 802,121 replies to these tweets to further understand the dynamics of public interaction with the viral content (see below for further details).
Standardized (image) content analysis
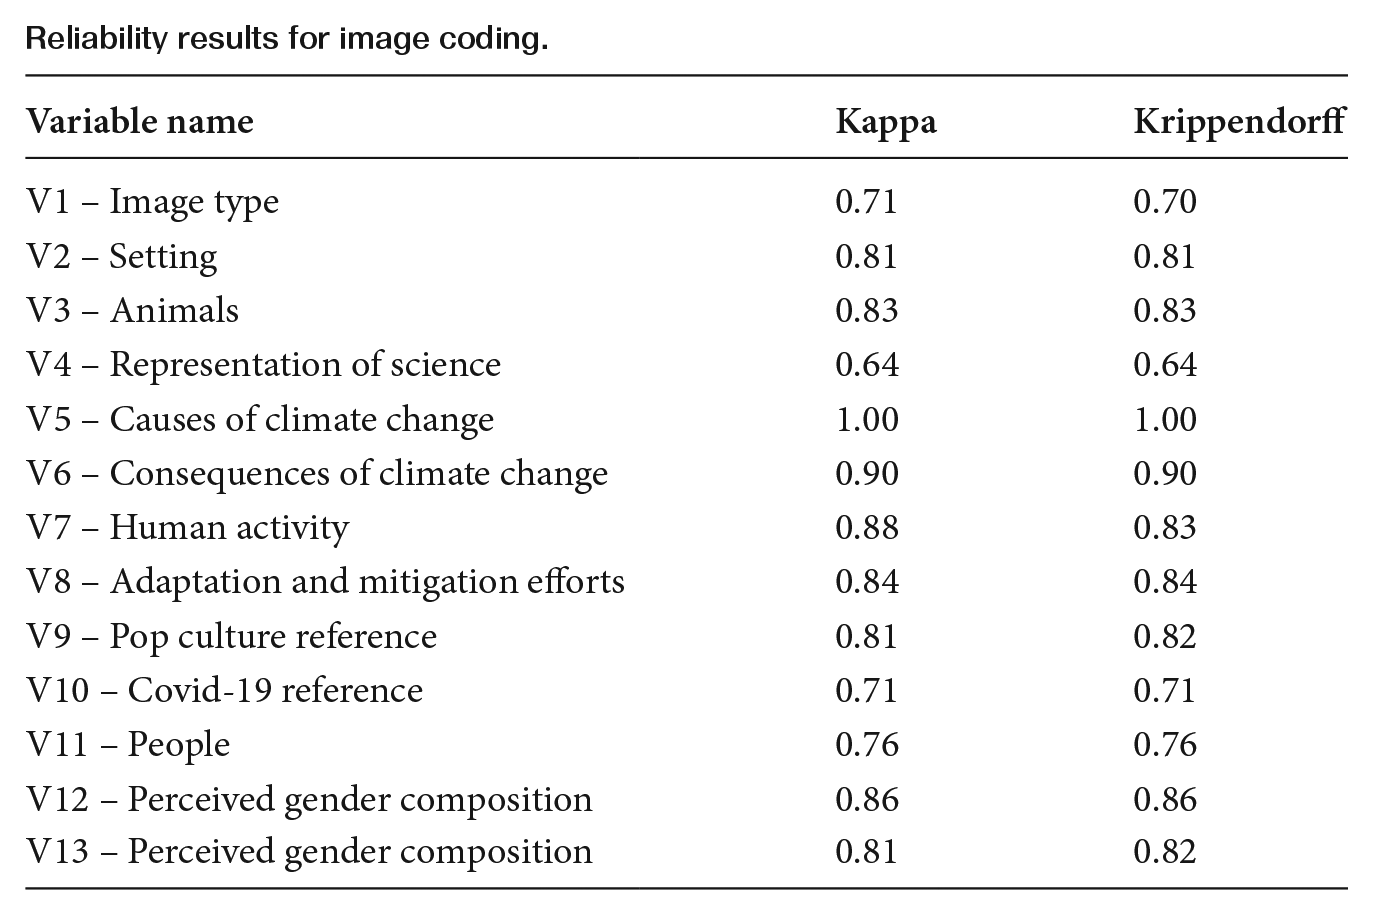
To systematically uncover the characteristics of viral climate images (RQ1), we first conducted a standardized content analysis. We developed a codebook based on established literature on climate imagery (e.g. DiFrancesco and Young, 2011, O’Neill, 2013; O’Neill et. al., 2023; Rebich-Hespanha et al., 2015), which included variables related to the image type, depictions of climate change causes and consequences, and the demographic representation (gender and ethnicity) of individuals depicted in the images. This codebook was refined through several pre-testing rounds, resulting in a finalized set of 13 variables. The images were coded using the open-access web application QCAmap (Fenzl and Mayring, 2017). The unit of analysis was the image; however, in a few cases where the image content was ambiguous the coders were able to draw on the tweet text to accurately classify the images. 4 The coding team consisted of three coders who initially tested the reliability on a subset of the images (n = 50). The reliability scores for Krippendorff’s Alpha ranged between 0.64 and 1.0, demonstrating a moderate to high level of agreement (Krippendorff, 2004) (see Appendix 1 for further details).
We further performed a content analysis of the profiles of users posting the images in order to understand the diversity of actors involved in spreading viral climate change visuals (RQ2). Two coders systematically categorized these profiles into seven actor types that have been identified by previous work on climate change networks on Twitter (Walter et al., 2019): Politics, Media, Celebrity, Science, Civil Society, Ordinary Citizen and Economy. Additionally, coders assessed the geographical location of each user, utilizing metadata for initial classification and conducting online searches for ambiguous cases. Discrepancies in coding were resolved through discussion. The reliability of this coding process was also assessed on a subset of the profiles (n = 40), with Krippendorff’s Alpha scores of 0.91 for actor type and 0.92 for country of origin, both indicating high reliability (Krippendorff, 2004) (see Appendix 1 for further details).
Latent Class Analysis
We employed Latent Class Analysis (LCA) to identify prevalent visual discourses among the climate change images (RQ3), using the results from the standardized content analysis as input data. LCA is a statistical method suited for uncovering hidden groups or clusters in categorical data which, in our case, helps to reveal recurrent themes in the image dataset (Nylund-Gibson and Choi, 2018). For the LCA, certain variables from the content analysis were re-coded to streamline the process (detailed re-coding procedures are provided in Appendix 2). We used the PoLCA package in R (Linzer and Lewis, 2011) to run the LCA model.
Analysis of cluster characteristics
Upon identifying distinct clusters through LCA, we conducted a multi-faceted evaluation to uncover the nuances of each cluster (RQ4). This analysis utilized data from the initial content analysis and incorporated additional evaluative methods to assess content features, contributor profiles, temporal dynamics and interaction affordances. While our primary focus remained on visual content, we also analysed accompanying tweet text and replies to provide a more comprehensive context for the themes represented in each cluster. This holistic approach allowed us to capture the full complexity of climate change communication on Twitter.
(a) Text analysis:
5
To analyse the textual content accompanying the images in each cluster, we conducted an exploratory thematic analysis on the 5 percent most frequently occurring words in the tweets. Following Braun and Clarke’s (2007) framework, we familiarized ourselves with the data, generated themes, reviewed and refined these collaboratively. The resulting themes, which highlighted the dominant narratives within each cluster, were visually represented through word clouds generated with the ‘wordcloud’ package in R (Fellows, 2018). (b) Sentiment analysis: We also analysed the affective tones expressed in the replies to the tweets for each cluster. Following pre-processing,
6
that resulted in a final sample of 802,121 replies, we conducted the analysis using the Vader lexicon via the ‘vaderSentiment’ library in Python (Hutto and Gilbert, 2014). Vader has been previously validated on climate change Tweets (Effrosynidis et al., 2022) and has shown better performance than other dictionary approaches (Rosenberg et al., 2023). To ensure its effectiveness for our specific context, we manually coded a random sample of 480 replies and compared the results with VADER’s output, achieving an agreement rate of 85 percent. This analysis illuminated the predominant sentiments within the replies, providing insights into the affective undertones of the images in each cluster.
2.
3.
4.
Results
Our analysis of viral climate change images on Twitter from 2019 to 2022 (N images = 662; N tweets = 480; N users = 351) revealed that photographs, including individual images and collages, were the dominant image type (60.7%), followed by screenshots (18.4%), data visualizations (6.5%) and posters (5.1%). 7 Nearly half (49.2%) of the images portrayed human-made spaces (indoor spaces and urban areas), while natural settings were less common (19.2%). 8
People featured in most images (62.2%), with politicians (16.9%) and celebrities (14.2%) being the most prominent. Protesters were visible in 8.5 percent of the images, with youth protests like Fridays for Future comprising about half (4.4%). Activist Greta Thunberg was present in 2.4 percent of all images, while scientists, farmers and Indigenous people had minimal representation (⩽2.0%). Gender and ethnic disparities were observed, with images predominantly featuring individuals with characteristics typically associated with males (46.8%) 9 and white ethnicity (45.9%). 10
Climate change causes were represented in 10.4 percent of images, while consequences were more prominent (26.1%), with extreme weather events making up 13.4 percent. Complex issues like economic consequences (0.5%) and human rights issues (0.2%) were rarely depicted. Mitigation and adaptation efforts were present in 10.0 percent of images, with climate-friendly technologies (4.1%) and reforestation/afforestation initiatives (2.6%) being the most common. Other sustainable practices, including sustainable farming, weather preparedness, sustainable transport and the 3R (reduce, reuse, recycle) movement were almost absent (all ⩽ 1%). Animal representations were likewise scarce, with only 5.6 percent of the images featuring animals.
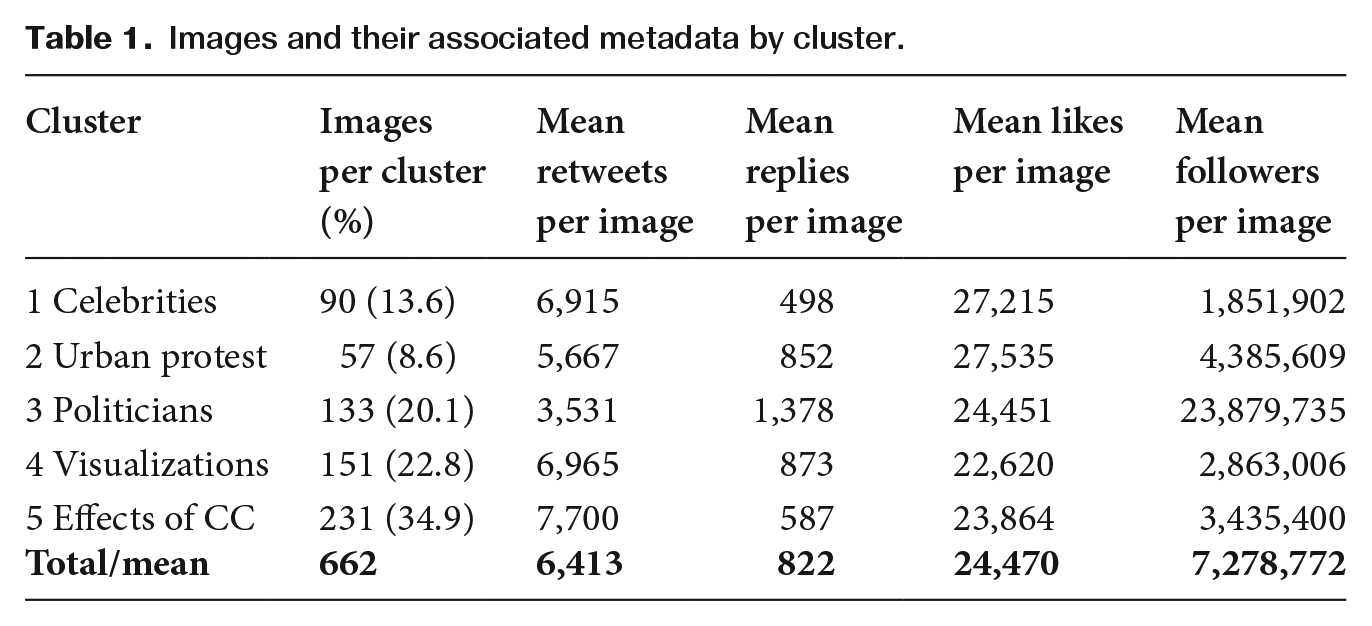
On average, the images received 6,413 retweets, 822 replies and 24,469 likes (Table 1). They were posted by 351 unique users with an average of 7,278,772 followers per image, suggesting a predominance of macro influencers (see Kay et al., 2020). About half of the images were shared by users from the US (49.3%), with the UK (10.4%) and India (8.0%) following far behind (Appendix 3). The images were mostly shared by politicians and political organizations (22.4%), ordinary citizens (18.3%), media-related accounts (15.0%) and celebrities (15.0%) (see Appendix 4).
Images and their associated metadata by cluster.
Visual climate change discourses
The Latent Class Analysis (LCA) grouped our images into five clusters, helping us to identify distinct visual discourses around climate change that align with themes identified in the literature (DiFrancesco and Young, 2011; León et al., 2022; O’Neill, 2013, O’Neill et. al., 2023; Rebisch-Hispanha et al., 2015). 11 These clusters vary considerably in size (Table 1, column 1). Figure 1 presents a heatmap illustrating the Z-scores for each cluster, delineating unique and common attributes across different levels of the variables. Below, we describe the features of each cluster, examine their salience over time (Figure 2), user engagement and follower counts (Table 1), users’ geographic locations (Figure 3), types of users contributing to each cluster (Figure 4), word clouds derived from tweet texts (Figure 5) and the emotional valence of user replies (Figure 6).
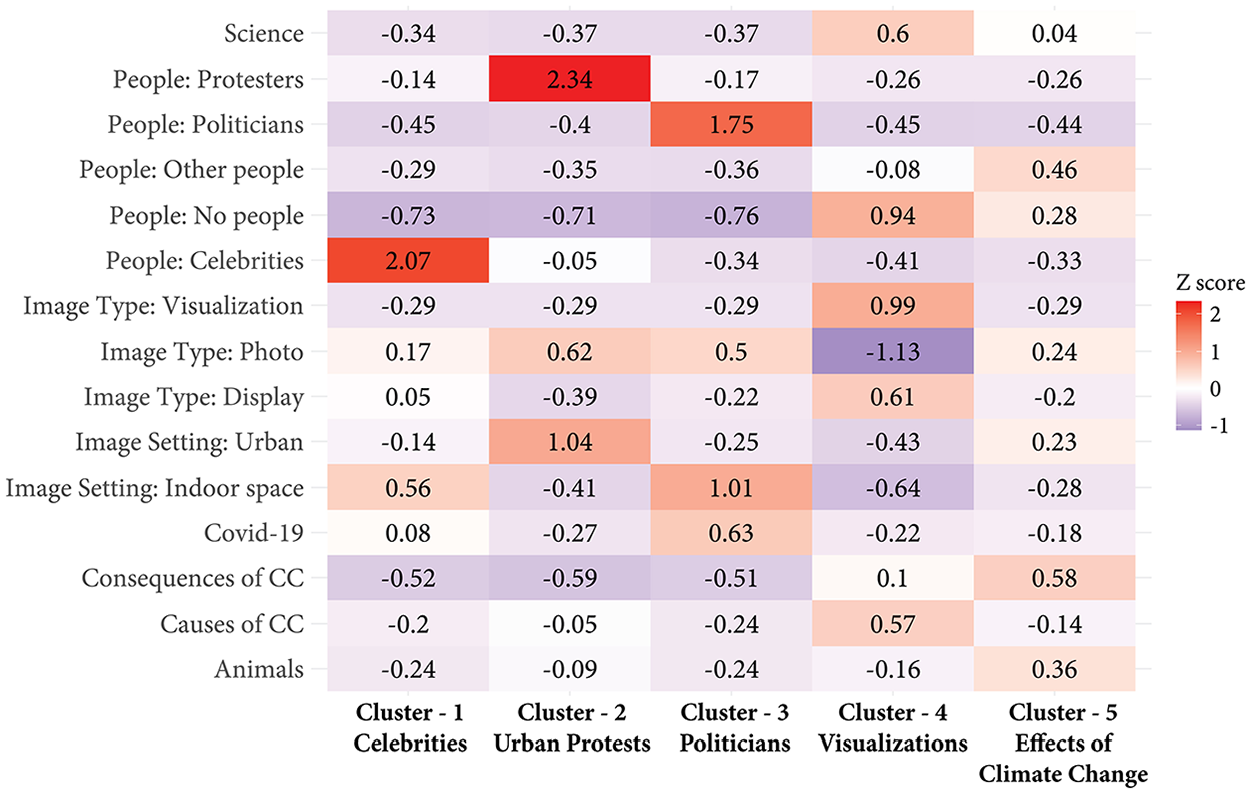
Heat map of Z scores of selected features per cluster.
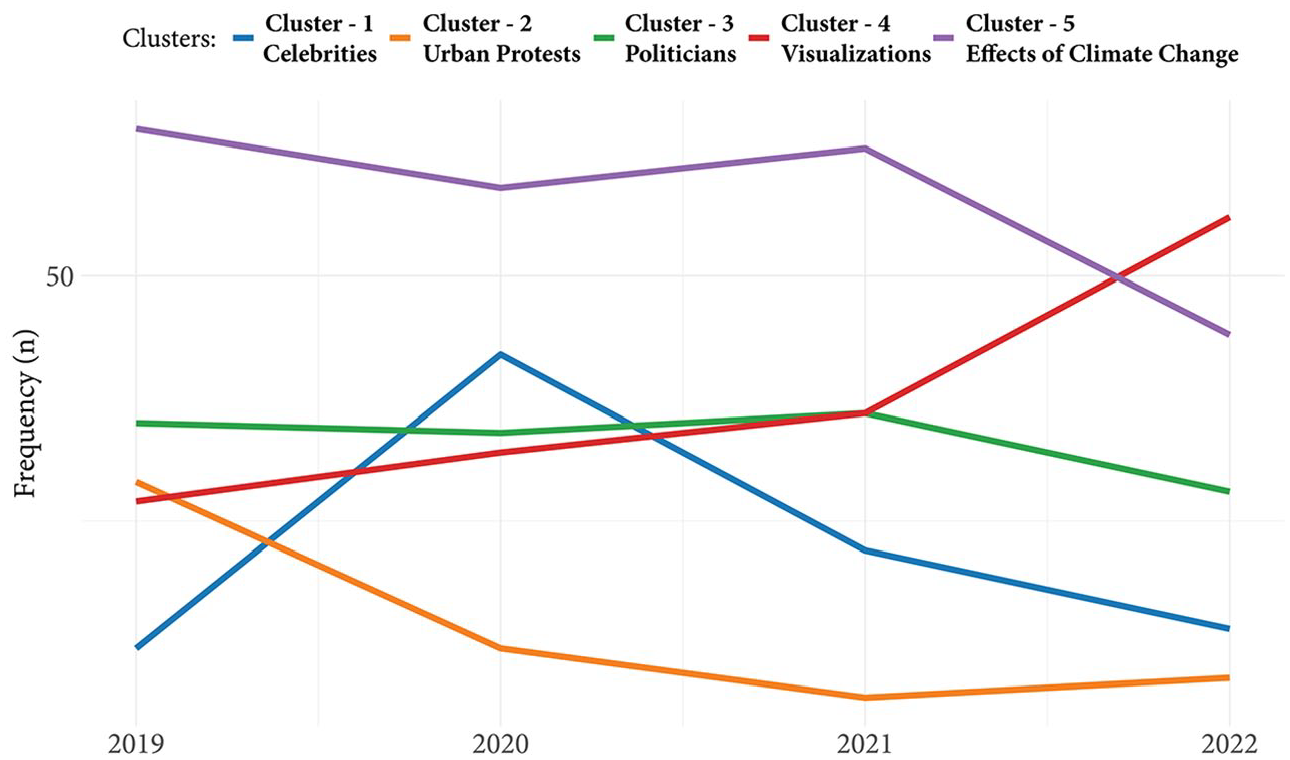
Prevalence of images by cluster across time (N = 662).
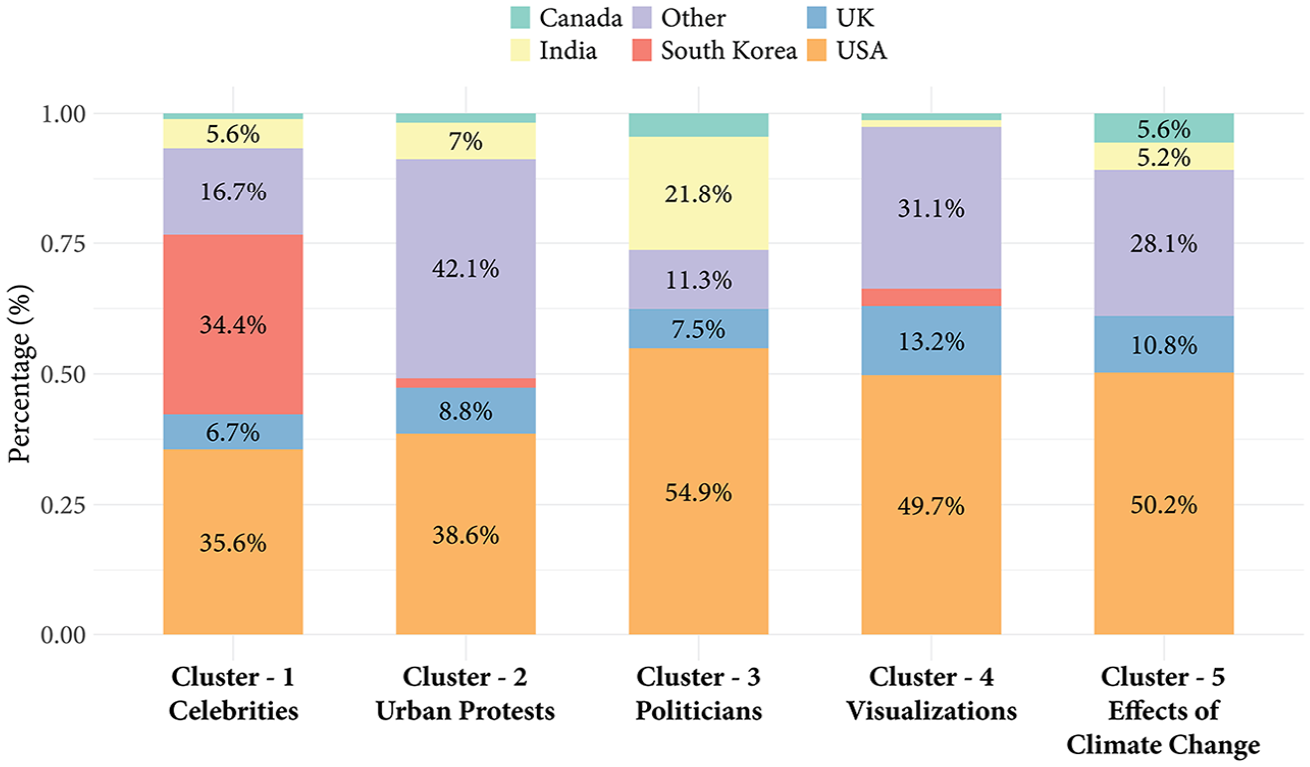
Proportion of images by geographic location of the users sending the tweet per cluster (N images = 662, N user = 351).
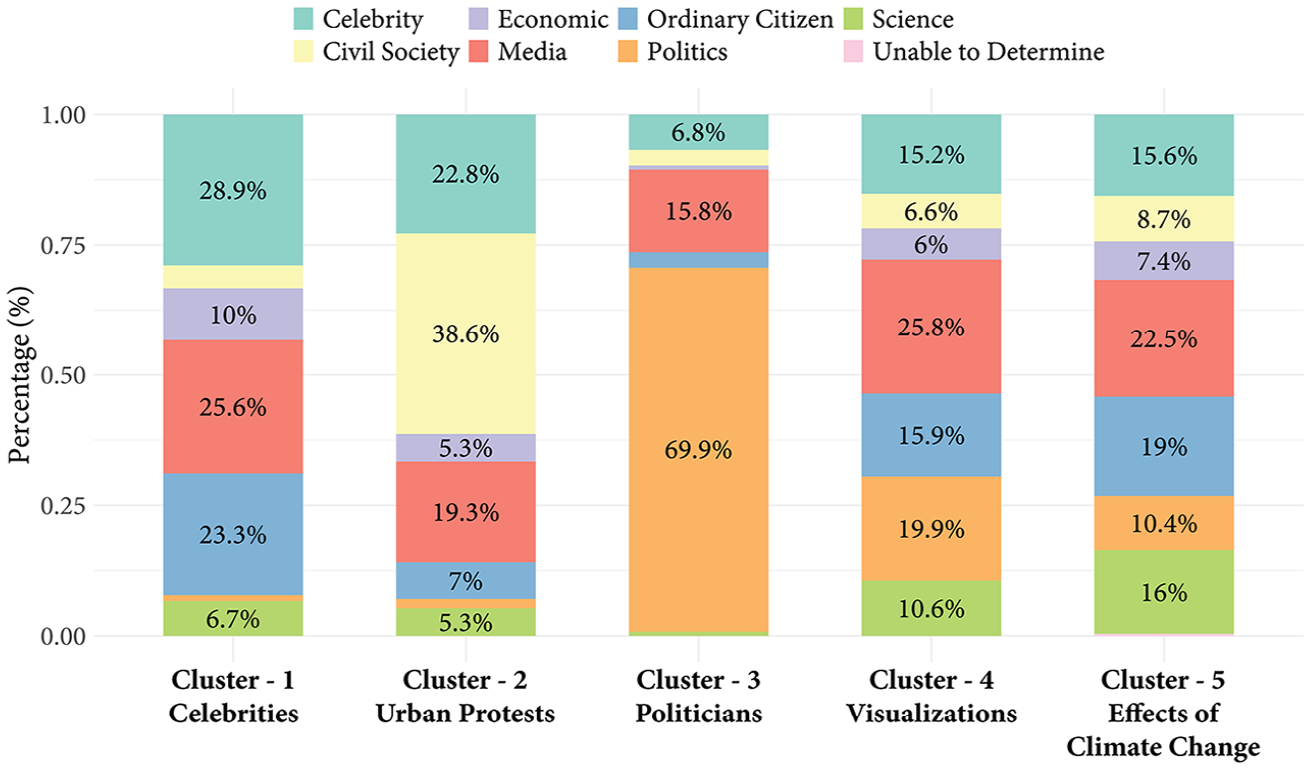
Proportion of images shared by actor type per cluster (N images = 662, N user = 351).
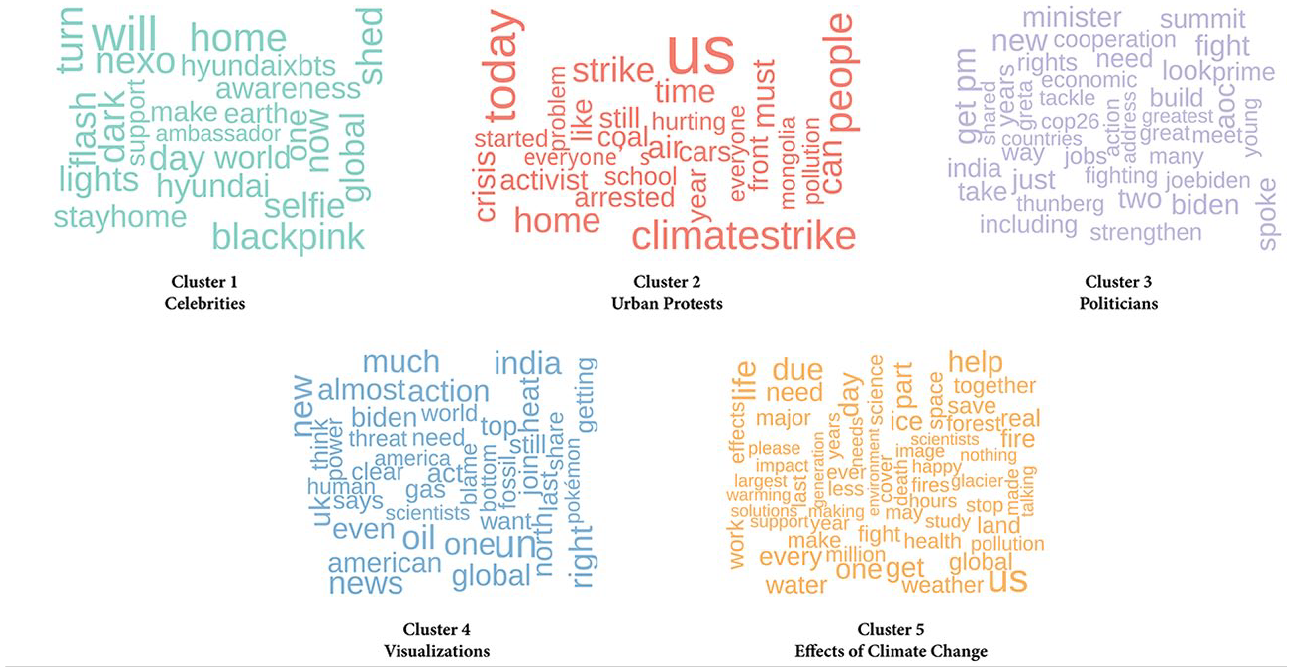
Word clouds of content of tweets for the five clusters (N tweets = 480).
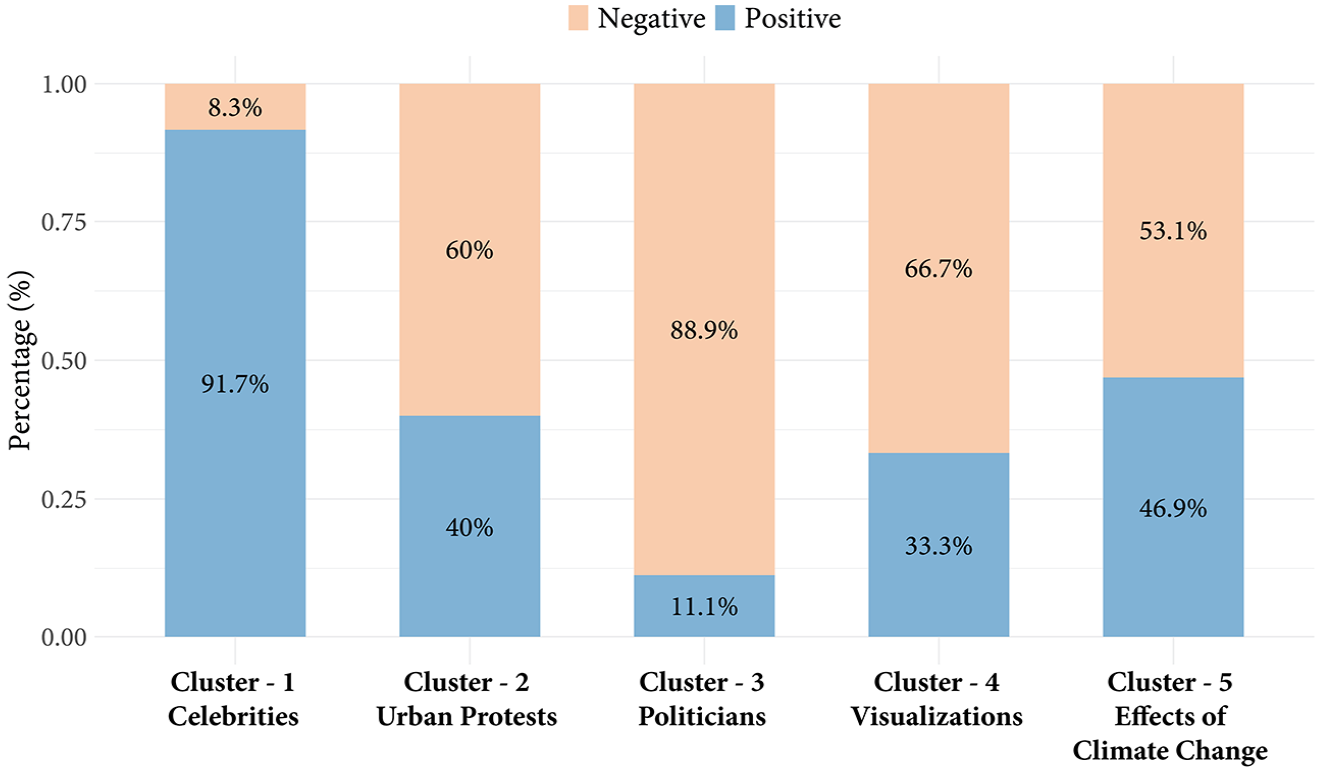
Distribution of sentiment in replies to images by cluster (N replies = 802,121, N images = 662).
Celebrities (cluster 1)
This cluster, encompassing 13.6 percent of the images (Table 1), predominantly features indoor photos of celebrities associated with pop culture, with a higher share of non-white individuals (55.5%) (Figure 1). A sharp rise in these images occurred in 2020 during the COVID-19 pandemic (Figure 2), likely due to celebrities engaging more with social media during lockdowns. This cluster has the lowest share of images from US accounts (35.6%) and a large portion linked to South Korean accounts (34.4%) (Figure 3), underscoring the global impact of the K-Pop phenomenon. Celebrities posted the majority of these images (25.6%), followed by ordinary citizens (23.3%) and media-related individuals and organizations (22.2%) (Figure 4). The word cloud reflects themes of celebrities’ and brands’ roles (‘bts_twt’, ‘blackpink’, ‘hyundai’), individual and collective participation (‘awareness’, ‘earthday’, ‘help’, ‘world’), self-promotion (‘selfie’) and pandemic-related discussions (‘home’, ‘stayhome’, ‘dark’, ‘darkselfiechallenge’) (Figure 5). While the posts received the lowest number of replies (498) (Table 1), 91.7 percent have a positive valence (Figure 6).
Urban protests (cluster 2)
This smallest cluster (8.6% of images, Table 1) features urban protests with a higher representation of women and white individuals (Figure 1), aligning with past research on the visual prominence of women in climate protests like Friday’s for Future and Extinction Rebellion (Hayes and O’Neill, 2021). Protest images peaked in 2019, sharply declined during the pandemic years and modestly resurged in 2022, remaining below pre-pandemic levels (Figure 2). A substantial portion of users sharing these images originated from smaller nations (Figure 3), including Sweden (15.8%) and countries from the Global South like Cuba and Mongolia (7.0% each). Unlike other clusters, a considerable share of images was posted by individuals and organizations from civil society (31.6%) (Figure 4). The word cloud (Figure 5) underscores the urgent, confrontational nature of activism and protest, suggesting calls for direct action (‘activist’, ‘arrested’, ‘strike’, ‘climatestrike’, ‘fridaysforfuture’), urgency (‘crisis’, ‘must’), and collective engagement (‘people’, ‘us’). These images received the highest average number of likes (27,535) (Table 1), suggesting widespread support, but sentiment analysis revealed more negative (60.0%) than positive (40.0%) emotions in the replies (Figure 6).
Politicians (cluster 3)
Comprising 20.1 percent of the images (Table 1), this cluster features predominantly photos of white male politicians engaged in indoor political activities (Figure 1). The consistent salience of these images throughout the study period indicates a sustained political discourse on climate change (Figure 2). Notably, it uniquely incorporates visual references to Covid-19, emphasizing the intersection of public health and climate change discourse. Most accounts posting these images are linked to the US (54.9%) and India (21.8%) (Figure 3). Primarily shared by political actors or organizations (69.9%) (Figure 4), these images exhibit top-down dissemination, with the highest number of followers per image (23,879,735) (Table 1). The word cloud (Figure 5) highlights political leadership (‘president’, ‘pm’, ‘potus’), international dialogue and cooperation (‘cooperation’, ‘strengthen’, ‘nations’, ‘summit’, ‘global’), proactive involvement (‘discussed’, ‘fight’, ‘forward’, ‘meeting’, ‘spoke’, ‘work’), and global challenges and future-oriented themes (‘challenges’, ‘covid’, ‘future’, ‘global’, ‘issues’). These images received the lowest average number of retweets (3,531) but the highest average replies (1,378) (Table 1), indicating that political content tends to generate discussion and debate. Moreover, sentiment analysis of the replies shows a predominantly negative response (88.9%) (Figure 6), reflecting emotionally charged discussions that potentially express users’ concerns and disagreement.
Visualizations (cluster 4)
The second largest cluster, encompassing 22.8 percent of the images (Table 1), features scientific graphs, charts, and other data visualizations linked to the scientific aspects and causes of climate change (Figure 1). Its prominence consistently increased over time (Figure 2), suggesting a growing interest in understanding climate change’s scientific underpinnings. Half of the users sharing this type of images are connected to the US (49.7%), with a greater diversity in remaining users compared to the previous three clusters (Figure 3). The types of accounts are mixed, with political and ordinary citizens having the highest share (19.9% each) (Figure 4). The thematic analysis based on the word cloud (Figure 5) highlights active engagement with climate science (‘emissions’, ‘science’, ‘heat’) and the causes of climate change (‘gas’, ‘fossil’, ‘oil’). Despite receiving the least likes (22,620), these images achieve virality through retweets (6,965) (Table 1), demonstrating users’ interest in sharing factual and scientific content and underscoring Twitter’s affordances as a tool for public science communication and environmental education. Two-thirds of the replies to tweets featuring these images tended to be negative (66.7%) (Figure 6).
Effects of climate change (cluster 5)
The largest cluster, containing 34.9 percent of the images (Table 1), predominantly showcases the tangible consequences of climate change, covering a wide array of affected subjects such as nature, animals and ordinary individuals (Figure 1). 12 It consistently held the largest share among viral climate change images between 2019 and 2021, with 2022 being the only exception (Figure 2). Similar to clusters 3 and 4, half of these images originated from the US (51.5%) (Figure 3). Nearly a quarter (23.8%) were posted by ordinary citizens, with scientists and science organizations playing an important role compared to other clusters (13.0%) (Figure 4). Frequent words in the Tweet texts highlight the consequences of climate change (‘effects’, ‘emergency’, ‘forest’, ‘fire’, ‘health’, ‘pollution’) and emphasize widespread impacts on both the natural world and human life (‘earth’, ‘life’, ‘land’, ‘trees’, ‘water’, ‘weather’) (Figure 5). The primary driver of virality seems to be retweets, exceeding the average of other clusters (7,700) (Table 1) and indicating the public willingness to share the real-world impacts of climate change. Replies to images in this cluster showed a nearly equal share of negative (53.1%) and positive (46.9%) sentiment (Figure 6).
Discussion
Our findings reveal a substantial diversity in viral climate visuals on Twitter, encompassing a wide range of formats and content. This diversity is exemplified by the three most retweeted climate images in our dataset, which feature strikingly different subjects and themes: a photo of a polar bear engaging in cannibalism in the wild, highlighting the ecological consequences of climate change (153,742 retweets, 2,239,746 likes); a visualization of extreme temperatures across the US during a polar vortex, emphasizing the scientific evidence and tangible impacts (95,873 retweets, 407,252 likes); and a photo of the K-pop sensation BTS in a hangar with a racing car (72,533 retweets, 142,314 likes), showcasing the intersection of celebrity culture and climate change awareness. This diversity is facilitated by social media’s inherent openness, which allows users from various backgrounds to share their perspectives; dynamic network structures that enable rapid and widespread dissemination of content; and interactive features that encourage user engagement and participation (Van Dijck and Poell, 2013). These characteristics of social media platforms contribute to a broader range of climate change representations compared to traditional media, which is often constrained by editorial gatekeeping, reflecting elite institutional norms and ideologies, resulting in more homogeneous climate change imagery (O’Neill, 2013).
However, this seemingly democratic landscape has notable gaps in representation. Firstly, the focus on anthropocentric imagery overlooks non-human elements and manifests an ecologically myopic conceptualization of climate change. It neglects the broader ecological ramifications, non-human suffering, and the interconnectedness of human and natural systems (Almiron and Tafalla, 2019). Secondly, despite apparent diversity, key actors such as farmers, indigenous communities and grassroots leaders remain underrepresented, reflecting biases towards urban- and Western-centric perspectives, excluding those most affected by climate change (Belfer et al., 2017). This lack of representation can lead to an incomplete understanding of the disproportionate impacts of climate change on vulnerable communities and the valuable insights and solutions they can offer. Thirdly, complex issues, including human rights, economic impacts and responses, particularly those beyond market-driven technoscientific fixes, are largely absent. This omission of the multifaceted challenges of climate change hinders the development of a nuanced understanding needed for effective climate action (Moser, 2010). Without a comprehensive portrayal of climate change, public engagement and support for transformative solutions may be limited.
Our analysis revealed limitations in the diversity of users shaping viral visual climate change discourses on Twitter. Accounts from the US dominate, along with accounts by media and political entities with above-average followers. While this partly reflects Twitter’s user demographics, with the US having the largest user base (Statista, 2024), the extent of this dominance in climate change discourse is disproportionate in our sample (49.3%). This US-centric focus not only underscores their substantial influence but also raises concerns about a potentially skewed representation of climate change, marginalizing critical perspectives from other regions. For example, India, the country with the second most English speakers in the world only represented 8 percent of our sample. Additionally, prominence of media and political figures as key disseminators of these images suggests the persistence of traditional gatekeeping actors, albeit within the digital landscape of social media (Pearce et al., 2019).
These representational imbalances question the equity and epistemic diversity of climate change depiction on Twitter, challenging the democratic potential that a platform like this promised (e.g. Kirilenko and Stepchenkova, 2014). The skewed representation, evident in both image content and the actors sharing them, not only marginalizes non-Western and local perspectives but also reinforces existing socioeconomic hierarchies. By privileging the voices and experiences of those in positions of power and influence, this imbalance perpetuates the deficit of democratic participation in the visual landscape of climate change (e.g. Ruppel and Houston, 2023). As a result, the purported democratization of climate change communication in social media – Twitter in this case – appears partial at best, potentially perpetuating incomplete or misleading views of the issue. This finding highlights the need for further efforts to promote and amplify marginalized voices and perspectives in order to foster a more genuinely democratic and representative climate change conversation on social media.
While our investigation highlighted a diversity, albeit limited, in the content of viral climate change images, a more profound analytical layer was unveiled through cluster analysis. This method identified five common visual discourses coalescing around stable tropes, framing the climate narrative in specific ways: celebrities, protests, politicians, visualizations and effects of climate change. These clusters align with existing studies on visual climate themes in both traditional and digital media (Mooseder et al., 2023; O’Neill and Smith, 2014), suggesting that specific image types symbolize broader worldviews and resonate with audiences across different platforms.
The prominence of dominant worldviews, such as celebrity culture (cluster 1), political authority (cluster 3) and scientific knowledge (cluster 4), in the visual representation of climate change has substantial implications. While these discourses play an important role in raising awareness and shaping public opinion, their dominance may skew public understanding and engagement with climate issues. By prioritizing certain perspectives and narratives, these dominant discourses can potentially limit the depth and breadth of public discourse and awareness (Boykoff and Goodman, 2009).
Furthermore, the prevalence of mainstream perspectives can constrict the visual discourse space, leaving little room for alternative or transformative narratives. While we identified some alternative discourses, such as protests and climate movements (cluster 2) and the portrayal of climate change effects (cluster 5), these face significant challenges in gaining traction and serving as a catalyst of change.
Protest and climate movement imagery, while offering a counterpoint to dominant perspectives, are often less visible and struggle to maintain a consistent presence (León et al., 2022; Mooseder et al., 2023). These alternative discourses are frequently small in scale and fluctuate significantly over time, being heavily dependent on current trends and events. As a result, their impact on the overall visual landscape of climate change communication can be limited.
Moreover, the portrayal of climate change effects, although prevalent, often manifests in passive forms of engagement. While these images raise awareness about the consequences of climate change, they lack the proactive commitment necessary for a more comprehensive and action-oriented narrative. To effectively address the climate crisis, visual communication must go beyond illustrating the problem through icons like polar bears, which often oversimplify the issue, and instead actively engage with systemic solutions and alternative futures that highlight the complex social and political dimensions of climate change (Born, 2019). This shift towards proactive and solutions-oriented visual communication is crucial for inspiring meaningful action and driving long-term change.
Our analysis calls for a critical reflection on the role of social media in shaping visual climate discourses. It encourages further research on how new communicative opportunities through social media can both strengthen dominant visual discourses and open up space for a truly diverse spectrum of voices and narratives in the climate discourse (see Carvalho, 2019). Future studies should explore the potential of social media in fostering inclusive and transformative climate communication and identify strategies for amplifying marginalized perspectives and counter-narratives. By understanding and harnessing the potential of social media, we can work towards creating a more equitable and impactful visual landscape for climate change communication.
As we emphasize the importance of cultivating diverse, participatory and expansive visual climate discourses in social media, it becomes crucial to understand how the process of virality, involving its complex interplay of bottom-up, user-driven engagement patterns and top-down, algorithmically mediated forces (Nahon and Hemsley, 2013), might be constraining the space available for alternative voices and narratives.
Among the various bottom-up factors driving content virality, emotional processes stand out. The prevalent content types found in our analysis support the emotionally charged nature of viral images. By ‘emotionally charged’, we refer to content that is likely to provoke intense arousal in viewers, regardless of whether these reactions are positive or negative (Berger and Milkman, 2012). Photographs depicting humans and their environments, the most common image type in our sample, often evoke strong emotional responses. These images enhance emotional engagement and shareability by being relatable and immediate, regardless of whether they elicit joy, anger or sadness (e.g. Bakhshi et al., 2014). Similarly, the prominence of influential figures like politicians and celebrities in viral images suggests the role of affective processes in people’s engagement. These figures act as emotional amplifiers, provoking intense reactions across the spectrum of positive and negative emotions, as evidenced by our sentiment analysis of replies (also see Chapman et al., 2016). Protests, extreme weather events and even climate graphs, as seen in our visualizations cluster, are also known to evoke strong emotional reactions (Lehman et al., 2019; Schneider, 2012; Stamps and Mastro, 2020). Whether these reactions are of concern, hope, or outrage, the intensity of the emotional response appears to be the critical factor. This suggests that the viral climate images we observe generally elicit high levels of emotional arousal, contributing to people’s engagement and behaviours that promote widespread diffusion, regardless of whether the overall sentiment is positive or negative.
However, the use of emotionally charged content to generate engagement and achieve virality may oversimplify complex issues like climate change (e.g. Ali et al., 2019; Brown et al., 2017). Sensationalizing content often involves exaggeration, hyping or selective presentation to maximize emotional impact, risking the simplification of narratives and, in the most extreme cases, trivializing the gravity of climate concerns. The incentive structure by social media algorithms, favouring emotionally loaded images, may skew discourses even more, side-lining nuanced or alternative viewpoints.
Moreover, social media platforms, governed by top-down, algorithmically mediated networks, inherently favour users with large followings (Goel et al., 2016), such as celebrities and politicians (Kamiński et al., 2021), along with media organizations and corporations. Our analysis underscores how top-down processes, exemplified by the dominance of politically affiliated, media and entertainment accounts with substantial followings in our sample, play a pivotal role in the virality of climate change images on social media. This algorithmic bias can result in a homogenized discourse where mainstream and popular opinions dominate, effectively side-lining alternative perspectives from individuals and entities with less social media influence (Nechushtai et al., 2023).
The predominance of accounts with large followings in shaping climate change visual narratives on social media places smaller entities, often representing alternative or less mainstream perspectives, in a challenging conundrum. While seeking to broaden the discourse with diverse and potentially crucial insights into the climate crisis, small accounts grapple with the daunting task of gaining visibility in a digital landscape skewed towards established influencers (Hindman, 2018). This may lead to a pressure to conform to prevailing narratives and styles popularized by influential accounts, potentially diluting unique or alternative perspectives. Such conformity can further diminish the impact of alternative, counter-mainstream narratives, reinforcing the dominance of mainstream discourses in climate change visual communication.
Rather than fostering a diverse and democratic space for climate discourse, the interplay of bottom-up user engagement processes and top-down algorithmic amplification in virality may be contributing to the predominance of homogeneous mainstream discourses on social media (Chayka, 2024). These dynamics limit the scope for truly democratic representation and critical engagement with climate change issues from a broad range of perspectives.
Other issues related to virality such as echo chambers, the transient nature of viral content leading up to our modern infodemic, or the viral spread of misinformation and disinformation, among other things (e.g. Törnberg, 2018) can be studied in the context of visual climate communication. These dynamics illustrate a critical paradox at the heart of social media’s role in climate change visual communication. While these platforms have the potential to diversify and democratize discourse (Helberger et al., 2018), the existing structures and patterns of engagement often reinforce existing power dynamics and narratives, potentially at the expense of more nuanced, diverse and representative perspectives.
Conclusion
This study set out to examine the content of viral climate change images, the characteristics of users who share those images, the dominant discourses that permeate the visual discourse of climate change on social media and the emotional reactions they elicit among social media users. Focusing on Twitter, we combined multiple data sources, including the most liked and retweeted tweets, their texts, images, metadata and user replies over a period of 4 years (2019–2022), using standardized (image) content analysis, text and sentiment analysis and Latent Class Analysis.
While our findings are specific to Twitter, which has undergone significant changes following its acquisition and rebranding as X, our study remains a valuable contribution to understanding the broader landscape of climate change visual communication on social media. The patterns and dynamics we observed, such as the prevalence of certain visual discourses, the influence of prominent actors and the emotional resonance of viral content are likely to be present, to varying degrees, across other social media platforms; by providing a detailed analysis of these dynamics on one of the most influential platforms during a critical period, our study offers valuable insights into the complex interplay of factors shaping the representation and discourse surrounding climate change in the digital sphere. Furthermore, our methodological approach combining multiple data sources and analytical techniques can serve as a model for future research examining the visual communication of climate change and other critical issues on social media platforms. Some of our findings may be influenced by the English-language keyword sampling, which is a limitation of this study. Another limitation is the reliance on user-provided information and meta-data for characterizing Twitter accounts. The geographical locations and user types may not always be accurately represented as this information cannot be independently verified. Moreover, focusing exclusively on viral climate change images may also overlook subtler and more nuanced discourses in lower-engagement content. It is also worth noting that, since Twitter’s rebranding to X, the platform’s API access for academic purposes has been paywalled, significantly limiting researchers’ ability to conduct large-scale social media analyses and raising concerns about the future accessibility of digital research data. Future studies on this platform may face challenges (Murtfeldt et al., 2024) and researchers may need to explore alternative methods or platforms for studying online visual climate change communication.
Despite these limitations, our analysis provides a foundation for future research. We encourage ongoing exploration of online visual representation of climate change across diverse media platforms, providing insights into evolving discourses and their impact on public views and behaviours.
Footnotes
Appendix 1. Intercoder reliability test results.
Reliability results for image coding.
| Variable name | Kappa | Krippendorff |
|---|---|---|
| V1 – Image type | 0.71 | 0.70 |
| V2 – Setting | 0.81 | 0.81 |
| V3 – Animals | 0.83 | 0.83 |
| V4 – Representation of science | 0.64 | 0.64 |
| V5 – Causes of climate change | 1.00 | 1.00 |
| V6 – Consequences of climate change | 0.90 | 0.90 |
| V7 – Human activity | 0.88 | 0.83 |
| V8 – Adaptation and mitigation efforts | 0.84 | 0.84 |
| V9 – Pop culture reference | 0.81 | 0.82 |
| V10 – Covid-19 reference | 0.71 | 0.71 |
| V11 – People | 0.76 | 0.76 |
| V12 – Perceived gender composition | 0.86 | 0.86 |
| V13 – Perceived gender composition | 0.81 | 0.82 |
Appendix 2. Content analysis variables and their re-coded versions for analysis.
To maintain consistency and accuracy in the process, coders were instructed to provide only one response per image, even in cases where an image could potentially be coded to multiple categories. In such instances, the coders were asked to focus on the dominant category. After multiple practice sessions, each coder received one-third of the codebook and coded independently. Throughout the coding process, we noted certain images that required further disambiguation due to their complex or ambiguous nature. These images were later discussed among the authors to reach a consensus on the most appropriate coding, a process that helped ensure the reliability of the results. During analysis and reporting we simplified some of the codes.
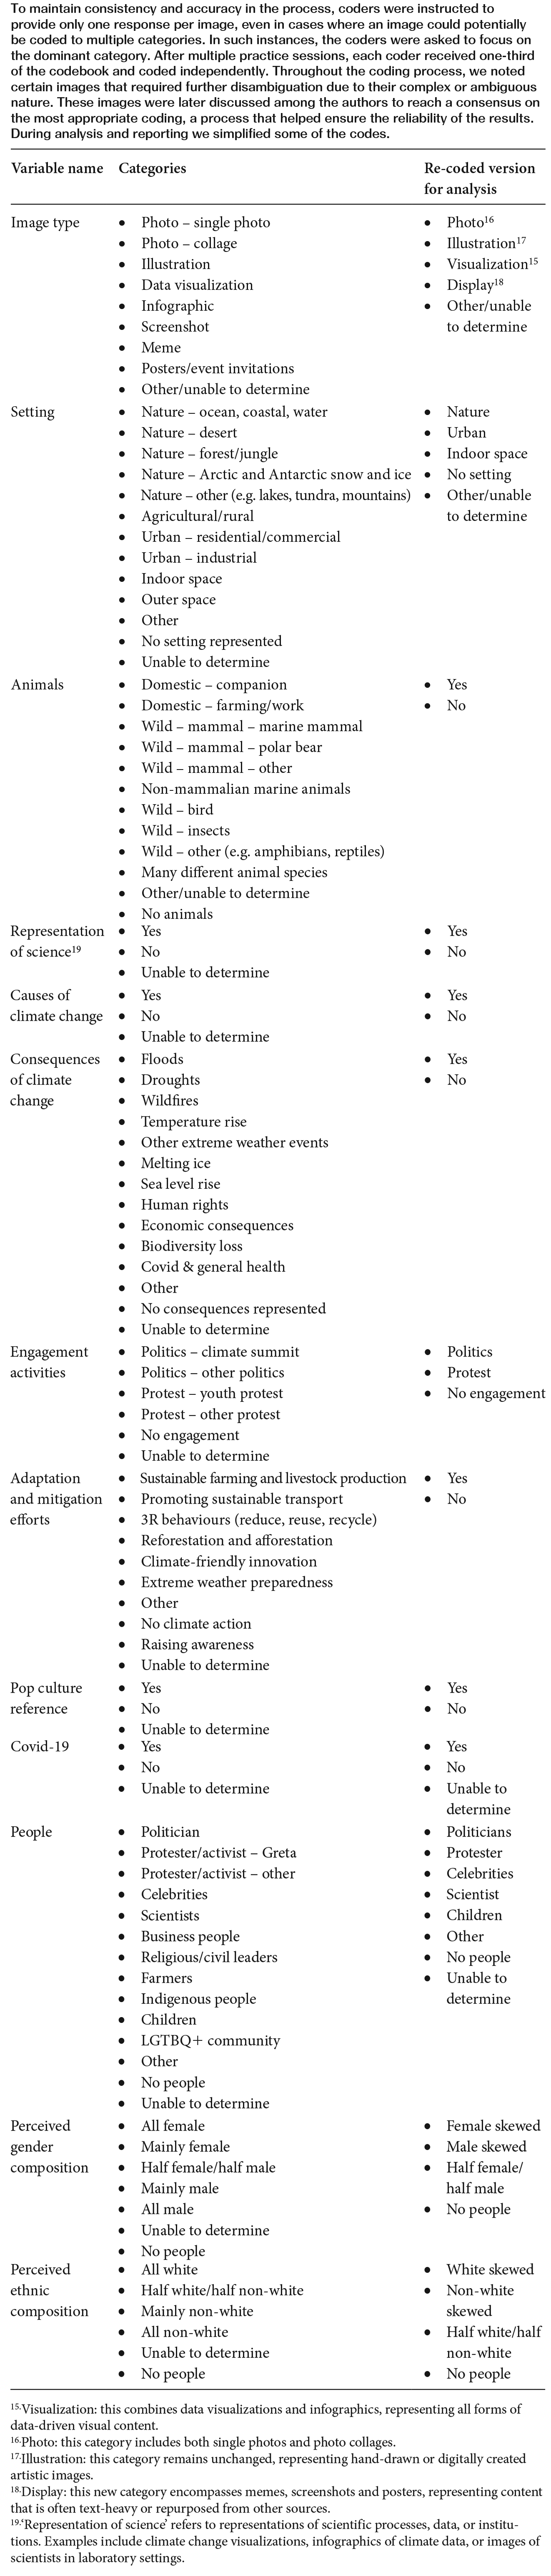
| Variable name | Categories | Re-coded version for analysis |
|---|---|---|
| Image type | • Photo – single photo • Photo – collage • Illustration • Data visualization • Infographic • Screenshot • Meme • Posters/event invitations • Other/unable to determine |
• Photo
16
• Illustration 17 • Visualization 15 • Display 18 • Other/unable to determine |
| Setting | • Nature – ocean, coastal, water • Nature – desert • Nature – forest/jungle • Nature – Arctic and Antarctic snow and ice • Nature – other (e.g. lakes, tundra, mountains) • Agricultural/rural • Urban – residential/commercial • Urban – industrial • Indoor space • Outer space • Other • No setting represented • Unable to determine |
• Nature • Urban • Indoor space • No setting • Other/unable to determine |
| Animals | • Domestic – companion • Domestic – farming/work • Wild – mammal – marine mammal • Wild – mammal – polar bear • Wild – mammal – other • Non-mammalian marine animals • Wild – bird • Wild – insects • Wild – other (e.g. amphibians, reptiles) • Many different animal species • Other/unable to determine • No animals |
• Yes • No |
| Representation of science 19 | • Yes • No • Unable to determine |
• Yes • No |
| Causes of climate change | • Yes • No • Unable to determine |
• Yes • No |
| Consequences of climate change | • Floods • Droughts • Wildfires • Temperature rise • Other extreme weather events • Melting ice • Sea level rise • Human rights • Economic consequences • Biodiversity loss • Covid & general health • Other • No consequences represented • Unable to determine |
• Yes • No |
| Engagement activities | • Politics – climate summit • Politics – other politics • Protest – youth protest • Protest – other protest • No engagement • Unable to determine |
• Politics • Protest • No engagement |
| Adaptation and mitigation efforts | • Sustainable farming and livestock production • Promoting sustainable transport • 3R behaviours (reduce, reuse, recycle) • Reforestation and afforestation • Climate-friendly innovation • Extreme weather preparedness • Other • No climate action • Raising awareness • Unable to determine |
• Yes • No |
| Pop culture reference | • Yes • No • Unable to determine |
• Yes • No |
| Covid-19 | • Yes • No • Unable to determine |
• Yes • No • Unable to determine |
| People | • Politician • Protester/activist – Greta • Protester/activist – other • Celebrities • Scientists • Business people • Religious/civil leaders • Farmers • Indigenous people • Children • LGTBQ+ community • Other • No people • Unable to determine |
• Politicians • Protester • Celebrities • Scientist • Children • Other • No people • Unable to determine |
| Perceived gender composition | • All female • Mainly female • Half female/half male • Mainly male • All male • Unable to determine • No people |
• Female skewed • Male skewed • Half female/half male • No people |
| Perceived ethnic composition | • All white • Half white/half non-white • Mainly non-white • All non-white • Unable to determine • No people |
• White skewed • Non-white skewed • Half white/half non-white • No people |
Visualization: this combines data visualizations and infographics, representing all forms of data-driven visual content.
Photo: this category includes both single photos and photo collages.
Illustration: this category remains unchanged, representing hand-drawn or digitally created artistic images.
Display: this new category encompasses memes, screenshots and posters, representing content that is often text-heavy or repurposed from other sources.
‘Representation of science’ refers to representations of scientific processes, data, or institutions. Examples include climate change visualizations, infographics of climate data, or images of scientists in laboratory settings.
Appendix 3. Overall distribution of users by geographic location ( N image = 662,N user = 351).
Appendix 4. Overall distribution of users by account type ( N image = 662,N user = 351).
Appendix 5. Latent class analysis model fit indices and detailed heatmap.
As evident in this table, the five-class solution presented the lowest BIC (8927.64) and cAIC (9056.64) values without a substantial decrease in the log-likelihood from the six-class solution. The five-class solution was chosen as it provides a parsimonious model that adequately represents the data while preventing overfitting. Moreover, it provided meaningful classes based on previous literature, so that each class represented a distinct and interpretable subgroup within our sample.
Notes
Biographical Notes
ISAAC BRAVO is a Doctoral Candidate and Research Associate with the ClimateVision project at the Technical University of Munich. His research interests are in climate change communication and computational social science, as well as text and visual analysis.
Address: Technical University of Munich, Richard-Wagner-Str. 1, Munich 80333, Germany. [email:
DANIEL SILVA LUNA holds a PhD in Science Communication from the University of Otago, Aotearoa/New Zealand. His current work as a postdoctoral researcher focuses on the representations of climate change in the media, the uses of artificial intelligence in science communication, and the role of emotions in shaping public engagement with science.
Address: University of Antwerp, Antwerp, Flanders, Belgium. [email:
STEFANIE WALTER is an Assistant Professor in Science and Crisis Communication at the Technical University of Munich’s Department of Science, Technology and Society at the School of Social Science and Technology. Her research interests are in climate change, crisis and political communication, as well as in computational social science and text analysis.
Address: Technical University of Munich, Richard-Wagner-Str. 1, Munich 80333, Germany. [email: