
Abstract
In the information age, a significant portion of information is disseminated visually, yet this mode of presentation is inaccessible to individuals with visual impairments. Instead, they rely on tactile graphics, which utilize raised lines, to convey visual information. This article undertakes a scoping review, following the PRISMA guidelines, to ascertain the current state of research in the field of tactile graphics design. The analysis rigorously examines the fundamentals of tactile graphics design, exploring how visual information can be effectively translated into tactile formats to meet the unique needs of visually impaired individuals. The study advocates for a redefinition of visual impairment, suggesting it should be perceived as a distinct way of processing information, rather than a barrier. By presenting the current state of research and pinpointing areas for future investigation, this study seeks to inspire the tactile graphics design community to embrace new challenges and opportunities, ultimately fostering inclusive communication and understanding across diverse user groups.
Keywords
Introduction
In the contemporary information age, the primary purpose of information visualization is to leverage the capabilities of the human visual system with the aim of facilitating the extraction of insights from abstract information, aiding in the resolution of logical problems, enhancing cognitive thinking and reasoning processes, and facilitating the comprehension of complex data (Card et al., 1999; Hearst, 2009; Heer et al., 2010). Through the utilization of various visual mediums such as charts, diagrams and infographics, intricate data is transformed into visually accessible representations, thereby assisting individuals in their comprehension, pattern recognition and informed decision-making endeavours (Eppler and Burkhard, 2007; Iliinsky and Steele, 2011; MacEachren, 2004). However, according to the World Health Organization’s (2019) report, approximately 2.2 billion people worldwide are afflicted with some form of vision impairment or blindness. These individuals consistently encounter formidable barriers when attempting to access information that predominantly relies on visual modalities, which in turn curtails their active participation in educational, professional and social lives (Beverley et al., 2004; Williamson et al., 2000).
In this context, the sense of touch emerges as a critical avenue for information processing among individuals with visual impairments (Paterson, 2007). Touch enables the perception of different textures, temperatures and shapes, offering a unique way to understand and interpret the surrounding environment (Speed and Majid, 2020). This sensory input often proves to be more dependable for certain types of recognition and comprehension when compared to visual or auditory cues, particularly for individuals with visual impairments (Luo et al., 2017). For example, verbally describing complex charts can result in lengthy description that is hard to understand (Engel and Weber 2018). The discussion about usefulness and usability of tactile graphics has been ongoing since 1930s (Merry and Merry, 1933). Tactile graphics are images that use raised surfaces and which emerged as a potent tool for bridging the information gap experienced by visually impaired individuals (Edman, 1992). These graphics serve the crucial function of converting visual information into a tactile format, enabling individuals to perceive and interpret it through the sense of touch. Tactile representations encompass a wide range of visual elements, including images, maps, charts and other graphics, allowing visually impaired individuals to ‘visualize’ information in a manner that is accessible to them (Maćkowski et al., 2023; Yang et al., 2021). Consequently, tactile graphics play an indispensable role in both education and daily living for the visually impaired. They provide a means for individuals with visual impairments to access and engage with the same information and content as their sighted peers, thereby promoting inclusivity and equal opportunities in various aspects of life (Steele, 2015).
Research in tactile graphics has yielded significant advancements in the field of human–computer interaction. Noteworthy examples include Thermal Printers (Iranzo Bartolomé et al., 2020), 3D Printers (Barvir et al., 2021; Nicot et al., 2021) and Tactile Displays (Gill and Pawluk, 2022). Despite the proliferation of various methods and algorithms for generating tactile graphics, the creation of simple tactile representations from informational content and images remains a challenging endeavour. The challenges manifest in several aspects: firstly, tactile graphics necessitate the involvement of specialized personnel and demand considerable time to produce high-quality outcomes. Although research endeavours are advancing, the generation of tactile graphics is not yet fully automated. Secondly, although research in related areas has reached a relatively mature stage, the practical application and widespread dissemination of tactile graphics design remain limited due to their inherent complexity. Additionally, the majority of methods employed in tactile graphics creation remain rooted in traditional techniques (Mukhiddinov and Kim, 2021). As a result, our review places its primary focus on the design fundamentals (elements, attributes and principles) involved in visualizing information into tactile graphics, rather than delving into the intricacies of tactile graphics generation techniques, thus providing a clearer understanding of tactile graphics design to a wider range of practitioners. The objectives of the present study are as follows:
(1) Conducting a comprehensive review of existing literature pertaining to tactile graphics design, with a specific emphasis on elucidating the current state of this research field.
(2) Analysing the design fundamentals and identifying the key factors that contribute to their overall effectiveness.
(3) Identifying specific areas within the field where further research is needed and proffering directions for the continued development and enhancement of tactile graphics design.
The rest of the article is organized as follows: Section 2 presents the evolution and applications of tactile graphics. Section 3 discusses the review research approach employed in this study. Sections 4 and 5 present a critical review of the identified literature and a meta-synthesis of the studies to draw insights into current tactile graphics research, followed by a discussion to highlight challenges and opportunities in tactile graphics design. Finally, sections 6 and 7 present the conclusion, which reflects on the significance and limitations of the study.
Overview of Tactile Graphics Study
Evolution and principles
Tactile graphics has experienced evolution, transforming from rudimentary methods aimed at providing basic sensory input to sophisticated designs that leverage technological advancements for enhanced accessibility. Initially, tactile graphics were primarily developed as simple raised representations of images intended to convey information through touch, primarily for individuals who are blind or have low vision (Kennedy, 1993; Mukhiddinov and Kim, 2021). These early efforts were guided by the principle of direct translation from visual to tactile forms, often without comprehensive consideration for the distinct cognitive processing and experience differences between the two modalities (Gallace and Spence, 2014). Over time, as awareness and understanding of the unique needs and capabilities of tactile learners grew, the development of tactile graphics began to incorporate more nuanced design principles. This evolution was marked by a transition from merely replicating visual graphics in a tactile format to designing with an emphasis on usability (Horton et al., 2017), accessibility (Kim et al., 2021) and educational value (Park and Hong, 2023), acknowledging the tactile modality’s specific requirements and constraints (Götzelmann, 2018; Jones and Sarter, 2008).
Key studies and theoretical frameworks have played pivotal roles in shaping the field of tactile graphics design, contributing both foundational knowledge and innovative approaches. Guidelines and standards for tactile graphics such as those developed by the Braille Authority of North America (2010) and Braille Literacy Canada have formalized tactile graphics and provided a framework for consistency in presentation of information that can be widely adopted (Gorlewicz et al., 2020). Seminal works by pioneers emphasized the importance of understanding tactile perception and cognition (Johnson and Hsiao, 1992), proposing that effective tactile graphics require designs that accommodate the tactile system’s spatial resolution and exploratory procedures. Building on this, the theory of haptic perception highlighted the importance of interactive exploration in understanding tactile graphics, suggesting designs should facilitate active engagement through features like varied textures and raised outlines (Hughes and Jansson, 1994; Jacobson, 1998; Schneider et al, 2017). Thus, tactile graphics design integrates principles from various disciplines such as psychology, computer science, education and graphics design.
In the realm of tactile graphics design, core principles such as simplicity, contrast and scalability are pivotal for creating accessible and effective tactile representations. Simplicity is paramount as overly complex images can be confusing when translated into a tactile format (Wabiński et al., 2022). Designers are advised to distill graphics down to their most basic elements, removing any unnecessary details that could obscure the primary information being conveyed. Contrast, in tactile graphics, extends beyond visual distinctions to include variations in texture and height, helping to differentiate between different features of the graphic (Edman, 1992). Scalability is another crucial principle; tactile graphics should be designed so that they can be appropriately sized without losing the integrity of the information they convey, especially for younger learners (Stangl et al., 2015). Recently, user-centred design principles have become increasingly central in the field of tactile graphics, focusing on tailoring designs to meet the specific needs and preferences of users with visual impairments (Bateman et al., 2018). Studies exploring user interaction with tactile graphics highlight the critical role of usability, revealing that design decisions significantly impact the effectiveness of tactile information (Azh et al., 2016; Gorlewicz et al., 2020). Research emphasizes the importance of involving users throughout the design process and, while much progress has been made, many designs have not been thoroughly validated and tested by the intended users (Horton et al., 2017).
Advancements and applications
The integration of digital technology has further revolutionized tactile graphics, expanding the possibilities for design and dissemination. Advances in 3D printing, embossing and thermoforming techniques have enabled the creation of more complex and detailed tactile representations, making previously challenging concepts more accessible (Holloway et al., 2018; Ladner et al., 2005). Additionally, the advent of digital tactile displays offers dynamic interaction with graphics, allowing for real-time exploration and manipulation that was not possible with traditional static methods (Ikei et al., 1997; Jones and Sarter, 2008). These technological advancements are supported by ongoing research into tactile graphic user interfaces, multimodal learning and the cognitive processing involved in interpreting tactile information, which continues to inform best practices in design.
The exploration of new materials and techniques continues to push the boundaries of what is possible in tactile graphics. For instance, researchers are experimenting to combine the advantages of organic actuator materials and additive printing technologies, offering the potential for tactile applications that are ergonomic, readily customizable and economical for everyone (Zhai et al., 2021). Artificial intelligence and machine learning algorithms are beginning to be applied to tailor haptic devices and tactile graphics to the individual needs of users (Culbertson et al., 2018; Krufka et al., 2007). Additionally, advancements in haptic technology promise to make tactile graphics more immersive, simulating various textures and temperatures, thereby enriching the tactile experience beyond the traditional raised lines and textures (McLaughlin et al., 2002; Sreelakshmi and Subash, 2017). This evolution not only benefits individuals with visual impairments but also enriches the sensory experience of learning and interaction for all users, highlighting the inclusive potential of advancements in tactile graphics design.
The applications of tactile graphics span a diverse array of fields from education and navigation to art and rehabilitation, demonstrating its versatility and impact on accessibility. In educational contexts, tactile graphics are indispensable for conveying complex visual information to students with visual impairments, facilitating access to subjects such as the STEAM (Science, Technology, Engineering, Arts and Mathematics). In these contexts, tactile graphics enable students to access diagrams, mathematical charts and scientific models through touch, thus facilitating an inclusive learning environment (Hahn et al., 2019). Research highlights the effectiveness of tactile graphics in enhancing comprehension and retention of information, particularly when paired with verbal descriptions (Phutane et al., 2022). Furthermore, the use of tactile graphics in navigation, particularly in the form of tactile maps and building plans, empowers individuals with visual impairments to navigate spaces more independently and safely (Ottink et al., 2022). Palivcová et al. (2020) presented an interactive tactile map designed for elderly individuals with visual impairments, with the purpose of enhancing their spatial knowledge of intricate indoor environments. Quero et al. (2021) introduce an interactive multimodal guide prototype that uses audio and tactile modalities to improve the autonomous access to information and experience of visual artworks. These applications are crucial for enhancing mobility and spatial awareness, contributing significantly to the autonomy of visually impaired individuals.
Summary
While the field of tactile graphics has made significant strides, there remains considerable scope for advancement in understanding and applying design fundamentals more effectively. We found that most of the existing research describes and discusses tactile graphics design using the lens of cognitive understanding and technological change, such as usability testing or optimizing innovation. At the same time, there is a lack of systematic analysis of the complex factors that need to be considered in tactile graphics from a design fundamentals perspective. The field of tactile graphics design necessitates a synthesis of both design principles and accessibility considerations, rendering it an inherently complex and interdisciplinary area of study. This complexity can pose significant challenges in attracting researchers with the requisite cross-disciplinary expertise. In addition, tactile graphics as an academic field is relatively niche when compared to broader design disciplines, which are predominantly oriented towards visual perception. As a result, it is difficult for designers to assimilate knowledge from the literature as a theoretical basis for future tactile graphics design. An enhanced research focus on tactile graphics and design fundamentals is crucial to fill existing knowledge gaps and improve accessibility for individuals with visual impairments.
Research Methodology
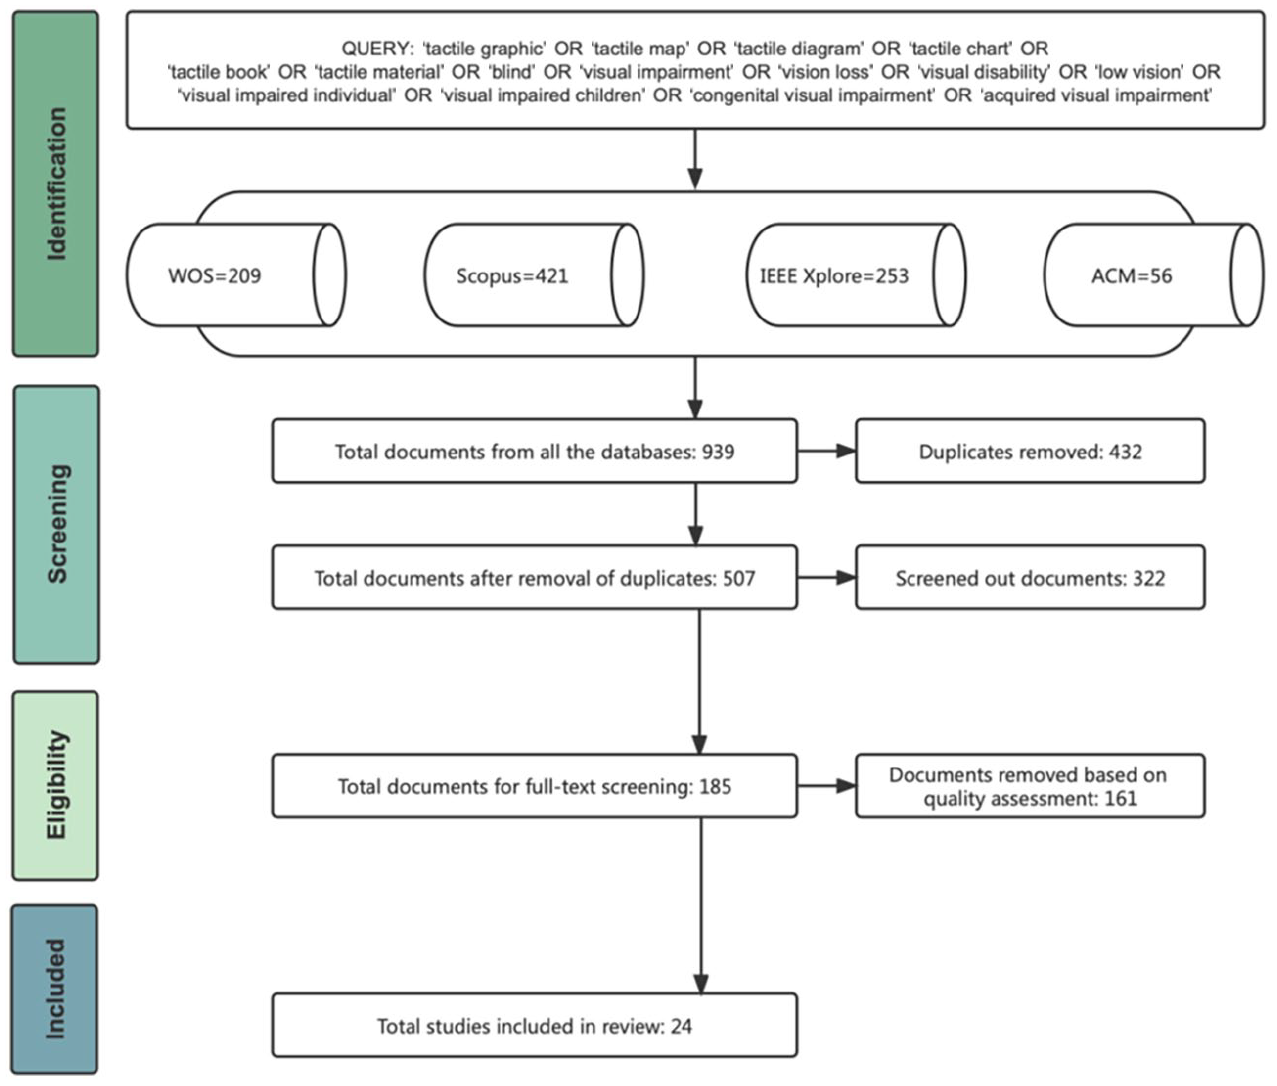
This research adopted a scoping review approach (Peters et al., 2015) to achieve the stipulated objectives, following the Preferred Reporting Items for Systematic Reviews and Meta-Analyses (PRISMA) approach and guidelines (Page et al., 2021). The utilization of PRISMA in this study was predicated on its evidence-based nature, auditability and well-established reputation in the relevant literature. Although there are examples of reviews in different areas of tactile graphics, i.e. tactile displays (Chouvardas et al., 2008), tactile map generation (Wabiński and Mościcka, 2019) and automatic creation of tactile graphics (Mukhiddinov and Kim, 2021), this article is the first scoping review of the literature on tactile graphics in design fundamentals. Figure 1 shows the data collection process via the PRISMA flow chart. All the selected studies were stored and managed within Mendeley Reference Management Software. The following sections discuss the process of the review.
Documents collection process.
Search strategy
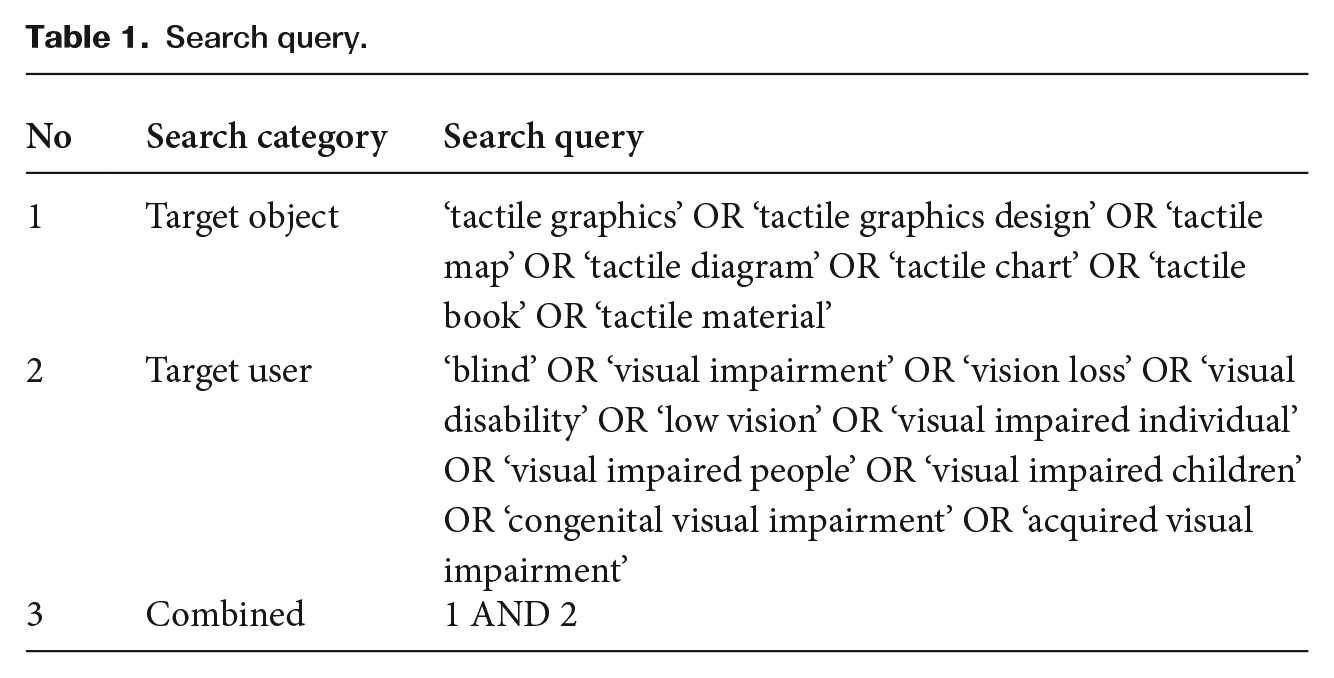
The search was conducted in Web of Science and Scopus and then validated in IEEE Xplore, ACM digital library. The rationale for the selection of the databases utilized in this research is based on their high-impact stature with respect to the design industry and because they have been used in reviews covering similar themes (Mukhiddinov and Kim, 2021). In the reviews, we included keywords for target object and target user since both categories have been deemed important for tactile graphics by experts in the field (see Table 1), and we used all variations of the keywords – singular, plural, hyphenated, or not hyphenated. The temporal scope of our analysis was confined to studies published between 1 January 2000 and 1 July 2023. This time frame was chosen to ensure the relevance of the papers to the contemporary information environment. At this stage, we collected a total of 939 studies. After amalgamating the search results from all databases and removing any duplicates (432), we compiled an initial corpus of 507 publications, forming the basis of our analysis.
Search query.
Selection criteria
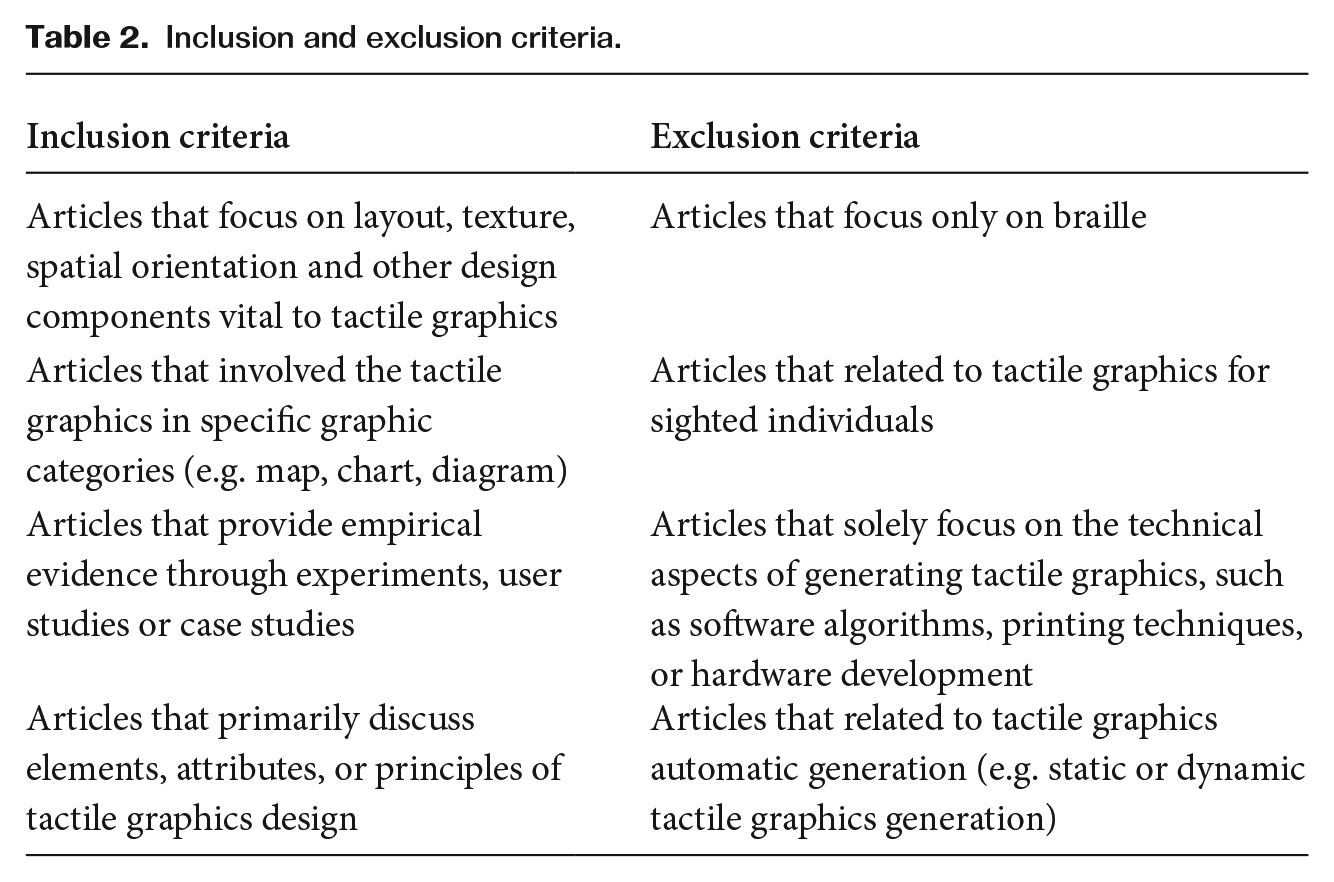
Subsequently, we established predetermined inclusion and exclusion criteria (see Table 2) to assess the quality of articles sourced from electronic databases for the primary corpus. Any ambiguities or discrepancies in decisions reported by researchers were collectively deliberated and resolved. If both criteria are encountered in an article, the reviewers will jointly review the full paper to determine whether it fits the scope of the research in this study. During this phase, 322 studies were excluded as, upon analysis, their abstracts and keywords were not meeting the quality standards set by our evaluation criteria and they were deemed incompatible with the objectives of this review. This rigorous screening process ensured that the remaining studies were closely aligned with the review’s focus and met the necessary quality benchmarks.
Inclusion and exclusion criteria.
Data extraction and quality assessment
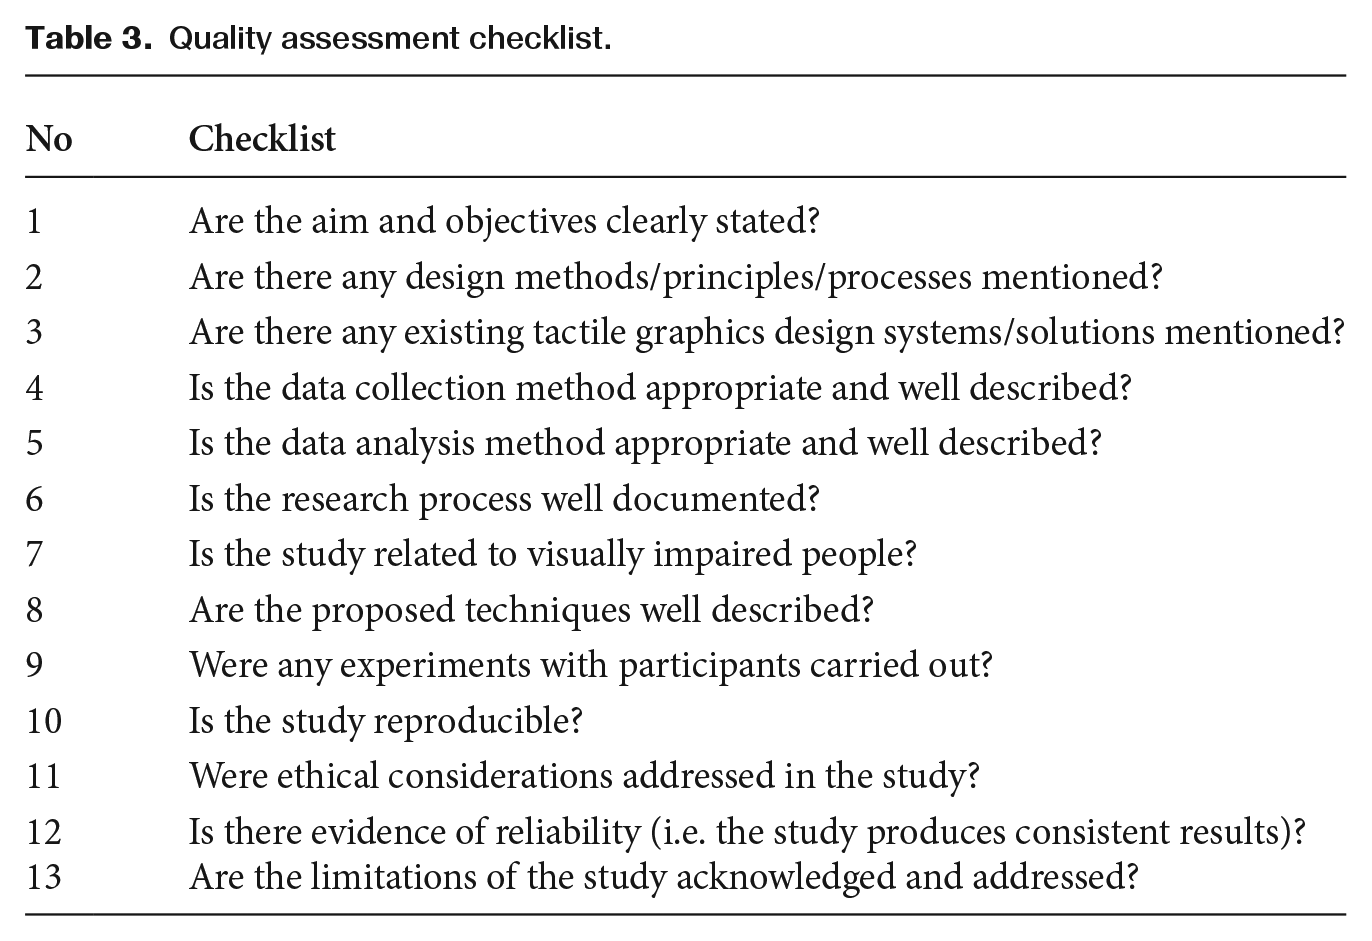
The same evaluation process was applied to the analysis of the full papers. Each of the 185 selected studies underwent a rigorous quality assessment using the checklist provided in Table 3. The results of this refined search were meticulously documented in an Excel spreadsheet. For each publication, the following information was extracted: (1) Year; (2) Authors; (3) Title; (4) Publication type; (5) Aim; (6) Methodology; (7) Contribution; (8) Participants; (9) Finding; and (10) Limitation. Consistent with the guidelines outlined by Kitchenham and Charters (2007) and Wabiński and Mościcka (2019), publications that score at least 60 percent on the checklist are deemed suitable for further evaluation in this study. As a result, 161 papers that did not align with the scope of our study were excluded from the literature review. After performing the inclusion, exclusion and quality assessment processes, 24 primary studies met the objectives of this review (Figure 1).
Quality assessment checklist.
Results
The scoping review summarized and categorized articles across these eight characteristics. The subsequent section offers a detailed analysis of the 24 documents sourced for this study. This analysis concentrates on the current state of research in tactile graphics design and provides a synthesis of the design elements, attributes and principles specific to tactile graphics.
Document analysis
As illustrated in Figure 2, it is noteworthy that there has been a discernible growth in research interest regarding tactile graphics design for individuals with visual impairments, as evidenced by an annual increase in relevant publications. More so, the year 2022 saw the highest number of such publications. The distribution of these publications is evenly split between conference papers and journal articles. Within this body of work, the British Journal of Visual Impairment (BJVI) emerges as the journal with the most contributions in this area. Similarly, the International Conference on Computers Helping People with Special Needs (ICCHP) is identified as the conference with the most significant number of relevant papers.
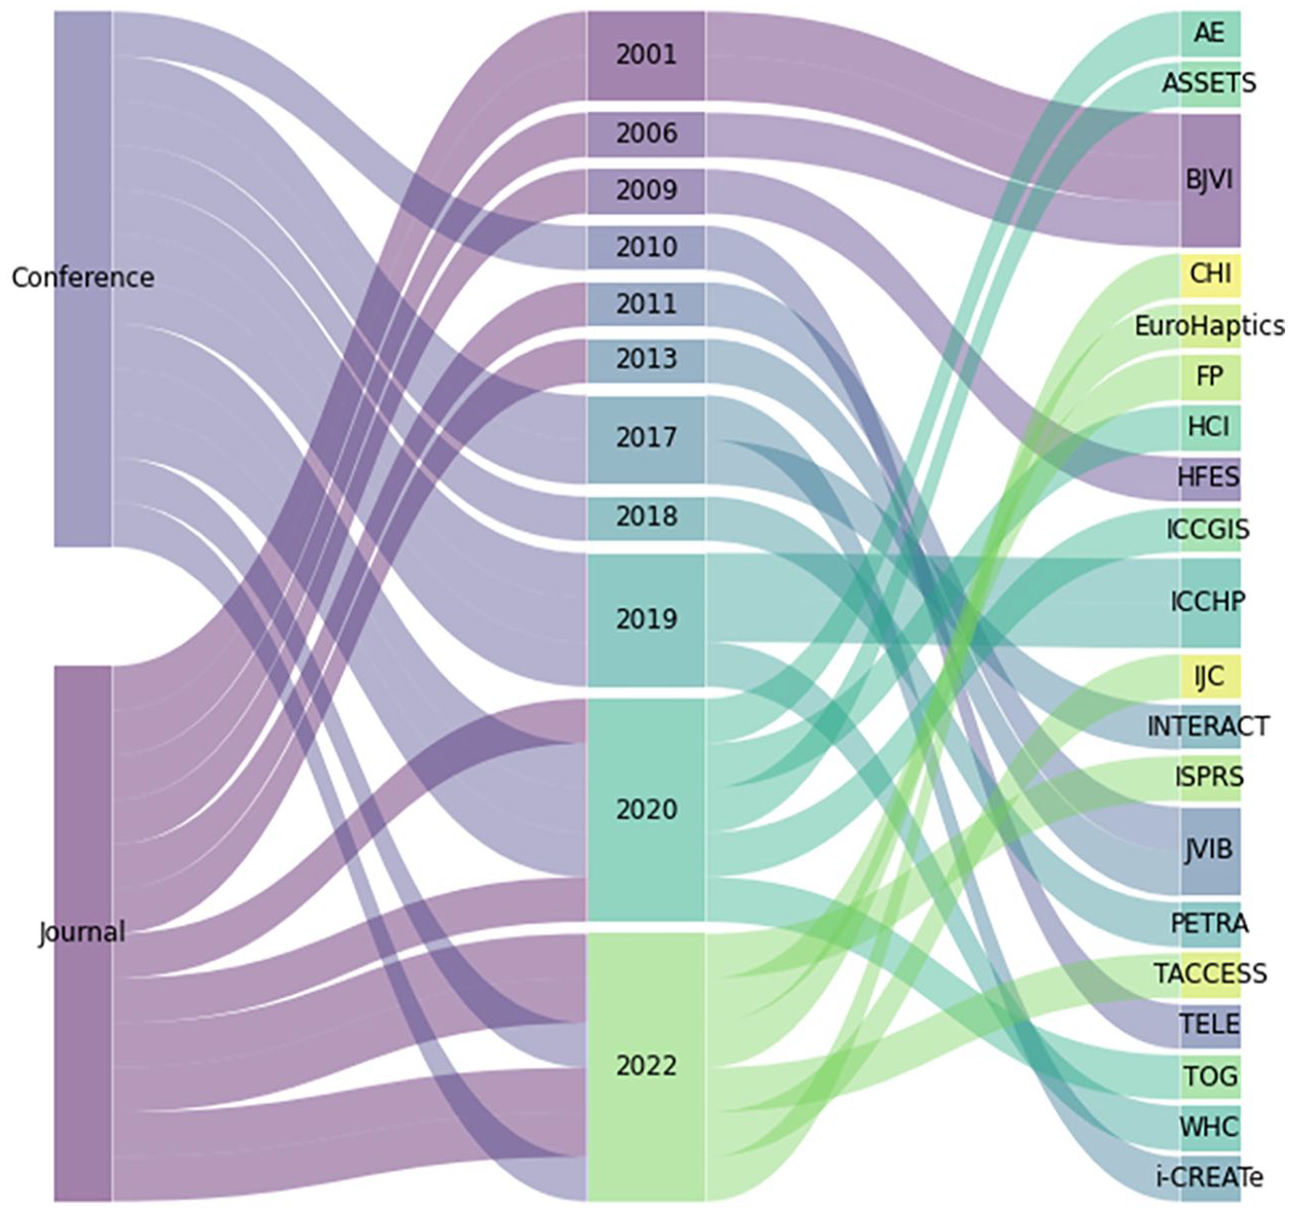
Status of publication of tactile graphics design.
Co-occurrence analysis
The co-occurrence analysis method was employed to create a network of emerging themes by analysing relationships between words (Godwin, 2016) and identifying nodes which represent important terms and their weights within the network (Van Eck and Waltman, 2014). This linguistic approach allowed for pattern recognition, and we utilized co-occurrence networks as a supportive tool to reveal patterns which were then further analyzed. VOSViewer’s keywords co-occurrence clustering functionality (Sood et al., 2021) was used to perform text mining and generate the term map (Figure 3). In this analysis, only co-occurrences with a high frequency (minimum number of occurrences of a term: 3) were included to declutter the representation. The size of the label circle and font size for each theme mirrored its importance, and their proximities represented classification clusters. Five identified theme relationships were revealed from these clusters and served as a guide for the qualitative analysis of the selected literature.
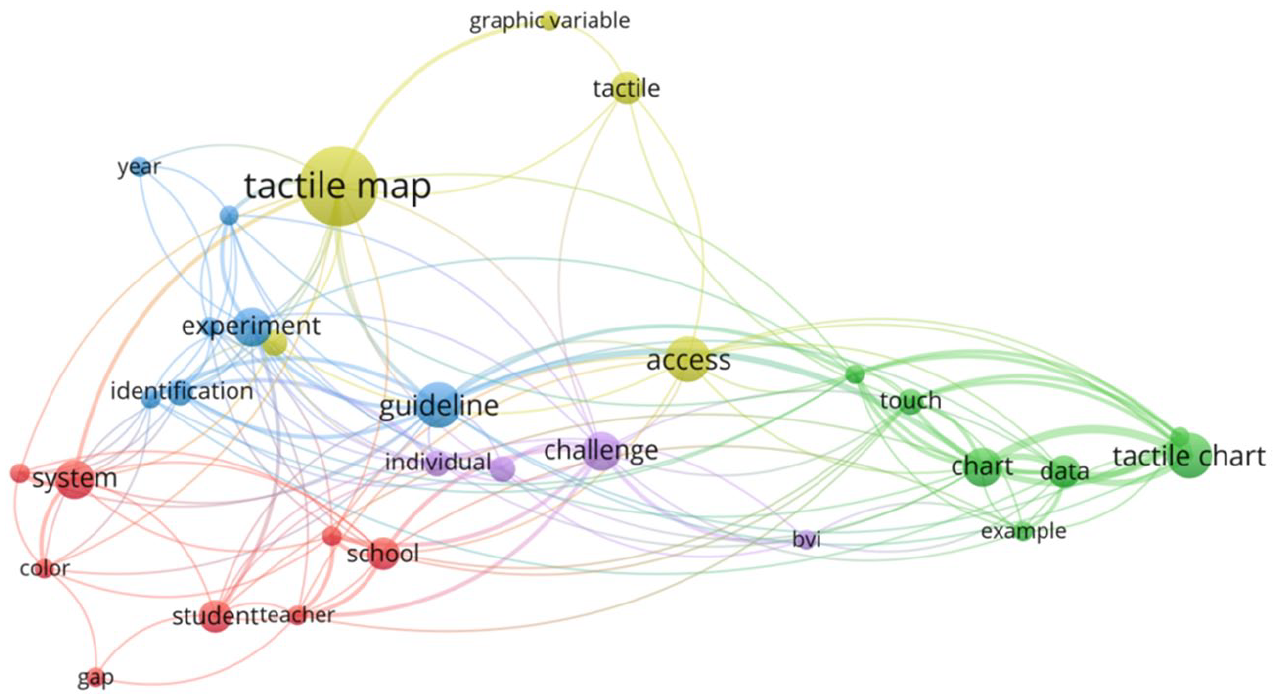
Co-occurrence map of emerging themes.
In Figure 3, the prominence of ‘tactile map’ suggests that it is a central topic of interest in the field of tactile graphics research. At the other end of the spectrum, we see ‘tactile chart’, which is connected to ‘chart’, ‘data’ and ‘example’. This cluster suggests a focus on how data is represented in tactile forms, such as charts, which are crucial for conveying information to visually impaired individuals. The close proximity of these terms indicates that they are often discussed together, highlighting a subfield within tactile graphics research that concentrates on data visualization. The terms ‘access’, ‘touch’ and ‘challenge’ form another cluster, implying discussions around the accessibility challenges of tactile graphics. This might encompass issues related to how users interact with tactile graphics (‘touch’) and the barriers they face (‘challenge’). Additionally, there is a cluster including ‘experiment’, ‘guideline’, ‘individual’, ‘school’, ‘teacher’, ‘system’ and ‘color’, which may represent a focus on the practical application and teaching of tactile graphics in systems such as schools. ‘Guideline’ suggests the presence of research on best practices or standards in this area. The visualization also indicates that ‘color’ and ‘gap’ are less central but still relevant themes, perhaps reflecting peripheral research interests such as the exploration of perceived gaps in the field or the role of color in tactile graphics. The identified relationships between these terms inform the synthesis of current research trends, gaps and potential directions for future research in the domain of tactile graphics design.
Overview analysis
As indicated by the data presented in Table 4 pertaining to research institutions and countries, the primary focus of tactile graphic design research is observed to be concentrated in specific countries. The US (6), Germany (5), the UK (4), Brazil (2), Taiwan (2), India (2), Poland (1), Portugal (1), Hungary (1) and France (1) emerge as the main countries contributing to this field. It is important to note the recurrence of specific researcher names and institutions across multiple studies, suggesting a relatively small but interconnected community of researchers specializing in tactile graphics. The geographical distribution of affiliations reveals a predominant presence of research institutions in Europe and the US, while limited attention has been given to this field in Asia and South America. Notably, no research contributions from Africa and Australia were identified, which can be attributed to the historical origins of inclusive and accessible design concepts in the UK and US (Williamson, 2019). This observation underscores the relative dearth of progress in the study of tactile graphic design in developing countries and their research institutions, highlighting substantial potential for further development in these regions.
Overview information of selected papers.
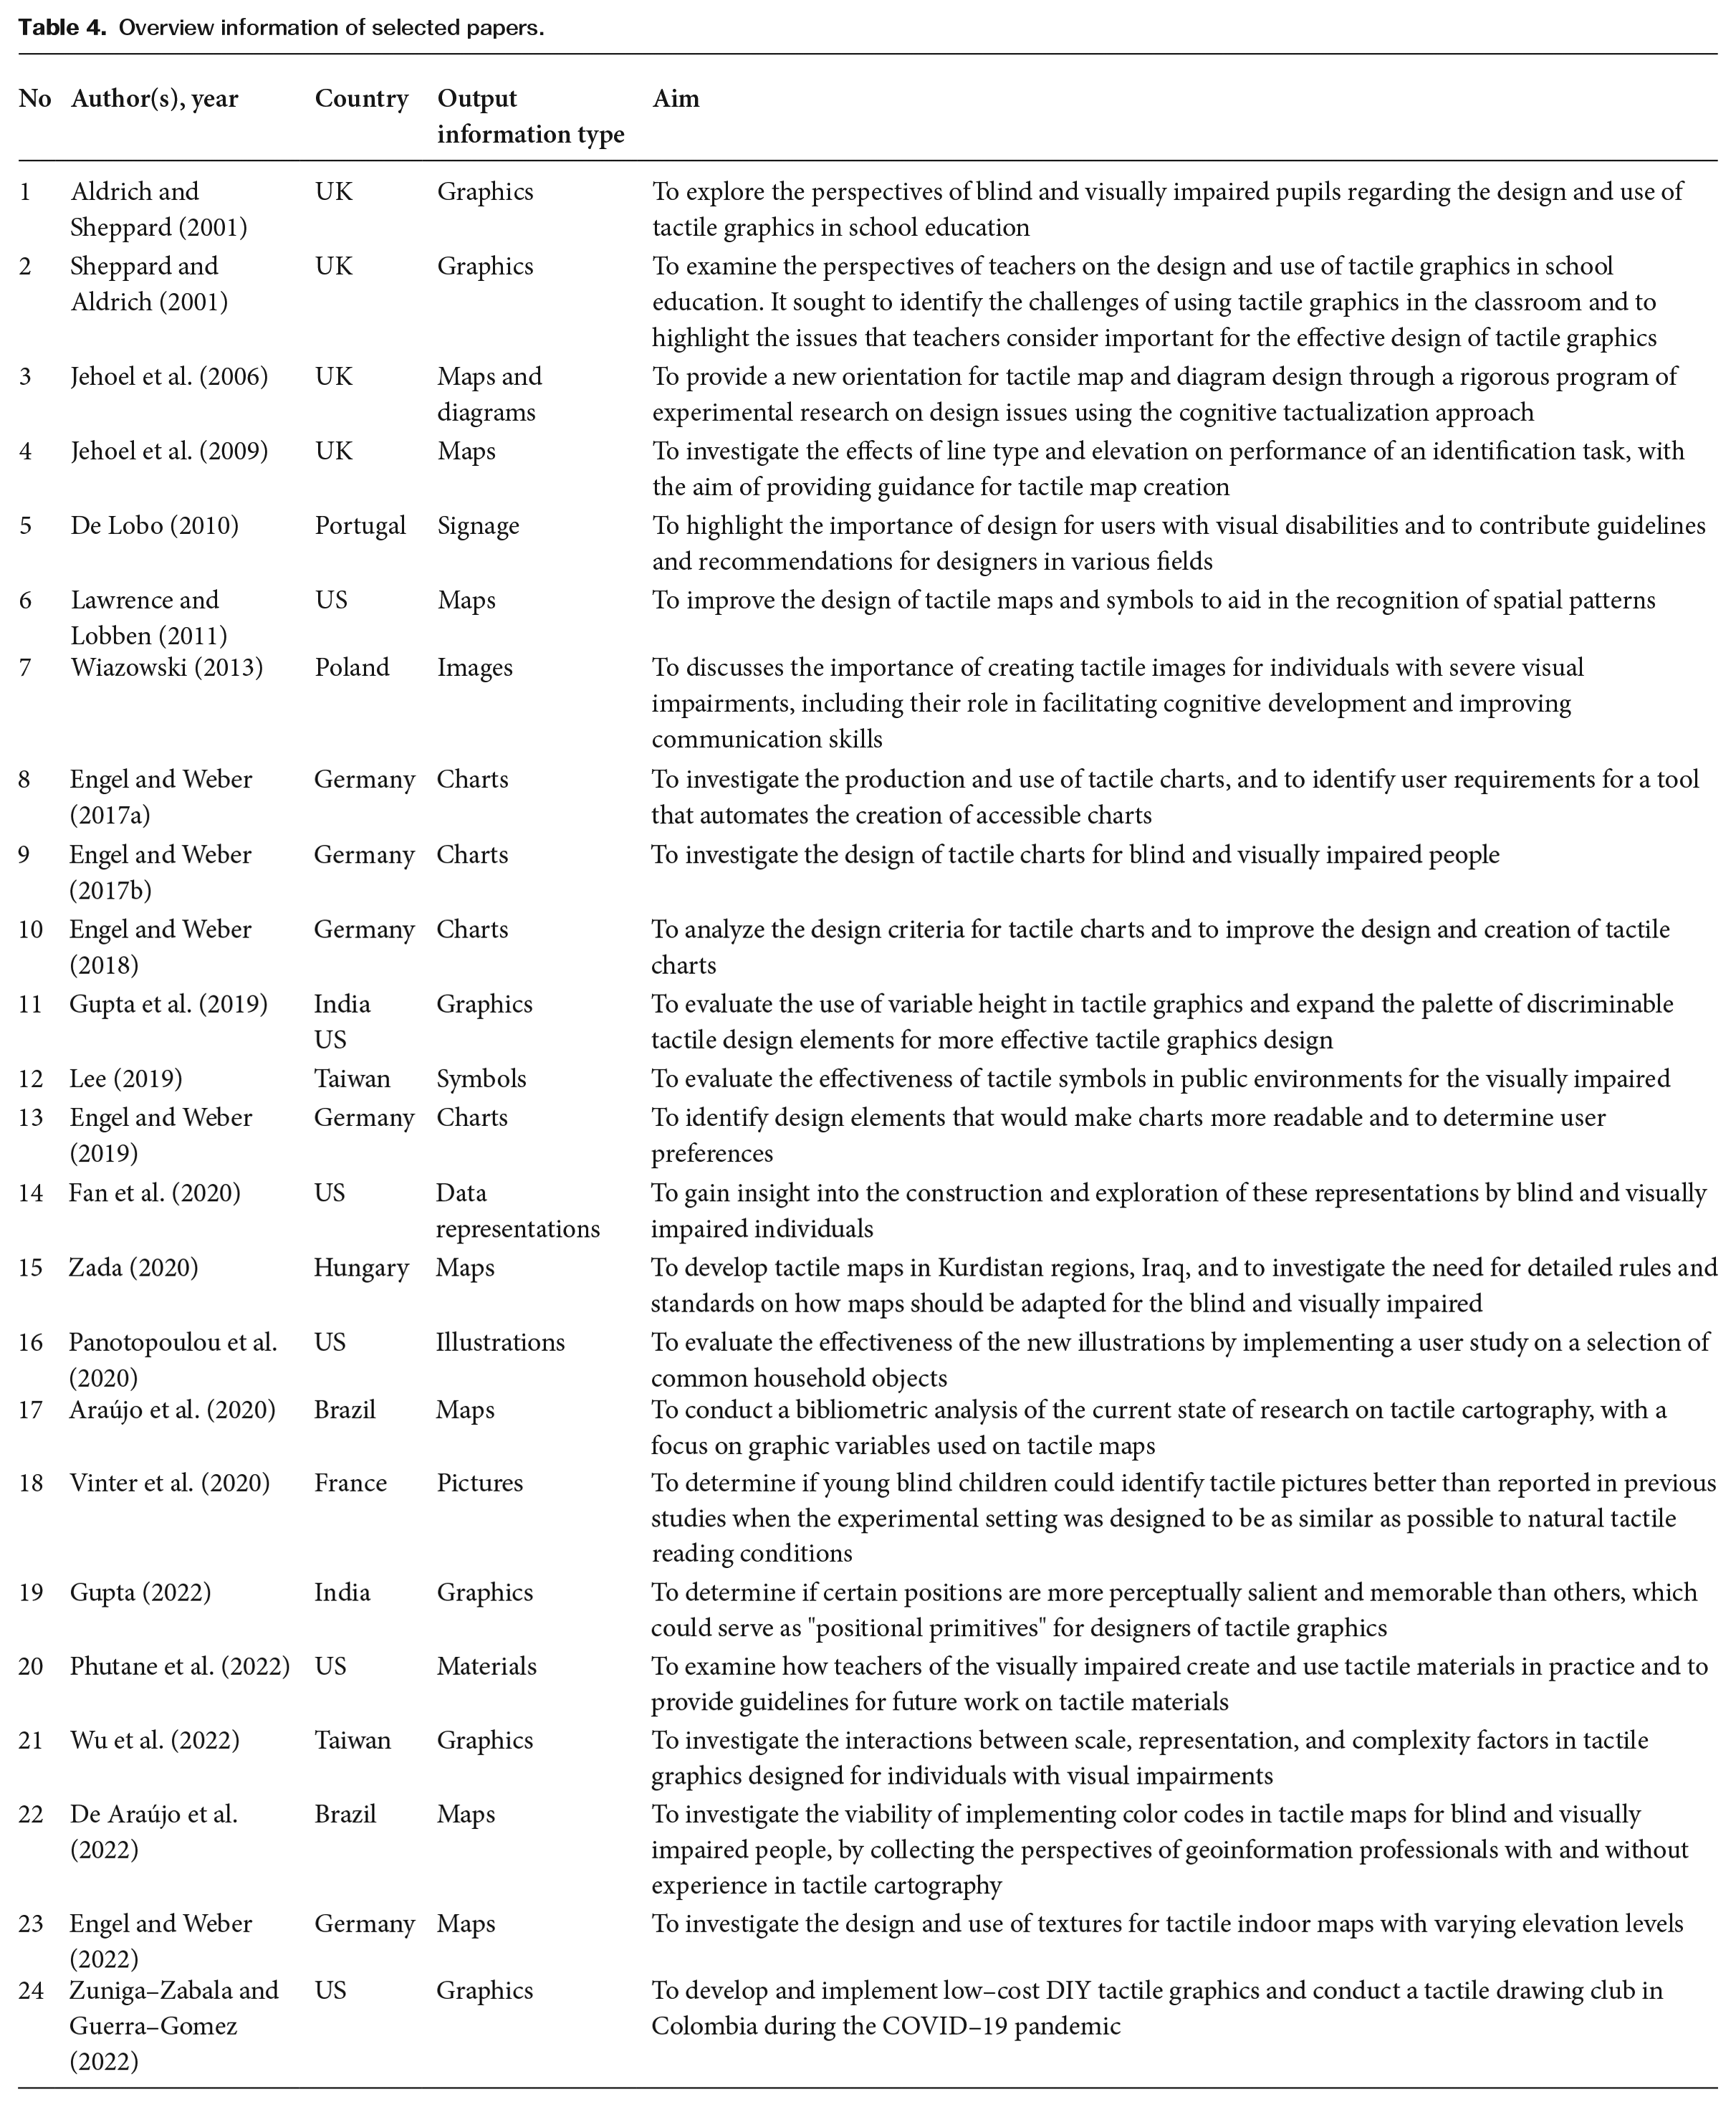
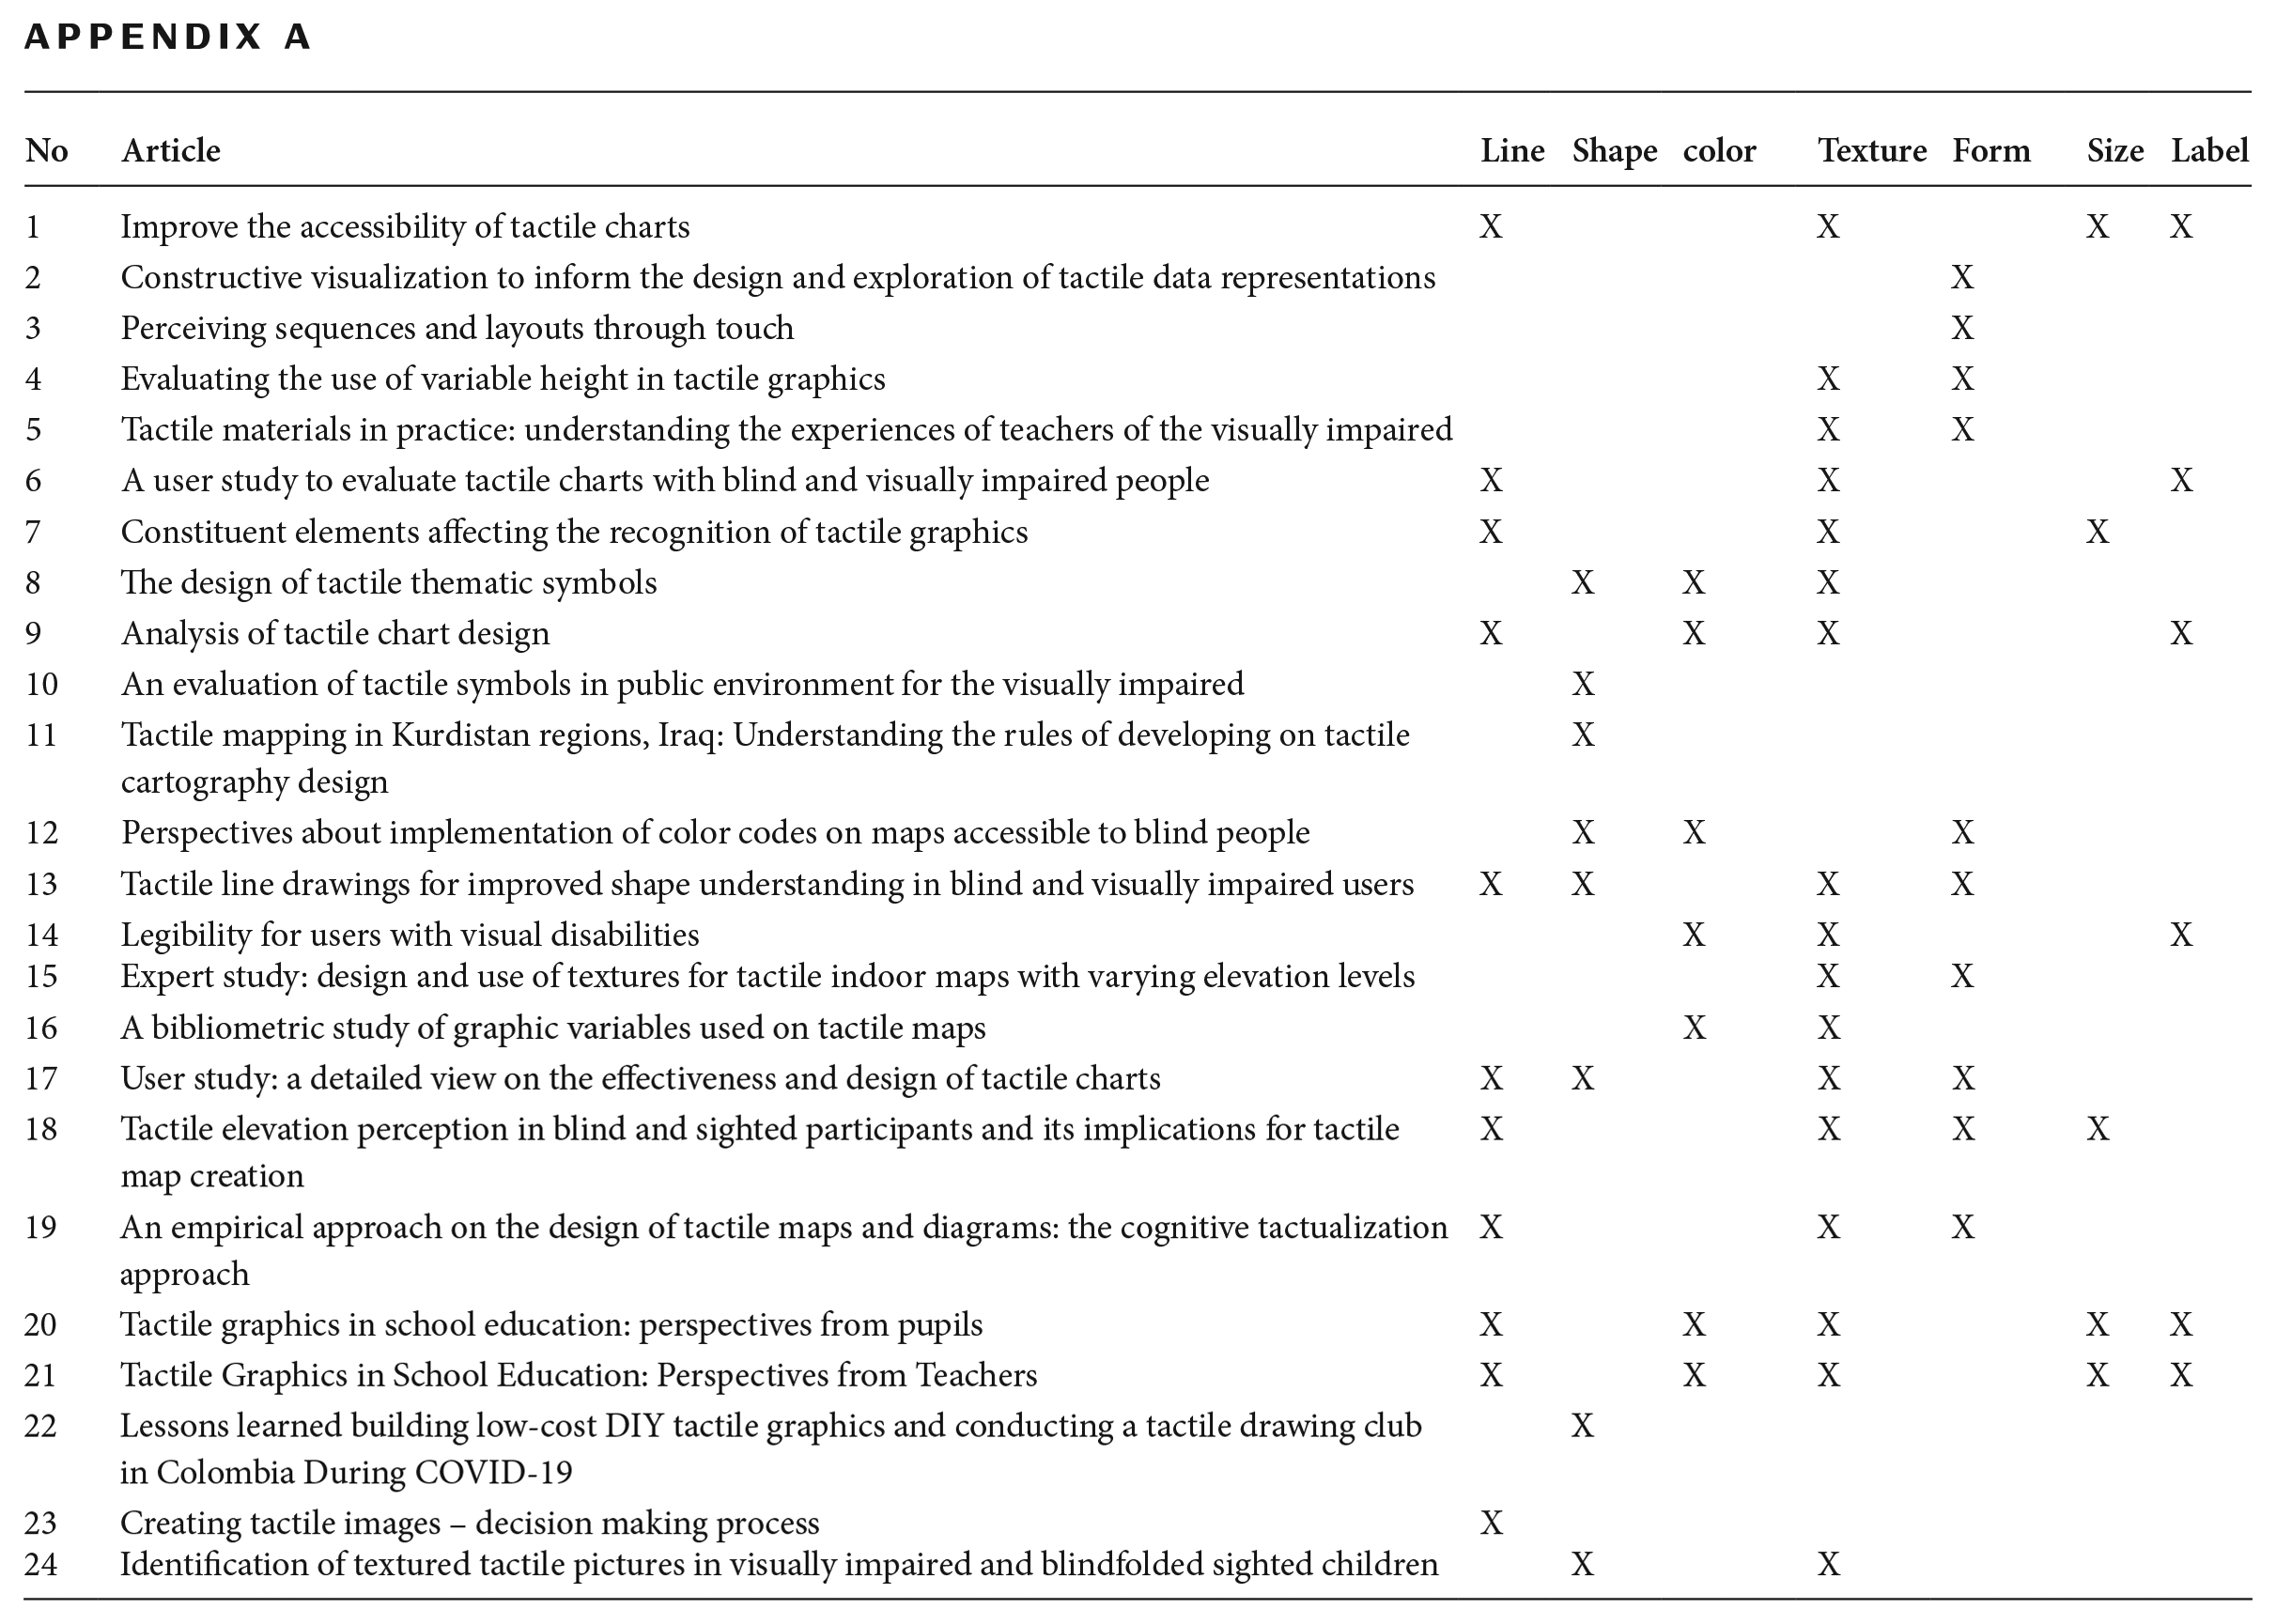
There is a wide range of applications for tactile graphics being explored, from educational settings (school education, teacher perspectives) and specialized applications (maps for specific regions, signage, symbols in public environments) to empirical design considerations (charts, graphics design criteria, use of color and texture). Maps are currently the area of most attention in tactile graphics design. Several studies are aimed at improving the design and creation process of, for example, entries 5, 6, 9, 10, 18, 19, showing an emphasis on enhancing the quality and functionality of tactile graphics. The studies investigate a range of tactile graphics which also indicates the richness and diversity within the field as tactile graphics design are not limited to one type of visual representation.
Participant composition
The characteristics of participant composition are frequently treated as manipulated variables in study designs. Since recruitment of people with visual impairment can be difficult, we found that the number of participants involved in previous studies varied considerably. Table 5 depicts the characteristics of the participant composition in terms of size and age in the screened literature. For the purpose of this review, we use the sample size parameter with three levels defined originally in the general principle (Morse, 2000):
Participant composition: size and age.
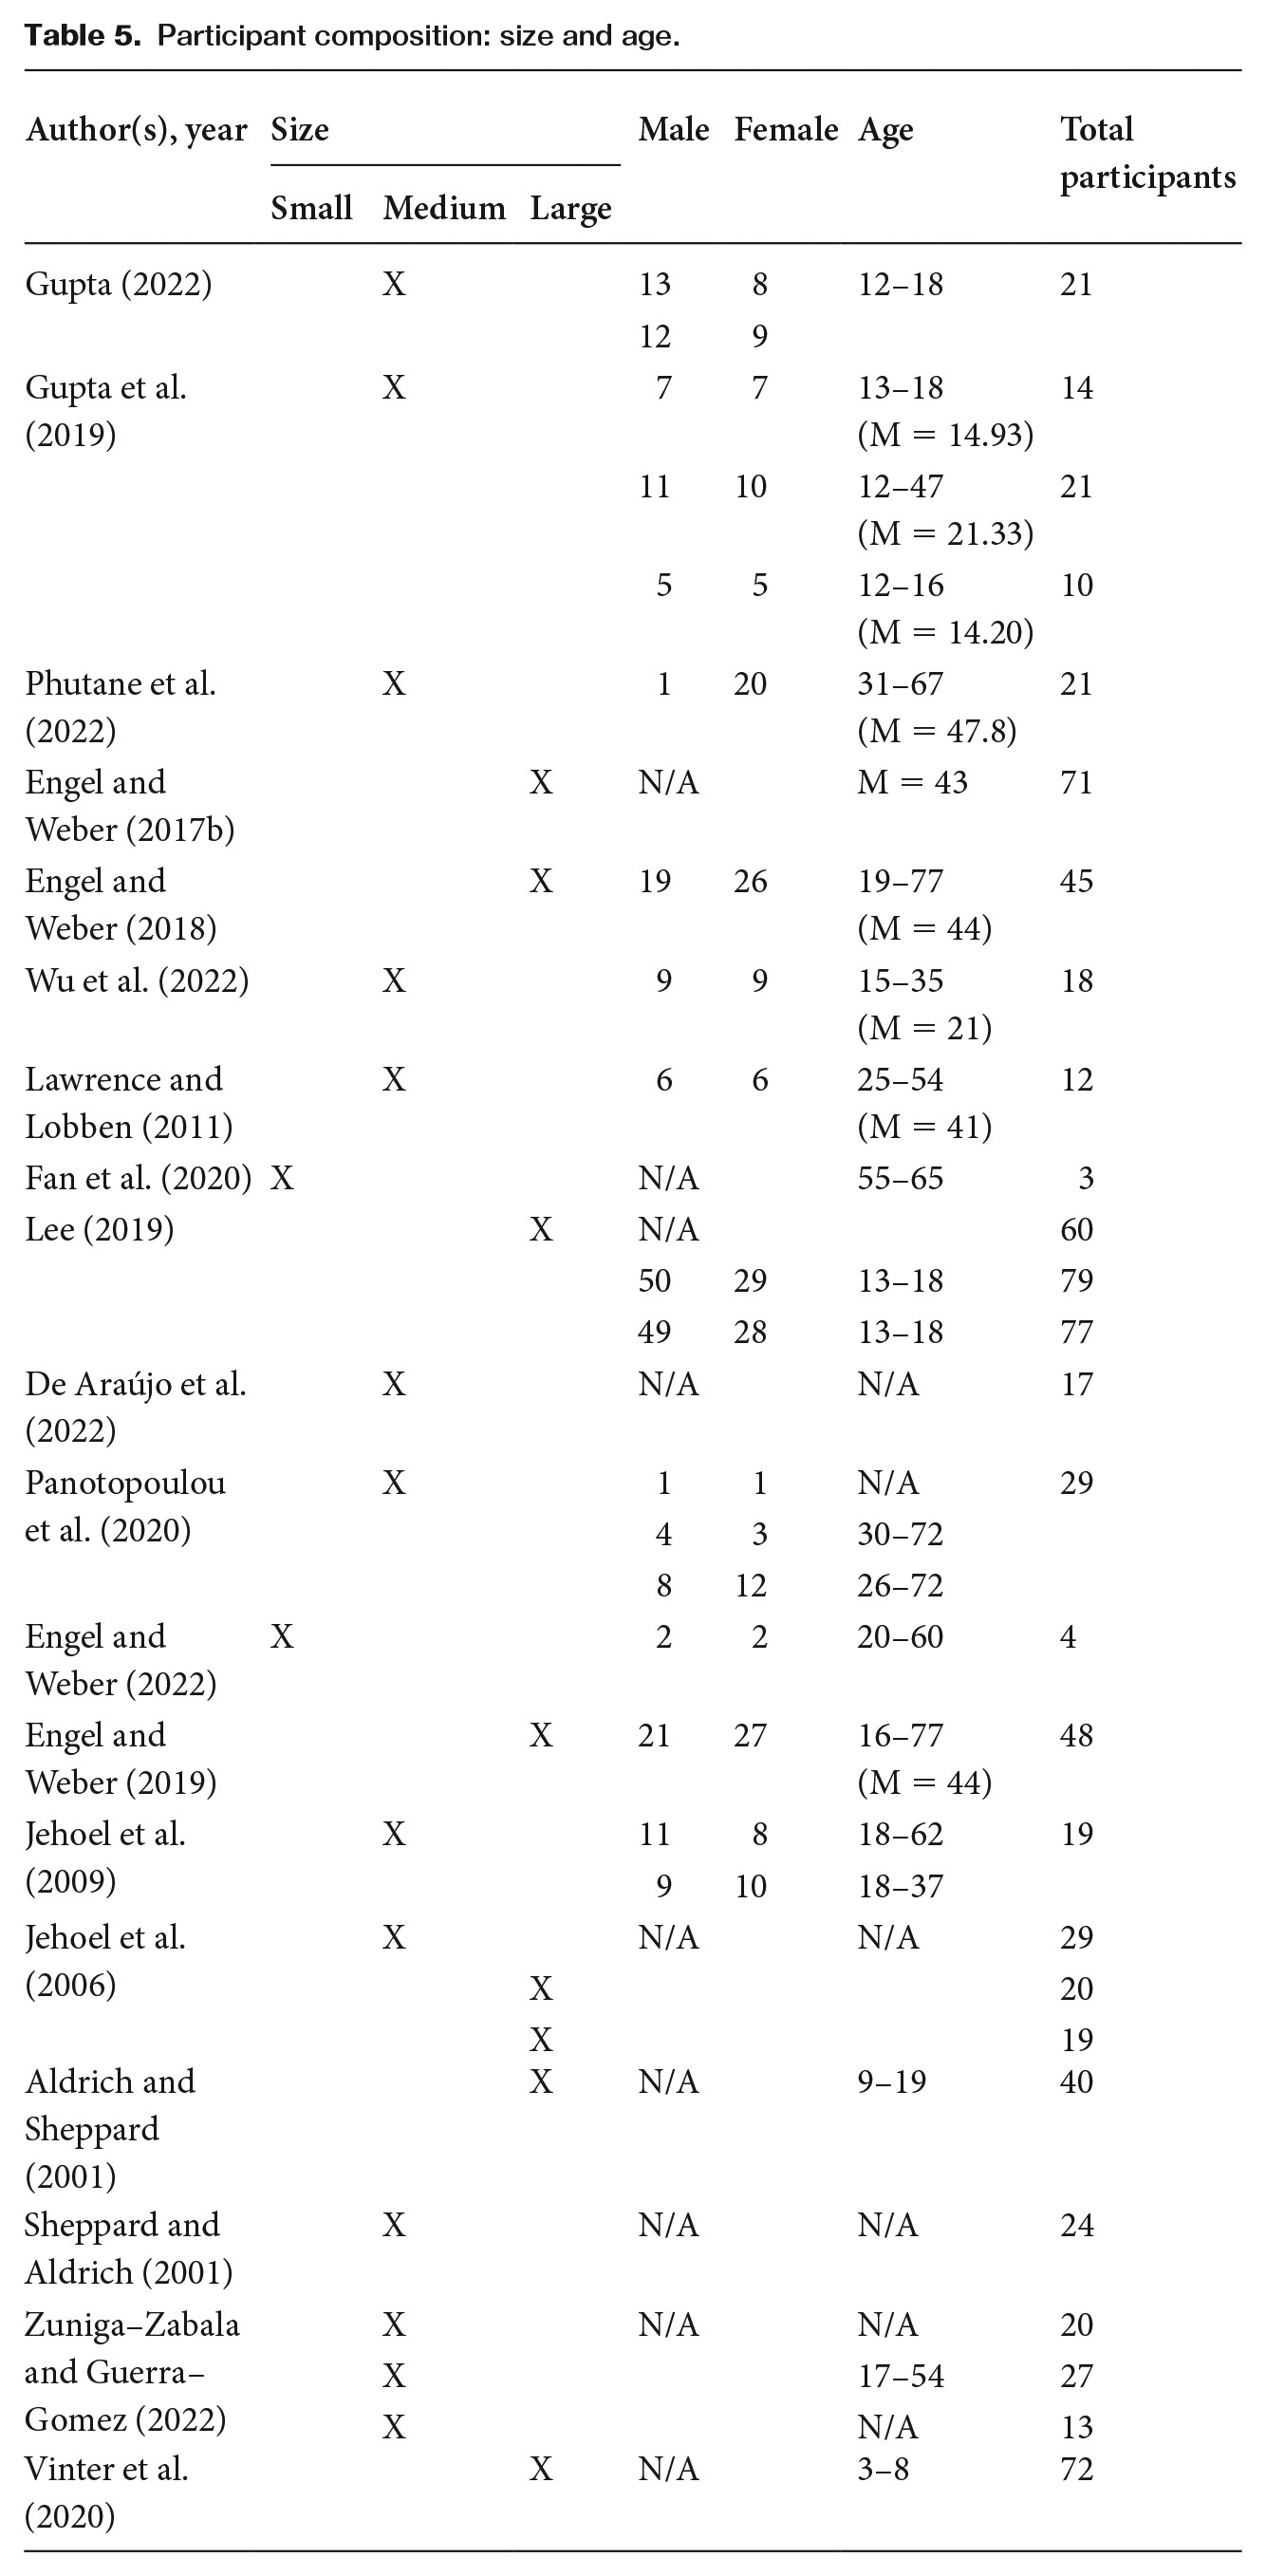
• small with less than 6 participants
• medium with 6–30 participants
• large with more than 30 participants
Most of the studies that recruited participants used medium to large sized experiments. Six of the studies involved more than 30 participants. It might indicate challenges in recruiting large numbers of participants who are visually impaired. The number of participants recruited for studies on people with visual impairment varies widely. Some studies have recruited only a few participants (e.g. Fan et al., 2020, recruited 3 participants), while others have recruited larger samples (e.g. Engel and Weber, 2017b, recruited 71 participants). The largest sample size reported in the table is 79 participants (Lee, 2019). Studies with very small sample sizes might provide detailed insights into specific aspects of tactile graphics usage but may struggle with generalizability. In contrast, studies with larger participant numbers may offer findings that are more representative of the broader visually impaired community, enhancing the external validity of the results. However, it is important to note that the sample size is not the only important factor in determining the quality of a study as the appropriate sample size will depend on various factors such as the scope of the study, the nature of the topic, the study design and quality of data (Morse, 2000).
Research methodology across the review
Due to the specificity of the visually impaired population, we note that there are differences in methodologies applied by the authors in this review. Table 6 presents identified characteristics of the design of selected studies. As presented in Table 6, out of the 19 screened research articles, 10 studies were employing samples from school (e.g. students, teachers and staff). In 12 articles, data were obtained from various social groups (e.g. community or organizations). Additionally, three articles recruited participants from both schools and societal groups, resulting in a larger participant pool and a broader scope of studies.
Research methodology across the screened literature.
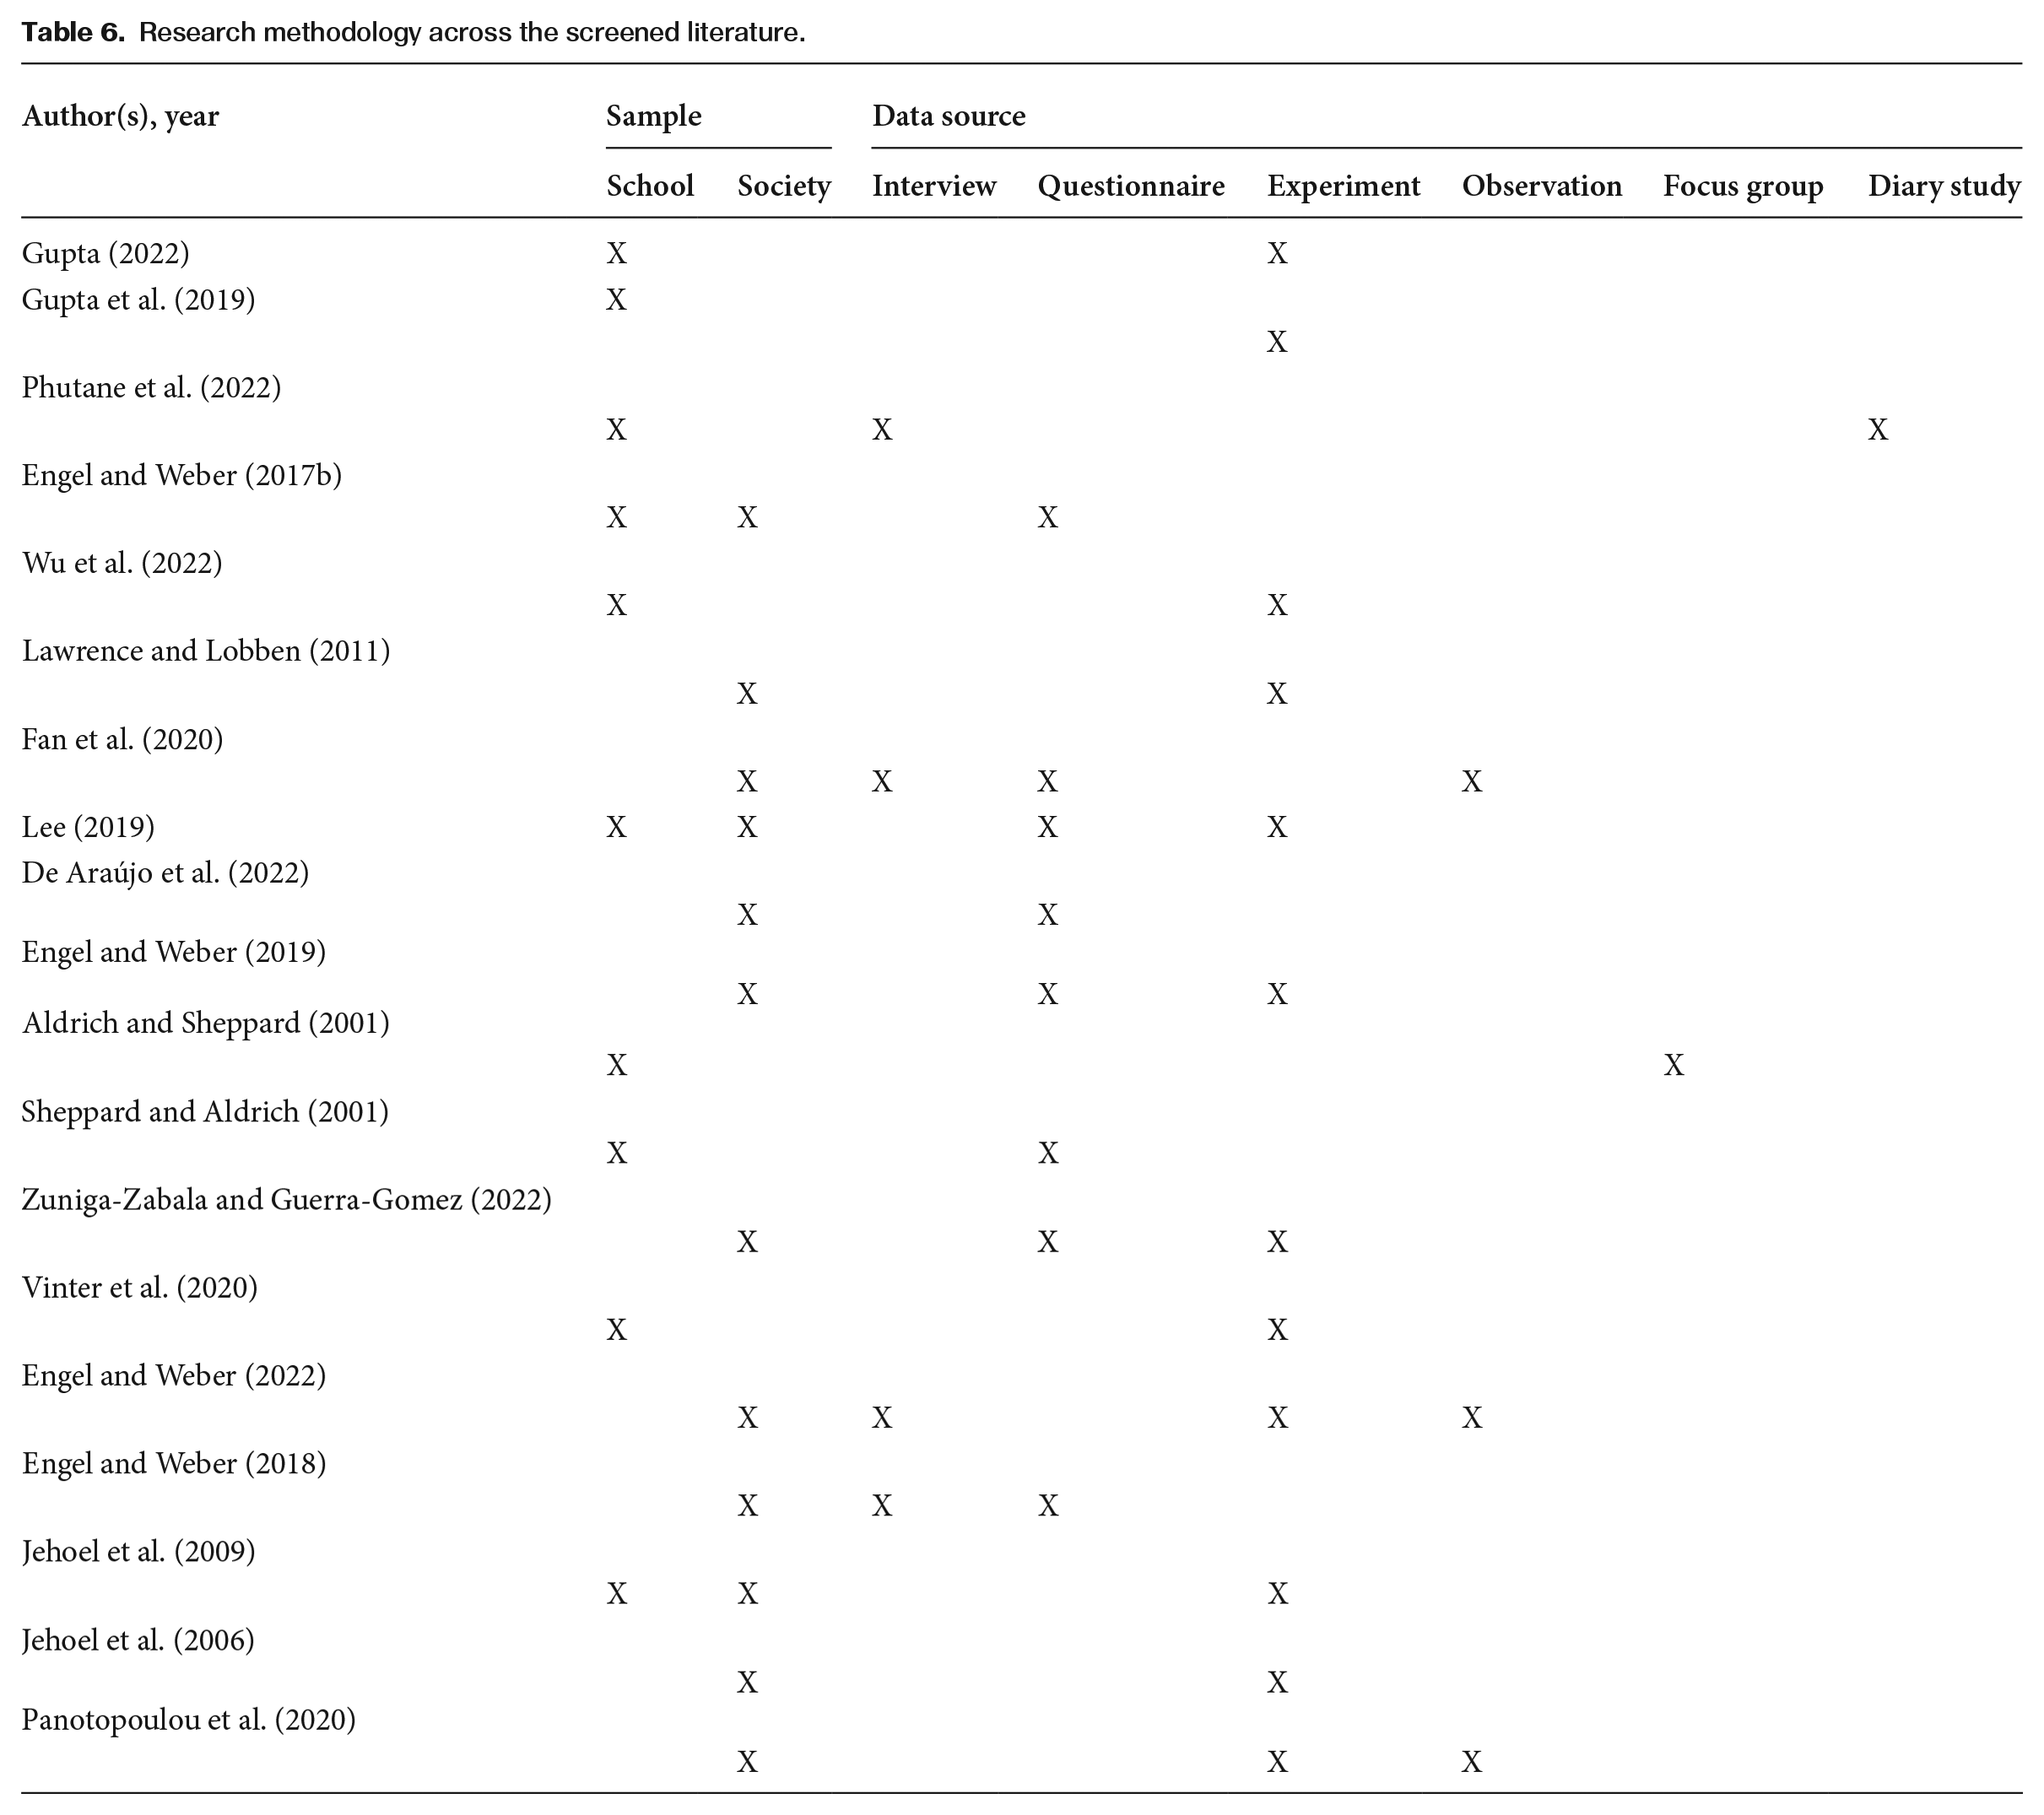
The widespread use of experimental approaches and questionnaires in these studies highlights their value in providing structured, controlled conditions and generating quantifiable data, which are crucial for research on tactile graphics design. Experiments are instrumental in establishing cause-and-effect relationships, essential for understanding how different variables impact the usability and effectiveness of tactile graphics. Questionnaires complement these experiments by efficiently collecting large amounts of data on user perceptions, preferences and outcomes. However, these methods also have their limitations. Experiments often require rigid conditions that may not accurately reflect the real-world usage by visually impaired individuals. Similarly, while questionnaires are efficient, they are susceptible to biases such as self-reporting bias and may fail to capture the depth of participants’ experiences and interactions with tactile graphics. Consequently, several studies have supplemented these methods with observational data (Engel and Weber, 2022; Fan et al., 2020; Panotopoulou et al., 2020).
Qualitative methods such as focus groups and interviews offer rich, detailed insights into the experiences and perceptions of visually impaired individuals, providing depth that quantitative methods might miss. Diary study is a common approach in research on vulnerable groups, but only one article in a study on tactile graphics design used that data collection. These approaches allow for exploration of nuances in how tactile graphics are used and perceived in everyday settings, capturing complex emotional and cognitive responses that standardized methods might overlook. However, the subjective nature of qualitative data can be a limitation, potentially introducing researcher bias and affecting the reproducibility of the findings (Malterud, 2001). In addition, qualitative studies often involve smaller samples (Marshall et al., 2013; Malterud et al., 2016), especially those related to visually impaired individuals, and are hardly representative of the wider population.
Tactile graphics design elements
The elements of design are the fundamental aspects of any visual design and include seven basic elements of graphic design: line, shape, color, texture, form, space and type (Dacey, 2021; Karla, 2017; MasterClass, 2021). While the principles of graphic design can serve as a foundation for designing tactile graphics, it is important to adapt these principles to meet the specific requirements of tactile communication. Therefore, by means of thematic analysis (Braun and Clarke, 2012) and seven graphic design elements, we jointly identified seven main design elements for tactile graphics (see Appendix A). These design elements are: (I) line, (II) shape, (III) color, (IV) texture, (V) form, (VI) size and (VII) label. In order to better understand the similarities and differences between the two design elements, we visualize each element in the following and contrast the differences between graphic design and tactile graphics design elements in Figure 4.
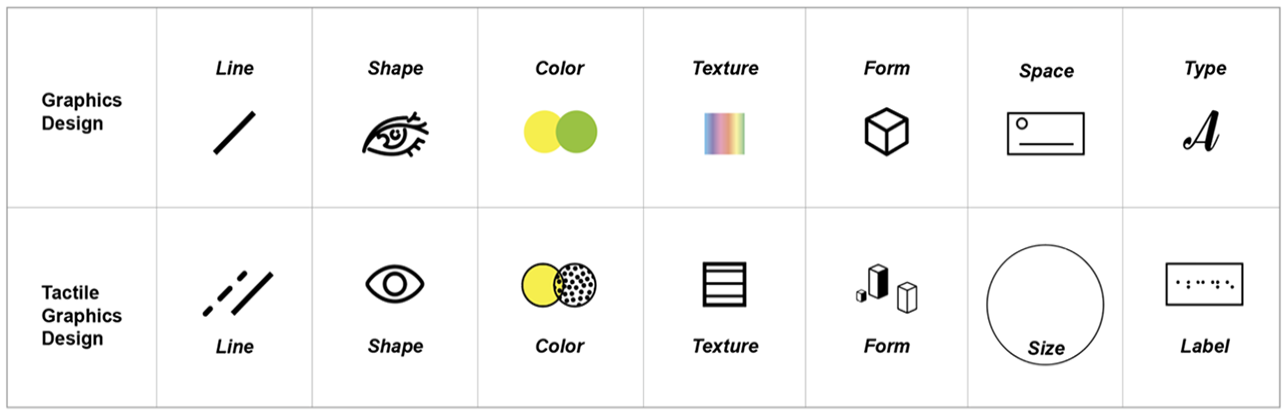
Comparison of graphic design elements and tactile graphics design elements.
Tactile graphics design attributes and principles
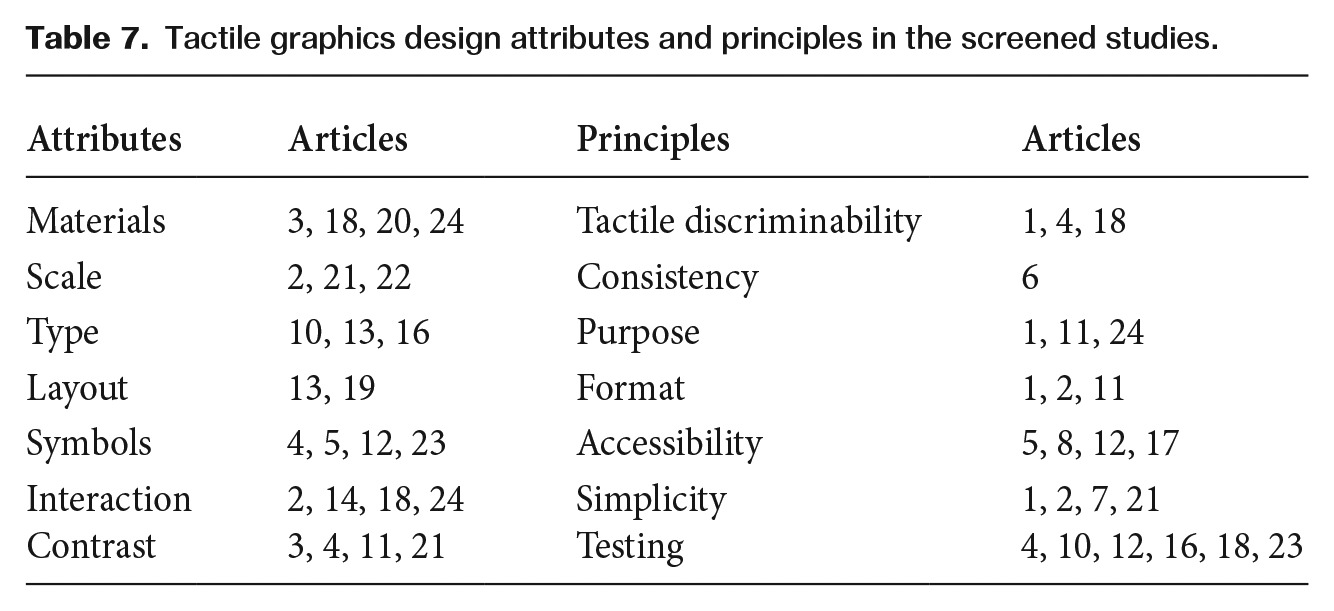
The challenge in tactile graphics design lies in its multifaceted nature, requiring a comprehensive understanding of both design elements and their specific attributes and principles. To elucidate these aspects, we synthesized the attributes and principles of tactile graphics design as discussed in the selected articles, as presented in Table 7, based on the identifiers assigned in Table 4. This synthesis allows us to deduce that the efficacy of tactile graphics design is contingent upon achieving a harmonious balance between clearly distinguishable tactile elements and an approach centred around the user, emphasizing both accessibility and simplicity. The materials and layout need to be carefully chosen to suit the scale and type of information being presented. Consistent use of symbols and types, combined with appropriate contrast and interactive elements, can enhance the learning and user experience. Also, regular testing and feedback incorporation are vital to ensure that the tactile graphics serve their intended purpose effectively.
Tactile graphics design attributes and principles in the screened studies.
Transforming information into tactile graphics
Tactile graphics design is a comprehensive process that spans from the initial information gathering stage to the creation of the final tactile product. Figure 5 illustrates this process in the form of a flowchart, detailing the transformation of information into tactile graphics. This flowchart synthesizes the typical information visualization reference model, as proposed by Card et al. (1999) and Wybrow et al. (2014), with the tactile graphics design process discussed within the selected articles to elucidate the transformation process. The types of information that were converted (tactile transformations) have been analyzed in section 4.3 (Table 4). The primary focus of this section was to scrutinize the processes of user engagement (visually impaired users) and evaluate the overall effectiveness of the resulting tactile graphics (tactile products). User engagement processes involve direct interaction with visually impaired individuals during the design and testing phases, allowing for the iterative refinement of tactile graphics based on user feedback. These processes may vary across individuals due to differences in tactile perception, cognitive abilities and prior experiences with tactile materials. This variation underscores the importance of personalized design approaches and the need for further research into how to effectively extract and convert key information (e.g. which scenes or words in a book should be transformed into tactile form) to meet diverse user needs.
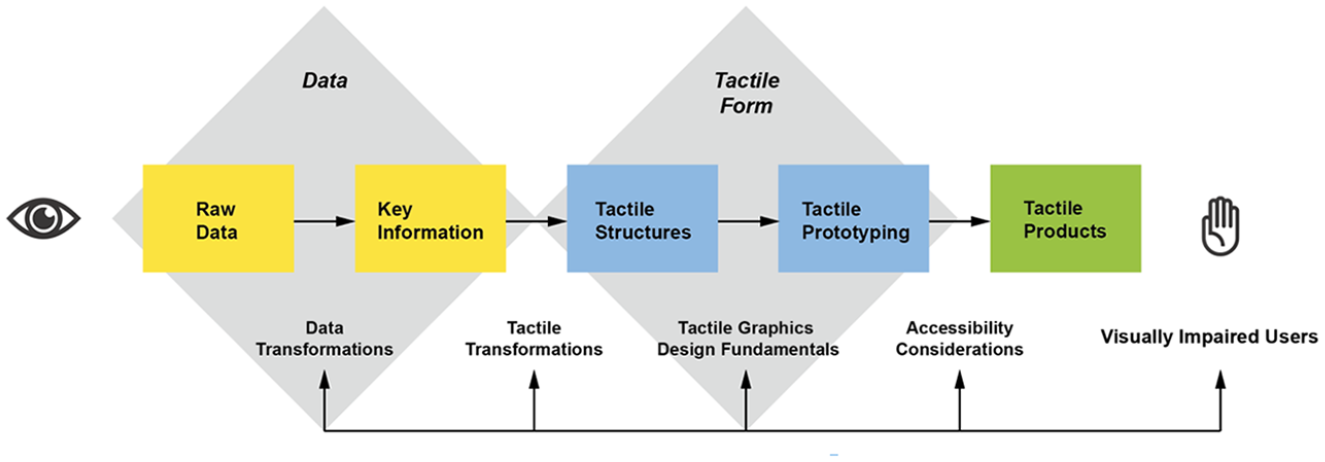
The pipeline of transforming information into tactile graphics.
A key aspect that emerged from the review was the importance of user involvement in the design process. Studies consistently showed that tactile graphics designed with direct input from intended users, especially those from the visually impaired community, were more effective in conveying information (Fan et al., 2020; Panotopoulou et al., 2020). As shown in Table 5, several studies involved users at each step (Gupta et al., 2019; Lee, 2019; Panotopoulou et al., 2020). This user-centred approach not only improved the usability of the tactile graphics but also ensured that they were more aligned with the specific needs and preferences of the end-users (Engel and Weber, 2017b).
The effectiveness of the tactile graphics was assessed in various ways across the studies. Some common metrics included user feedback (Engel and Weber, 2019; Panotopoulou et al., 2020), accuracy in information interpretation (Fan et al., 2020; Lee, 2019) and ease of learning and comprehension (Aldrich and Sheppard, 2001; Vinter et al., 2020). While most studies reported positive outcomes, indicating that well-designed tactile graphics can be a powerful tool for information transfer, challenges such as production cost and time constraints were also noted (Zuniga-Zabala and Guerra-Gomez, 2022); some students also said that things such as diagrams of the structure of the brain were hard to understand and that some inclusion of inappropriate detail was unnecessary and was there just for decoration (Aldrich and Sheppard, 2001). Additionally, the variation in individual tactile reading skills pointed to the need for customized or adaptive design strategies. Jehoel et al. (2009) and Vinter et al. (2020) took into account the influence of age on comprehension. In contrast, the other 22 articles in the corpus did not consider age-related differences in the design and user testing phases, which may affect the comprehensibility of tactile graphics across diverse user groups.
Discussion
Drawing upon the analysis of the selected articles, our exploration in Figure 4 focuses on four principal areas: tactile transformations, tactile graphics design fundamentals, tactile products and visually impaired users. The investigation revealed that other processes within the scope of tactile graphics design are currently underrepresented in the literature, yielding insufficient data for a comprehensive analysis. This gap not only highlights opportunities but also underscores the challenges for future research in this field. It suggests a pressing need for scholarly attention toward lesser-studied areas to broaden our understanding and to enhance the development of tactile graphics as a tool for information accessibility.
Tactile communication vs visual communication
It is challenging to shift from our ingrained reliance on visual communication. Tactile graphics design transcends traditional visual communication by offering an alternative pathway for information transfer. Unlike visual communication, which relies heavily on the visual perception of colors, shapes and spatial relationships, tactile graphics communicate these elements through touch. In our opinion, the shift from visual to tactile representation challenges designers to rethink the way information is structured. Visual information can often be processed quickly, with elements such as colors and large fonts capturing attention almost instantaneously (Healey and Enns, 2012; Ware, 2019). In contrast, tactile graphics require more time for exploration and interpretation as users must physically interact with the material to extract the encoded information. This interaction is sequential and linear, unlike the often instantaneous perception found in visual communication. Furthermore, the limitations in the resolution of tactile perception compared to that of the human eye mean that not all visual information can be directly translated into a tactile format. Therefore, the critical challenge for designers is not only to translate visual data into tactile formats but also to do so in a way that maintains the integrity and immediacy of the original information.
Customization vs standardization of tactile transformations
Upon examining the process of tactile transformations within the selected studies, it was observed that, while the reference to design guidelines is prevalent, there is considerable individual variation among the visually impaired population that is not adequately addressed. The majority of the studies, accounting for 79 percent, included a broad age spectrum of participants, for instance ranging from 16 to 77 years old (Engel and Weber (2019). This demographic diversity suggests that age could significantly influence the effectiveness of tactile transformations, yet this factor has not been the focal point of most research. Future investigations could profitably examine the interplay between customization and standardization, possibly by categorizing design fundamentals based on age groups to determine the impact of age on the tactile transformation process. Moreover, the challenge extends to cultural sensitivity (current studies are based on users from the same cultural background) – tactile graphics should be designed with an awareness of cultural diversity in interpretation and symbolism. While customization allows for the incorporation of cultural nuances, standardized designs risk reinforcing cultural biases when based on a narrow range of experiences. Going forward, as new technologies emerge and a deeper understanding of the needs of visually impaired users emerges, we need to find out how to balance the dynamics between customization and standardization in tactile conversion.
Technological and design innovation
The technological landscape of tactile graphics design is rapidly evolving, propelled by advancements in automated tactile graphics generation. While these innovations offer promising avenues for enhancing the production and accessibility of tactile graphics, they also introduce new challenges and complexities. Current technologies, as highlighted by Mukhiddinov and Kim (2021), have significantly streamlined the process of generating tactile graphics, making it faster and potentially more consistent. However, the automation of tactile graphics generation is not yet fully realized. The process still demands substantial human intervention, both in terms of manpower and expertise, to oversee the production, ensure quality and modify designs based on specific user needs. This requirement for intensive resource investment underscores a critical gap between the potential of automated technologies and their current application in real-world settings. As Paneels and Roberts (2009) suggest: ‘Researchers have started to think about the effective design issue but more work is required.’ The challenge for practitioners is to understand not only the fundamentals of tactile graphics design but also the latest technology if it is to be integrated with technology.
Evaluation and impact measurement
Our study found that measuring the impact and effectiveness of tactile graphics is crucial for validating design approaches and justifying the investment in new technologies. However, the criteria for what makes a tactile graphic successful are not universally agreed upon and often vary depending on the specific application – be it educational, navigational, or otherwise. Traditional metrics such as user satisfaction and ease of understanding are commonly used, but they do not always capture long-term learning outcomes or the degree to which a tactile graphic makes an educational concept accessible. Hence, there is a need for longitudinal studies that can assess the sustained impact of using tactile graphics on learning and independence in everyday life. Developing comprehensive evaluation frameworks that include both qualitative and quantitative measures would provide designers and researchers with better tools to assess and refine tactile graphics, ultimately leading to more effective and meaningful user experiences.
Accessibility and interactivity
In our research, we identified persistent barriers to achieving universal accessibility and effective usability of tactile graphics. Addressing these challenges requires a multidisciplinary approach that incorporates insights from ergonomics, psychology and educational theory to refine tactile graphic designs. Hence, future research could also discuss applications of tactile graphics design across multiple disciplines. It also underscores the importance of involving visually impaired users in the design process to ensure that the end products are not only accessible but also genuinely useful in real-world scenarios. This approach aligns with participatory design paradigms (Spinuzzi, 2005) that advocate for the active involvement of users in the design process, ensuring that the final products are both accessible and richly interactive. In practice, this approach requires not only a technical understanding of what makes a tactile graphic usable but also a deep comprehension of how such graphics are experienced by users with varying degrees of visual impairment. The challenge remains to systematically incorporate this feedback in a way that can be generalized across diverse user populations–influenced by factors such as age, onset of blindness and additional disabilities.
Limitations
This study offers comprehensive insights into the field of tactile graphics design, yet it is important to acknowledge several limitations that may impact the breadth and applicability of our findings. Firstly, the scope of our literature review is constrained by the time frame in which it was conducted. Given the dynamic nature of research and development in tactile graphics design, studies published subsequent to our review period could present new insights not encompassed in this analysis. Secondly, our focus on academic literature may have inadvertently neglected practical insights from industry practices and user experiences that exist outside of formal research settings. Thirdly, the review was conducted primarily in English, which may have limited our ability to access, read and interpret relevant studies published in other languages. This linguistic limitation could potentially result in the exclusion of significant findings and perspectives from non-English sources. Finally, despite our efforts to simplify and thoroughly cover the fundamentals of tactile graphics design, the inherent complexity of this field poses a challenge in addressing every possible scenario and consideration. These limitations underscore the necessity for continuous research and the ongoing refinement of practices in tactile graphics design, ensuring that the field remains attuned to the evolving needs and preferences of its diverse user base.
Conclusion
In this article, we conducted a scoping review of the current literature on tactile graphics design, adhering to the standardized PRISMA guidelines. This analysis made it evident that tactile graphics design is a key method for effectively transforming visual information into formats perceivable through touch. The main contributions of this study are (i) it delivers an exhaustive analysis of existing research in tactile graphics design, providing a comprehensive overview of the field; (ii) it enables a rapid comprehension of the design fundamentals of tactile graphics with or without a relevant research background; (iii) it plays a pivotal role in delineating the process of transforming information into tactile graphics; and (iv) it identifies existing gaps in the literature and develops clear directions for future research.
We aspire for this review to serve as a catalyst for the tactile graphics design community, spurring future endeavours and innovation. It is important to reconceptualize visual impairment not as a handicap but as a distinct way of perception that challenges traditional notions of visual information processing. Tactile graphics design embodies a profound humanistic approach, aiming to bridge differences and equalizing access to information through design. It transcends the conventional boundaries of visual communication by translating visual data into a form perceivable through touch. Consider how visual communication, typically reliant on the immediacy of sight, conveys ideas swiftly and powerfully through images and symbols. Tactile graphics, by contrast, offer a narrative of exploration, requiring the user to engage intimately with information. The real challenge of tactile graphics design, therefore, lies in conveying complex concepts and emotions in a way that is not only understood by the visually impaired, but also resonates with all people.
Footnotes
Appendix
| No | Article | Line | Shape | color | Texture | Form | Size | Label |
|---|---|---|---|---|---|---|---|---|
| 1 | Improve the accessibility of tactile charts | X | X | X | X | |||
| 2 | Constructive visualization to inform the design and exploration of tactile data representations | X | ||||||
| 3 | Perceiving sequences and layouts through touch | X | ||||||
| 4 | Evaluating the use of variable height in tactile graphics | X | X | |||||
| 5 | Tactile materials in practice: understanding the experiences of teachers of the visually impaired | X | X | |||||
| 6 | A user study to evaluate tactile charts with blind and visually impaired people | X | X | X | ||||
| 7 | Constituent elements affecting the recognition of tactile graphics | X | X | X | ||||
| 8 | The design of tactile thematic symbols | X | X | X | ||||
| 9 | Analysis of tactile chart design | X | X | X | X | |||
| 10 | An evaluation of tactile symbols in public environment for the visually impaired | X | ||||||
| 11 | Tactile mapping in Kurdistan regions, Iraq: Understanding the rules of developing on tactile cartography design |
X | ||||||
| 12 | Perspectives about implementation of color codes on maps accessible to blind people | X | X | X | ||||
| 13 | Tactile line drawings for improved shape understanding in blind and visually impaired users | X | X | X | X | |||
| 14 | Legibility for users with visual disabilities | X | X | X | ||||
| 15 | Expert study: design and use of textures for tactile indoor maps with varying elevation levels | X | X | |||||
| 16 | A bibliometric study of graphic variables used on tactile maps | X | X | |||||
| 17 | User study: a detailed view on the effectiveness and design of tactile charts | X | X | X | X | |||
| 18 | Tactile elevation perception in blind and sighted participants and its implications for tactile map creation | X | X | X | X | |||
| 19 | An empirical approach on the design of tactile maps and diagrams: the cognitive tactualization approach | X | X | X | ||||
| 20 | Tactile graphics in school education: perspectives from pupils | X | X | X | X | X | ||
| 21 | Tactile Graphics in School Education: Perspectives from Teachers | X | X | X | X | X | ||
| 22 | Lessons learned building low-cost DIY tactile graphics and conducting a tactile drawing club in Colombia During COVID-19 | X | ||||||
| 23 | Creating tactile images – decision making process | X | ||||||
| 24 | Identification of textured tactile pictures in visually impaired and blindfolded sighted children | X | X |
Data Availability Statement
The data that support the findings of this study are available from the corresponding author upon reasonable request.
Declaration of Conflicting Interests
The authors declared no potential conflicts of interest with respect to the research, authorship and publication of this article.
Biographical Notes
ANQI RONG is currently working toward obtaining a PhD degree at University of Sydney, Australia, School of Architecture, Design and Planning. Anqi received her BA degree from Renmin University of China and graduated from Pratt Institute (US) with an MFA degree. Her main research interests include inclusive design, interdisciplinary, data analysis and digital innovation. She also has a research interest in critical pedagogy, new materialism and socio-material learning. Address: School of Architecture, Design and Planning, University of Sydney, Sydney, NSW 2006, Australia. [ email:
NINA HANSOPAHELUWAKAN-EDWARD is an Associate Professor in Design at the University of Sydney, Australia, Australia, School of Architecture, Design and Planning. She is currently an External Examiner for BA(Hons) Digital Media at Coventry University (UK) in the UK, Egypt, Singapore and Malaysia. For the past 18 years, she has worked at universities in the UK, Australia and Indonesia. Throughout her academic experience, she has held various leadership roles including Postgraduate Taught Director, Programme Leader, Global Collaboration Coordinator, International Short Course Program Director, Study Abroad Coordinator and Faculty Graduate Exhibition Coordinator. Her research focuses on digital interactive design, semiotics, human-centred, and interdisciplinary. Address: as Anqi Rong. [ email:
DIAN LI is a Lecturer at University of Leeds, UK. She has a background in graphics, interactive and information design. Her research interests lie in data-informed design, especially in data-informed typography and cross-culture designs. She explores how quantitative data can influence design methods and processes in disciplines that typically rely on intuition. Address: University of Leeds, Woodhouse Lane, Leeds LS2 9JT, UK. [ email: