
Abstract
Introduction:
The renin–angiotensin system and epithelial–mesenchymal transition play crucial roles in the development of kidney fibrosis. The connection between the renin–angiotensin system and transforming growth factor-β in epithelial–mesenchymal transition remains largely unknown.
Materials and methods:
We assessed oxidative stress, cytokine levels, renal morphology, profibrotic growth factor and renin–angiotensin system component expression, and cell-specific E- and N-cadherin expression in the kidneys of gerbils with streptozotocin-induced diabetes mellitus.
Results:
Animals in the experimental group received an intraperitoneal injection of streptozotocin to induce diabetes. The diabetic gerbil kidneys presented kidney injury, which was manifested as distorted glomeruli, necrosis of tubular cells, dilated tubular lumen, and brush border loss. Additionally, the diabetic gerbil kidneys exhibited significantly higher expressions of 8-hydroxy-2′-deoxyguanosine, nuclear factor-kB, toll-like receptor 4, tumor necrosis factor-α, transforming growth factor-β, connective tissue growth factor, α-smooth muscle actin, and N-cadherin and higher collagen deposition than did the control gerbil kidneys. Compared with the control kidneys, the diabetic gerbil kidneys exhibited significantly lower E-cadherin expression. These epithelial–mesenchymal transition characteristics were associated with an increase in renin–angiotensin system expression in the diabetic gerbils.
Conclusions:
We demonstrate that hyperglycemia activated the renin–angiotensin system, induced epithelial–mesenchymal transition, and contributed to kidney fibrosis in an experimental diabetes mellitus model.
Keywords
Introduction
Diabetes mellitus (DM) is characterized by hyperglycemia and caused by insulin deficiency or decreased insulin sensitivity. The prevalence of DM in adults aged 20–79 years was 8.8% in 2015, and it is estimated to increase to 10.4% by 2040. 1 DM and its complications severely affect the finances of individuals and their families as well nations’ economies. The complications of DM include retinopathies, neuropathies, nephropathies, and cardiovascular diseases.2,3 Diabetic nephropathy is one of the most common long-term complications occurring in patients with DM. 4
Renal fibrosis is a common feature of diabetic nephropathy. 5 A major histological characteristic of diabetic nephropathy is the abnormal accumulation of extracellular matrix in the glomeruli and tubular interstitium.6,7 Epithelial–mesenchymal transition (EMT) is the conversion of epithelial cells into mesenchymal cells. During the EMT process, epithelial cells lose polarity and adhesion and gain migratory capacity, thus becoming mesenchymal cells. 8 A distinguishing characteristic of EMT is the downregulation of E-cadherin to reinforce the destabilization of adherens junctions. 9
Angiotensin II (Ang II) is synthesized within the kidney and is a mediator of progressive injury in diabetic nephropathy. Although evidence suggests activation of the intrarenal renin–angiotensin system (RAS) in diabetes, 10 the effect of hyperglycemia on intrarenal RAS component expression remains controversial.11,12 Day et al. reported that hyperglycemia increased the synthesis of intrarenal angiotensin I (Ang I) and Ang II and both Ang II type 1 receptor (AT1R) and Ang II type 2 receptor (AT2R) in diabetic murine kidneys. 11 Xue et al. found that hyperglycemia increased the angiotensinogen mRNA level and reduced both the angiotensin-converting enzyme (ACE) and AT1R mRNA levels in the kidneys of diabetic rats. 12 Hyperglycemia induced EMT in podocytes and renal tubular epithelial cells and led to renal fibrosis and dysfunction in experimental animals with diabetic nephropathy and patients with DM. 13 However, the connection between the RAS and transforming growth factor (TGF)-β in EMT remains largely unknown. We hypothesized that hyperglycemia activates the RAS and induces EMT and renal fibrosis in an animal model of DM. In the present study, we assessed oxidative stress, cytokine levels, renal morphology, profibrotic growth factor and RAS component expressions, and cell-specific E- and N-cadherin expressions in the kidneys of gerbils with streptozotocin (STZ)-induced DM.
Materials and methods
Animals
This study was approved by the Animal Care and Use Committee of Taipei Medical University (LAC-2017-098). Adult male Mongolian gerbils (Meriones unguiculatus), weighing 50–60 g, were obtained from the Research Animal Center, National Taiwan University. Animals were maintained under a 12-hour light–dark cycle with free access to food and water.
Measurement of blood glucose levels
Before starting the experiments, we measured the blood glucose level of each gerbil by using the OneTouch II blood glucose meter (Lifescan, Milpitas, California, USA). After six hours away from chow, the fasting blood glucose level was obtained from the tail vein of each animal. The blood glucose levels of the gerbils ranged from 55–86 mg/dl.
Induction of DM by streptozotocin
Immediately prior to the injection, STZ (Sigma) was dissolved in 0.01 M citrate buffer (pH 4.5). Animals in the experimental group received an intraperitoneal injection of STZ at a dose of 75 mg/kg/day for three days to induce DM. The control group received an equivalent volume of saline. For the three days following the treatment, the blood glucose levels of all animals were measured daily from the blood sample obtained from the tail vein. Blood glucose levels ranging from 240–435 mg/dl in STZ-treated gerbils indicated that they were diabetic; thus, they were used for further experiments. Prior to sacrifice, the weights and blood glucose levels of the gerbils were measured to confirm the persistence of DM.
Tissue preparation
A total of 10 STZ-treated and 10 control gerbils survived for 12 weeks after the injections. Animals from each group were deeply anesthetized intramuscularly with a combination of zoletil (4 mg/100 g), xylazine (2 mg/100 g), and atropine (0.16 mg/100 g) and sacrificed by perfusion through the left ventricle with 4% paraformaldehyde in 0.1 M phosphate buffer (pH 7.4). The kidneys were excised and fixed in the same solution at 4°C for 24 h. The tissues were then dehydrated in alcohol, cleared in xylene, and embedded in paraffin. Five-micrometer sections were cut for further processing.
Histological examination
After deparaffinization and rehydration, the kidney sections were stained with hematoxylin and eosin, periodic acid-Schiff (PAS), and Masson’s trichrome; examined using light microscopy; and assessed for kidney morphology and fibrosis. The histological analysis of kidney tubular injury was modified according to suggestions provided by Kurus et al.; 14 tubular injury was defined as tubular dilation, tubular atrophy, vacuolization, the degeneration and sloughing of tubular epithelial cells, or the thickening of the tubular basement membrane. The scoring system for tubular injury was as follows: 0=no tubular injury, 1⩽10% of tubules injured, 2=10–25% of tubules injured, 3=26–50% of tubules injured, 4=51–75% of tubules injured, and 5⩾75% of tubules injured. The histological analyses of the proportion of the kidney occupied by the cortex, proportion of the cortex occupied by glomeruli, and size of an individual glomerulus were modified according to suggestions provided by Toledo-Rodriguez et al. 15 The sizes of individual glomeruli located in the middle cortex and juxtamedullary zone were calculated as the average of the largest and smallest glomerular diameters within a field of view; the calculations involved 10±5 glomeruli per kidney. To evaluate the degree of glomerular damage, PAS-stained sections were detected and examined using a semiquantitative scoring system, which was modified from that used in the study of Raij et al. 16 Twenty glomeruli in each kidney were examined, and the severity of lesions was graded from 0–4+ according to the percentage of glomerular involvement, where 0 indicated no glomerular damage (normal) and 1+, 2+, 3+, and 4+ indicated that 25%, 50%, 75%, and 100% of glomeruli were damaged, respectively; in other words, an increase in the mesangial matrix material or glomerulosclerosis was present. A glomerular injury score was then obtained by multiplying the degree of damage (0–4+) by the percentage of glomeruli with the same degree of injury. For example, if five of 20 glomeruli had a lesion of 1+, three of 20 glomeruli had a lesion of 2+, and five of 20 glomeruli had a lesion of 3+, the final injury score for the specimen would be
Kidney sections stained with Masson’s trichrome were assessed using a scoring system (scores ranged from 0–3) 17 for the presence of collagen in 10 systematically sampled areas per section, where 0=no change, 1=mild fibrosis, 2=moderate fibrosis, and 3=severe fibrosis with severe interstitial thickening between tubules. The optical density values of Masson’s trichrome–stained renal sections were determined to evaluate the presence of collagen in 13 nonoverlapping microscopic fields per animal, which were processed using Image Pro Plus 6.0 (Media Cybernetics; Bethesda, Maryland, USA). 18 Histological examinations, including general morphological observations and morphometric analysis, were performed in a single-blind manner by a pathologist.
Immunohistochemistry
After routine deparaffinization, heat-induced epitope retrieval was performed by immersing slides in 0.01 M sodium citrate buffer (pH 6.0). To block endogenous peroxidase activity and nonspecific antibody binding, sections were first preincubated in 0.1 M phosphate-buffered saline (PBS) containing 10% normal goat serum and 0.3% H2O2 for one hour at room temperature before being incubated with rabbit polyclonal anti-TGF-β, anti-nuclear factor-κB (NF-κB; 1:100; Abcam, Cambridge, Massachusetts, USA), anti-connective tissue growth factor (CTGF; 1:100; Proteintech, Rosemont, Illinois, USA), anti-Ang II (1:50; GeneTex Inc., Irvine, California, USA), anti-tumor necrosis factor-α (TNF-α; 1:100; GeneTex Inc.), anti-E-cadherin (H-108; 1:50; Santa Cruz Biotechnology, Santa Cruz, California, USA), anti-AT1R (N-10; 1:50; Santa Cruz Biotechnology), goat polyclonal anti-N-cadherin (1:50; Santa Cruz Biotechnology), mouse monoclonal anti-α-smooth muscle actin (α-SMA; 1:50; Abcam), anti-8-hydroxy-2′-deoxyguanosine (8-OHdG; 1:100; Abcam), anti-angiotensin (1–7) (Ang-(1–7)) (1:50; Biomatik, Wilmington, Delaware, USA), toll-like receptor 4 (TLR4; 1:50; Santa Cruz Biotechnology), ACE (2E2; 1:50; Santa Cruz Biotechnology), and ACE2 (E-11; 1:50; Santa Cruz Biotechnology) antibodies as primary antibodies for 20 h at 4°C. The sections were then treated for one hour at 37°C with biotinylated goat anti-rabbit immunoglobulin G (IgG; 1:200, Vector Laboratories, Burlingame, California, USA) for TGF-β, NF-κB, CTGF, TNF-α, Ang II, and AT1R antibodies and with biotinylated rabbit anti-mouse IgG (1:200; Jackson ImmunoResearch Laboratories, West Grove, Pennsylvania, USA) for α-SMA, 8-OHdG, Ang-(1–7), ACE (2E2), and ACE2 (E-11) antibodies. The fluorochrome-conjugated secondary antibodies used were anti-mouse IgG (whole molecule)-fluorescein isothiocyanate (FITC) for the anti-TLR4 antibody (1:200; Sigma), FITC-AffiniPure goat anti-rabbit IgG (H+L) for the anti-E-cadherin antibody, rhodamine-conjugated donkey anti-goat IgG for the anti-N-cadherin antibody (1:200; GeneTex Inc.), and rhodamine-conjugated goat anti-rabbit IgG for the anti-NF-κB antibody (1:200; Jackson ImmunoResearch Laboratories). Nuclei were detected using 4′,6-diamidino-2-phenylindole (DAPI, 1:1000; Sigma). The sections were reacted with fluorochrome-conjugated secondary antibodies and then washed with PBS, mounted, and examined under a fluorescence microscope. The sections were treated with biotinylated IgG followed by a reaction with reagents from an avidin–biotin complex kit (Vector Laboratories), and the reaction products were brown and visualized using a diaminobenzidine substrate kit (Vector Laboratories) according to manufacturer’s recommendations. All immunostained sections were viewed and photographed using a Nikon Eclipse E600.
Statistical analysis
The data are presented as the mean±standard deviation (SD). The significance between two groups was determined using Student’s t test. Differences were considered significant at p<0.05.
Results
Body weight and blood glucose levels
Ten STZ-treated and 10 control gerbils survived for 12 weeks after the injections. Before the start of the experiments, the mean body weight and blood glucose level were respectively 58.3±3.5 g and 72.9±13.1 mg/dl in control animals and 56.6±2.7 g and 70.7±15.6 mg/dl in DM animals. The values were comparable between control and DM animals. Within two days after STZ injection, the blood glucose levels of animals with induced DM had increased to 306–333 mg/dl. At sacrifice, the mean body weight and blood glucose level were respectively 75.2±4.1 g and 76.1±9.6 mg/dl in control animals and 60.3±3.8 g and 319.5±13.8 mg/dl in DM animals. The body weight and blood glucose levels at sacrifice were significantly lower and higher, respectively, in DM animals than in control animals.
Kidney morphology
Figure 1(a) shows representative hematoxylin and eosin–stained kidney sections obtained from the control and STZ-treated diabetic gerbils. The diabetic kidneys exhibited atrophic tubular cells, dilated tubular lumen, brush border loss, and tubular necrosis, as demonstrated by the acidophilic and swollen nucleus and cytoplasm. The swollen nucleus disintegrated into small pieces, tubule integrity was destroyed, and epithelial cells degenerated and desquamated into the lumen of renal tubules. The renal corpuscle showed expanded renal glomeruli, proliferated mesangial cells, bulged podocyte nuclei, accumulated extracellular matrix in the mesangium, and a thickened glomerular basement membrane. The intertubular space was increased and filled with connective tissue; the connective tissue replaced the space left from degenerated tubules and renal corpuscles. The STZ-treated gerbils exhibited a significantly larger proportion of the cortex (Figure 1(b)), a smaller proportion of the cortex occupied by glomeruli (Figure 1(c)), larger glomerular size (Figure 1(d)), and higher tubular injury scores (Figure 1(e)) than did the control gerbils.

(a) Representative hematoxylin and eosin staining, (b) the proportion of the kidney occupied by the cortex, (c) the proportion of the cortex occupied by glomeruli, (d) the glomerular size, and (e) tubular injury score in control gerbils (control) and gerbils with streptozotocin-induced diabetes mellitus (DM). Diabetic kidneys exhibited tubular atrophy, dilatation of the tubular lumen, brush border loss, and increased space (asterisks) between renal tubules. Acidophilic and swollen tubular cells and enlarged podocytes (arrows) were observed in the DM group. Streptozocin-treated gerbils exhibited significantly a larger proportion of the cortex, a smaller proportion of the cortex occupied by glomeruli, larger glomerular size, and higher tubular injury scores than did control gerbils (*p<0.001). Data are expressed as mean±standard deviation (SD).
Hyperglycemia induces oxidative stress and inflammation
The immunohistochemistry results for 8-OHdG, TLR4, NF-κB, and TNF-α are presented in Figure 2. The oxidative stress marker 8-OHdG was apparently observed at the nuclei of podocytes and tubular cells in the kidneys of the diabetic gerbils, and a few 8-OHdG-positive nuclei were found in the control gerbils. The immunofluorescence of TLR4 and NF-κB was colocalized in the cytoplasm of podocytes and tubular cells, and nuclei with positive NF-κB immunostaining were observed in the podocytes and tubular cells of the diabetic gerbils. No discrete immunoreactivity of TLR4 and NF-κB was observed in the control group. The expression of TNF-α protein was detected in the nuclei and cytoplasm of podocytes and tubular cells, and immunoreactivity was more intense and extensive in the kidneys of the diabetic gerbils than in those of the control gerbils.

Immunohistochemistry of anti-8-hydroxy-2′-deoxyguanosine (8-OHdG), toll-like receptor 4 (TLR4), anti-nuclear factor-κB (NF-κB), image merged of TLR4 and NF-κB, and anti-tumor necrosis factor-α (TNF-α) in the kidney sections of control and diabetes mellitus (DM) gerbils. To compare DM gerbils with control gerbils, a DM gerbil was expected to express these proteins. The 8-OHdG immunoreactivity was detected in the nuclei of podocytes and tubular cells (black arrows). Immunofluorescence reactivity of TLR4 and NF-κB was identified in the cytoplasm of podocytes and tubular cells (white arrows). NF-κB expression was observed in the nuclei of podocytes and tubular cells (white arrowheads), which were purple after treatment with DAPI (for the nucleus in blue). The immunofluorescence of TLR4 and NF-κB was colocalized in the cytoplasm of podocytes and tubular cells and demonstrated a color change from yellow to orange. The immunoreactivity of TNF-α (black arrows) was detected in the nuclei and cytoplasm of podocytes and tubular cells.
Hyperglycemia activates the RAS
Figure 3 shows the protein expression patterns of the RAS. All RAS components were observed in the endothelial cells of the kidneys. The immunoreactivity of Ang II, AT1R, and ACE was detected in podocytes and proximal and distal tubules cells, and the immunoreactivity of Ang II, AT1R, and ACE was markedly displayed in the diabetic gerbils. The control gerbils exhibited prominent Ang-(1–7) and ACE2 immunoreactivity compared with the diabetic gerbils. In addition to detection in endothelial cells, Ang-(1–7) was observed in distal tubule cells and ACE2 was observed in the top of tubular cells (coincident with the brush border) in the control gerbils.

Representative photomicrographs of renin–angiotensin system (RAS) protein expression. The immunoreactivity of angiotensin II (Ang II) and Ang II type 1 receptor (AT1R) is extensively displayed in endothelial cells (white arrows), tubular cells (black arrows), and podocytes (black arrowheads) in diabetic gerbils (diabetes mellitus (DM)). Angiotensin (1–7) (Ang-(1–7))-positive staining cells were discovered in the endothelial cells (white arrows) of control and diabetic gerbils. The immunoreactivity of Ang-(1–7) was observed in the cells of distal tubules (black arrows) of control gerbils. Angiotensin-converting enzyme (ACE) expression was observed in endothelial cells (white arrows) and tubular cells (black arrows); the immunoreactivity was stronger in the diabetic gerbils than in the control gerbils. The control gerbils exhibited prominent ACE2 immunoreactivity, which was exhibited in endothelial cells and in the top of tubular cells (coincident with the brush border) (white arrows) compared with the diabetic gerbils.
Hyperglycemia increases TGF-β and CTGF expression
The immunoreactivity of TGF-β and CTGF was detected in the cytoplasm and nuclei of renal tubule cells, podocytes, and mesangial cells of glomeruli (Figure 4). The STZ-treated hyperglycemic gerbils exhibited higher numbers of TGF-β- and CTGF-positive cells than did the control gerbils.

Immunohistochemistry of transforming growth factor-β (TGF-β) and anti-connective tissue growth factor (CTGF) in the kidney sections of control and diabetes mellitus (DM) gerbils. The immunoreactivity of TGF-β and CTGF was detected in the cytoplasm and nuclei of renal tubule cells, podocytes, and mesangial cells of glomeruli (black arrows). The streptozocin-treated diabetic gerbils exhibited higher numbers of TGF-β- and CTGF-positive cells than did the nondiabetic gerbils.
Hyperglycemia induces an E-cadherin and N-cadherin switch
The immunofluorescence of E-cadherin and N-cadherin was detected in renal tubule cells (Figure 5). We observed E-cadherin-positive cells, but not N-cadherin-positive cells, in the renal tubules of the control gerbils. By contrast, decreased E-cadherin and increased N-cadherin expressions were prominently detected in the tubular cells of the diabetic gerbils.
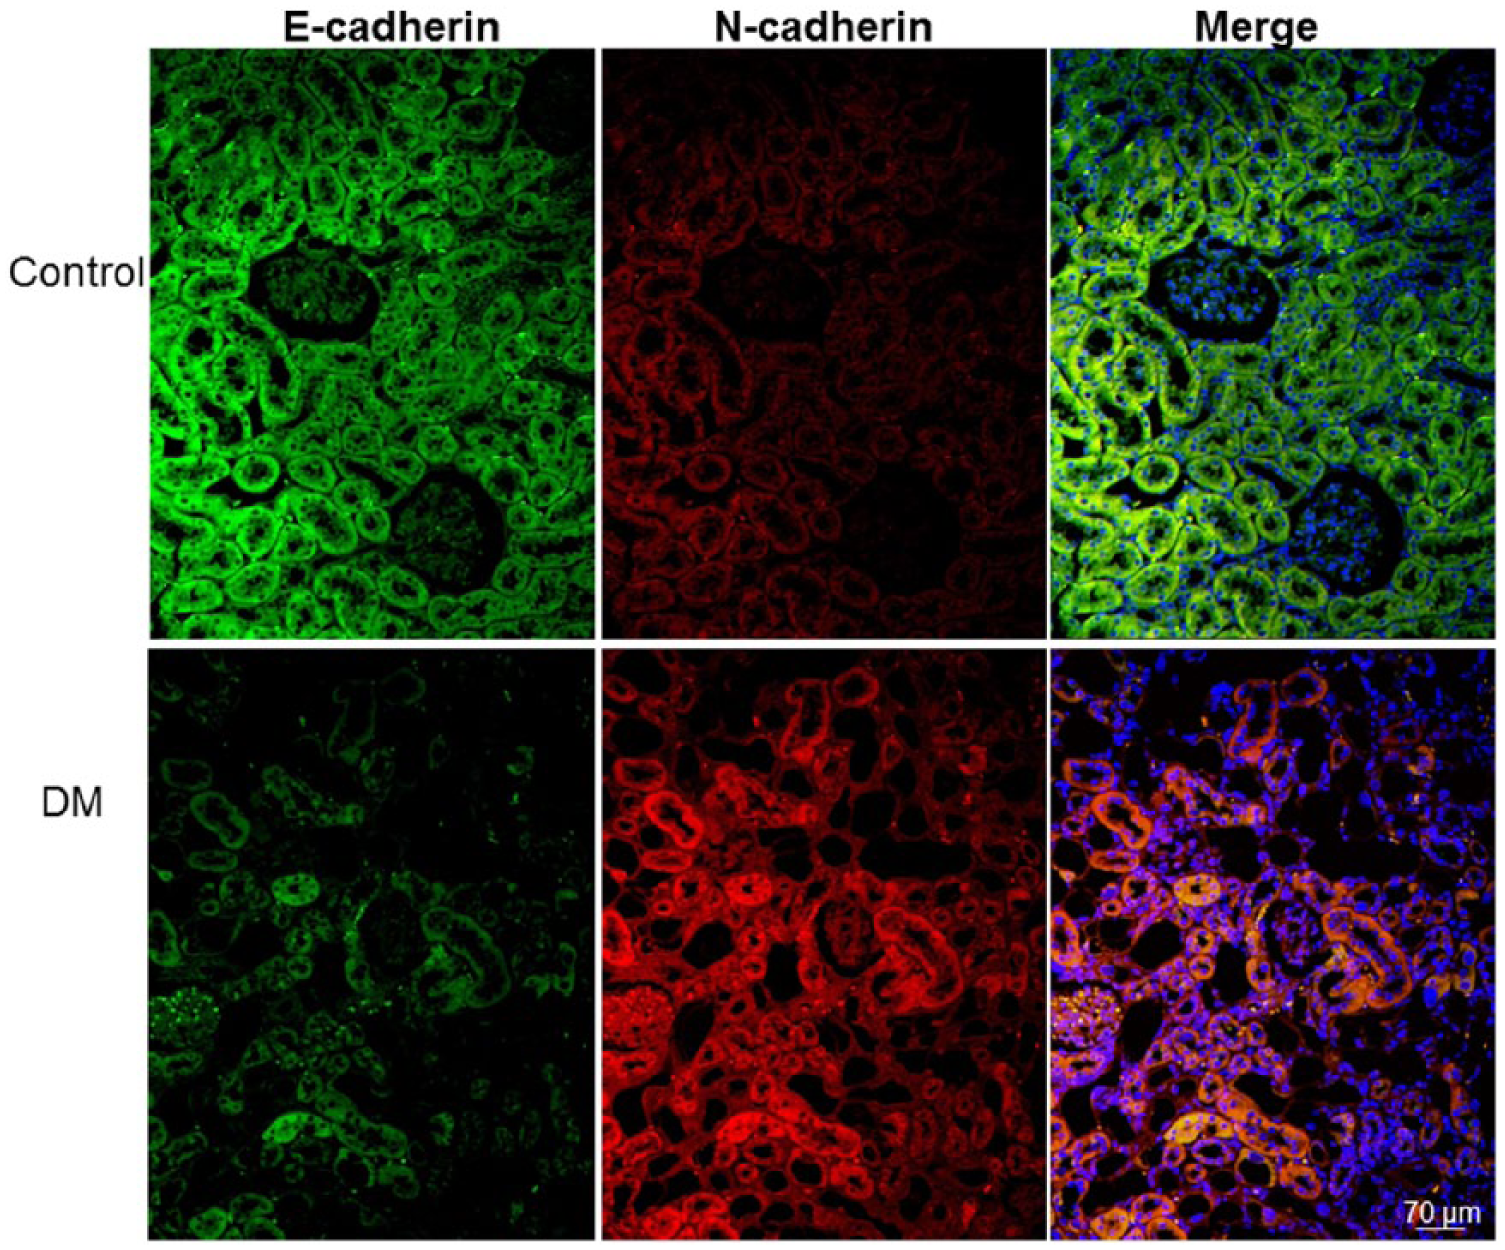
Immunofluorescence staining for E-cadherin (green), N-cadherin (red), and 4′,6-diamidino-2-phenylindole (DAPI) (blue). The immunofluorescence of E-cadherin and N-cadherin was detected in renal tubule cells. The renal tubules of the control gerbils (control) exhibited abundant E-cadherin and few N-cadherin immunopositive cells. By contrast, the immunofluorescence of N-cadherin was more widely distributed and few E-cadherin immunofluorescent cells were found in the diabetic gerbils. The colocalized E-cadherin and N-cadherin is indicated as yellow to orange in the merged image.
Hyperglycemia induces kidney fibrosis
Masson’s trichrome staining revealed that collagen fibers were mainly deposited in the glomerular mesangium and extracellular tissue of renal tubules in the diabetic gerbils (Figure 6(a)). The hyperglycemic gerbils exhibited a significantly higher grade of interstitial fibrosis and a higher optical density of collagen than did the control gerbils (Figure 6(b) and (c)).

(a) Representative photomicrographs of Masson’s trichrome staining; (b) grade of interstitial fibrosis; and (c) optical density of collagen in the control gerbils (control) and gerbils with streptozotocin-induced diabetes mellitus (DM). Collagen fibers were mainly deposited in the glomerular mesangium and extracellular tissue of renal tubules in the diabetic gerbils. The streptozocin-treated diabetic gerbils exhibited a significantly higher grade of interstitial fibrosis and a higher optical density of collagen than did the control gerbils (*p<0.001). Data are expressed as mean±standard deviation (SD).
Hyperglycemia increases α-SMA expression and extracellular matrix production
The expression of α-SMA protein was detected in the podocytes and tubular cells of the diabetic gerbils but was nonsignificant in the control gerbils (Figure 7(a)). The diabetic gerbils showed larger PAS-positive areas than did the control gerbils. The diabetic gerbils also exhibited expanded mesangium between the capillaries of the glomeruli, thickened Bowman’s capsules, and degenerated tubules, as evidenced by loss of nuclei and cell boundaries. PAS staining was used to assess the degree of glomerular sclerosis and damage; the glomerular damage score was significantly higher in the diabetic gerbils than in the control gerbils (Figure 7(b)).

(a) Representative photomicrographs of immunohistochemistry of anti-α-smooth muscle actin (α-SMA) and the periodic acid-Schiff (PAS) staining and (b) semiquantitative scoring of the glomerular damage in the control gerbils (control) and gerbils with streptozotocin-induced diabetes mellitus (DM). The diabetic kidneys exhibited α-SMA immunoreactivity in podocytes and tubular cells (arrow). PAS photomicrographs indicate the thickened basal membrane of glomerular capillaries, diffused hyalinosis (asterisk), degenerated glomeruli, and thickened Bowman`s capsule (arrow). The streptozocin-treated diabetic gerbils exhibited significantly higher glomerular damage than did the control gerbils (*p<0.001). Data are expressed as mean±standard deviation (SD).
Discussion
Hyperglycemia induces EMT in podocytes and renal tubular epithelial cells and leads to renal fibrosis in diabetic nephropathy. 13 The effect of hyperglycemia on intrarenal RAS component expression remains controversial.11,12 In the experimental gerbil model of DM, we found that hyperglycemia resulted in distortion and disruption of kidney morphology, increased oxidative stress and inflammatory markers, and increased profibrotic growth factor and RAS component expression. Activation of the RAS was associated with the characteristics of EMT (decreased E-cadherin expression and increased N-cadherin expression) and kidney fibrosis in the diabetic gerbils. These results suggest that hyperglycemia induces oxidative stress, activates the RAS, induces EMT, and contributes to kidney fibrosis in an experimental DM model.
Oxidative stress is a well-known pathogenic mechanism of hyperglycemia, which triggers diabetic complications. The development of diabetes-related complications occurs with the production of oxygen species (ROS). 19 In this study, we detected 8-OHdG in the nuclei of podocytes and tubular cells in the diabetic gerbils. Intrarenal oxidative stress plays a critical role in the initiation and progression of diabetic nephropathy. Excessive ROS production triggers renal fibrosis and inflammation.20–27 Hyperglycemia induced ROS formation and activated NF-κB, thus resulting in increased inflammatory cytokine concentrations in the kidneys of diabetic rats. 25 Hyperglycemia-induced increase in ROS formation also activated the TLR4 signaling pathway in the cardiomyopathy of rats with STZ-induced DM. 28 Our findings are consistent with those of other studies.
The glomerular basement membrane is a specialized extracellular matrix and is the joint product of the glomerular endothelium and the podocytes. The intact glomerular basement membrane structure is particularly crucial for renal function; otherwise, it can cause filtration defects and renal diseases of varying severties. 29 The thickening of the glomerular basement membrane and expansion of mesangium are the characters of glomerulopathy found in human type 1 diabetic nephropathy, which leads to progressive reduction in the filtration surface of the glomerulus. 30 Glomerular basement membrane composed of collagen, glycoproteins, glycosaminoglycans, and proteoglycans. The PAS and Masson’s trichrome staining is most commonly used to demonstrate the thickness of glomerular basement membrane and extracellular matrix deposition when renal disease is evaluated, respectively. In this study, PAS and Masson’s trichrome staining revealed that there was prominent glomerular hypertrophy and mesangial matrix expansion in STZ-treated diabetic animals.
In this study, we observed that STZ-treated hyperglycemic gerbils had increased α-SMA expression and collagen deposition. Furthermore, these findings were associated with an increase in N-cadherin expression and decrease in E-cadherin expression, which are the typical characteristics of EMT. 9 These results suggest that EMT plays a crucial role in the development of kidney fibrosis in DM. Myofibroblasts are the predominant source of type I collagen, have a phenotype intermediate between fibroblasts and smooth muscle cells, and are defined by the presence of α-SMA. 31 α-SMA is a useful cytoskeletal biomarker of EMT, which has been detected in the fibrotic process of various organs undergoing EMT.32–34 TGF-β is an inducer of EMT and initiates EMT by regulating transcriptional, posttranscriptional, translational, and posttranslational levels. 35 Increased TGF-β expression has been linked to EMT in renal fibrosis. 36
The RAS is involved in the pathogenesis of chronic kidney disease. 37 Activation of the RAS can activate TGF-β, which is a crucial fibrogenic cytokine in the development of kidney fibrosis. 38 Ang II is the main effector molecule of the RAS and is produced from angiotensinogen by the action of renin and ACE. AT1R is responsible for most of the pathophysiological effects of Ang II by promoting proliferation, inflammation, and fibrosis. 39 Although commercially available AT1R antibodies have been suggested to be nonspecific for AT1R, 40 there are mRNA and functional data suggesting basolateral and apical membrane distribution of the AT1R in the rat and mice collecting duct.41,42 Ang II activates renal interstitial fibroblasts through the upregulation of α-SMA expression and enhances cell proliferation and migration, which play a crucial role in the activation of interstitial fibroblasts and the induction of renal fibrosis.43,44 The ACE homolog ACE2 efficiently hydrolyses Ang II to form Ang-(1–7), a peptide that exerts actions opposite to those of Ang II. 45 Miller suggested that hyperglycemia affects renal function in diabetic humans by increasing RAS activity. 10 In this study, we observed increased expression of ACE, Ang II, and AT1R in the diabetic gerbils. Ang-(1–7) was more prominently observed in the control gerbils than in the diabetic gerbils. The control gerbils exhibited prominent ACE2 compared with the diabetic gerbils. These results are compatible with those reported by Day et al.; 11 they found that hyperglycemia increased the synthesis of intrarenal Ang I and Ang II and both AT1R and AT2R in diabetic murine kidneys.
In conclusion, the results of this study indicated that hyperglycemia injured the kidney; increased oxidative stress, inflammatory markers, and profibrotic growth factors; and led to kidney fibrosis in an experimental gerbil model of DM. Renal fibrosis is associated with increased RAS component expression and typical EMT characteristics in diabetic gerbils. These results suggest that hyperglycemia induces oxidative stress, activates the RAS, induces EMT, and contributes to kidney fibrosis in an experimental DM model and that strict glycemic control can be useful in preventing hyperglycemia-induced diabetic nephropathy.
Footnotes
Declaration of conflicting interests
The author(s) declared no potential conflicts of interest with respect to the research, authorship, and/or publication of this article.
Funding
The author(s) disclosed receipt of the following financial support for the research, authorship, and/or publication of this article: This work was supported by a grant from Taipei Medical University Hospital (106TMU-TMUH-12).