
Abstract
Introduction:
Previous studies have linked angiotensin-converting enzyme (ACE) insertion (I)/deletion (D) polymorphism (II, ID and DD) to physical performance. Moreover, ACE has two catalytic domains: NH2 (N) and COOH (C) with distinct functions, and their activity has been found to be modulated by ACE polymorphism. The aim of the present study is to investigate the effects of the interaction between aerobic exercise training (AET) and ACE I/D polymorphism on ACE N- and C-domain activities and vascular reactivity in humans.
Materials and methods:
A total of 315 pre-selected healthy males were genotyped for II, ID and DD genotypes. Fifty completed the full AET (II, n = 12; ID, n = 25; and DD, n = 13), performed in three 90-minute sessions weekly, in the four-month exercise protocol. Pre- and post-training resting heart rate (HR), peak O2 consumption (VO2 peak), mean blood pressure (MBP), forearm vascular conduction (FVC), total circulating ACE and C- and N-domain activities were assessed. One-way ANOVA and two-way repeated-measures ANOVA were used.
Results:
In pre-training, all variables were similar among the three genotypes. In post-training, a similar increase in FVC (35%) was observed in the three genotypes. AET increased VO2 peak similarly in II, ID and DD (49±2 vs. 57±1; 48±1 vs. 56±3; and 48±5 vs. 58±2 ml/kg/min, respectively). Moreover, there were no changes in HR and MBP. The DD genotype was also associated with greater ACE and C-domain activities at pre- and post-training when compared to II. AET decreased similarly the total ACE and C-domain activities in all genotypes, while increasing the N-domain activity in the II and DD genotypes. However, interestingly, the measurements of N-domain activity after training indicate a greater activity than the other genotypes. These results suggest that the vasodilation in response to AET may be associated with the decrease in total ACE and C-domain activities, regardless of genotype, and that the increase in N-domain activity is dependent on the DD genotype.
Conclusions:
AET differentially affects the ACE C- and N-domain activities, and the N-domain activity is dependent on ACE polymorphism.
Introduction
Angiotensin I-converting enzyme (ACE) is a zinc metallopeptidase that plays a central role in the control of blood pressure (BP) and fluid homeostasis. ACE is part of the endocrine renin-angiotensin system (RAS), and cleaves angiotensin I (Ang I) while yielding angiotensin II (Ang II), an octapeptide responsible for most of the effects of the RAS. 1
Circulating plasmatic ACE has two active domains, the COOH (C) and the NH2 (N) terminal domains, according to their position. These domains share 60% sequence identity, except for 37 amino acid residues at the C terminus. 2 In spite of the high degree of homology, each domain possesses a functional active site that differs in relation to substrate and inhibitor specificities. 3 For example, Ang I, substance P, luteinizing hormone-releasing hormone and bradykinin are cleaved by both domains,4–7 but only the N domain cleaves the tetrapeptide N-acetyl-seryl-aspartyl-lysyl-proline (Ac-SDKP), 8 a negative regulator of hematopoiesis.
ACE activity varies widely among individuals and genetic factors have been suggested to account for this variability.9,10 It has been shown that the absence (deletion, D) rather than the presence (insertion, I) of a 287-base pair (bp) Alu repeat sequence within intron 16 of the ACE gene is associated with greater levels and activity of this enzyme. Recently, it has also been demonstrated that ACE I/D polymorphism affects ACE domains’ activities, and in II individuals ACE C- and N-domain activities were significantly lower when compared both to ID and DD. 11 These findings suggest that ACE I/D polymorphism affects total ACE as well as ACE N- and C-domain activities.
This genetic variant was also associated with athletic performance, with the I allele being associated with endurance-related events and the D allele with strength-related sports.9,10,12–15 However, no studies to date have investigated the effects of a long-term aerobic training protocol in circulating ACE N- and C-domain activities. If a genetic variant related to lower ACE activity is associated with athletic performance, it is possible that aerobic exercise training (AET) may affect/drive ACE activity toward lower activity levels.9,10 Studies have indicated that shear-stress affects ACE activity transiently, 16 and its own downregulation may be explained by increased shear stress with exercise-induced hyperemia. Furthermore, as the ACE domains have different substrate and inhibitor specificities and since the ACE I/D polymorphism affects the domains’ activities, it is possible that AET and ACE I/D polymorphism interaction may differently influence ACE domains’ activities.
Therefore, the aim of the present study is to investigate the interaction between ACE I/D polymorphism and AET on total ACE and ACE C- and N-domain activities, as well as on the forearm blood flow (FBF) and conductance.
Methods and materials
The participants completed all evaluations at pre- and post-four months of AET intervention.
Study population
A total of 315 pre-selected healthy male Brazilian policemen recruits were invited to participate in the study. They were genotyped for the ACE gene polymorphism. Fifty recruits completed the full training protocol. To avoid gender, age, and disease confounding in our study, the eligibility for taking part in the study was determined by sex (only males), healthy status (no known history of medical conditions), tobacco consumption (nonsmokers only) and age (between 19 and 36 years). The individuals were screened for cardiovascular, endocrine, and metabolic disorders. They had no apparent cardiovascular disease. Clinical examination, laboratory testing, and cardiopulmonary exercise test determined their health status. The Ethics Committee for the Protection of the Human Subject of the Heart Institute (InCor) and the Clinical Hospital of the University of São Paulo, the Faculty of Medicine, approved the study protocol. The research was conducted in accordance with the World Medical Association’s 2008 Declaration of Helsinki. Individuals included in the study took no medication for at least three months prior to study enrollment, and abstained from caffeine and alcohol one day before study measurements. 17
ACE gene polymorphism
The ACE gene I/D polymorphism were determined by means of a three-primer system. 18 Quality control for these assays was assessed by randomly selecting 50 samples to be re-genotyped by three independent technicians. Genomic DNA was obtained from whole blood following a standard salting-out protocol. 19 Genotyping was conducted following previous work.
Assessment of the ACE gene polymorphism genotype
Five-milliliter blood samples were drawn into tubes containing ethylenediaminetetraacetic acid. The ACE I/D polymorphism was determined using a three-primer system, 19 which minimizes the mistyping 20 that can occur with a two-primer system. Polymerase chain reaction products were visualized by electrophoresis on 3% agarose gel with ethidium bromide and stored in digital form.
Serum ACE activity
A fasting 10 ml blood sample was obtained from a superficial forearm vein. The blood was collected without anticoagulant, kept on ice, rapidly centrifuged at 3000 rpm for 10 minutes and frozen after each group of data collection. Serum samples were stored at −80oC and used a single cycle of freeze-thaw before analysis for assaying ACE activity. 20 The total storage of the samples was maintained at −80oC between the total collection and analysis of samples. ACE activity was assayed in serum using fluorescence resonance energy transfer substrates containing ortho-aminobenzoic (Abz) and dinitrophenyl (Dnp) as fluorescence donor/acceptor pair, namely Abz-FRK(Dnp)P-OH for total ACE activity, Abz-SDK(Dnp)P-OH for the N-domain activity and Abz-LFK(Dnp)P-OH for the C-domain activity derivatives as substrates by continuously measuring the fluorescence.21,22 The assays were performed in a 96-well plate and 5 µl plasma was incubated with 10 µM of appropriate substrate at 37ºC in 0.1 M Tris-HCl buffer, pH 7.0, containing 50 mM NaCl, 10 µM ZnCl2 in a final volume of 200 µl. Fluorescence increments along the timeline were read at 420 nm emission:320 nm excitation. The hydrolysis rate of the intramolecularly quenched fluorogenic substrates were incubated with aliquots of serum for 60 minutes to obtain total ACE enzymatic activity, and for 90 minutes to obtain enzymatic activity of the N and C domains. The slope was converted into nmol substrate hydrolyzed per minute based on a calibration curve obtained by complete hydrolysis of the peptide as reported previously. 23 ACE activity is reported as UF.min–1.ml–1 (1 UF = nmol of Abz-FRK(Dnp)P-OH hydrolyzed per minute). Measurements were made in triplicate with differences accounting for less than 5%.
Maximal cardiopulmonary exercise test
Maximal exercise capacity was determined during a maximal progressive exercise test on a treadmill (Quinton Instruments Company, Seattle, WA, USA), with workload increments of one metabolic equivalent (MET) every minute until exhaustion. A breath-by-breath gas exchange analyzer (Vmax 29, Sensor Medics, Buena Vista, CA, USA) was used to measure VO2 and carbon dioxide production. Peak VO2 was defined as the maximum attained VO2 at the end of the exercise period at which the individual could no longer maintain running exercise. This method is considered the gold standard for assessing patients’ exercise capacity. Ventilatory threshold was determined as occurring at the breakpoint between the increase in the carbon dioxide production and VO2 (V-slope) or the point at which the ventilatory equivalent for oxygen and end-tidal oxygen partial pressure curves reached their respective minimum values and began to rise. Respiratory compensation was determined to occur at the point at which the ventilatory equivalent for carbon dioxide was lowest before a systematic increase and when end-tidal carbon dioxide partial pressure reached a maximum and began to decrease. The reproducibility of the peak VO2 measured at a different time interval in the same individual expressed as ml/kg/min in our laboratory is r = 0.95. Heart rate (HR) was continuously monitored by electrocardiography (ECG), and BP was measured by sphygmomanometry. This test was repeated after 16 weeks of AET. 24
Handgrip exercise
After the maximal voluntary contraction (MVC, average of three trials) was obtained, handgrip isometric exercise was performed at 30% of MVC for three minutes with the dominant arm, using a handgrip dynamometer (Stoelting, Wood Dale, IL, USA). Individuals were instructed to breathe normally during exercise and to avoid inadvertent performance of a valsalva maneuver.
Measurements during the handgrip exercise
BP and HR
During the handgrip exercise, BP was monitored noninvasively and intermittently with the use of an automatic oscillometric cuff (Dixtal DX 2710, Dixtal Biomédica, Manaus, AM, Brazil) placed on the ankle with cuff width adjusted to ankle circumference. HR was monitored continuously through lead II of the ECG. 17
FBF
FBF was measured by venous occlusion plethysmography. 25 The nondominant arm was elevated above heart level to ensure adequate venous drainage. A mercury-filled silastic tube attached to a low-pressure transducer was placed around the forearm and connected to a plethysmograph (Hokanson, Bellevue, WA, USA). Sphygmomanometer cuffs were placed around the wrist and upper arm. At 15-second intervals, the upper cuff was inflated above venous pressure for seven to eight seconds. The cuff around the wrist was maintained continuously inflated during the entire experimental protocol at a supra-systolic pressure (240 mmHg) to prevent the passage of blood flow into the hand. The increase in tension on the silastic tube reflected the volume of the forearm and hence its vasodilation. FBF (ml/min/100 ml tissue) was determined on the basis of a minimum of four separate readings. The record of the flow wave was recorded on a computer and analyzed using specific software (WinDaq Software, Dataq Instruments Inc, Akron, OH, USA).
Forearm vascular conductance (FVC)
FVC was calculated by dividing FBF by the mean arterial pressure. In our laboratory, the reproducibility of FBF measured at different time intervals in the same individual, expressed as milliliters per minute per 100 ml tissue, had a correlation coefficient of 0.93.
Handgrip experimental protocol
The handgrip evaluation protocol occurred between 07:00 and 10:00 a.m. with the patients in a supine position in a quiet, air-conditioned room (21–22ºC). Patients were instructed to sleep at least seven hours, to not participate in physical exercise for 24 hours prior to the study, and to consume a light meal without caffeine before participating in the protocol. The participants were positioned, and ECG leads were placed on the chest. Cuffs for FBF measurement were placed on the nondominant arm and a cuff for BP measurement was placed on the ankle. After a 15-minute rest period baseline values for FBF, BP and HR were recorded for three minutes. Moderate static handgrip exercise at 30% of MVC was then performed for three minutes, followed by a recovery period of three minutes. 20 FBF, BP and HR were recorded continuously during the handgrip exercise. Mean BP (MBP) was measured every minute, and FBF was measured every 15 seconds. All studies were performed in a temperature-controlled (21°C) room, between 8:00 and 10:00 a.m. 23
AET protocol
Individuals underwent AET for 65–90 minutes, three sessions weekly, during four months supervised by an exercise specialist. Exercise intensity was individually graded between aerobic/anaerobic thresholds according to HR obtained during baseline maximal cardiopulmonary exercise testing. The training protocol consisted of two months of moderate intensity (aerobic threshold) followed by two months of high-intensity (anaerobic threshold) AET. 26 AET sessions consisted of five minutes of warm-up, followed by 60 minutes of jogging or running. In the first two months they also performed 25 minutes of local strengthening exercises (sit-ups, push-ups, and pull-ups). 20 Strengthening exercises had the purpose of protecting the muscles and joints. Thus, this increased strength gave these individuals the capacity to achieve the prescribed protocol at the end of four months.
Statistical analysis
Data are presented as mean ± SEM. The calculation for the sample size was determined according to a previous study with a similar population of healthy men in an investigation of the polymorphism of allele T at promoter region of the endothelial nitric oxide synthase (eNOS) gene. 24 The Kolmogorov–Smirnov test was used to assess the normality of distribution of each variable studied. Baseline analyses were subjected to one-way analysis of variance (ANOVA). In the post-training period, total ACE and C- and N-domain activities, cardiopulmonary analyses, FBF and FVC were subjected to two-way ANOVA with repeated measures. When significance was found, Scheffé’s post hoc comparisons were performed. Probability values of p ≤ 0.05 were considered statistically significant. The FBF and FVC data were expressed as area under the curve (AUC). 20 Inter-assay percentage coefficients of variability were considered acceptable for <15% and intra-assay percentage coefficients of variability were considered acceptable for <10%. Interaction in two-way ANOVA occurs when there are different responses to an intervention among study groups.
Results
Baseline characteristics
In 315 individuals, the genotypic frequencies were 23 % (II), 51% (ID) and 26% (DD), respectively. These were similar to the results found in another study conducted in a Brazilian population, which showed the same genotypic frequencies 19% (II), 53% (ID) and 28% (DD), respectively. 18 The rare allele frequency was 45.4% (I) and 54.6% (D). The genotypes were in Hardy–Weinberg equilibrium (p = 0.4050).
The physical characteristics and metabolic measurements of the 50 men who completed the full AET, group II (n = 12), group ID (n = 25) and group DD (n = 13), are shown in Table 1. There were no significant differences in age, weight, height, and body mass index (BMI). Glucose, total cholesterol, low-density lipoprotein cholesterol, high-density lipoprotein cholesterol and triglyceride levels were all similar among II, ID and DD genotypes. In the pre-training period, at post- and during the handgrip exercise, MBP and HR were similar. All of these parameters increased significantly and similarly among II, ID and DD genotypes (Table 2).
Physical characteristics and metabolic measurements in 50 individuals encoding II, ID and DD of the ACE gene I/D polymorphism.

Values are mean ± SEM. ACE: angiotensin-converting enzyme; BMI: body mass index; D: deletion; HDL: high-density lipoprotein; I: insertion; LDL: low-density lipoprotein.
Hemodynamic characteristics—mean blood pressure and heart rate in the three genotype groups pre- and post-aerobic exercise training of the ACE gene I/D polymorphism.

Values are mean ± SEM. ACE: angiotensin-converting enzyme; D: deletion; HR: heart rate; I: insertion; MBP: mean blood pressure.
Effects of AET
All the individuals studied showed an increase of VO2 peak (12±2%), FBF (30%) and FVC (35%). 12 Moreover, the II, ID and DD groups showed a significant and similar increase in VO2 peak (49±2 vs. 57±1; 48±1 vs. 56±3; and 48±5 vs. 58±2 ml/kg/min, respectively) from pre- to post-AET program; interaction, p = 0.14, *p < 0.02 vs. pre- for all groups, Figure 1.

Functional capacity (VO2 peak) measured in the maximal cardiopulmonary exercise test pre- and post-four months of aerobic exercise training in the three genotype groups. VO2 peak increased significantly and similarly in all studied groups. The values represent means ±SEM; interaction, p = 0.14, *p < 0.02 versus pre- for all groups.
Participants carrying II, ID and DD had a significant increase in FBF in AUC when the values pre- and post-AET were compared; phase pre- and post-, *p < 0.01, interaction, p = 0.12, Figure 2(a). Similarly, the FVC appeared higher in all genotypes when values pre- versus post-AET were compared; phase pre- and post-, *p < 0.01, interaction, p = 0.50, Figure 2(b). After AET there were no changes in HR and MBP for all three groups (Table 2).
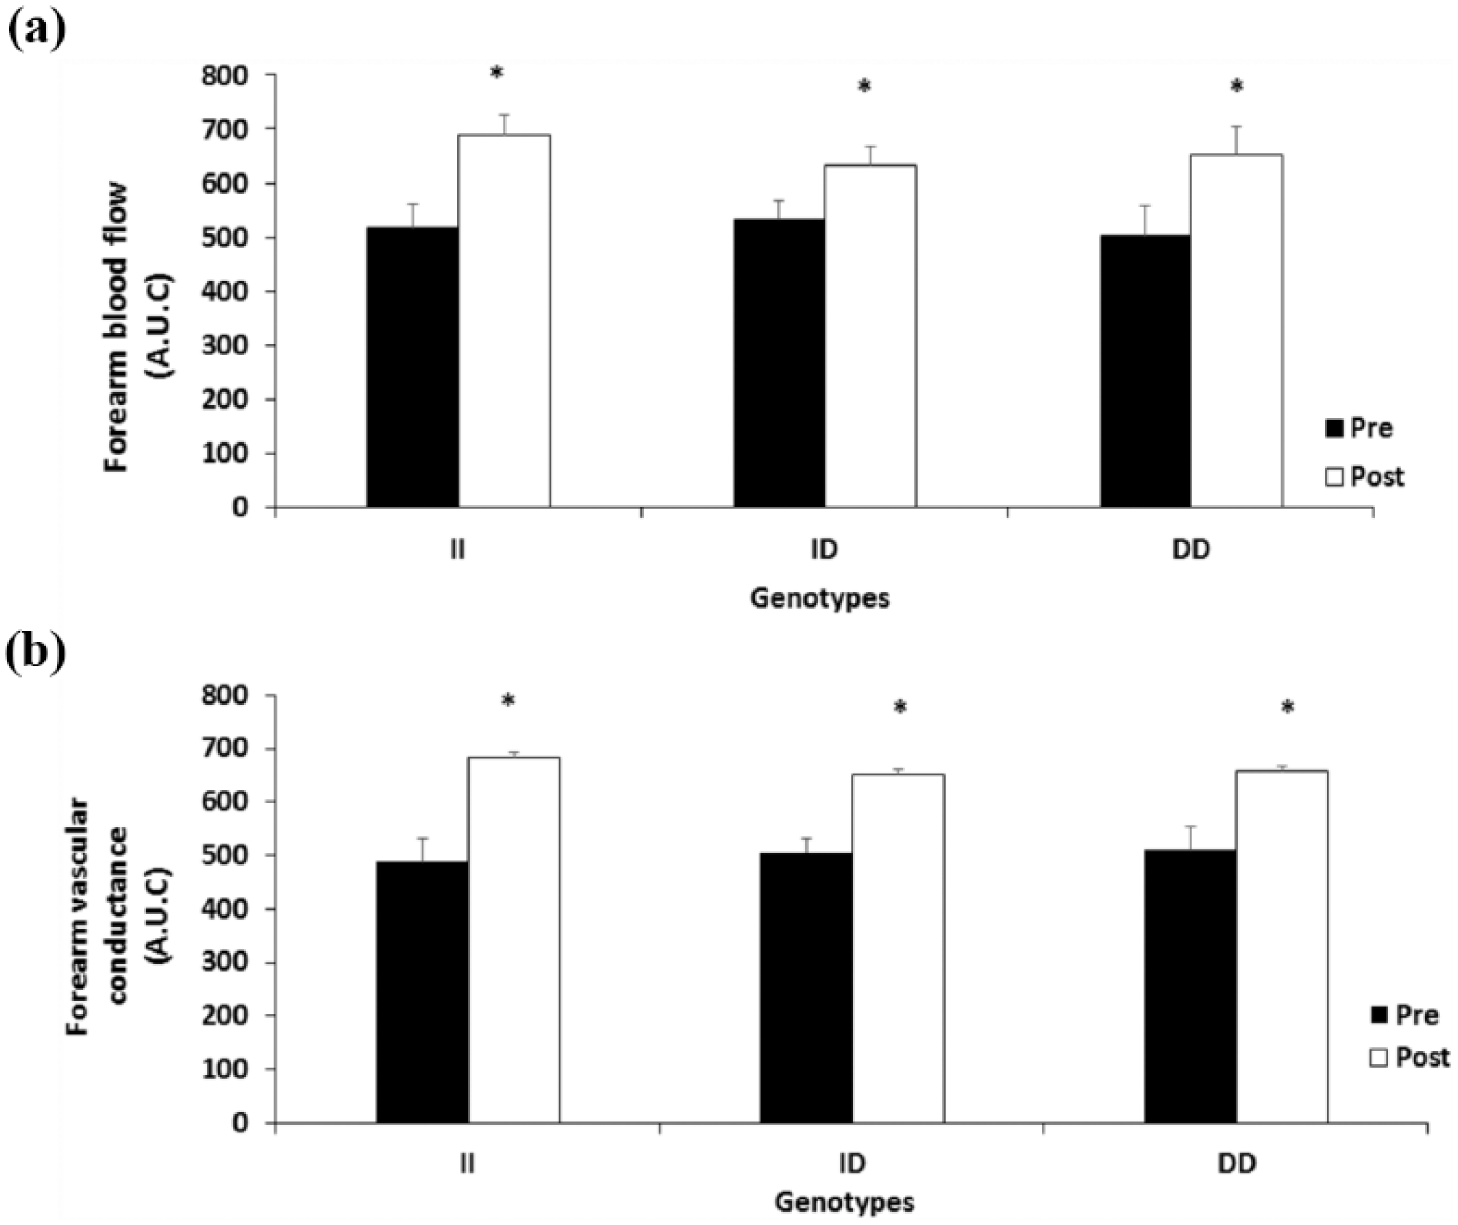
Forearm blood flow and forearm vascular conductance in the three genotype groups. (a) Forearm blood flow in pre- and post-training period, *p <0.01. (b) Forearm vascular conductance in pre- and post-training period, *p <0.01. The values represent means ±SEM. AUC: area under the curve.
AET and total ACE and C- and N-domain activities
In response to the 16 weeks of the AET program, we observed significant reductions in activities of total ACE p < 0.02 (Figure 3(a)) and ACE C-domain p < 0.001 (Figure 3(b)), and there was an increase in ACE N-domain activity p < 0.01 (Figure 3(c)) in all individuals studied.

Activity angiotensin-converting enzyme (ACE) in pre- and post-training periods. (a) ACE activity total *p < 0.02. (b) C-domain ACE activity, *p < 0.001. (c) N-domain ACE activity, *p < 0.01. The values represent means ±SEM.
AET and ACE I/D polymorphism, total ACE and domain activities
In the pre-training period, total ACE and C-domain activities were lower in II than DD genotypes; interaction, p < 0.05), while N-domain activity was similar in the three genotypes (Figure 4(a), (b), and (c), respectively).
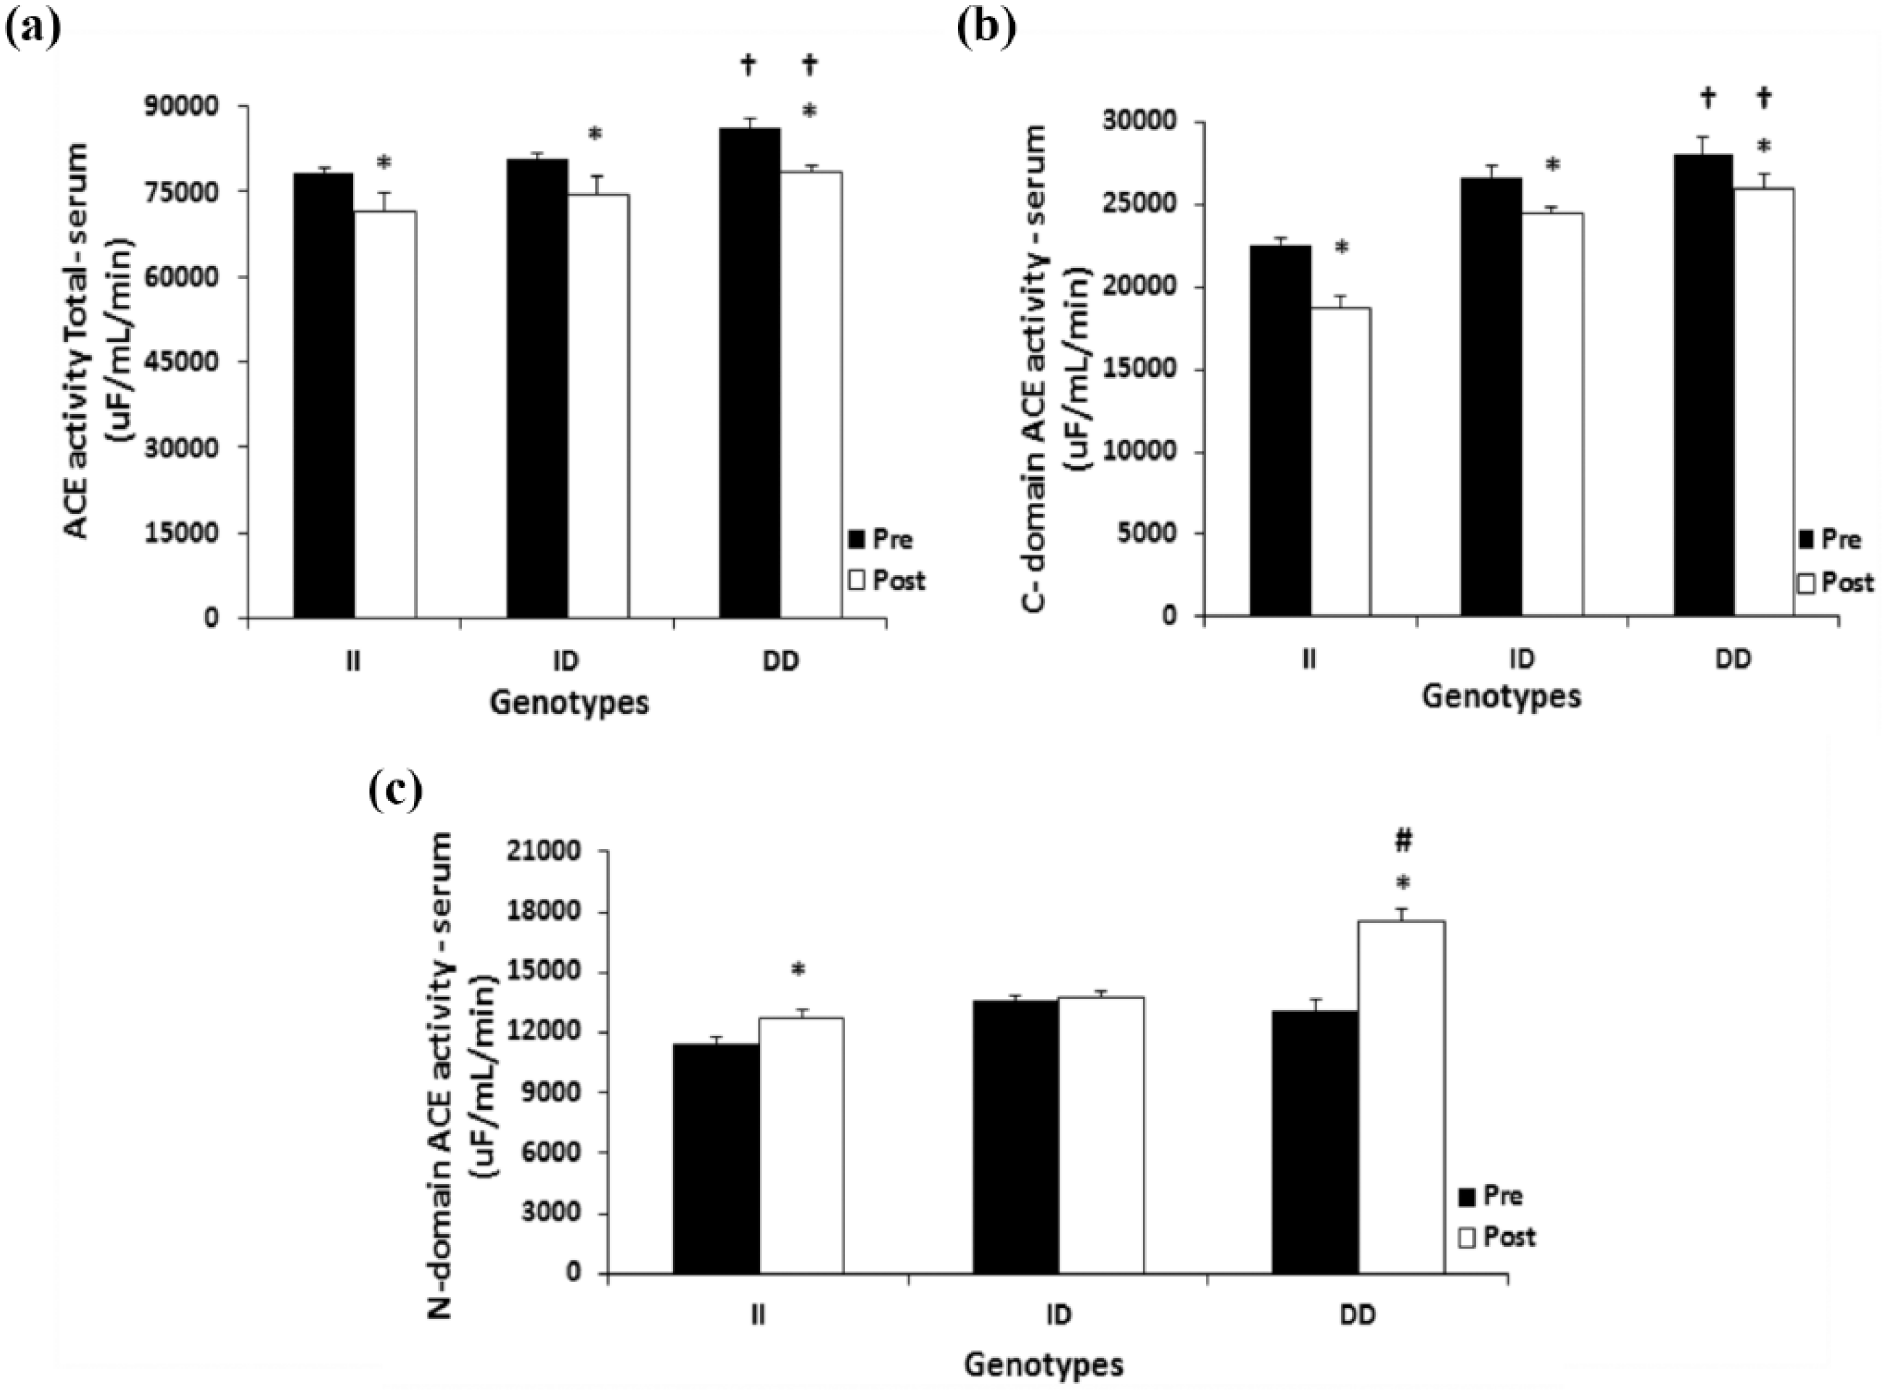
Pre- and post-training periods of the three genotypes of the ACE gene. (a) ACE activity total, *p < 0.05 versus pre-training period, and †p < 0.05 versus II. (b) C-domain ACE activity, *p <0.05 versus pre-training period, and †p < 0.05 versus II. (c) N-domain ACE activity, *p <0.05 versus pre-training period versus II and DD, and #p < 0.01 versus all groups and pre- and post-training period. The values represent means ±SEM. ACE: angiotensin-converting enzyme; I: insertion; D: deletion.
In the post-training period, total ACE and C-domain activities decreased in all the genotype groups II, ID and DD compared to the pre-training period; interaction, p < 0.05, Figure 4(a) and (b), respectively. However, the N-domain activity increased in the II and DD genotype (Figure 4(c)).
Individuals harboring the DD genotype had a 34% greater increase in N-domain activity levels when compared with individuals of the other two genotypes; interaction, p < 0.01 (Figure 4(c)).
Discussion
The present study is the first to show that AET differentially modulates circulating total ACE and ACE C- and N-terminal activities in humans; moreover, the ACE I/D polymorphism affects this training response. Overall, the results showed that in the pre- and post-training period the total ACE and C-domain activities were lower in II than DD genotypes; moreover, AET decreased similarly to the total circulating ACE and ACE C-terminal domain activities in all genotypes, while ACE N-terminal domain activity was increased in the DD group. When analyzed separately the II, ID and DD genotypes showed a reduction in total ACE and ACE C-terminal domain activities after AET; it decreased similarly to the total ACE and C-domain activities in all genotypes whereas it increased the N-domain activity in the II and DD genotypes. However, interestingly, the measurements for N-domain activity in the DD genotype at post-training were greater than the other genotypes. These results show that AET regulates total ACE and ACE C- and N-terminal domain activities and is dependent on the ACE I/D polymorphism.
Many studies have shown that the ACE I/D polymorphism is associated with endurance-related events.9,10 The presence of the I allele is associated with lower serum and tissue ACE activity and improved performance in endurance sports, 12 while the D allele is associated with higher circulating and tissue ACE activity and enhanced performance at sports that require sprinting or short bursts of power. 27 As a genotype related to decreased ACE activity is associated with endurance performance, our initial hypothesis was that the AET would decrease total ACE activity, and our results confirm this hypothesis. To the best of our knowledge, this is the first study to describe the effects of a period of AET on circulating ACE activity in humans.
ACE hydrolyses peptides by the removal of a dipeptide from the C-terminus, as in the conversion of Ang I to Ang II, a potent vasoconstrictor and degrader of bradykinin. 28 Therefore, the reduction in ACE activity, as observed after the AET protocol, might allow for higher blood flow and vascular conductance, which would be beneficial during exercise. 20 Our results show that FBF and FVC were increased after the AET protocol, a result that is consistent with the reduction in ACE activity. Furthermore, we evaluated the effects of the AET protocol on ACE C- and N-terminal domains. Interestingly, in the pre-training period total ACE and ACE C-domain activities were lower in II than DD genotypes. In order to draw a clearer picture of the functional consequences of these differences, we evaluated FBF before and after the AET protocol and observed a similar increase in all genotypes. These results suggest that FBF after exercise training is associated with a reduction in ACE C-terminal domain activity, but is independent of ACE N-terminal domain activity. Van Ginkel et al. showed that individuals with the ACE-II polymorphism had significantly larger recruitment of the relative capillaries after exercise compared to people with ACE-ID/DD, showing a relationship between ACE genotype and blood flow. 15 In line with this, some studies have demonstrated that ACE affects its own regulation in response to shear stress and suggest that the ACE extracellular domain behaves as a mechanosensor while the cytoplasmic domain elicits downstream intracellular signaling by phosphorylation on Ser1270. 16 Therefore, repeated bouts of exercise cause a downregulation of the ACE C-terminal activity probably because shear stress affects ACE activity transiently, and its own downregulation could be explained by increased shear stress with exercise-induced hyperemia. Thus, the decrease of ACE signaling by shear stress might also contribute to reducing Ang II formation and accumulation of bradykinin and all its consequences on higher blood flow and vascular conductance. Corroborating, we previously showed decreased ACE activity and increased vascular reactivity in response to exercise training modulated by the +9/–9 bradykinin B2 receptor gene functional polymorphism, the main peptide degradable by ACE. 19
We are unaware of previous studies that assessed the interaction between ACE I/D polymorphism and AET on ACE domain activities. Our results show that although the decrease in ACE C-terminal domain activity is dependent on the ACE I/D polymorphism, ACE N-terminal domain is increased only in individuals harboring the DD genotype. It is known that the ACE N-terminal domain is able to cleave and inactivate the negative hemoregulator Ac-SDKP 50 times faster than the ACE C-terminal domain, making this tetrapeptide a natural substrate for the ACE N-terminal domain. 8 Ac-SDKP is found in the bone marrow and in the peripheral circulation and reversibly prevents the recruitment of pluripotent hematopoietic stem cells into the S-phase of the cellular cycle by maintaining them in the G0 phase.29,30 Therefore, by acting on Ac-SDKP, the ACE N-terminal domain plays an important role on the stimulation of hematopoiesis. As AET stimulates the production of red blood cells, 31 it is possible that hematopoiesis was increased in participants with the DD polymorphism. Unfortunately, we did not assess hematopoiesis in the present study, which would have been useful in clarifying the functional consequences of increased ACE N-terminal in the DD genotype. 32
The decrease in ACE C-terminal domain activity and the increase in ACE N-terminal domain activity are both beneficial in the context of AET adaptations, once these changes promote improvements in blood flow/conductance and red blood cell proliferation, respectively, and these aid performance improvement.33,34 Most medical applications have involved so far the regulation of ACE activity in the control of hypertension 35 and for prophylactic treatment of heart disease control. 34 Therefore, it is possible that AET can help to improve blood flow and vascular conductance, which would be advantageous for those who practice AET.
Our study has several limitations. First is the lack of a control group with which to compare the changes observed in the experimental group. Therefore, it is not clear whether the changes observed are due to changes over time or due to AET. We studied only young males who were not completely sedentary because they are on-duty police officers. Thus, we cannot rule on the results for the population in general, mostly women and older and completely sedentary individuals. Moreover, there was a lack of assessment of the changes in body composition and the nutritional status of the participants during the four months of training program that may have interfered in the effect of exercise training on ACE activity and its association with vascular reactivity. Since we studied police officers, however, sharing similar meals during the evaluations, we do not think that this particular issue could have affected our results. In addition, we finished with only 50 men who adhered to the AET. But we have in our favor that we had all measurements for all 50 study participants. In this context, future studies in broad aspects of an overall population are needed, aiming especially at investigating the mechanisms that affect the ACE I/D polymorphism and AET on ACE domain activities.
In conclusion, in the present study we showed for the first time that ACE C- and N-terminal domain activities can be modulated by AET in interaction with the ACE I/D polymorphism.
Footnotes
Acknowledgements
The authors thank the participating patients and all the clinical study site personnel who contributed to conducting this trial.
Declaration of conflicting interest
The author(s) declared no potential conflicts of interest with respect to the research, authorship, and/or publication of this article.
Funding
The author(s) disclosed receipt of the following financial support for the research, authorship, and/or publication of this article: This work was supported by grants from the Fundação de Amparo à Pesquisa do Estado de São Paulo (grant numbers 2010/50048-1 and 2009/18370-3). C.R. Alves is the recipient of a doctor’s fellowship from Coordenação de Aperfeiçoamento de Pessoal de Nível Superior (CAPES - grant number 5525071-FMUSP). T. Fernandes is the recipient of a doctor’s fellowship from Conselho Nacional de Desenvolvimento Científico e Tecnológico (CNPq – grant number 159827/2011-6). E.M. Oliveira was awarded scholarships from the CNPq (grant number 307591/2009-3) and USP/PRP-NAPmiR, Brazil. CAPES-PROEX.