
Abstract
Introduction:
We investigated the feasibility of using a fluorescence resonance energy transfer system to image enzymatic activity in order to evaluate the effects of aliskiren (a direct renin inhibitor) on diabetic nephropathy.
Materials and methods:
First, we induced diabetes in C57BL/6J mice using streptozotocin, then treated them with either aliskiren (25 mg/kg/day) or the angiotensin type 1 receptor blocker valsartan (15 mg/kg/day) for four weeks. Finally, we utilized renin fluorescence resonance energy transfer substrate to assess renin activity.
Results:
Renin activity was much higher in the kidneys of diabetic mice compared to those of the non-diabetic control mice. While aliskiren inhibited this activity, valsartan did not. We noted that production of reactive oxygen species intensified and the bioavailability of nitric oxide diminished in the glomeruli of diabetic mice. Aliskiren and valsartan significantly ameliorated these effects. They suppressed glomerular production of reactive oxygen species and urinary albumin excretion. In fact, urinary albumin excretion in diabetic mice treated with aliskiren or valsartan was lower than that in untreated diabetic mice. Furthermore, aliskiren and valsartan significantly reduced glomerular permeability by maintaining the glomerular endothelial surface layer.
Conclusion:
Fluorescence resonance energy transfer could provide a new tool for evaluating tissue and plasma enzymatic activity.
Introduction
Diabetic vascular complications, including diabetic nephropathy, are becoming a serious public health concern in all countries. 1 They cause significant physical and psychological morbidity among those patients and imposes a heavy financial burden on health services. While the pathogenesis is understood well enough to prevent progression of diabetic vascular complications, it is still not sufficiently clear.
Although systemic renin activity is suppressed in diabetes, renin-angiotensin system (RAS) inhibitors exert renoprotective effects. 2 This is possible because the pathogenesis of diabetic nephropathy appears to involve activation of local/tissue RAS (independently regulated in each organ). Inhibiting RAS activation is important in order to prevent the progression of diabetic nephropathy. 2
Aliskiren, a renin inhibitor, is renoprotective in diabetic animal models.3–5 It suppresses RAS activity by directly inhibiting renin activity in the most upstream portion of RAS. 6 Since aliskiren has high affinity for renal tissue and prolonged activity, 7 it should provide good control of hypertension with strong renoprotective effects. While it is possible to measure tissue RAS activity, no reports of in vivo images exist. We developed a novel technique to visualize tissue renin activity in vivo by utilizing a fluorescence resonance energy transfer (FRET) system and confocal laser microscopy. We used this in vivo imaging technique to examine the possible involvement of local RAS in diabetic nephropathy. In addition, we studied the renoprotective mechanisms of aliskiren and its inhibitory effect on renin activity.
Methods and materials
Experimental animals
The experimental protocol (No. 11-055) was approved by the Ethics Review Committee for Animal Experimentation of the Kawasaki Medical School, Kurashiki, Japan. Male C57BL/6J mice (six weeks old) were purchased from Charles River Japan (Kanagawa, Japan). The mice were housed in a temperature- and humidity-controlled room with a 12-h light–dark cycle. They were fed standard laboratory animal chow and had free access to tap water.
We induced diabetes in the mice (n=40) by intraperitoneal injection of streptozotocin (STZ; Sigma Aldrich, St. Louis, Missouri, USA), at a dose of 50 mg/kg/d for 3 d as a modified Animal Models of Diabetic Complications Consortium protocol of multiple low-dose STZ injections. Blood glucose was measured using Medisafe Mini (Terumo, Tokyo, Japan). Mice with blood glucose levels ⩾300 mg/dl a week after the final STZ injection (n=30) were considered diabetic. Six weeks after they developed diabetes, the mice began a four-week course of either aliskiren (25 mg/kg/day, n=10), valsartan (15 mg/kg/day, n=10) or no treatment (n=10). We injected aliskiren into the peritoneum using an osmotic pump. Valsartan was administrated by gavage. Same-aged non-diabetic male mice were used as controls (n=8). At 18 weeks of age, body weight was recorded, and blood pressure was measured by the tail-cuff method with an automatic sphygmomanometer (BP98A; Softron, Tokyo, Japan). Then, the mice were placed in metabolic cages for 24 h to collect urine. We sacrificed them using sevoflurane gas in order to collect blood samples. Serum creatinine level was measured using an enzyme assay (Nescoat VLII CRE kit; Alfresa Pharma, Osaka, Japan). Urinary albumin levels were determined by enzyme-linked immunosorbent assay (ELISA) using a murine microalbuminuria ELISA kit (Albuwell M; Exocell, Philadelphia, Pennsylvania, USA).
Evaluation of renin activity in vivo using renin FRET substrate
We obtained renin FRET substrate (5-FAM/QX 520) from AnaSpec (San Jose, California, USA), and we used a multiphoton excitation laser-scanning fluorescence microscopy confocal microscope system (TCS SP2 AOBS MP; Leica-Microsystems, Wetzlar, Germany) for this study.
In order to infuse a dye, we placed each mouse under sevoflurane-induced anesthesia and inserted a catheter into its right external jugular vein. Afterwards, we made a 15–20 mm dorsal incision under sterile conditions to exteriorize the left kidney. We removed a cortical slice less than 1 mm thick to allow imaging of the most superficial glomeruli. Bleeding was minimal and stopped spontaneously within 2 min. During all procedures and imaging, the mice’s core body temperature was maintained at 37°C with a homeothermic table. A 0.1 ml volume of 70 kDa Texas Red dextran (neutral, excitation 595 nm, emission 615 nm, Thermo Fisher Scientific, Waltham, Massachusetts, USA) solution (2 mg/ml) was infused through the jugular venous catheter to identify glomeruli. Next, for analysis of renin activity, a 0.1 ml volume of renin FRET substrate solution (0.5 mM) was infused. The integrating fluorescein intensity in the glomerular tufts for 5 s from injection was measured to evaluate the renin FRET activity as previously described. 8 The result was shown as relative intensity compared to the control group.
Plasma renin activity assay
Plasma renin activity was determined using a Fluorometric Sensolyte 520 Mouse Renin Assay Kit (AnaSpec) following the manufacturer’s protocol.
Detection of endothelial surface layer
Sections (4 μm thick) were prepared from renal tissue samples embedded in paraffin and stained with tetramethylrhodamine isothiocyanate-conjugated wheatgerm agglutinin (WGA; Vector Laboratories, Burlingame, California, USA). Tetramethylrhodamine isothiocyanate-conjugated WGA-stained kidney sections were analyzed using TCS-NT system software (Leica-Microsystems, Wetzlar, Germany). For evaluation of glomerular endothelial surface layer (ESL), percent positive area was measured with a color image analyzer (WinLoof; Mitani Co., Fukui, Japan). At least 100 glomeruli at ×400 magnification were randomly selected from each mouse, and the mean score was calculated.
In situ detection of nitric oxide and reactive oxygen species (ROS)
The production levels of nitric oxide and ROS resulting from nitric oxide synthase (NOS) coupling were imaged by confocal laser microscopy after renal perfusion of 2’,7’-dichlorodihydrofluorescein diacetate (DCFH-DA; excitation 485 nm, emission 530 nm, Sekisui Medical, Tokyo, Japan) and diaminorhodamine-4M acetoxymethyl ester (DAR-4M AM; excitation 560 nm, emission 575 nm, Sekisui Medical) with L-arginine as previously described. 9
In vivo imaging of macromolecule hyperfiltration
A multiphoton excitation laser-scanning fluorescence microscopy confocal microscope system (TCS SP2 AOBS MP; Leica-Microsystems) was used for imaging of macromolecule hyperfiltration. In vivo imaging of the glomerular microcirculation was performed as previously described. 8 A 0.1 ml volume of 500 kDa fluorescein–dextran (2 mg/ml, anionic, excitation 494 nm, emission 521 nm, Thermo Fisher Scientific) solution was infused through the jugular venous catheter to identify glomerulus. To analyze glomerular permeability, a 70-kDa fluorescein–dextran (2 mg/ml, anionic, excitation 494 nm, emission 521 nm, Thermo Fisher Scientific) solution was infused through the jugular venous catheter.
Statistical analysis
Values are expressed as mean±standard error of the mean (SEM). Statistical comparisons were made using the Mann–Whitney U test or the one-factor analysis of variance with a Tukey–Kramer test for multiple comparisons. A p value of <0.05 was considered significant.
Results
Physiologic and biochemical data
Physiologic characteristics of the four groups are listed in Table 1. The STZ, STZ with aliskiren (STZ+Alis), and STZ with valsartan (STZ+Val) groups had significantly lower body weight and higher serum glucose and creatinine levels compared to mice in the control group. We noted that among STZ, STZ+Alis, and STZ+Val groups, serum glucose levels were similar and serum creatinine levels did not differ. Meanwhile, blood pressure readings for mice in the STZ+Alis and STZ+Val groups were significantly lower than for mice in the control and STZ groups, but blood pressure readings between STZ+Alis and STZ+Val groups did not differ. Finally, mice in the STZ group excreted significantly higher levels of urinary albumin compared to mice in the control group (Figure 1). However, mice in the STZ+Alis and STZ+Val groups excreted significantly less urinary albumin than mice in the STZ group.
Physiological and biochemical data.

Alis: aliskiren; BP: blood pressure; STZ: streptozotocin; Val: valsartan.
Values are expressed as mean±SEM. ap<0.05 vs control; bp<0.05 vs STZ.

Urinary albumin excretion. Comparison of control, streptozotocin (STZ), STZ with aliskiren (STZ+Alis), and STZ with valsartan (STZ+Val) mice. *p<0.05 versus control, †p<0.05 versus STZ.
In vivo imaging of renin activity in kidney and plasma renin activity
We detected in vivo renin activity in the kidneys by injecting renin FRET substrate (see Supplementary Material). As shown in Figure 2(a), high fluorescence was observed in the glomeruli of mice in the STZ group compared to the control group. We noted that while aliskiren suppressed fluorescence intensity in the STZ group, valsartan did not. The integrating fluorescein intensity in the glomerular tufts was significantly increased in the STZ group compared to the control group (Figure 2(b)). These changes were completely suppressed by aliskiren, but not valsartan.

In vivo imaging of renin activity in kidney and plasma renin activity. Comparison of control, streptozotocin (STZ), STZ with aliskiren (STZ+Alis), and STZ with valsartan (STZ+Val) mice. (a) Imaging of renin activity using renin fluorescence resonance energy transfer substrate (5-FAM/QXL 520) in vivo. Time per frame, 870 ms. (b) The integrating fluorescein intensity in the glomerular tufts for 5 s from injection. Data are expressed as mean±standard error of the mean (SEM). *p<0.05 versus control, †p<0.05 versus STZ, ‡p<0.05 versus (STZ+Alis). (c) Plasma renin activity determined using renin assay kit. Data are expressed as mean±SEM. *p<0.05 versus control, †p<0.05 versus STZ, ‡p<0.05 versus (STZ+Alis).
Plasma renin activity was assessed with an assay kit using the FRET system. We found that plasma renin activity in the STZ group was much higher than in the control group (Figure 2(c)). Plasma renin activity was also higher in the STZ group compared to the STZ+Alis group. However, plasma renin activity did not differ between the STZ+Val and STZ groups.
In situ detection of ROS/nitric oxide production and assessment of renal superoxide- production in mice kidneys
Production of ROS and nitric oxide was evaluated via confocal laser microscopy of kidney tissue after renal perfusion of DCFH-DA and DAR-4M AM with L-arginine (Figure 3(a)). We noted ROS production intensified and the bioavailability of nitric oxide was diminished in the glomeruli of mice in the STZ group. However, the effects of STZ were significantly ameliorated by aliskiren and valsartan.

In situ detection of reactive oxygen species/nitric oxide production and superoxide production in mice kidneys. Comparison of control, streptozotocin (STZ), STZ with aliskiren (STZ+Alis), and STZ with valsartan (STZ+Val) mice. (a) Representative images of reactive oxygen species (ROS) and nitric oxide in renal cortex glomeruli of control, STZ, STZ+Alis and STZ+Val mice. Images for ROS and nitric oxide are of the same glomerulus. (b) Renal superoxide production detected by lucigenin chemiluminescence. *p<0.05 versus control, †p<0.05 versus STZ.
Next, we evaluated renal superoxide levels in each group using lucigenin-enhanced chemiluminescence (Figure 3(b)). Production of renal superoxide in the whole kidneys of mice in the STZ+Alis and STZ+Val groups was significantly lower than the STZ group.
Evaluation of glomerular endothelial surface layer
Glomerular ESL was detected by WGA lectin staining (Figure 4(a)). The WGA-stained area on the capillary wall was significantly smaller in the STZ group compared with the control group, but aliskiren and valsartan significantly reduced the effect of STZ on glomerular ESL (Figure 4(b)).
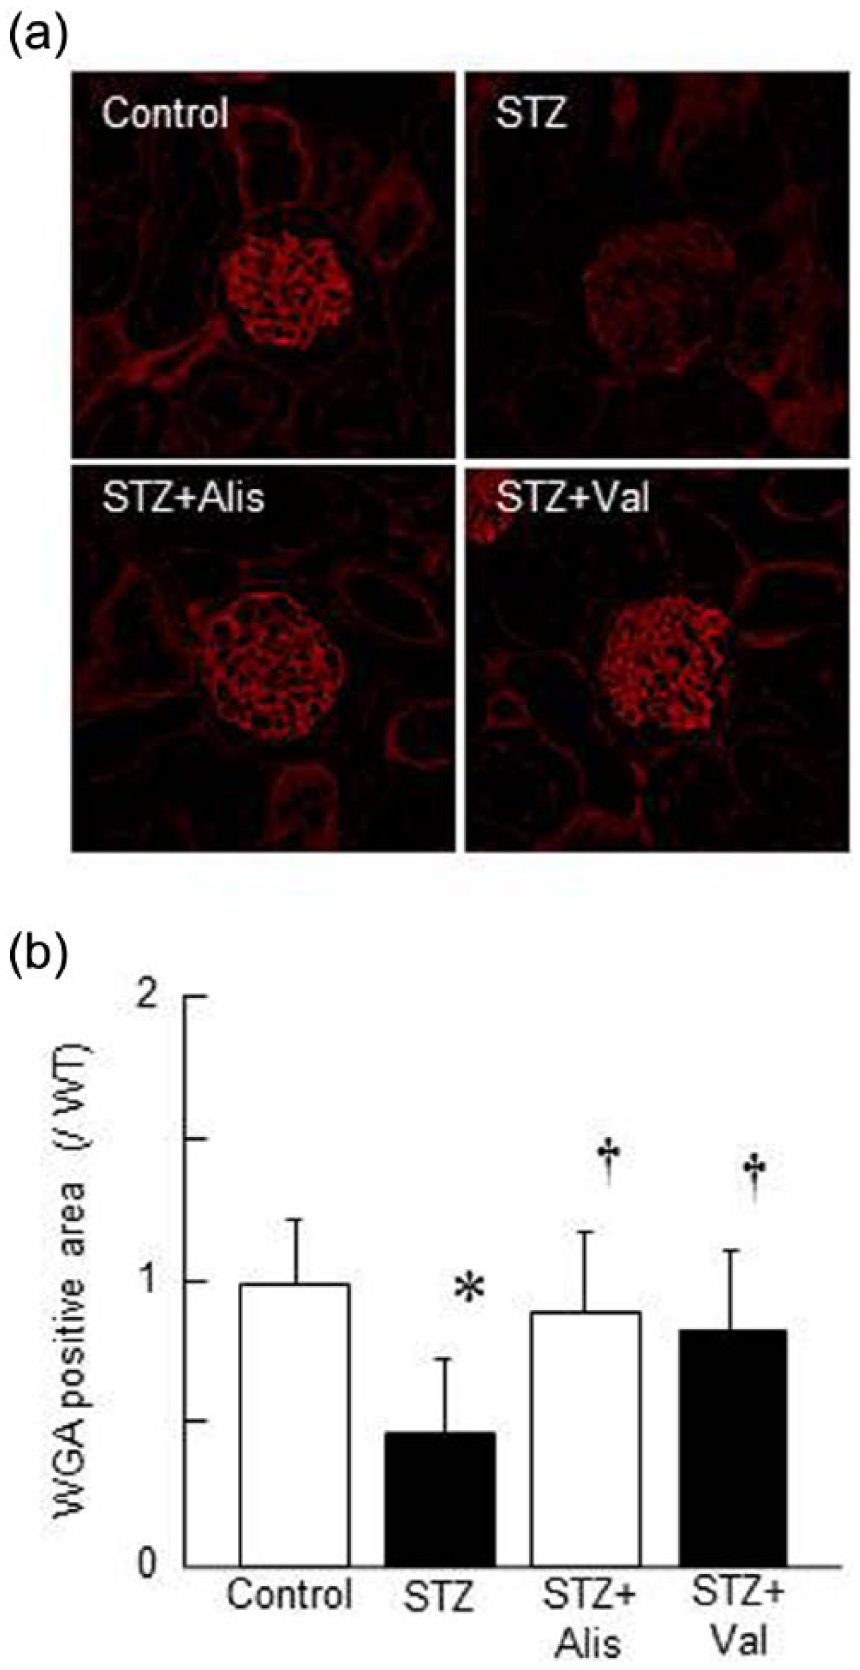
Evaluation of glomerular endothelial surface layer (ESL). (a) Glomerular ESL shown by wheat germ agglutinin (WGA) staining in control, streptozotocin (STZ), STZ with aliskiren (STZ+Alis), and STZ with valsartan (STZ+Val) mice. Scale bar=40 µm. (b) Relative WGA staining positive area. Data are expressed as mean±standard error of the mean (SEM). *p<0.05 versus control, †p<0.05 versus STZ.
Visualization of glomerular hyperpermeability to macromolecules
Glomerular hyperfiltration of macromolecules was visualized by intravenous injection of fluorescein isothiocyanate-conjugated dextran, as reported previously. 8 A very small volume of filtered 70-kDa fluorescein isothiocyanate-labeled dextran was seen in the Bowman’s capsule space of the control group (Figure 5), but massive leakage of labeled dextran occurred in the STZ group. There was less leakage in the STZ+Alis groups.

Glomerular permeability to macromolecules. Representative series of images showing hyperfiltration of macromolecules in glomeruli per mouse groups as indicated. Comparison of control, streptozotocin (STZ), STZ with aliskiren (STZ+Alis), and STZ with valsartan (STZ+Val) mice. Green, 70-kDa fluorescein isothiocyanate-labeled dextran. Scale bar=40 µm. Time per frame, 870 ms.
Discussion
Although diabetic nephropathy is generally a low renin state, high glucose levels might stimulate plasma renin activity by decreasing body volume through osmotic diuresis. However, in vivo and in vitro evidence suggest that local tissue RAS is activated in diabetes,10–14 which may implicate it in the pathogenesis of diabetic nephropathy. Our goal was to develop a technique for visualizing renin activity in vivo using renin FRET substrate, which would help elucidate the differences between the renoprotective effects of renin inhibitors and angiotensin receptor blockers (ARBs).
The fluorescence of renin FRET substrate in the glomeruli is thought to be reflected plasma renin enzymatic activity and/or tissue renin activity, which includes prorenin binding to the (pro)renin receptor (PRR). In other words, the specificity of this technique for visualizing local tissue renin activity might not be high. However, renin gene and protein expression have been reported in cultured mesangial cells and podocytes.13,15–17 Moreover, PRR expression has been reported in the glomerular cells, such as mesangial cells, podocytes, and vascular walls.18–20 In this study, we observed fluorescence that might be from podocytes. Therefore, we reasoned that the fluorescence observed in the glomeruli reflected renin enzymatic activity in the glomeruli. This technique might be an effective method for evaluating renin enzymatic activity in vivo.
Peti-Peterdi et al. have used renin FRET substrate to visualize renin enzymatic activity in freshly dissected kidney tissue. 21 However, no studies have evaluated renin enzymatic activity in living animals until now. We visualized and evaluated the in vivo renin enzymatic activity of the glomeruli by intravenously injecting renin FRET substrate. We found that renin enzymatic activity in mice injected with STZ was higher than mice in the control group. Aliskiren suppressed that activity. We also noted that aliskiren and valsartan ameliorated the effects of diabetes by decreasing glomerular oxidative stress and lowering nitric oxide bioavailability. Moreover, both agents reduced glomerular hyperpermeability in diabetic mice. By suppressing renal oxidative stress, aliskiren and valsartan helped maintain the glomerular glycocalyx in diabetic mice, reducing glomerular hyperpermeability, which reduced excretion of urinary albumin.
Recent evidence has revealed that the intrarenal RAS activation is an important factor to the pathogenesis of renal injury. 22 In general, the intrarenal angiotensin II generation is increased, despite suppression of the systemic RAS, in diabetic nephropathy. 23 In STZ rats, an increase in renal renin was demonstrated. 12 Direct demonstration of increased renin mRNA in the expanded mesangial area of kidney tissues from diabetic patients was also shown by in situ hybridization studies. 24 Indeed, local renin production is increased in the diabetic kidney. Local renin increase causes the progression of diabetic nephropathy via several pathways. We showed that both inhibition of renin by aliskiren and angiotensin receptor blockade by valsartan are effective for renoprotection in the diabetic kidney. So inhibition of local RAS, especially blockade of local angiotensin II signaling, may be more important for treatment of diabetic nephropathy.
One limitation of this study is that it is unclear whether fluorescence of renin FRET substrate reflects only tissue renin activity. In future studies, researchers should establish methods to distinguish between plasma renin activity and tissue renin activity. Another limitation is the difference between the renoprotective effects of direct renin inhibitors and ARBs was not clear. Previous data indicate that aliskiren and valsartan have synergistic protective effects, 3 suggesting they may have different renoprotective mechanisms, but more time might be needed to clarify the beneficial effects of these agents. Furthermore, another limitation is that we used STZ-induced diabetic mice, which is type 1 diabetes. In clinical medicine, type 2 diabetes is more prevalent than type 1 diabetes. So further investigations are needed using type 2 diabetic model mice.
Conclusion
We found that injecting renin FRET substrate intravenously enabled us to visualize renin activity in the glomeruli of living animals. Our imaging technique helped reveal that although both aliskiren and valsartan significantly inhibited urinary albumin excretion in diabetic mice, only aliskiren significantly inhibited renin bioactivity. Since no difference was found between the protective effects of aliskiren and valsartan against nephropathy, further examination is needed.
Footnotes
Acknowledgements
The authors wish to thank Novartis Pharmaceuticals, Basel, Switzerland for kindly providing aliskiren and valsartan. They also thank Etsuko Yorimasa for assistance with animal care and maintenance, and Satomi Hanada, Keiko Satoh and Keiko Shirakiya for expert technical assistance. Parts of this work were presented at American Society of Nephrology Renal Week 2012, San Diego, California, USA (November1, 2012), and American Heart Association High Blood Pressure Research 2014, San Francisco, California, USA (September 9, 2014).
Declaration of conflicting interests
The author(s) declared no potential conflicts of interest with respect to the research, authorship, and/or publication of this article.
Funding
The author(s) disclosed receipt of the following financial support for the research, authorship, and/or publication of this article: This investigation was supported by Grants-in-Aid for Scientific Research from the Japan Society for the Promotion of Science (no. 26560229); Research Project Grant from Kawasaki Medical School (no. 26B-95); the Kawasaki Foundation for Medical Science and Medical Welfare; and Scholarship Donation from Pfizer Inc., Kyowa Hakko Kirin Co. Ltd., Chugai Pharmaceutical Co. Ltd., MSD K.K., and Astellas Pharma Inc.