
Abstract
Introduction:
We examined potential prothrombotic and proinflammatory effects of angiotensin II in 16 otherwise healthy familial hypercholesterolaemia subjects and 16 matched controls.
Methods:
Markers of fibrinolysis, thrombin generation and inflammation were assessed in plasma before, during and 1h after a 3h intravenous infusion of angiotensin II. In addition, placebo experiments with saline infusion were carried out.
Results:
Baseline plasminogen activator inhibitor type-1 activity and plasmin–antiplasmin-complex concentrations were similar in FH and controls, as were interleukin-6, leukocyte counts and C-reactive protein. Fibrinogen levels were higher in FH, and we observed a greater thrombin generating potential in FH (calibrated automated thrombogram), but no signs of elevated thrombin generation in vivo (prothrombin fragment 1+2). During angiotensin infusion plasminogen activator inhibitor type-1 activity decreased and plasmin–antiplasmin-complex concentrations increased similarly in FH and controls. Total and maximal amount of thrombin generated was unchanged, as were prothrombin-fragment-1+2 levels. Interleukin-6 and leukocyte counts increased similarly in both groups during angiotensin infusion, while fibrinogen tended to increase in FH and increased in controls. During saline infusion plasminogen activator inhibitor type-1 activity and prothrombin fragment 1+2 concentrations fell, whereas other markers were unchanged.
Conclusions:
FH exhibits an increased thrombin generation potential, an intact fibrinolysis, and has no convincing signs of inflammation. Angiotensin has proinflammatory effects, and might have minor profibrinolytic and procoagulatory effects.
Introduction
The process of atherosclerosis is multifactorial, and epidemiological studies have identified several traditional risk factors. 1 Serum concentrations of total cholesterol, triglycerides and low-density lipoprotein cholesterol (LDL-C) are strongly associated with the extent of atherosclerotic lesions in the aorta and coronary arteries in children and young adults. 2 Subjects with familial hypercholesterolaemia (FH) have a poor vascular outcome, with an increased incidence of cardiovascular heart disease and premature death. 3 FH is characterized by increased levels of total cholesterol and LDL-C (Fredrickson type IIa). 4 Few studies have evaluated markers of haemostasis and inflammation in FH, and the results are inconclusive. Impaired vascular function and a prothrombotic and proinflammatory phenotype have been shown in children with FH. 5 In adults with FH, a procoagulant activity has been reported, while studies of inflammatory markers have shown less consistent results.6-8 In contrast to patients with familial combined hyperlipidaemia, FH is not associated with insulin resistance. 9
The renin–angiotensin–aldosterone system may play an important role for the prothrombotic and proinflammatory properties which are characteristic of the endothelium in atherosclerotic vessels. 10 Angiotensin (Ang) II promotes atherosclerosis and may have direct influence on the fibrinolytic system.11-15 However, others have reported no effect of Ang II on fibrinolysis in healthy subjects16,17 and the functional link between Ang II and the fibrinolytic system remains unclear. We have found that Ang II induces mild activation of the coagulation cascade in healthy subjects in vivo 18 and elicits alterations in the inflammatory phenotype in familial combined hyperlipidaemia. 19 Furthermore, we have demonstrated that long-term treatment with an angiotensin-converting enzyme inhibitor reduced thrombin generation in patients with mild-to-moderate hypertension, 20 consistent with the ability of angiotensin-converting enzyme inhibitors to reduce atherothrombotic complications in high risk patients. 21
The aims of the present study were to examine 1) haemostasis and inflammation in subjects with FH, and 2) the effects of Ang II. Thus, we investigated the effects of a systemic 3 h intravenous steady state infusion of Ang II in subjects with FH and matched controls. We assessed markers of 1) fibrinolysis (plasminogen-activator-inhibitor type-1 (PAI-1) activity and plasmin–antiplasmin-complex (PAP)), 2) thrombin generation (prothrombin fragment 1+2, (F1+2)) and variables provided by the calibrated automated thrombogram (CAT) and 3) inflammation (high-sensitivity interleukin-6 (IL-6), high-sensitive C-reactive protein (CRP), venous leukocyte count and fibrinogen).
Materials and methods
Study participants
Subjects with heterozygous FH (eight women and eight men) were recruited from the Centre for Metabolism and Endocrinology at the Karolinska University Hospital, Huddinge. The diagnosis of FH was based on laboratory testing with findings of high levels of total cholesterol (>9.0 mmol/l) and LDL-C in combination with either a family history of first degree relatives with high levels of cholesterol and/or early diagnosis of ischaemic heart disease, or findings at physical examination of tendon xanthomas. None of the subjects had any history or evidence of cardiovascular disease, diabetes mellitus, autoimmune disorder, or liver or kidney disease. Current smokers were defined as those who were smoking at least one cigarette per day or who had quit smoking within one year. Twelve individuals were on statin treatment, of which three also were on treatment with a cholesterol uptake inhibitor (ezetimibe); four subjects with FH had no lipid lowering therapy at all.
Age-matched healthy controls subjects (eight women and eight men) were recruited from the staff of the hospital and the local community by advertisements. Their fasting total cholesterol and triglyceride levels were less than 5.6 and 1.6 mmol/l, respectively, and systolic and diastolic blood pressure were less than 140 and 85 mm Hg, respectively.
Separate control experiments with placebo (physiological saline) infusion were performed in eight subjects (four women) to verify stability of the experimental design. Their systolic and diastolic blood pressures were less than 120 and 80 mm Hg, respectively, and their total cholesterol and triglyceride levels were less than 7.1 and 2.2 mmol/l, respectively.
The local Ethics Committee of Karolinska Hospital and the Swedish Medical Products Agency approved the study. Written informed consent was obtained from all participants.
Study procedure
Lipid lowering therapy was stopped four weeks before entering the study. The participants were instructed to refrain from smoking on the day of the investigation and not to take aspirin or non-steroid anti-inflammatory drugs during the week prior to the investigation. The subjects arrived at the Cardiovascular Research Laboratory at Danderyd University Hospital at 07:30 hours, after an overnight fast. An indwelling catheter was inserted in an antecubital vein of the left arm for the infusion of Ang II. Blood was collected by clean venipunctures of the antecubital veins of the right arm (Vacutainer technique). The investigations were performed with the subjects in the supine position after a 30 min resting period. Blood pressure was measured in the supine position by means of a mercury sphygmomanometer. Values are presented as the mean of two measurements, taken 1 min apart. Mean arterial pressure is represented by (systolic blood pressure + 2 × diastolic blood pressure) × 1/3.
Ang II acetate 50μg/vial (Clinalfa basic, Bachem AG, Basel, Switzerland) was dissolved in saline and given as an intravenous infusion starting at 2 ng/kg per min, with incremental doses of 2 ng/kg per min every 5 min up to 10 ng/kg per min), and then maintained for 3 h, as described previously.19,22 Ang II infusion, at a rate of 10 ng/kg per min, increases venous plasma Ang II levels 10 times the basal endogenous levels in healthy subjects.17,19,23 If mean arterial pressure increased by more than 25 mmHg from the resting value the rate of the Ang II infusion was reduced in steps of 2 ng/kg per min.
Blood samples and assays
Blood samples were taken before, at 1 and at 3 h of Ang II infusion, and 1 h after the end of the infusion. Venous blood was collected in test tubes (Becton Dickinson, Meylan, France) containing sodium citrate (3.8%) or EDTA, as appropriate. The samples were centrifuged immediately at 2000 × g at +20°C for 20 min. Plasma was separated and stored at −80°C until analysis. Plasma concentrations of haemostatic and inflammatory markers during interventions were corrected for changes in the haematocrit; correction factors were calculated from the following formula: 1-haematocritintervention/1-haematocritrest. 22
Enzyme immunoassay from Hyphen BioMed (Neuville sur Oise, France) was used to determine plasma concentrations of PAI-1 activity. Determination of PAP was performed by a classical two-site ELISA, described earlier. 24 Concentration of F1+2 were determined by enzyme immunoassays from Siemens Healthcare (Marburg, Germany). Thrombin generation in plasma was determined by using the CAT as originally described by Hemker et al., 25 and according to the instructions of the manufacturer (Thrombinoscope BV, Maastricht, the Netherlands). Reagents were from Thrombinoscope BV. The reactions were performed in microtitre wells (Immulon 2HB transparent U-bottom from Thermo Electron, Denmark). Briefly, 80 μl of platelet-poor plasma (PPP) was mixed with 20 μl of a PPP reagent containing tissue factor (final concentration 5 pM) and phospholipids (final concentration 4 μM). In addition, 80 μl of the same PPP was mixed with 20 μl of thrombin calibrator. A thrombin specific fluorogenic substance (2.5 mM) which is specifically cleaved by thrombin was then added together with CaCl2 (100 mM) in Hepes buffer to start the reactions in the measurement and calibration wells, respectively. The fluorescence was subsequently measured every 30 s during 60 min by a Fluoroscan Ascent fluorometer (Thermo Scientific Vanta, Finland) and five variables were calculated and presented by commercial software (Thrombinoscope version 2007): 1) the maximum concentration of thrombin formed during the time of registration was the peak thrombin concentration; 2) the area under the concentration-time curve represented the endogenous thrombin potential; 3) the lag time was the time from start of analysis until thrombin started to generate; 4) time to peak was the time from start of thrombin generation until the peak thrombin value was achieved; and 5) time to tail was the time from start of thrombin generation until the end of thrombin generation. 25
Concentrations of IL-6 were determined in citrated plasma, using enzyme immunoassays from R&D Systems (Abingdon, UK). CRP and leukocyte count were determined in peripheral venous blood with EDTA by an automated blood cell counter (Technicon H1, Hematology System, Technicon Instruments Corp., Tarrytown, NY, USA). Total plasma fibrinogen was analysed by means of a Fibri-Prest Automate method (von Clauss method) from Diagnostica Stago (Asnères, France).
Plasma glucose was measured with an automated routine method (Synchron LX, Beckman Coulter, Inc., Fullerton, CA, USA). Insulin resistance was estimated by the homeostasis model assessment of insulin resistance by the formula (insulin in mU/l × glucose in mmol/l)/22. 26 The cholesterol and triglyceride contents of the various lipoprotein fractions in familial hypercholesterolaemia and controls were assessed by standard enzymatic techniques (Boehringer-Mannheim, Mannheim, Germany).
Statistical analysis
Data are presented as mean values±SD or median values and interquartiles. Variables with skewed distribution were logarithmically transformed. Changes within and between groups were investigated by Student’s t-test and Mann–Whitney non-parametric test, as appropriate. The effects of Ang II on blood pressure, heart rate, markers of inflammation and haemostasis over time were analysed by one-way and two-way repeated measures ANOVA. Statistical analyses were performed by Statistica ’99 software, version 7.7 series: 1205 (Statsoft Inc., Tulsa, OK, USA). A probability (p) less than 0.05 was considered significant.
Results
Baseline characteristics (Table 1)
Systolic blood pressure and pulse pressure were higher in FH than in controls. By definition, lipid values differed between the groups.
Baseline characteristics and demographic information.

Data are presented as mean values±SD or as median and interquartiles, as appropriate. Significant differences between FH and controls are given as: *p<0.05, **p<0.01, ***p<0.001 and ****p<0.0001.
FH: familial hypercholesterolaemia; HOMA-IR: homeostasis model assessment of insulin resistance; HDL: high-density lipoprotein; LDL: low-density lipoprotein
Baseline values for markers of haemostasis and inflammation (Table 2)
PAI-1 activity and PAP concentrations were similar in FH and controls, as were F1+2 levels. Regarding CAT data we observed a higher amount of thrombin formed over time (i.e. a higher endogenous thrombin potential) and a higher maximal thrombin concentration generated (peak thrombin) in plasma from FH compared with findings in plasma from controls. The time dependent aspects of thrombin generation, that is, time until thrombin generation starts (lag time), time until maximum concentration of thrombin is achieved (time to peak thrombin) and the time until thrombin generation stops (time to tail), were similar in both groups. Plasma levels of IL-6 and CRP, and venous leukocyte counts, were similar in FH and controls, while plasma fibrinogen was higher in FH.
Baseline values for markers of inflammation, coagulation and fibrinolysis.
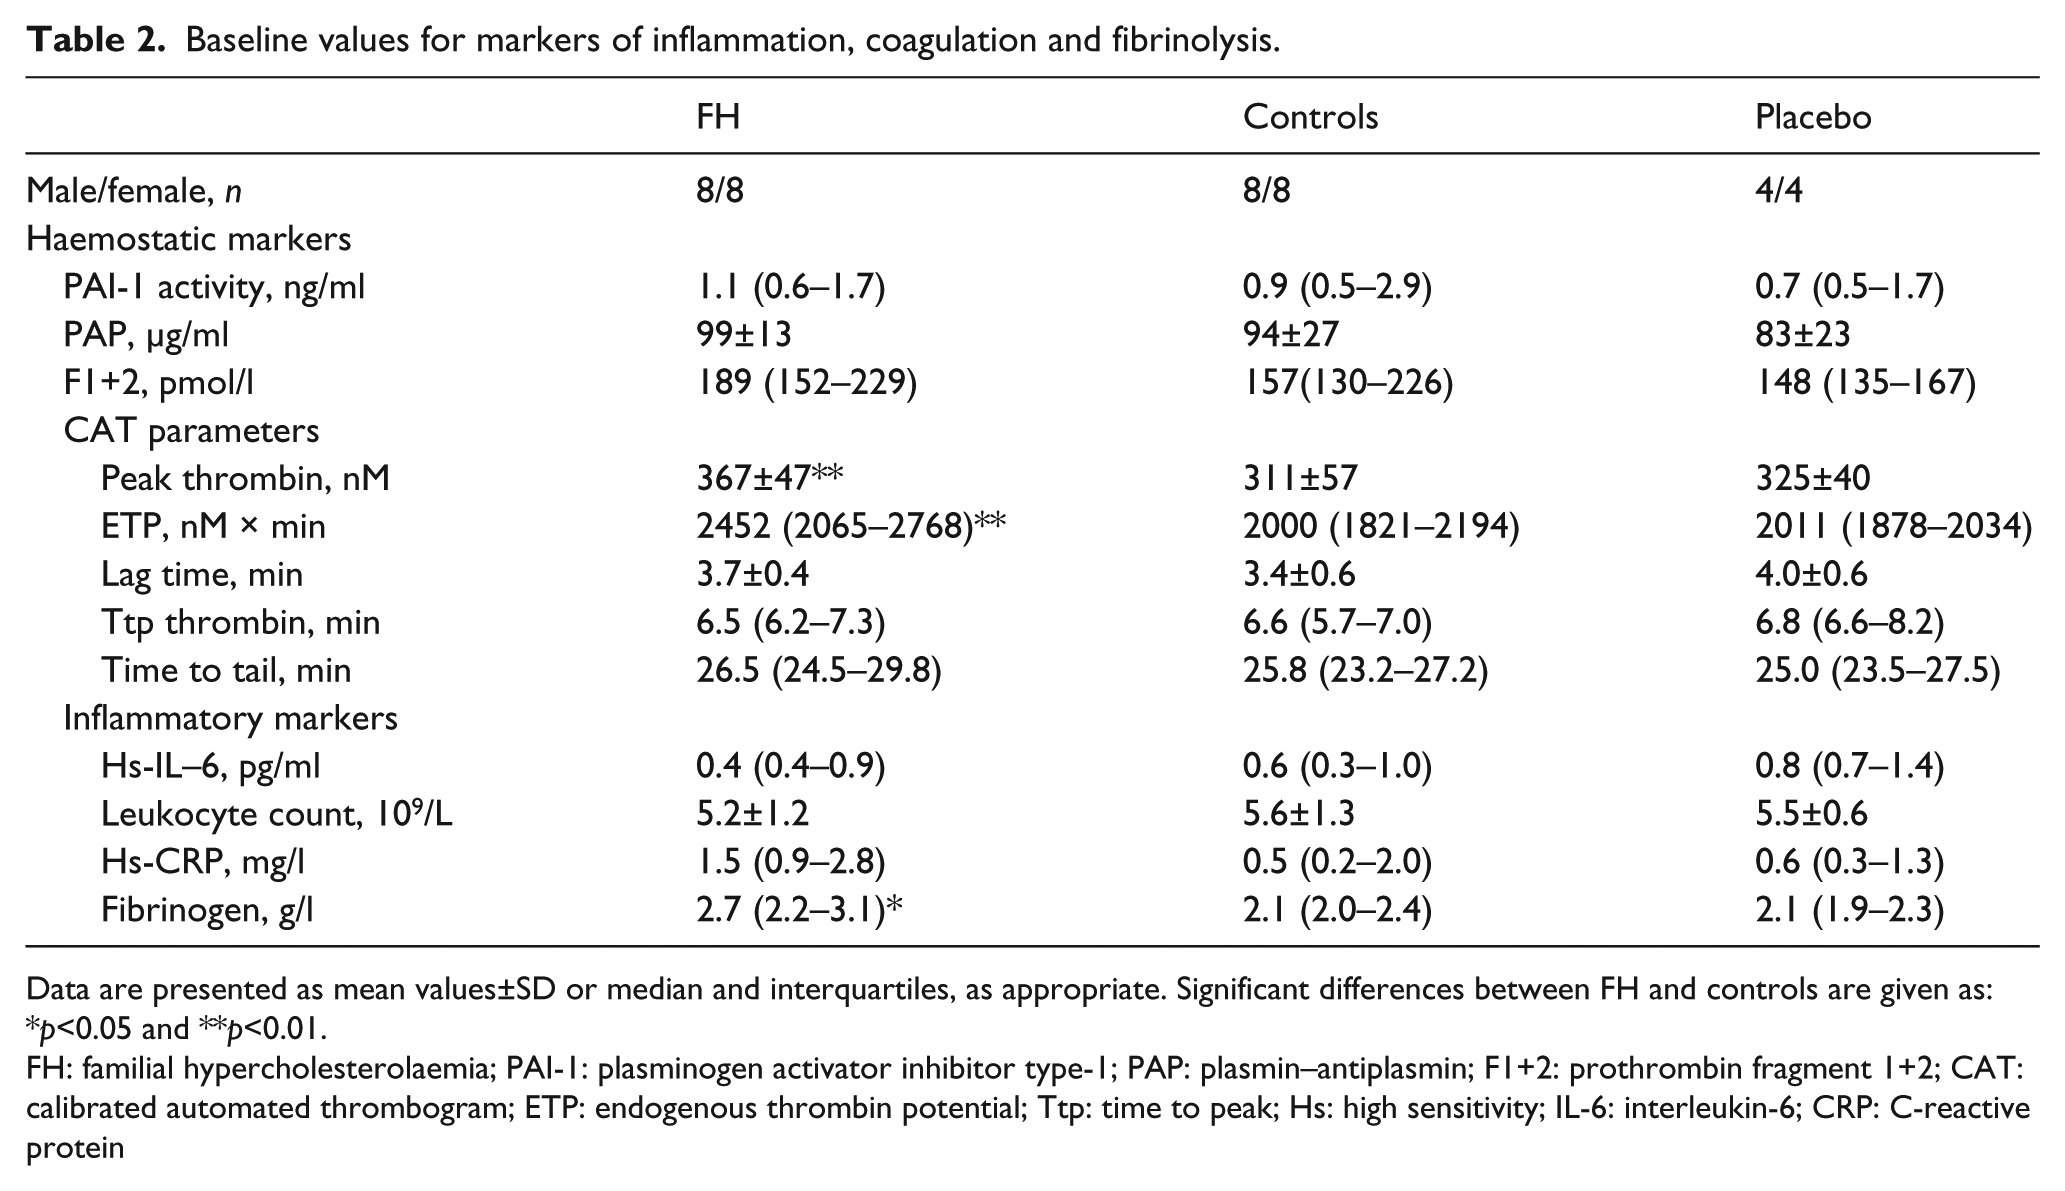
Data are presented as mean values±SD or median and interquartiles, as appropriate. Significant differences between FH and controls are given as: *p<0.05 and **p<0.01.
FH: familial hypercholesterolaemia; PAI-1: plasminogen activator inhibitor type-1; PAP: plasmin–antiplasmin; F1+2: prothrombin fragment 1+2; CAT: calibrated automated thrombogram; ETP: endogenous thrombin potential; Ttp: time to peak; Hs: high sensitivity; IL-6: interleukin-6; CRP: C-reactive protein
Effects of Ang II on blood pressure and heart rate (Table 3)
Blood pressure increased and decreased rapidly in close relation to Ang II infusion. Systolic and diastolic blood pressure responses were similar in FH and controls. During titration of Ang II infusion heart rate temporarily decreased, and after the end of Ang II infusion, heart rate was temporarily increased. The heart rate responses were similar in both groups.
Blood pressures and heart rate before (0 h), during (0.3 h and 3 h) and after (+0.3 h) the infusion of Ang II (FH and controls) and saline (placebo).

Data are presented as mean values±SD, n=16 for FH and for controls and n=8 for placebo. Statistical evaluation was performed by repeated measures ANOVA.
FH: Familial hypercholesterolaemia
According to the study protocol, Ang II infusion rate was reduced in seven patients with FH and in three controls due to an increase in mean arterial pressure by more than 25 mmHg. However, the maintenance doses of Ang II were similar in both FH and controls (7.5±2.8 vs. 8.7±2.3 ng/kg per min, p=0.18).
Effects of Ang II on haemostasis and inflammation (Figures 1–3 and Table 4)
During Ang II infusion, PAI-1 activity decreased and PAP increased in a similar manner in both FH and controls (Figure 1, left-hand panel). F1+2, peak thrombin (Figure 2, left-hand panel) or endogenous thrombin potential did not change during Ang II. However, thrombin generation was slightly delayed as reflected by increases in lag time, time to peak thrombin and time to tail in subjects with FH during Ang II (p time<0.01, p time<0.01 and p time<0.05, respectively), while no significant changes were observed in controls (Table 4). IL-6 and leukocyte count increased similarly in both FH and controls (Figure 3, left-hand panel). Fibrinogen tended to increase in FH (p time=0.07) and increased in controls (p time<0.05) (data not shown).
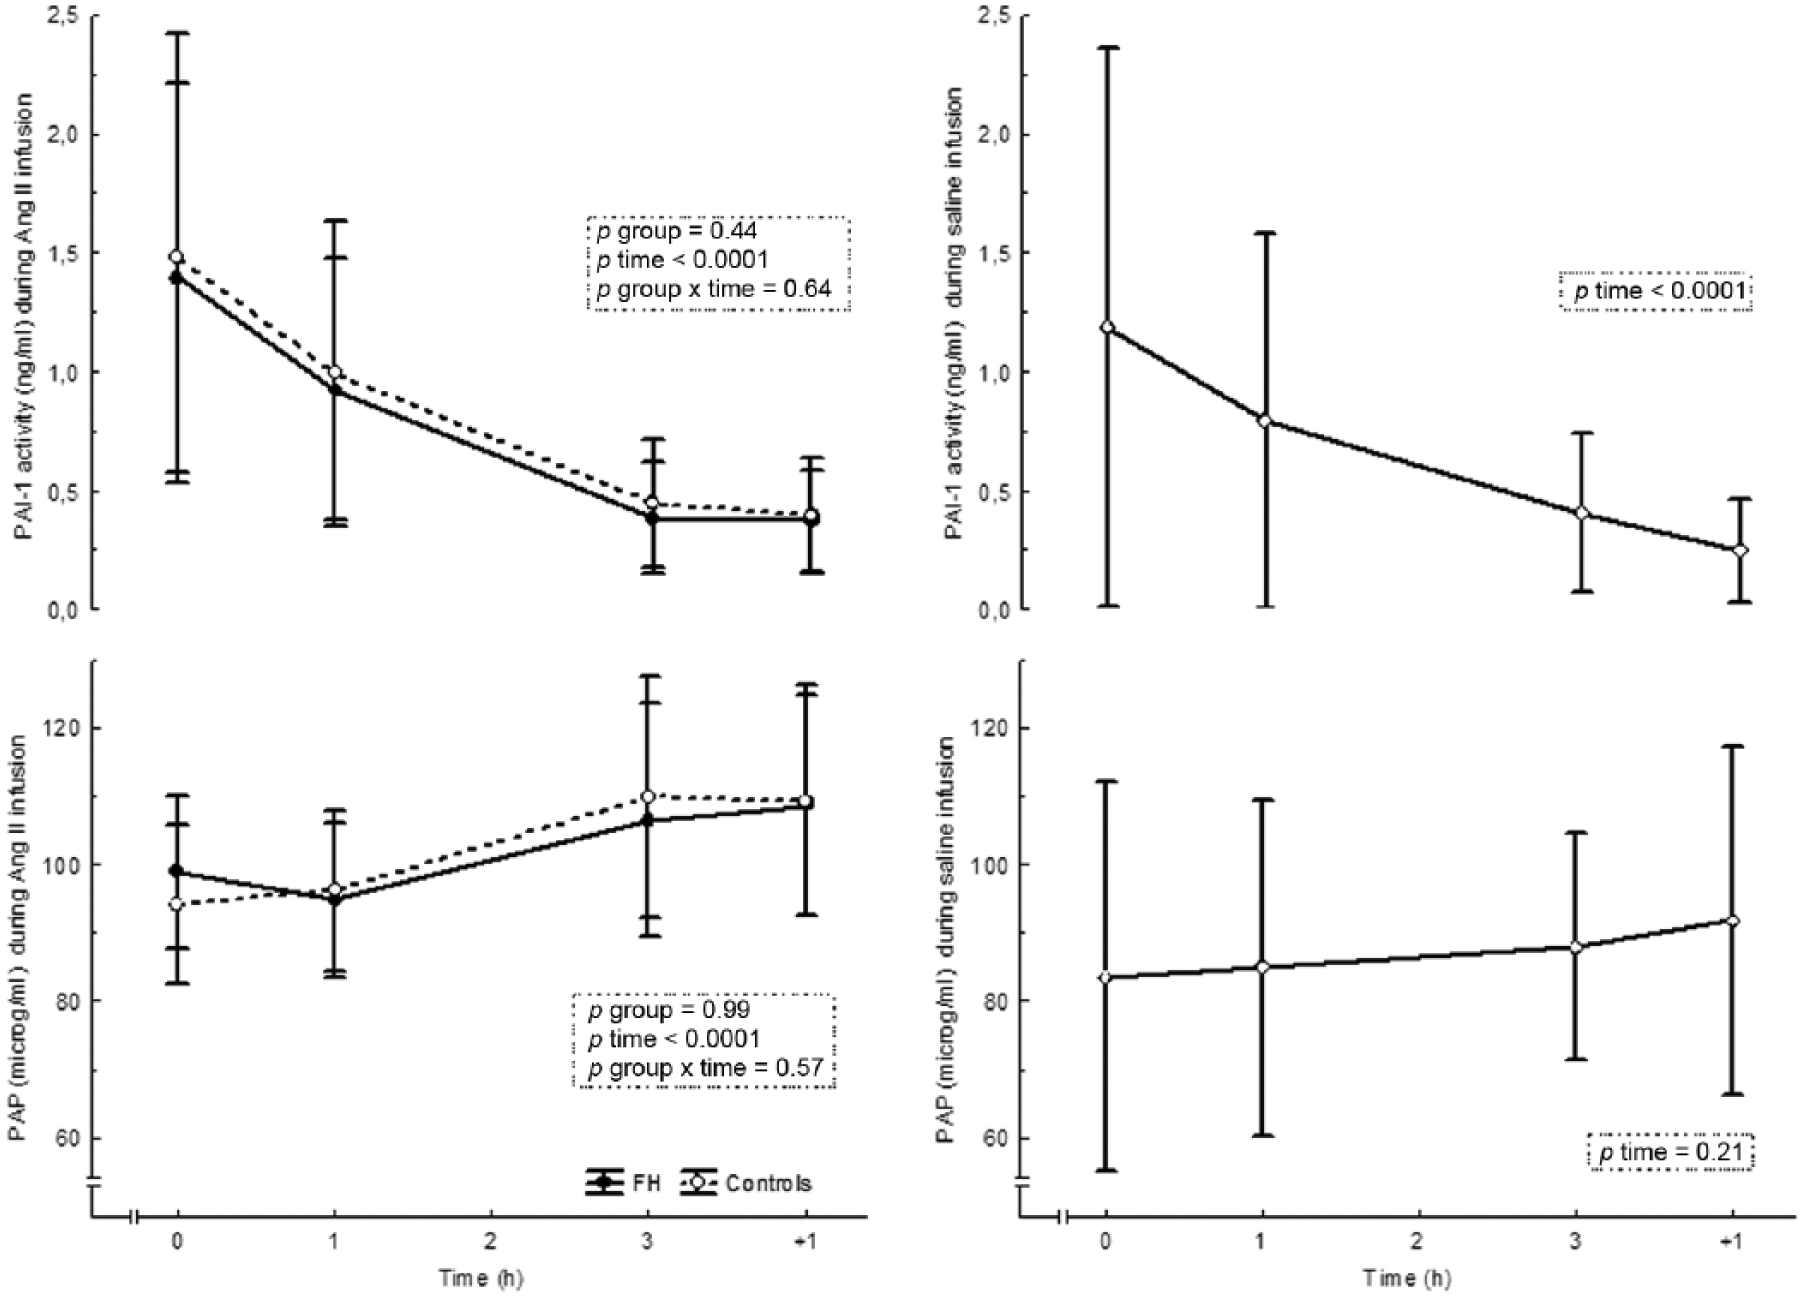
PAI-1 activity and PAP in FH and controls during Ang II infusion (left panel) and in placebo during saline infusion (right panel). Data are presented as mean values ± SD, n=16 in FH and in controls, n=8 in placebo.

F1+2 and CAT peak thrombin in FH and controls during Ang II infusion (left panel) and in placebo during saline infusion (right panel). Data are presented as mean values±SD, n=16 in FH and in controls, n=8 in placebo.

Hs-IL6 and leukocyte count in FH and controls during Ang II infusion (left panel) and in placebo during saline infusion (right panel). Data are presented as mean values±SD, n=16 in FH and in controls, n=8 in placebo.
Calibrated automated thrombogram parameters before (0 h), during (1 h and 3 h) and after (+1 h) the infusion of angiotensin II (FH and controls) and saline (placebo).
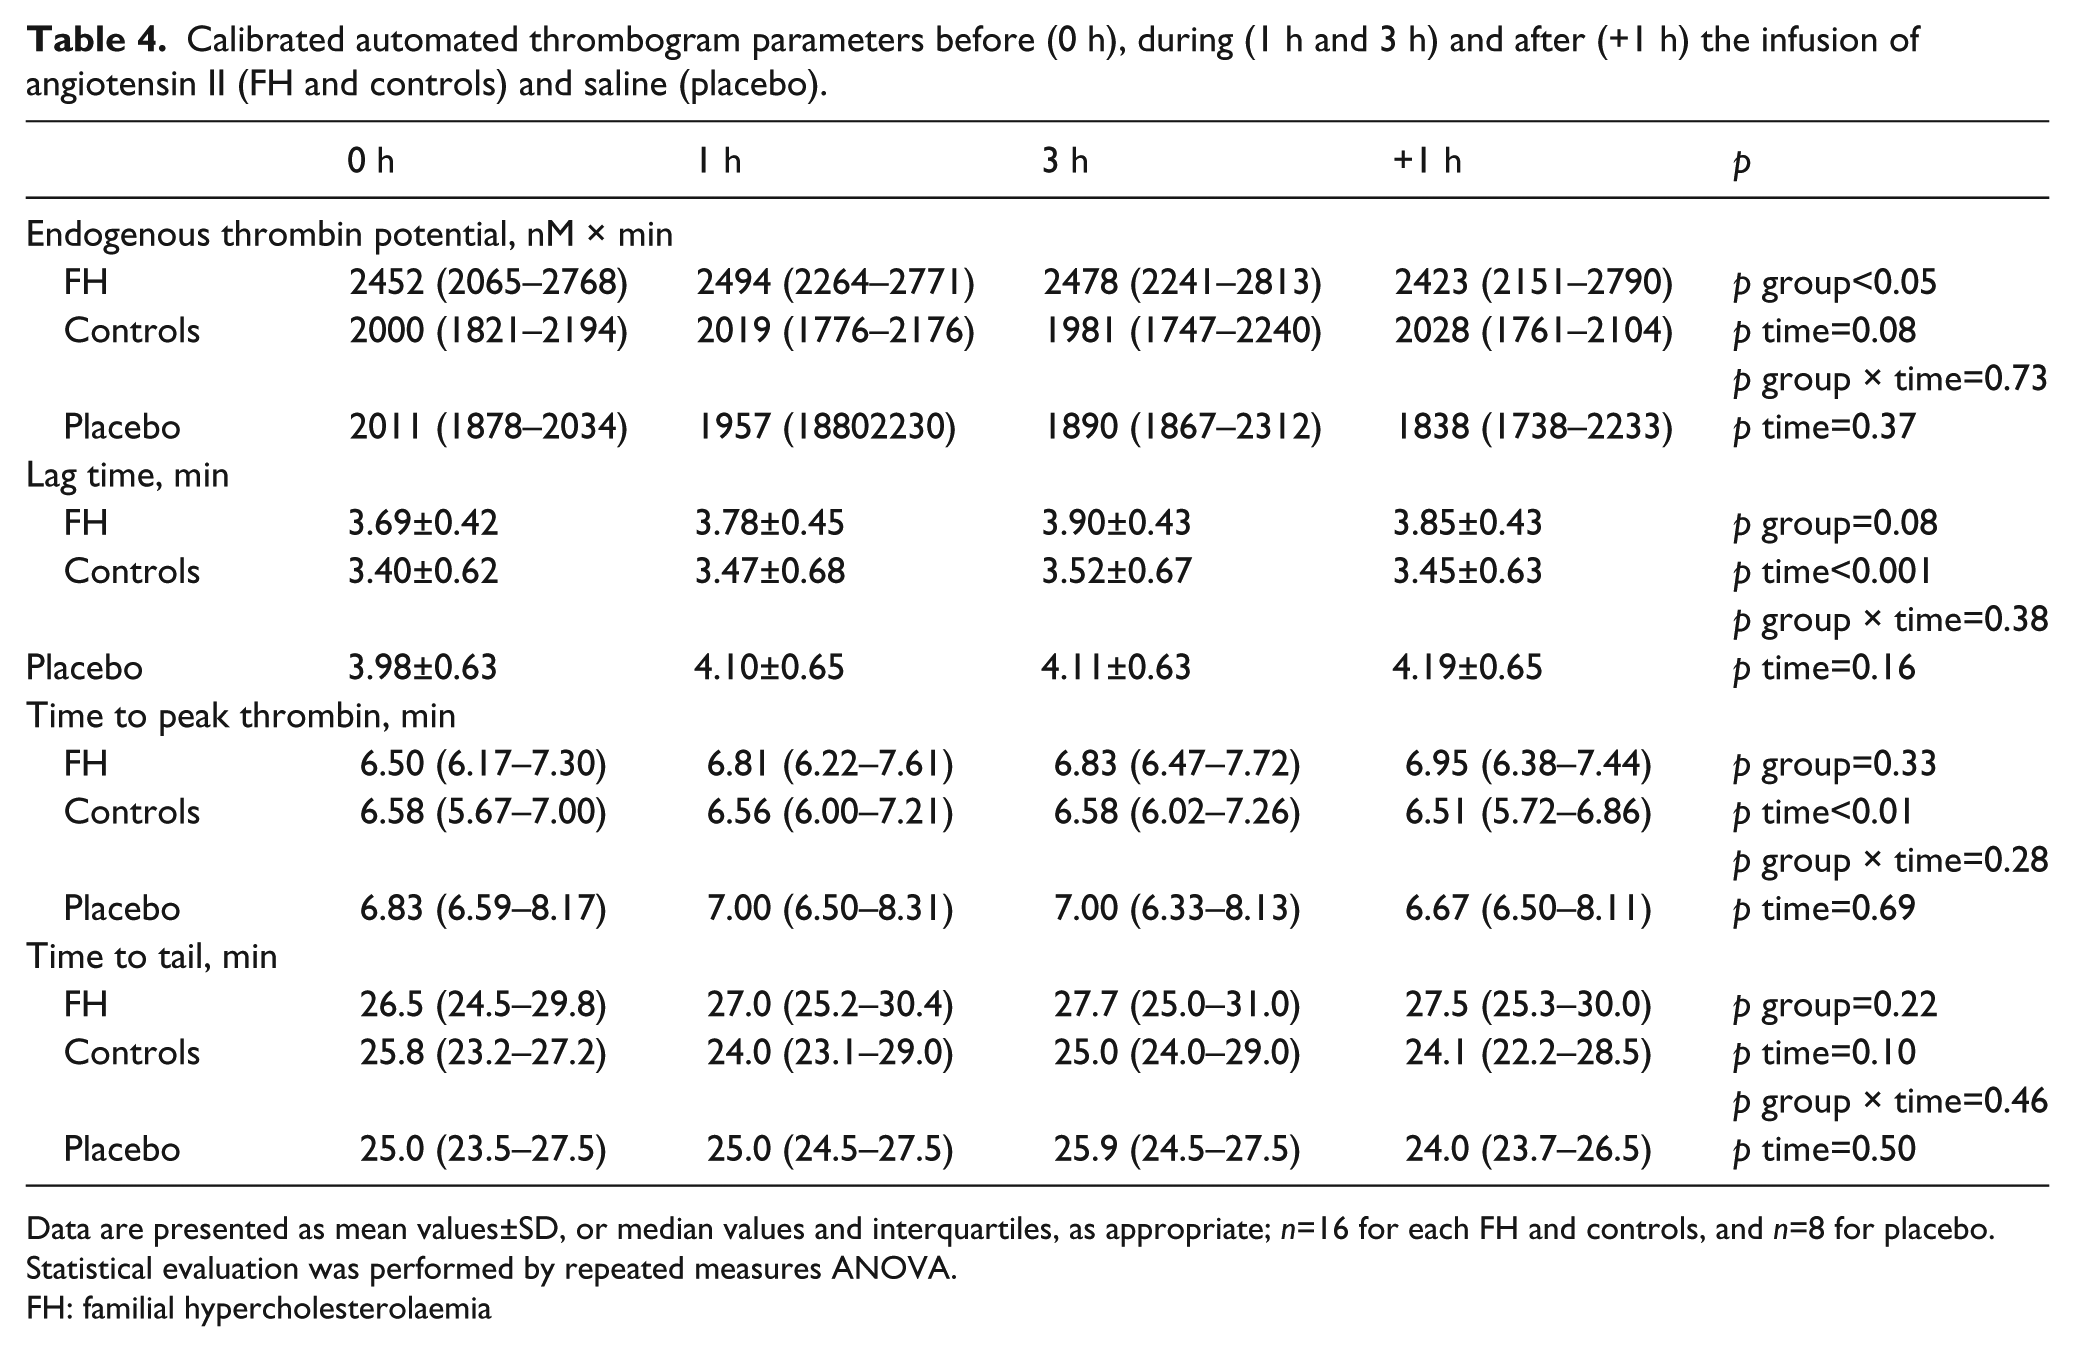
Data are presented as mean values±SD, or median values and interquartiles, as appropriate; n=16 for each FH and controls, and n=8 for placebo. Statistical evaluation was performed by repeated measures ANOVA.
FH: familial hypercholesterolaemia
Effects of placebo (Figures 1–3 and Table 2)
We observed significant decreases in PAI-1 activity and F1+2 during saline infusion (Figures 1–3, right-hand panels; Table 2) reflecting diurnal variations in fibrinolysis and thrombin generation, as previously described.27,28 We could not observe any diurnal variations in other markers.
Discussion
This is the first study to evaluate in vivo effects of Ang II on components of haemostasis and inflammation in subjects with FH. Our main findings were that subjects with FH have an increased thrombin generation potential, an intact fibrinolysis, and have no signs of an ongoing low-grade inflammation. Second, systemic infusion of Ang II induced a marked increase in IL-6, which may influence fibrinolysis and coagulation in the long-term setting.
FH and controls had similar baseline levels of PAI-1 activity, the most important inhibitor of tissue plasminogen activator (t-PA). Furthermore, PAP, which reflects plasmin formation and is considered a marker of in vivo fibrinolysis, was similar in FH and controls. Thus, FH subjects have an unaffected fibrinolytic system. This is in contrast to patients with familial combined hyperlipidaemia, where PAI-1 is elevated and fibrinolysis is disturbed.19,29,30
We observed decreased PAI-1 activity during Ang II infusion, similar in both groups, suggesting increased fibrinolytic capacity. However, the same findings were observed during placebo infusion. Ang II promotes endothelial PAI-1 release in vitro by stimulation of Ang II type 1 receptors and Ang IV type 4 receptors, 31 and blockers of these receptors independently inhibit PAI-1 release. 32 These findings in vitro are supported by one small study in healthy volunteers by Ridker and collaborators, 14 where plasma PAI-1 antigen levels increased following Ang II infusion, but several studies in man by us and others show decreased PAI-1 during short term Ang II infusion.16,17 We suggest that our observation reflects the diurnal decrease in PAI-1 activity during the morning hours.27,33
During Ang II infusion PAP increased in both FH and controls. Since alpha-2 antiplasmin has no diurnal variation, 27 in line with our findings during placebo infusion (see Figure 1), we suggest that the increase in PAP during Ang II infusion is due to a progressive increase in t-PA activity. This is in agreement with our previous findings, 16 showing that Ang II may increase fibrinolysis acutely. Indeed, the acute response to an inflammatory stimulation by endotoxins has been shown to induce a rapid release of t-PA from storage sites in vascular endothelial cells. 34
F1+2 is a marker of thrombin generation in vivo, and has been suggested to predict major coronary artery events. 35 A positive relationship between F1+2 in plasma and total cholesterol and LDL-C has been observed in hypercholesterolaemic subjects before the onset of atherosclerotic cardiovascular disease, 36 but we could not find any differences in F1+2 between FH and controls in the present study. However, the thrombin generation potential measured by CAT was significantly higher in FH than in controls, in line with the idea of FH being a prothrombotic state.
Inflammatory stimuli can prime the coagulation system, and one of the most central features is cytokine induced tissue factor expression. The responsible cytokine is IL-6. 37 However, F1+2 were unchanged in both FH and controls during Ang II, despite elevations in circulating IL-6 levels. F1+2 has a known diurnal decrease during morning, 28 as confirmed in our placebo infusion experiments. The lack of an expected decrease during Ang II may thus be interpreted as a slight increase in thrombin generation, as observed in a previous study by us in healthy patients. 18 However, Ang II infusion did not influence the concentration dependent thrombin generation variables endogenous thrombin potential or peak thrombin. Instead we observed a slight delaying effect of Ang II on the time dependent variables in FH patients (i.e. lag time, time to peak thrombin and time to tail became slightly prolonged). The interpretation of these observations is not clear. Prolonged time to peak thrombin has been observed in thrombotic conditions such as an acute coronary syndrome38,39 and has been proposed to be due to increased tissue factor pathway inhibitor plasma concentrations. 38 It may be speculated that increased endothelial perturbation in FH could lead to endothelial release of tissue factor pathway inhibitor during Ang II, which would bind to tissue factor added to the sample in the CAT analysis, leading to a delay in thrombin generation. One interpretation of these findings could be that FH subjects have an activated anticoagulant system. Taken together, our data on thrombin generation variables during Ang II are ambiguous, and we conclude that it is unlikely that Ang II affects thrombin generation to a major degree, in the short run.
Baseline IL-6, leukocyte count and CRP levels were similar in FH and the control group. IL-6 is the major cytokine responsible for hepatic production of CRP. 40 IL-6 is a proinflammatory cytokine, although it exerts anti-inflammatory properties under certain conditions. 41 In apparently healthy men IL-6 is associated with an increased risk of a future myocardial infarction. 41 Leukocyte count is an inflammatory marker that predicts coronary heart disease morbidity and mortality, 42 and the higher values observed in subjects with the metabolic syndrome confirm a link between inflammation and the metabolic syndrome. 43 In addition, hypertriglyceridaemia, but not hypercholesterolaemia, has been shown to be associated with increased leukocyte count. 44 CRP has proatherogenic and proinflammatory properties, where direct endothelial cell activation is one mechanism involved, and CRP is a sensitive marker of underlying systemic inflammation. 45 Accordingly, CRP levels are closely related to traditional coronary heart disease risk factors, in particular with obesity and visceral fat deposition, and with risk of future coronary heart disease in healthy individuals and patients with established coronary heart disease. 46 The relationship of CRP to total cholesterol and LDL-C remains ambiguous.47,48 In the presence of visceral obesity, adipose tissue secretes a number of inflammatory adipokines, including fibrinogen, CRP, IL-6 and angiotensinogen, which highlights the role of adipose tissue in the systemic inflammatory state that contributes to obesity associated vasculopathy and cardiovascular risk. 49 In addition, hyperinsulinaemia can induce IL-6 release in human adipose tissue and IL-6 and other markers of low-grade inflammation are related to the metabolic syndrome independent of obesity. 50 In our study, the subjects with FH had no signs of impaired insulin sensitivity, as indicated by plasma levels of glucose and serum levels of insulin by homeostasis model assessment of insulin resistance. These factors might partly explain why our FH subjects did not have any convincing signs of an on-going low-grade inflammation.
Ang II infusion led to a substantial increase in IL-6 and leukocyte count in both study groups. This extends previous findings in healthy subjects18,51,52 and is in agreement with our previous study in patients with familial combined hyperlipidaemia and healthy controls. 19 Although the exact origin of circulating IL-6 and leukocyte count by Ang II infusion cannot be determined from the present study, our results clearly indicate that Ang II has proinflammatory effects in man.
We found higher levels of fibrinogen in FH compared with controls. This is in line with other studies53,54 and may suggest incipient atherosclerosis in FH. 55 Fibrinogen is an acute phase reactant as well as a marker of the coagulation system, and also an independent risk factor for coronary heart disease.48,56 Simultaneous presence of elevated concentrations of fibrinogen and LDL-C has been observed to influence the earliest stages of plaque formation in the arterial wall. 55 Furthermore, smooth muscle cell proliferation and migration, stimulated by fibrinogen and fibrin degradation products, suggest that fibrinogen is involved in the earliest stages of plaque formation.55,57,58 Also, fibrinogen binds to intercellular adhesion molecule-1 and upregulates its gene expression, which promotes the adhesion of leukocytes, platelets and macrophages to endothelial cells. 59 Clearly, data support that fibrinogen is an inflammatory mediator. We speculate that the elevated levels of fibrinogen in FH subjects could suggest increased coagulation and signs of early, silent atherosclerosis.
The increase in fibrinogen levels was modest during Ang II, while IL-6, the major regulator of fibrinogen and other acute phase proteins, was markedly increased. However, fibrinogen responds to IL-6 with a time delay of several hours, and the duration of our experiments may not have been long enough to induce a major change in fibrinogen. 25
Our study warrants some caution in the interpretation of the results due to the following potential important limitations. First, we did not assess markers of inflammation and haemostasis for longer than one hour after stopping the Ang II infusion. We cannot exclude effects that may have occurred later, or that a prolonged time of infusion would have given additional effects. Second, the study groups were small, there were minor differences in age and body mass index between the groups, and FH subjects had higher systolic blood pressure and pulse pressure compared with the controls. We cannot exclude that this to some extent has influenced our results. Finally, we measured PAI-1 activity and PAP, but not t-PA activity. This would have been of interest as we observed elevated levels of PAP during Ang II infusion in the study groups.
In conclusion, patients with FH have an intact fibrinolysis, an increased thrombin generation potential (i.e. significantly higher levels of CAT; peak thrombin and endogenous thrombin potential), and no convincing signs of an ongoing low-grade inflammation. A systemic infusion of Ang II during three hours induces an increase in inflammation and may influence fibrinolysis and possibly thrombin generation, in particular in FH. Our findings suggest that: 1) patients with FH have an increased coagulation, rather than altered fibrinolysis or inflammation, which might contribute to the increased incidence of cardiovascular heart disease and premature death in FH; 2) Ang II acts as a proinflammatory agent, which might in part explain how the renin–angiotensin–aldosterone system exerts its effects on atherosclerosis; and 3) in the short run, Ang II appears to increase fibrinolysis but have small effects on coagulation.
Footnotes
Acknowledgements
We thank Ms Ann-Christine Salomonsson, Madeleine Derewand, Camilla Andersson and Graciela Elgue for expert technical assistance.
Conflict of interest
None declared.
Funding
This work was supported by the Swedish Heart-Lung Foundation and Karolinska Institutet Research Foundations, Stockholm, Sweden. ME is supported by a doctoral studentship from Futurum, Academy for Health and Care, Jönköping County Council, Sweden.