
Abstract
Introduction:
Cecropia pachystachya (CP) is a plant rich in polyphenols which inhibits the angiotensin-converting enzyme (ACE) in vitro. Angiotensin II (AII) has an important role in the renal lesion provoked by 5/6 nephrectomy (NE). This study evaluated the CP extract effect on renal lesions provoked by 5/6 NE.
Materials and methods:
Male Wistar rats submitted to 5/6 NE were treated or not treated with CP extract and followed for 90 days. Systemic blood pressure (SBP), albuminuria, renal functional and structural parameters, ACE activity, urinary levels of monocyte chemoattrant protein-1 (MCP-1) and transforming growth factor β (TGF-β) were evaluated.
Results:
Albuminuria and hypertension were less intense in the treated (NE+CP) group compared to the untreated (NE) group. CP extract treatment reduced the fall in glomerular filtration rate observed in NE rats. Glomerulosclerosis, tubulointerstitial lesions, increase of macrophages and AII positive cells in the renal cortex, as well as increases in renal ACE activity, urinary levels of MCP-1 and TGF-β were attenuated in NE rats by CP treatment.
Conclusions:
The treatment with CP extract reduced the SBP and functional and structural renal changes in 5/6 NE rats. These effects were associated with decreased AII expression, ACE activity and inflammation in the renal cortex.
Introduction
The 5/6 nephrectomy (5/6 NE) is a well established model of progressive renal injury that is characterized by systemic hypertension, loss of renal function, proteinuria and histological changes, similar to those observed in many human renal diseases.1,2 The increase in Angiotensin II (AII) production by the remaining kidney contributes to the development of glomerular hypertension and hypertrophy, resulting in progressive renal damage. 3 Hypertrophy and glomerular hypertension stretch the epithelial glomerular cells, resulting in severe loss of podocytes in the urine and proteinuria. 4 The leakage of proteins into tubular fluid provokes interstitial inflammation that aggravates renal lesions.5,6 Proteins can stimulate proximal tubular cells to synthesize chemokines, such as monocyte chemoattractant protein-1 (MCP-1), which recruit monocytes and macrophages. 7 The monocyte/macrophage inflammatory cells can produce AII, which also plays an important role in both inflammation and in renal hemodynamic changes. 4 AII is a potent inducer of transforming growth factor-β (TGF-β) and platelet-derived growth factor (PDGF), and these cytokines mediate some of the AII effects.8,9 TGF-β, one of the major fibrogenic cytokines, enhances the synthesis of matrix components and blocks matrix degradation, thereby promoting extracellular matrix (ECM) accumulation.8,10 TGF-β and AII can induce phenotypic modification in cells, causing them to express α-smooth muscle actin and increase the production of collagen and other ECM components. AII can also activate nuclear factor-кB (NF-кB) and mitogen-activated protein kinases (MAPK).11,12 The MAPK c-Jun N-terminal kinase (JNK) and NF-кB have been implicated in apoptosis, inflammation and the synthesis of inflammatory mediators. The renoprotection by antagonists of AII has been extensively demonstrated in models of nephropathies and in prospective controlled trials in patients with kidney disease.13–15
Cecropia pachystachya (CP) is a plant that grows in the rainforests of South America and is popularly known in Brazil as embauba. The plants that belong to the genus of Cecropia are traditionally used in several Latin American countries to treat hypertension, and pulmonary and cardiac disease. 16 CP extract is a rich source of polyphenols, mainly flavonoids, that have antioxidant and anti-inflammatory activities. 17–19 The antihypertensive and cardiovascular protective effects of flavonoids and procyanidins present in food were associated with angiotensin converting enzyme (ACE) inhibition.20,21 Polyphenols isolated from CP leaf extract such as orientin, isoorientin, isovitexin, isoquercitrin and procyanidins, can provoke ACE inhibition in vitro. 22 However, studies of the effect of CP extract on the progression of kidney disease have not been performed yet. Therefore, the aim of our study was to evaluate the effect of CP extract on renal injury provoked by 5/6 NE.
Materials and methods
Animals and experimental protocols
A total of 44 male Wistar rats (180–200 g) were used in this study. The animals were maintained in a total of four animals per cage at a temperature of 22°C with a light-dark cycle of 12 h and fed with standard diet ad libitum. The experiments were performed in accordance with the ethical principles for animal experimentation adopted by the Brazilian College of Animal Experimentation, and the Animal Experimentation Committee of the University of São Paulo at Ribeirão Preto School of Medicine approved the study protocol (COBEA/CETEA/FMRP-USP, protocol no. 050/2010). The animals were subjected to 5/6 NE according to the technique described previously. 23 The animals were anesthetized with 2.5% tribromoethanol solution in phosphate-buffered solution (PBS) (0.15 mol/l NaCl and 0.01 mol/l phosphate buffer, pH=7.4) administered intraperitoneally (1 ml/100 g). The right kidney was removed, and an infarction was provoked in two-thirds of the left kidney by ligation of one or two branches of the left renal artery. In the control group, a sham (S) operation with manipulation of the renal pedicles without causing ischemia or destruction of renal tissue was performed via laparotomy. The animals were divided into four groups, which received the following treatments beginning 15 days after surgery: sham group (S) (n=10): untreated animals that underwent the sham surgery; sham+CP (S+CP) (n=9): animals that underwent the sham surgery and were treated with CP extract; nephrectomized (NE) (n=11): 5/6 NE animals that were untreated; and nephrectomized+CP (NE+CP) (n=14): 5/6 NE animals that were treated with CP extract. After the surgical procedure, all groups were followed for a period of 90 days. Body weight (BW) and systolic blood pressure (SBP), measured by the tail-cuff method (CODA System, Kent Scientific, Torrington, Connecticut, USA) were evaluated each month from 15–90 days after surgery. The animals were placed in metabolic cages for 24 h, and urine samples were collected to quantify albumin excretion (AE).
Preparation, standardization and administration of CP extract
CP leaves were collected at Ribeirão Preto (–21.167925, –47.859927, altitude 546 m), State of São Paulo, Brazil. Botanical identification was performed by Gerson O Romão of the Herbarium of the Escola Superior de Agricultura Luiz de Queiroz of the University of São Paulo (ESALQ-USP), where the voucher specimen (ESA120140) was deposited. Leaves were washed and then dried in the shade for 10 days. The leaves were completely dehydrated at 40°C for three days. The dried CP leaves were ground in a mill (type Wyllie, Tecnal, Piracicaba, São Paulo, Brazil) to obtain the powder that was used to prepare the CP extract. The CP extract was prepared at a proportion of 2% w/v (weight of vegetable/ volume of distilled water) for 30 min at 72°C. The CP extract was then decanted for 10 min, vacuum filtered, frozen and lyophilized to determine the concentration. The process was repeated throughout the 75 days of the experiment. The CP extract was administered in amber glass drinkers given daily to the animals. Six samples in triplicate were lyophilized weekly before and during the experiment to verify the concentration of CP extract. Based on an evaluation of water consumption of the animals over a 24 h period, the CP extract was diluted for administration of a dose of 0.6 g/kg. The consumed volume (ml) of the extract per box was determined and the mean dose was evaluated during the treatment.
Determination of the main compounds of the CP extract
The determination of the constituents from CP was performed by Liquid Chromatography-Mass Spectra in MicroTOF Ic equipament (Bruker Daltonics). Separation was done using RP-amide (Ascentis-Supelco, Sigma-Aldrich) column (25 cm x 4.6 mm; 5 µM). The samples at 5 mg/ml were prepared in 0.1% formic acid and 10 µ[ was injected into the column with a flow of 1 ml/min. The constituents were eluted by linear gradient from 10 to 35% acetonitrile-water containing 0.1% formic acid in 30 min. The chromatography was monitored by diode array detection (DAD) at 280 nm and mass spectra. The constituents were characterized by the retention time (RT), mass spectrum and ultraviolet-visible spectrum.
Renal function studies
The albumin in urine samples was quantified by electroimmunoassay 24 and the glomerular filtration rate (GFR) was evaluated 90 days after surgery by inulin clearance. The rats were anesthetized with sodium thiopental (40 mg/kg, intraperitoneally). After tracheostomy, the femoral artery and vein were cannulated to collect blood samples and to inject fluids, respectively. The ureters were cannulated to collect urine. Urine samples were collected before the administration of inulin solution to analyze TGF-β and MCP-1. After this urine sample collection the rats received a priming inulin dose (12 mg/100 g diluted in PBS solution), followed by a maintenance inulin dose of 0.5 mg/min/100 g. After 60 min stabilization, urine was collected for 1 h, and the blood was sampled at 30 and 60 min. The kidneys were perfused through the aorta with PBS solution and removed for histological and immunohistochemical studies. The animals were killed via anesthesia overdose. Inulin was quantified in the plasma and urine samples by the method of Führ et al. 25 Sodium and potassium were measured in the plasma and urine by flame photometry (Micronal, model 262, São Paulo, Brazil), and urine osmolality was assessed by freezing point depression using an Osmometer (Fiske OS, Norwood, Massachusetts, USA).
Quantification of TGF-β and MCP-1 in urine
The urine samples collected by the ureter were immediately treated with 1 mM phenylmethylsulfonil fluoride (PMSF, Sigma Chemical Co, St. Louis, Missouri, USA) and stored at −70ºC until analysis. The TGF-β and MCP-1 quantification was performed by ELISA using commercial kits (Promega Corporation, Madison, Missouri, USA and Pierce, Rockford, USA, respectively). The median values of TGF-β and MCP-1 in the urine samples are expressed in pg of TGF-β or MCP-1 per mg creatinine.
Enzymatic activity assay
ACE catalytic activity was determined fluorimetrically as described by Friedland and Silverstein. 26 The renal cortex tissue was homogenized in borohydrate buffer 100 mM, pH 7.2, containing sucrose 340 mM, NaCl 300 mM and PMSF 10 mM (1 g tissue: 10 ml buffer). The homogenates were centrifuged at 5000 rpm, at 4°C for 10 min and the supernatant was frozen at −70oC until analyzed. An aliquot of plasma or kidney homogenate (10 µl) was incubated with 200 µl assay solution (ZPhe-HisLeu 1 mM, sodium borohydride buffer 100 mM, pH 8.3, NaCl 300 mM and ZnSO4 0.1 mM) for 10 min at 37°C. The enzymatic reaction was stopped by the addition of 1.5 ml of NaOH 280 mM. The liberated dipeptide, HL (His-Leu), was measured fluorimetrically (360 nm excitation and 465 nm emission) using a Tecan Infinit F200 equipment as follows. 27 One hundred of o-phthaldialdehyde (20 mg/ml) diluted in methanol was added and after 10 min the solution was acidified with 200 µl 3N HCl and centrifuge at 3000 rpm for 10 min at room temperate. The standard curve was obtained using varying concentrations of L-HL and it showed a linear relation between relative fluorescence and HL concentration. All the assays were performed in duplicate. The values median of the ACE activity in the renal cortex or plasma are expressed in nmol/mg of protein or mU/ml of HL produced, respectively.
Light microscopy
Histological sections (3 µM) were stained with Masson’s trichrome for examination under a light microscope. The incidence of glomerulosclerosis was determined by scoring 50 glomeruli within a section of each kidney. The glomerular sclerosis and tubulointerstitial lesion incidence were evaluated by scores that reflected changes in the extent of the lesion (0: 0–5%, 1: 5–25%, 2: 25–50%, 3: 50–75%, 4: >75%), and mean values per kidney were calculated. The fractional interstitial area in the renal cortex was determined by morphometry with a light camera connected to analyzer. Twenty grid fields (measuring 0.200 mm2) were evaluated in the renal cortex of each kidney. Interstitial areas were first manually encircled on a video screen and then determined by computerized morphometry (Axion version 4.8.3, Zeiss) and the mean values per kidney were calculated.
Immunohistochemical analysis
The sections were incubated at 4°C overnight with 1/30 anti p-JNK monoclonal antibody (Santa Cruz Biotechnology, Santa Cruz, California, USA), 1/200 anti-AII polyclonal antibody (Peninsula Laboratories, San Carlos, USA), or for 1 h with 1/1000 anti-ED1 monoclonal antibody that only reacts with cytoplasmic antigen present in macrophages and monocytes (Serotec, Oxford, UK), 1/500 anti-vimentin and 1/200 anti-desmin monoclonal antibodies (Dako, Glostrup, Denmark). The reaction product was detected with an avidin-biotin-peroxidase complex (Vector Laboratories, Burlingame, California, USA). Negative controls were created by replacing the primary antibody with normal mouse immunoglobulin G (IgG) or rabbit IgG for monoclonal or polyclonal antibodies, respectively, at equivalent concentrations. The color reaction was developed with immunoglobulin G (IgG, Sigma Chemical Company, St. Louis, Missouri, USA).
The sections were counterstained with methyl green or with Harris hematoxylin, dehydrated and mounted. To evaluate the immunoperoxidase staining for p-JNK, vimentin, and the cortical glomeruli and tubulointerstitial region were semi-quantitatively graded through examination of 50 glomeruli and 30 grid fields (measuring 0.200 mm2), and the mean score per kidney was calculated. 28 Vimentin was used as a marker of tubular cell lesions and was assessed only in the tubulointerstitial area. 29 Desmin was used as a marker of podocyte lesions and was only evaluated at the glomerular edge. 29 The scores mainly reflected changes in the extent, rather than the intensity, of staining and depended on the percentage of glomeruli or grid field showing positive staining: 0: 0–5%, 1: 5–25%, 2: 25–50%, 3: 50–75% and 4: >75%.
The number of ED1 (macrophages/monocytes)-positive cells (glomeruli and renal cortical tubulointerstitium) and of AII (cortical tubulointerstitium) were counted through the examination of 50 glomeruli and 30 grid fields (measuring 0.200 mm2), respectively, and the mean counts per kidney were calculated.
Statistical analysis
One way analysis of variance (ANOVA) with the Newman-Keuls comparison test was used for the data that were normally distributed (SBP, BW and AII) or that showed a normal distribution after log10 transformation (AE, ED1+ and TGF-β). Those data are expressed as mean and standard error of the mean (SEM) or geometric means and confidence intervals, respectively. For data related to other studied parameters, we used nonparametric Kruskall-Wallis test with Dunn’s post-test. Those data are expressed as median and interquartile. The Mann-Whitney test was performed for analysis of the fractional interstitial area and mean consumed dose. Statistical analyses were performed using GraphPad Prism version 5.0 for Windows, GraphPad Software, San Diego, California, USA. The level of statistical significance was set at p<0.05.
Results
Determination and control of the CP extract dose
CP extract dose was determined from a previously pilot experiment based on the effect in SBP after 15 days of the treatment. The rats consumed a daily dose of approximately 0.6 g/kg. There was no difference (p>0.05) between the mean dose consumed by the groups treated with CP extract [S+CP (0.55±0.04 g/kg) and NE+CP (0.63±0.03 g/kg)] during the 75 days of the treatment.
Determination of the main components of the CP extract
Two predominant peaks detected at 280 nm in the Liquid Chromatography-Electrospray Ionization-Mass Spectrometry (LC-ESI-MS+) analysis of CP extract represent the chlorogenic acid and orientin. The presence of chlorogenic acid was confirmed by comparison with a UV/VIS spectrum of the authentic sample. The RT (12.5 min) and ESI/MS+ detection (m/z 355) matched. Chlorogenic acid was the predominant peak in CP extract, followed by orientin. The identity of orientin was confirmed by RT (14.9 min) and the fragmentation patterns in ESI/MS-. It has been shown that orientin inhibits ACE in in vitro studies. 22
Systolic pressure blood (SBP), body weight and albumin excretion (AE)
The 5/6 NE rats showed a significant increase in SBP and AE compared to the sham rats. However, the increase in SBP was less intense on days 30 and 90 (p<0.01) and in AE on days 30 and 60 (p<0.05) in NE+CP rats compared to NE rats (Table 1). There was no difference in body weight between 5/6 NE groups (Table 1).
Body weight (BW), systolic blood pressure (SBP) and urinary albumin excretion (AE) in control rats and in rats subjected to 5/6 nephrectomy (NE), treated or untreated with Cecropia pachystachya (CP) extract 15 to 90 days after surgery.

S: sham. Data are presented as mean±standard error of the mean (SEM; BW and SBP) or geometric mean and confidence intervals (AE). ap<0.001 vs S, bp<0.001 vs S+CP, cp<0.01 vs NE, dp<0.001 vs NE, ep<0.05 vs NE.
Renal function studies
The 5/6 NE rats presented reduction in GFR and increase in the sodium and potassium fractional excretion compared to rats from sham groups. Treatment with CP extract reduced all these alterations. However, the change in urine osmolality was not modified by treatment with CP extract (Table 2).
Urine osmolality (Uosm), sodium and potassium fractional excretions (FENa+ and FEK+), and glomerular filtration rate (GFR) in control rats and in rats subjected to 5/6 nephrectomy (NE) treated or untreated with Cecropia pachystachya (CP) extract, 90 days after the surgery.

S: sham. Data are presented as median and interquartile range (25%;75%) (Uosm, FENa+ and FEK+) or mean±standard error of the mean (SEM; GFR). ap<0.05, bp<0.01, cp<0.001 vs S, dp<0.05, ep<0.01, fp<0.001 vs S+CP, gp<0.05 vs NE.
TGF-β and MCP-1 urinary excretion
Increase in the urinary excretion of TGF-β and MCP-1 was observed in 5/6 NE rats when compared to sham groups. These alterations were attenuated by CP extract treatment (Table 3). Data from the S+CP group are not shown.
Transforming growth factor β (TGF-β) and monocyte chemoattrant protein-1 (MCP-1) urinary excretions and angiotensin-converting enzyme (ACE) activity in plasma and renal tissue of rats subjected to 5/6 nephrectomy (NE), treated or untreated with Cecropia pachystachya (CP) extract, 90 days after surgery.

S: sham. Data are presented as geometric mean and confidence intervals (TGF-β) or median and interquartile (25%;75%) (MCP-1 and ACE activity). ap<0.001 vs S, bp<0.05 vs S, cp<0.01 vs NE, dp<0.001 vs NE.
Enzymatic activity assay
Increase in ACE activity in both renal tissue and plasma was observed in 5/6 NE rats when compared to sham group. The increased activity in renal tissue was attenuated by CP extract treatment (Table 3). There was no significant difference in ACE activity between S and S+CP groups (data not shown).
Light microscopy
Light microscopy studies of the renal cortex of rats that underwent 5/6 NE revealed the following morphological features, which are characteristic of this model: glomerulosclerosis, tubular lumen dilation with denuded basement membrane, swelling/flattening of proximal tubular cells with brush border loss, tubular atrophy, and an increase in the interstitial area with inflammatory cell infiltrates. These histological changes were less intense in the NE+CP rats (Figure 1(a)–(e)). The score for glomerulosclerosis was higher in the NE rats untreated compared to NE+CP rats and the fractional relative interstitial area was also higher in these rats (p<0.05, NE vs NE+CP) (Figure 1(f)).
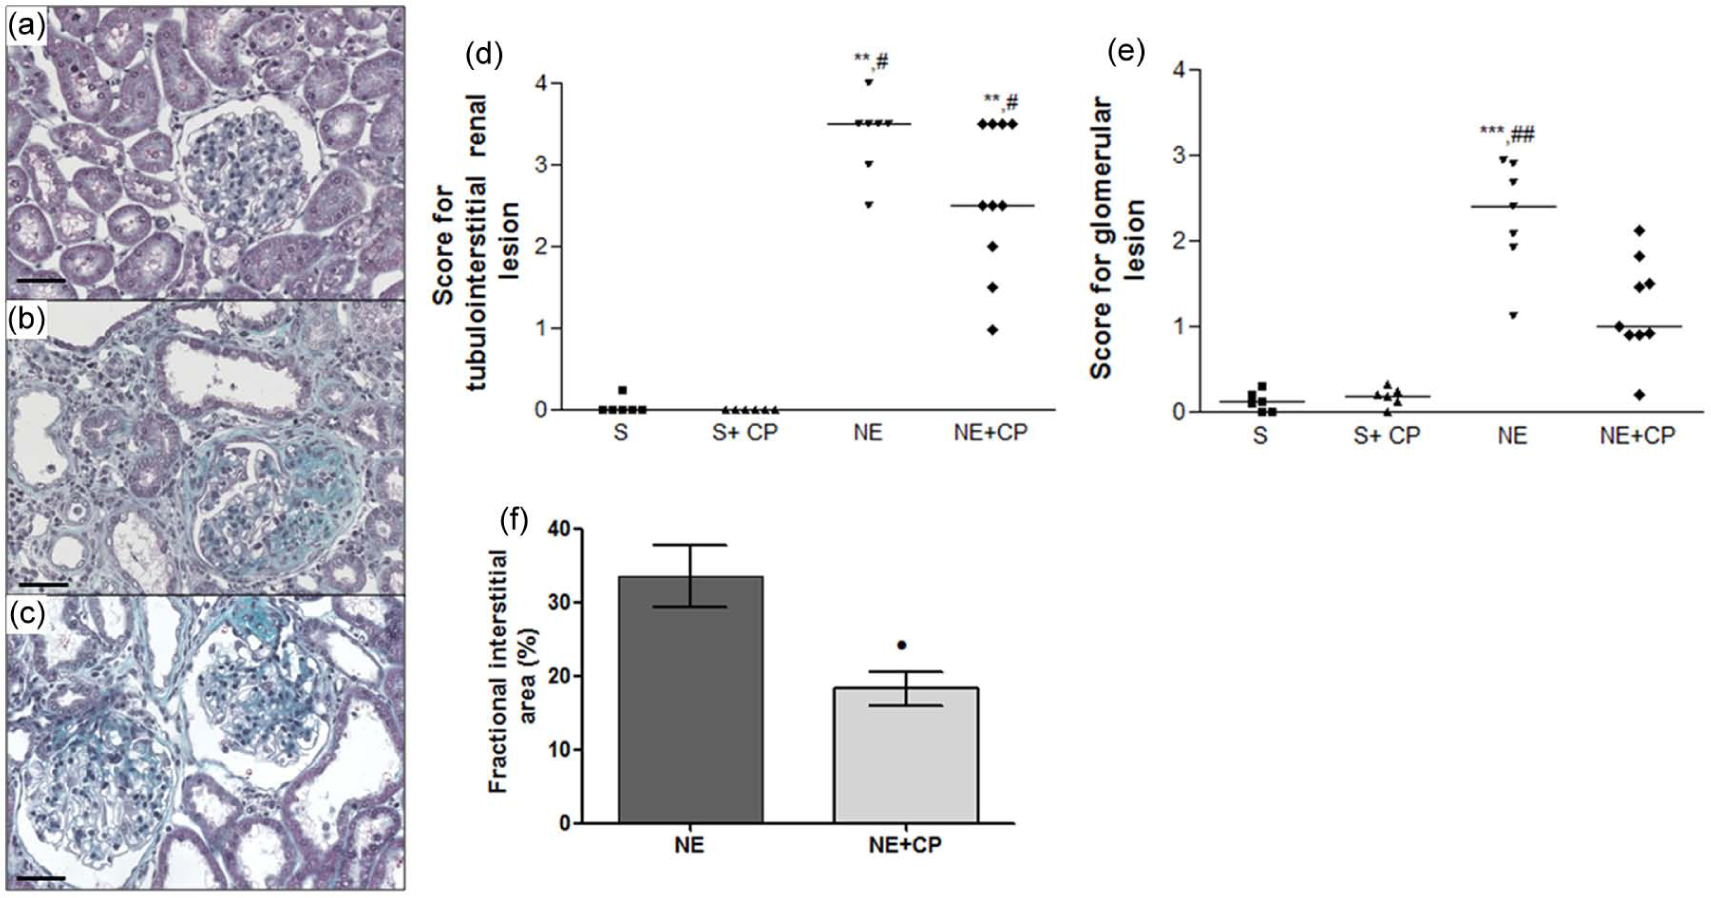
Representative Masson’s trichrome-stained histological sections from (a) control, (b) 5/6 nephrectomy (NE), and (c) NE+Cecropia pachystachya (CP) groups, 90 days after surgery. Note that the glomerular sclerosis and the interstitial lesions in (b) are more intense than in (c). Bars indicate 50 µm. Score for (d) tubulointerstitial and (e) glomerular lesions from S (squares), S+CP (triangles), NE (inverted triangles), and NE+CP (diamonds) groups, and (f) fractional interstitial area of the rats subjected to 5/6 NE (NE and NE+CP), 90 days after surgery. Horizontal lines represent the median in (d) and (e) or mean in (f). **p<0.01, ***p<0.001 vs sham (S); #p<0.05, ##p<0.01 vs S+CP; •p<0.05 NE.
Immunohistochemical analysis
The expressions of vimentin in the tubulointerstitial area and desmin at the glomerular edge were higher in the renal cortex of 5/6 NE rats than in sham rats. These increases were attenuated in NE rats by treatment with the CP extract (Figure 2). The increased p-JNK expression and the number of ED1-positive cells in the renal cortex tubulointerstitium and glomeruli observed in 5/6 NE rats were also lower in NE+CP rats (Figure 3). The number of AII positive cells in the tubulointerstitial area from the renal cortex was higher in the NE rats compared to the sham rats and this increase was less intense in NE+CP group (Figure 4).

Representative immunostaining for (a)–(c) vimentin and (d)–(f) desmin from (a), (d) control, (b), (e) 5/6 nephrectomy (NE) and (c), (f) NE+ Cecropia pachystachya (CP) groups, respectively, 90 days after surgery. Note that the expression of vimentin in the tubular cells and of desmin at glomerular edge are higher in (b) and (e) than in (c) and (f), respectively. Bars indicate 50 µm. Scores for (g) vimentin in the renal cortical tubulointerstitium per area of renal cortex measuring 0.200 mm2 and for (h) desmin at glomerular edge in control rats (sham (S) and S+CP) and rats subjected to 5/6 NE, treated or untreated with CP extract (NE and NE+CP), 90 days after surgery. Horizontal lines represent the median. **p<0.01, ***p<0.001 vs S; #p<0.05, ##p<0.01, ###p <0.001 vs S+CP.

Representative immunostaining for (a)–(c) p-JNK and (d)–(f) ED1-positive cells (macrophages) from Control (a), (d), NE (b), (e), and NE+CP (c), (f) groups, 90 days after surgery. Note that the expression of p-JNK and the number of ED1-positive cells in the tubular cells and glomerulus are higher in (b) and (e) than in (c) and (f). Bars indicate 50 µm. Scores for p-JNK (g), (h) and number of ED1-positive cells (i) and (j) in the renal cortex tubulointerstitium (g), (i) and glomerulus (h), (j), in control rats (sham (S)) and rats subjected to 5/6 NE (NE and NE+CP), treated or untreated with CP extract, 90 days after surgery. Horizontal lines represent median (g), (h) and bars represent geometric mean (i), (j)). *p<0.05, **p<0.01, ***p<0.001 vs S; ##p<0.01, ###p<0.001 vs S+CP.

Representative immunostaining for angiotensin II (AII) (arrows) from (a) control, (b) nephrectomy (NE), and (c) NE+CP (Cecropia pachystachya) groups, 90 days after surgery. Note that the expression of AII is higher in (b) than in (c). Bars indicate 50 µm. Number of AII-positive cells (d) in the renal tubulointerstitium per area of renal cortex measuring 0.200 mm2 in control rats (S) and rats subjected to 5/6 NE (NE and NE+CP), treated or untreated with CP extract, 90 days after surgery. The data are expressed as the mean±standard error of the mean (SEM). S: sham. ***p<0.001 vs S; ##p<0.01 vs S+CP; ••p<0.01 NE.
Discussion
The results of this study show that treatment with CP extract reduced the blood pressure and the functional and structural renal changes in 5/6 NE rats. These effects were associated with the reductions of the number of positive cells for AII, as well as the ACE activity in the renal cortex of CP-treated rats. The increase in AII renal content could be due to higher plasma levels of AII and/or the enhancement of renal AII production.30,31 AII has an important role in the renal lesions observed in 5/6 NE rats. In addition to its effect on renal and systemic hemodynamics, AII also contributes to the inflammation and fibrosis observed in this model of chronic kidney disease. 4 The AII effects may be mediated in part by activation of TGF-β, NF-κB and JNK pathways.6,7,9,13 In this study we also observed that the increased expression of p-JNK in the 5/6 NE rats was attenuated by CP extract treatment. Activation of the NF-κB and JNK pathways induces apoptosis and the synthesis of inflammatory mediators (cytokines, growth factors and adhesion molecules as well as macrophage and monocyte chemotactic factors), leading to kidney damage.7,13
The recruitment and activation of macrophages is one pathway whereby AII contributed for the impaired functional and structural renal in the 5/6 NE. We observed a significant reduction in the number of macrophages in the glomeruli and tubulointerstitial area of the renal cortex from 5/6 NE rats treated with CP extract. The reduction of these inflammatory cells in the renal cortex of the treated rats was associated with the reduction of AII and p-JNK expressions, and of ACE activity in renal cortex and of the urinary levels of TGF-β and MCP-1. Macrophages can release cytokines such as interleukin-1, TGF-β and AII, which can intensify inflammation and fibrosis observed in the kidney from these rats. 32 The orientin and chlorogenic acid, the main compounds identified in CP extract, are well known as potent anti-inflammatory and anti-tumoral agents.18,19 It was also shown by in vitro studies that orientin inhibits ACE 22 suggesting that the CP extract effects in the reduction of the renal injury can be related at least in part with the decrease of the AII production in the NE rats.
The reduction of the urinary excretion of TGF-β in the NE+CP rats could be contributed with the reduction of glomerulosclerosis and the reduction of tubulointerstitial lesions in the NE+CP rats. There is evidence that urinary TGF-β is derived from renal biosynthesis and not from plasma.1,33 In previous clinical and experimental studies performed in our laboratory, we observed a correlation between the rate of urinary TGF-β excretion and the incidence of glomerular sclerosis and tubule interstitial lesions.1,34 Together, TGF-β and AII can induce phenotypic modification in cells, causing them to express α-smooth muscle actin and increase the production of collagen and other ECM components, which was evidenced by the higher fractional interstitial area in renal cortex from NE compared to NE+CP rats.
CP extract treatment also attenuated the podocyte lesions in the NE rats and this was evidenced by reduction of desmin expression at the glomerular edge, a sensitive marker of podocyte lesions. 29 The reduction in podocyte damage in the NE+CP rats can explain the decreased albuminuria in these animals until 60 days after surgery. There is a correlation between urinary protein levels and the rate of renal function decline in patients with glomerulonephritis.35,36 The albumin handling by cells of the proximal tubule can also stimulate their production of pro-inflammatory cytokines. 7 There was a reduction in the tubulointerstitial lesions in the 5/6 NE rats treated with CP extract evidenced by reduced expression of vimentin, and of the relative interstitial area. Vimentin is expressed in the tubular cells only when they are proliferating. 29 The improvement of the tubular injury was associated with the decrease in sodium and potassium fractional excretion in the NE+CP rats.
In conclusion, the treatment with CP extract reduced the SBP and functional and structural renal changes in the rats submitted to 5/6 NE. These effects were associated with the decrease of macrophage infiltration, ACE activity and AII expression in the renal cortex of NE+CP rats. The reduction of macrophages and AII in the renal cortex of the rats treated with CP extract, can be explained, at least in part, by the ACE inhibition by some components of CP extract such as orientin. Renal and plasma ACE activity was increased in NE rats compared to S rats, but decreased in the NE+CP group suggesting an ACE inhibition by CP extract. Renal ACE activity was inhibited in 67% of NE rats by treatment with CP extract, differing from plasma ACE that was inhibited in around 12.5%. However, tissue AII generation by ACE does not run in parallel with AII generation in the circulation. These results showed that in 5/6 NE rats the decrease of renal injury and hypertension by CP extract was more related to renal than to plasma ACE inhibition. However, further research is required to test the ACE inhibitory activity in vivo of isolated components of CP extract.
Footnotes
Acknowledgements
The authors are grateful to Rubens Fernando de Melo, Flávio Henrique Leite, Guilherme de Paula Lemos and Antonio Márcio Scatolini for their expert technical assistance.
Conflict of interest
The authors declare that there are no conflicts of interest.
Funding
The research was supported by grants from Fundação de Amparo à Pesquisa do Estado de São Paulo, Grant number: 11/50391-0, Conselho Nacional de Desenvolvimento Científico e Tecnológico and Coordenação de Aperfeiçoamento de Pessoal do Nível Superior. Heloísa DC Francescato, Roberto S Costa, Cleonice GA Silva and Terezila M Coimbra are recipients of Conselho Nacional de Desenvolvimento Científico e Tecnológico, DF, Brazil, fellowships.