
Abstract
Introduction:
Sodium sensitivity (SS) is a phenomenon in which significant changes in blood pressure (BP) are observed based on sodium intake. The renin–angiotensin–aldosterone system plays a critical role in sodium handling and hypertension. We identified the specific responses of renin and aldosterone based on dietary sodium intake and revealed the relationship between these hormonal changes and dietary sodium intake in patients with SS.
Materials and methods:
In total, 61 subjects were available to analyze full data including plasma renin activity (PRA) and aldosterone. Participants were given a low-sodium DASH diet (LSD) for 7 days and a high-sodium DASH diet (HSD) for the following 7 days.
Results:
SS was found in five (14.71%) in normotensives, and 14 (51.85%) in hypertensives. In sodium-resistant (SR) subjects, both PRA and aldosterone decreased significantly after consuming HSD. Moreover, a significant correlation was observed between PRA and aldosterone in SR subjects. In contrast, only hypertensive subjects showed a marked fall in PRA after consuming HSD (1.299 ± 0.904 vs. 0.593 ± 0.479) among SS subjects.
Conclusions:
This study demonstrated the different responses of renin and aldosterone in SS and SR subjects based on dietary sodium intake whether or not they had hypertension.
Introduction
Since sodium sensitivity (SS) was first reported, 1 numerous definitions and methods to depict SS have been developed and applied in various studies. The common consensus about SS is that there is the tendency in some individuals for blood pressure (BP) to decrease during salt restriction and increase during salt repletion. 2 Despite the difficulties comparing different studies, the prevalence of SS is approximately 20% in non-hypertensives and about 50% in hypertensives.1-4 In Koreans, SS is found in 18% of non-hypertensive and 52% of hypertensive subjects. 5
Although there is great interest in SS, the underlying mechanism has not been fully elucidated. Among the various risk factors such as genetic factors, ethnicity, age, body mass index, or disease status, including insulin resistance, diabetes mellitus, hypertension and chronic kidney disease,6,7 the renin–angiotensin–aldosterone system (RAAS) is a key player in the development of SS.
This dietary interventional study was designed to demonstrate the specific responses and roles of renin and aldosterone, and reveal the relationship between these hormonal changes and the amount of sodium intake in normotensive and hypertensive SS and sodium-resistant (SR) subjects.
Materials and methods
Details of the study methodology have been described previously. 5 Briefly, this study enrolled only normotensive and stage I hypertensive participants. Hypertension was defined as follows: 1) a previous diagnosis of hypertension with or without the current use of antihypertensive medications; or 2) a systolic blood pressure (SBP) ≥140 mmHg, or a diastolic blood pressure (DBP) ≥90 mmHg. 8 Individuals were excluded if they were taking medications that affect BP and urinary electrolyte excretion during the study period. Pregnant or breastfeeding women were also excluded.
Study design
All participants maintained their usual dietary pattern and physical activity for 2 weeks before they were hospitalized for the dietary intervention. During the 2 weeks of dietary intervention, they were confined to the hospital and permitted to eat only the food provided by trained dieticians. On the first day of hospitalization, the usual diet without control of sodium content was given for baseline measurements. During the next 7 days, participants were placed on a low-sodium dietary approaches to stop hypertension (LSD DASH) diet (100 mM NaCl/day) and a high-sodium DASH diet (HSD; 300 mM NaCl/day) for the following 7 days. The amount of sodium in the diets was calculated based on food composition tables compiled by a government-related organization. 9 Fourteen different diet types of 2300 kcal/day meals were offered to the subjects. A 24-h urine specimen was collected to measure the amount of excreted creatinine, sodium, and potassium during the first day of hospitalization and the last day of each diet period. Fasting blood samples were obtained prior to the study period, and on the last day of the LSD and HSD diet periods. A complete blood cell count, total protein, albumin, calcium, phosphorus, bilirubin, glucose, blood urea nitrogen, creatinine, sodium, potassium, chloride, triglycerides, high-density lipoprotein-cholesterol, low-density lipoprotein-cholesterol, and total cholesterol levels were measured. Plasma renin activity (PRA) and aldosterone were checked at the same time in the supine position. PRA was measured by an immunoradiometric assay, 10 whereas aldosterone was determined by radioimmunoassay. 11 Twenty-four hour ambulatory BP monitoring (24 h ABPM) was measured during the first day of hospitalization and on the last day of each diet period using an automated, non-invasive oscillometric device (P6 Pressurometer; Del Mar Reynolds, Inc., Irvine, CA, USA) with 30-min intervals for 24 h. SS was defined as an increase in the MAP of >4 mmHg (p < 0.05) in response to the HSD, with reference to previous studies.7,12 The mean arterial pressure (MAP) was calculated according to the following equation: MAP = (2DBP + SBP)/3.
Statistical analysis
All statistical tests were two-sided, and the level of significance was 0.05. Continuous variables are expressed as mean ± SD, and categorical variables are described by numbers with percents in parentheses. Demographic and clinical characteristics are expressed by descriptive statistics for the 101 subjects. The summary statistics are presented by the SS and SR groups and also stratified according to all, hypertensive, and normotensive subjects. We performed an independent two-sample t-test to test the mean differences between the SS and SR groups. All categorical data were analyzed using Pearson’s chi-square test. The paired t-test was used to analyze the effect of the LSD and HSD on the SS and SR subjects. Pearson’s correlation test was used for the correlation analysis. All statistical analyses were performed using SPSS version 18 (SPSS Inc., Chicago, IL, USA).
Ethics statement
The study protocol was approved by the Dongguk University Institutional Review Board (2008-1-9). Informed consent was obtained from all participants.
Results
Baseline demographic and clinical characteristics of the participants
A total of 61 participants enrolled in this subanalysis study (Table 1). Among them, 34 (55.7%) were normotensive, and 27 (44.3%) had stage 1 hypertension. Abnormal laboratory findings were not observed for fasting glucose, serum creatinine, serum Na, serum K, total cholesterol, urinary Na, or urinary K. Among normotensives, there were five SS participants (14.71%) and 29 SR participants (85.29%) (p < 0.0001). SS participants were relatively older than that of SR subjects (60.2 ± 4.3 vs. 47.24 ± 15.40, p = 0.001). The 24 hr urinary excretion of Na and K was not different between the SS and SR groups (24 h urine Na, 160.38 ± 47.721 vs. 209.14 ± 69.698, p = 0.1447; 24 h urine K, 46.08 ± 11.683 vs. 55.555 ± 17.563, p = 0.2255). There were no significant differences of 24hr SBP, DBP, and MAP between the SS group and the SR group. Other variables were not different between these two groups. Contrary to normotensives, no significant differences were observed in hypertensive SS and SR subjects for the baseline characteristics such as enrolled number, age, gender, body mass index, laboratory data, and 24 h BPs.
Baseline demographic and clinical characteristics of the enrolled participants.
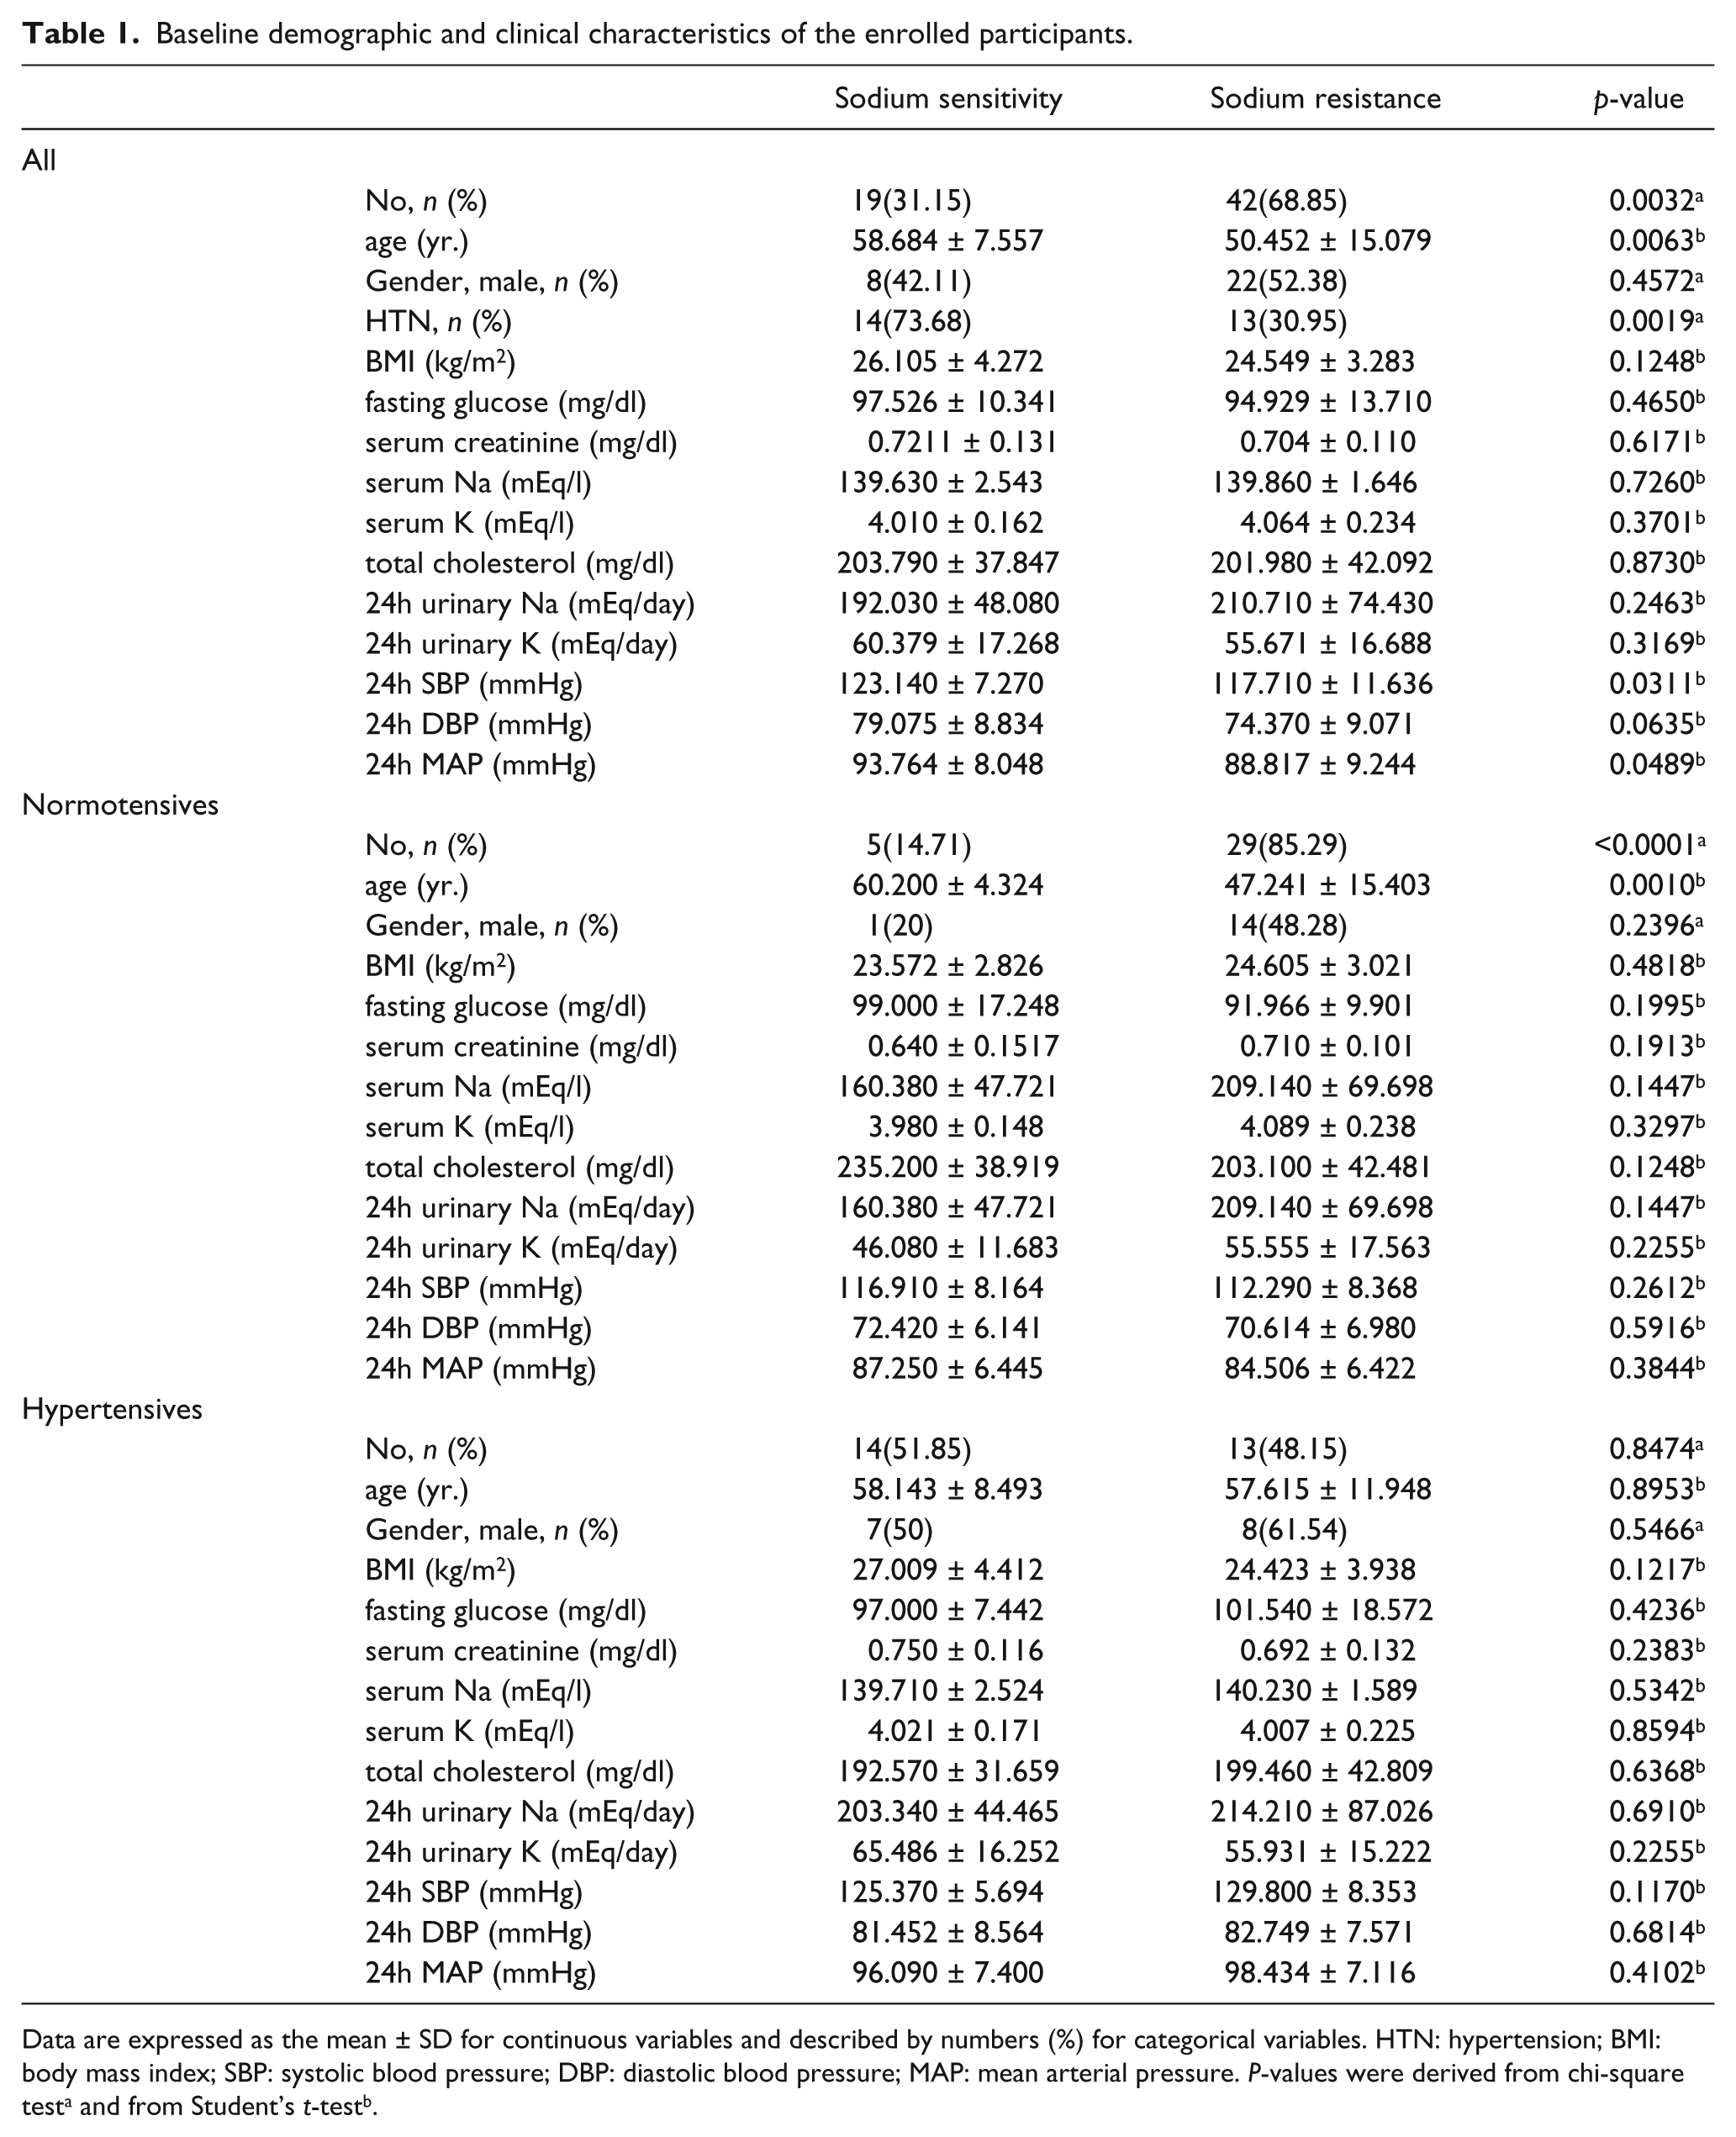
Data are expressed as the mean ± SD for continuous variables and described by numbers (%) for categorical variables. HTN: hypertension; BMI: body mass index; SBP: systolic blood pressure; DBP: diastolic blood pressure; MAP: mean arterial pressure. P-values were derived from chi-square testa and from Student’s t-testb.
24 h BP response based on dietary salt intake
The 24 h BP monitoring such as SBP, DBP, and MAP changed significantly in response to salt intake in all SS subjects, whether they had hypertension or not (Table 2). The BPs of those who consumed the LSD compared with HSD were: SS normotensives, 24 h SBP, 110.144 ± 11.483 mm Hg vs. 115.076 ± 11.532 mmHg (p < 0.0032); 24 hr DBP, 67.843 ± 5.862 mmHg vs. 73.752 ± 6.365 mmHg (p < 0.0002); 24 h MAP, 81.943 ± 7.488 mmHg vs. 87.527 ± 7.766 mmHg (p < 0.0001): SS hypertensives, 24 h SBP, 118.482 ± 6.256 mmHg vs. 127.305 ± 5.645 (p < 0.0001); 24 h DBP, 78.53 ± 7.545 mmHg vs. 84.372 ± 7.609 mmHg (p < 0.0001); 24 h MAP, 91.847 ± 6.744 mmHg vs. 98.683 ± 6.521 mmHg (p < 0.0001). In contrast, no significant differences in BP were observed based on dietary salt intake in any of the SR participants irrespective of hypertension.
The response of 24h ambulatory blood pressures according to the amount of dietary salt intake.

Data are expressed as the mean ± SD mmHg. All p-values were derived from paired t-test. SBP: systolic blood pressure; DBP: diastolic blood pressure; MAP: mean arterial pressure.
Renin and aldosterone response based on dietary salt intake
Next, we evaluated the effect of dietary salt intervention on PRA and aldosterone in hypertensive, normotensive, SS, and SR subjects (Table 3). In normotensives, the level of PRA and aldosterone decreased markedly only in SR after consuming the HSD compared with the level in those who consumed the LSD (PRA, 2.868 ± 2.311 vs. 1.358 ± 1.342, p < 0.0001; aldosterone, 18.914 ± 10.203 vs. 9.841 ± 6.105, p < 0.0001). In SR hypertensives, significant decreases in PRA and aldosterone were also observed (PRA, 2.665 ± 1.635 vs. 1.184 ± 0.83, p = 0.0016; aldosterone, 21.762 ± 7.365 vs. 10.554 ± 4.398, p = 0.0003), but only PRA decreased meaningfully in SS hypertensives based on salt intake (PRA, 1.299 ± 0.904 vs. 0.593 ± 0.479, p = 0.0193). Statistical significance was not found in aldosterone to renin ratio (ARR) between SS and SR group whether they had HSD or LSD diet.
The response of PRA and aldosterone according to the amount of dietary sodium intake.

Data are expressed as the mean ± SD. All p-values were derived from paired t-test. PRA: plasma renin activity (ng/ml/hr); aldosterone (ng/dl): ARR: aldosterone to renin ratio.
Correlation analysis between PRA and aldosterone in response to dietary intervention
Correlation analyses for PRA and aldosterone in response to dietary salt ingested was performed in each group (Table 4). The PRA analyses demonstrated a significant correlation between SR normotensives (correlation coefficient = 0.73173, p < 0.0001) and SR hypertensives (correlation coefficient = 0.59705, p = 0.0312). Aldosterone was also correlated significantly with the change in dietary salt intake in SR normotensives, (correlation coefficient = 0.71268, p < 0.0001). However, no significant correlations were shown in SS normotensive and hypertensive participants.
Correlation analysis about PRA or aldosterone in response to the dietary intervention.
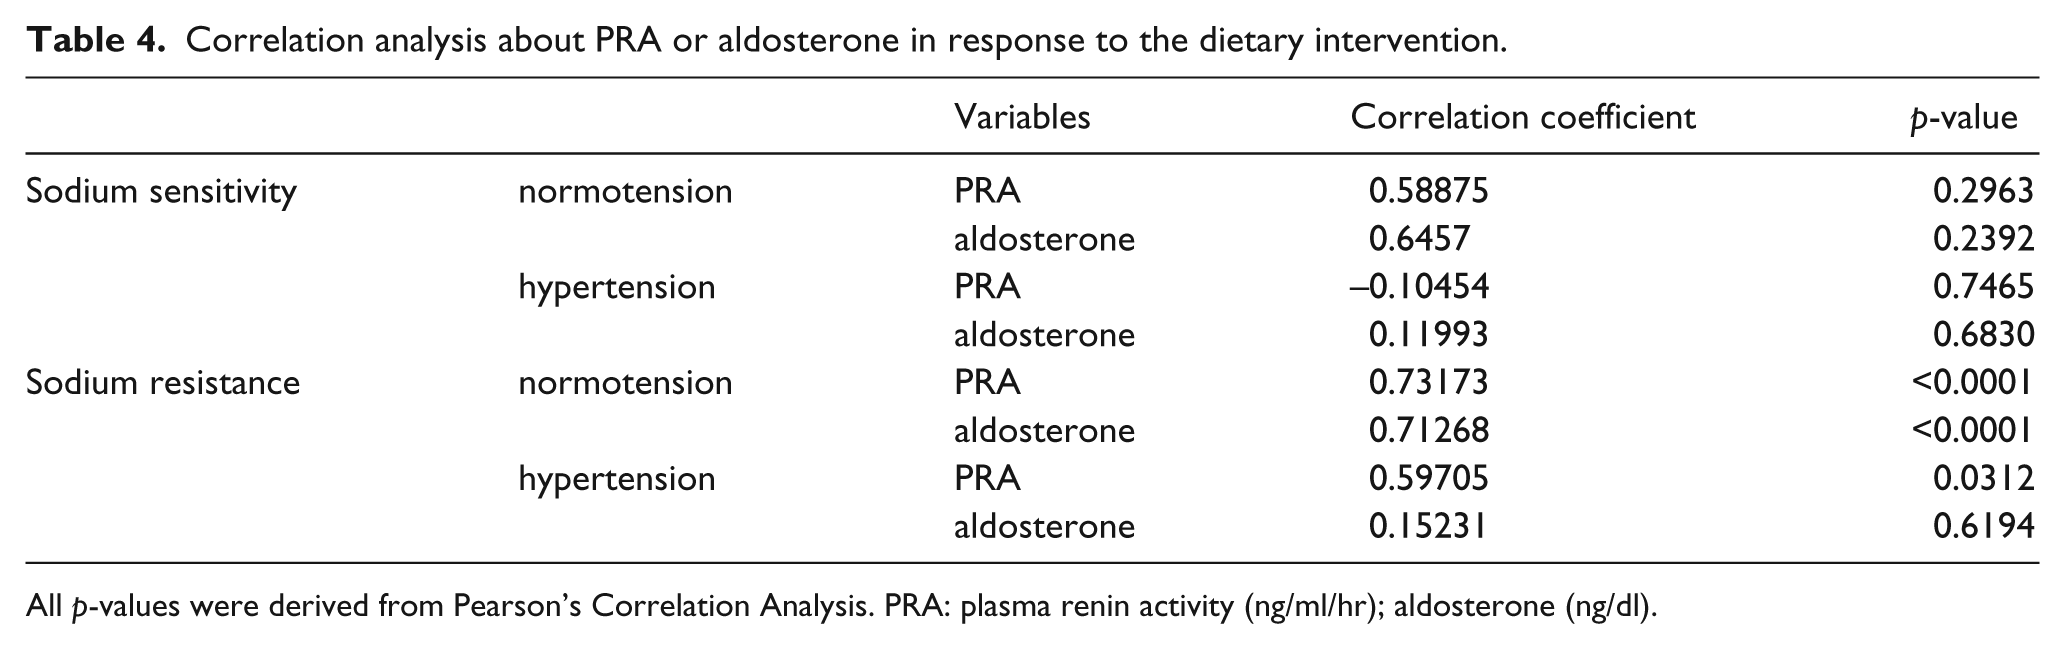
All p-values were derived from Pearson’s Correlation Analysis. PRA: plasma renin activity (ng/ml/hr); aldosterone (ng/dl).
Discussion
Among various studies investigating the effect of dietary salt on BP, almost all were conducted to determine SS prevalence or to reveal the different BP responses in hypertensive and normotensive individuals based on dietary salt intake. Despite great interest in SS, the underlying mechanisms of this condition have not been completely identified. 13 Although the RAAS regulates BP and controls sodium balance, the critical role of PRA and aldosterone in SS or SR hypertensive and normotensive subjects has been very rarely revealed. We revealed the role of PRA and aldosterone systematically in various states of participants as a whole; SS with normotension or hypertension, and SR with normotension or hypertension.
According to the results of our study, SR subjects showed a significant decrease in PRA and aldosterone regardless of hypertension but based on salt intake. In contrast, the response of PRA and aldosterone was not significant in SS normotensives. However, only renin, not aldosterone, decreased markedly in SS hypertensives after consuming the HSD compared with the LSD. Besides that, ARR was not affected significantly by the amount of dietary sodium between SS and SR group whether they had hypertension or not. Although ARR has been used to evaluate hypertension and primary aldosteronism, 14 the value of ARR is somewhat controversial and is not thoroughly evaluated in SS with hypertension or normotension. 15 Similar results have been reported in other studies. Gerdts et al. designed a study in which salt was restricted for 6 days with a single dose of 80 mg furosemide perorally, and then salt was repleted with 9 g of sodium chloride per day for 6 days. 16 At baseline, the mean casual BP of the 30 enrolled Caucasian males was 156/102 mmHg, and the 24 h ABPM was 149/86 mmHg. Significant changes in PRA and aldosterone were observed between SS and SR hypertensive subjects at different levels of sodium intake. Egan et al. studied cardiovascular, neurohumoral, and metabolic effects of 7-day periods of 20 vs. 200 mEq/day salt diet in 27 men with normotension or stage 1 hypertension. 17 PRA decreased markedly after eating the HSD compared with the LSD in both SS and SR participants. However, the effect of hypertension was not analyzed. The PRA and aldosterone response has not always been consistent in other studies. Fujita et al. studied 18 patients with idiopathic hypertension with a range of BPs from 150 to 180 mmHg systolic and from 90 to 115 mmHg diastolic. 4 The results showed that SS hypertensives and SR subjects had a significant decrease in both PRA and aldosterone during sodium loading (244 mEq/day). Comparing the absolute level of PRA and aldosterone during sodium intervention, Sullivan and Ratts reported that during SR, PRA and aldosterone are significantly lower in SS than that in SR groups. 3 This inconstancy could be explained by differences in the definition of SS, the amounts of dietary salt, intervention periods, and ethnicity or baseline characteristics of participants, particularly whether they had hypertension or not.
The clinical meanings of these specific responses to renin and aldosterone have been reported. He et al. demonstrated that from an HSD of 350 mmol/d for 5 days to an LSD of 10 to 20 mmol/d for 5 days, patients with hypertension have a greater fall in BP with a smaller increase in PRA and aldosterone. 18 They suggested that the greater fall in BP in patients with hypertension under a SR was due to decreased responsiveness of the RAAS in hypertensives. Krekels et al. reported that the degree of BP change was not determined by sodium status, but rather renin after 1 week of sodium restriction (55 mmol/day) in untreated essential hypertensives with SS. 19 This could be explained by the importance of a relative unresponsiveness of the renin system during the early phase of sodium loss. 20 An interesting finding in our results was that aldosterone changed significantly only in SR subjects, but not in SS participants, irrespective of hypertension. Aldosterone plays multiple roles in salt and water homeostasis, left ventricular hypertrophy in patients with arterial hypertension, disturbances in the vascular matrix, and endothelial dysfunction. 21 Aldosterone also contributes not only to the development of SS hypertension, but also in cardio-renal injury caused by metabolic syndrome. 22 Considering the high mortality of SS in normal and hypertensive humans, 23 the unresponsiveness of aldosterone to the LSD vs. the HSD might be a reason for the unfavorable and detrimental prognosis, particularly in SS subjects. Moreover, this complex phenomenon of renin and aldosterone in SS or SR will go far toward identifying subjects who will be more susceptible to RAAS-blocking agents. 24
There are several limitations of this study. First, the PRA and aldosterone data were limited. Hormonal changes were only checked on the last day of each diet period and were not measured at the beginning of diet intervention as a baseline. Second, the study period was 2 weeks, consisting of a 1-week LSD period and a 1-week HSD period. Thus the PRA and aldosterone changes in this study cannot predict long-term responses. Third, the results cannot be extrapolated to subjects with severe hypertension and other medical problems such as diabetes mellitus, 25 because this study enrolled only participants with normotension and stage 1 hypertension without other health problems. Fourth, the small sample size should borne in mind and the results interpreted appropriately. This was, however, unavoidable to some degree considering the limitation of research funding and a difficult study design in which all participants were admitted to the hospital and permitted to eat only the special study food for 2 weeks.
In conclusion, we have demonstrated the important role and different responses of renin and aldosterone in SS and SR subjects based on dietary salt intake. RAAS can be inhibited or blocked by several pharmaceutical agents, so if the exact role of renin and aldosterone could be identified in SS or SR subjects, whether normotensive or hypertensive, more individualized therapy could be applied for those who would receive more benefits by specific therapeutic approaches including a low-salt DASH diet.
Footnotes
Acknowledgements
The authors thank Hye-jin Yun and Kyung-hee Cho for their assistance.
Conflict of interest
None declared.
Funding
This research was supported by a grant (08082KFDA999) from the Korean Food and Drug Administration in 2009.