
Abstract
Studies on labour-market disadvantages of ethnic and visible minorities in Canada have focused, primarily, on earning differentials leaving other important socioeconomic indicators such as employment and occupational distribution insufficiently examined. These studies have rarely included religion as one of the explanatory variables, despite the presence of sizable religious communities and considerable religious diversity in Canada. Given the rise in anti-Muslim sentiment and the increase in Islamophobia, religion becomes an important factor. In this study, we argue that the Canadian labour market excludes/includes individuals based on their physical visibility and religious affiliation. We analyse data obtained from the Canadian 2011 National Household Survey. The analysis supports the existence of a hierarchy of labour market outcomes predicated on both visibility and religious affiliation. It is suggested that the existing labour market inequality among the various ethno-religious groups is shaped largely by physical visibility and cultural proximity to the dominant group. The results provide evidence for a ‘Muslim penalty’.
Introduction
The fact that, in Canada, visible (racial) and some religious minorities, especially Muslims, face employment disadvantages is well established (Connor and Koenig, 2015; Galabuzi, 2006; Heath and Martin, 2013; Helly, 2004; Model and Lin, 2002; Reitz, 2007; Reitz and Banerjee, 2007). However, most of these studies have often failed to disentangle racial disadvantages from cultural or religious disadvantages by homogenizing ethnic and religious minorities that are otherwise heterogeneous, for example having the same ethnicity (e.g. South Asians) but different religious affiliations (e.g. Hindu or Muslim). This leaves us with some important unanswered questions such as: To what extent do ethnic/racial and religious penalties 1 facing minorities interact with each other? Does the intersection between ethnicity and religion exacerbate labour market disadvantages for some groups, while privileging others? Put conversely, do religious disadvantages (e.g. penalties due to being a Muslim) get intensified for some ethnic groups (e.g. Arab), but not for others (e.g. being White)? In addition, most of the previous studies in Canada that focused on earning differentials rendering other important socioeconomic indicators such as employment and occupational distribution are insufficiently examined (see for example: Christofides and Swidinsky, 1994; Li, 1992, 2000; Reitz and Sklar, 1997).
This paper addresses these questions through exploring the extent to which structural integration of minorities is affected by their ethno-religious affiliations, as opposed to traditional questions of ethnic or racial differences only. Given that ethnicity and religion tend to overlap, investigating potential differences among ethno-religious categories will enable us to disentangle the impact of religion from that of ethnicity, and to adequately assess the impact of ethnic and religious affiliations on economic activity (participation), unemployment and occupational attainment. We argue that both physical visibility (skin colour for example) and religious affiliation are structurally imbedded, operate simultaneously and intersect with each other in marginalizing minorities. In particular, we predict that, as a result of the intensive, and often negative (Helly, 2011), public and media focus on issues surrounding Muslims in Canada, Muslims as a whole will face an additional penalty that is greater than the penalty faced by other visible and religious minorities. The impact of being a visible minority (due to physical appearance and skin colour) will be exacerbated when intersected with Islam.
Ethnic and religious identities and structural integration
Our main departure point in the discussion to follow is that ethnicity and religion (as important aspects of culture) are in a constant interaction and influence each other in the process of identity formation among immigrants (Bankston and Zhou, 1995; Yang and Ebaugh, 2001). Although ethnic and religious identities may differ in their saliency, depending on the individual and their circumstances, they are not mutually exclusive components of social identities.
In this study, we draw on the work of Weber (1958), Durkheim (1961) and Parsons (1937) to argue that religion provides guidance and meaning for the actions of individuals in the form of values, norms and beliefs. More broadly, religion is likely to play an important role in defining the set of actions people should follow under different circumstances and conditions. This includes defining the acceptable dress code for men and women, the food code and other actions more broadly. For example, many Muslims would abstain from eating pork because Islam forbids eating pork. Moreover, many Muslim women would adopt the hijab because of religious reasons. In the context of employment, religion is likely to influence both the supply and demand sides of the labour market. In relation to the supply-side, religion is likely to influence people’s labour market outcomes through shaping their norms and preferences in relation to paid work more generally, and/or in relation to the kind of jobs they can or cannot do and how they can participate in the labour force without compromising their faith. For example, around 70% of all ultra-Orthodox Jewish men in Israel prefer studying Judaism over paid employment (Blumen, 2007). Furthermore, while Islam does not prevent Muslim women working, it certainly directs them towards certain jobs, working hours and labour market segments (Abdelhadi, 2017; Spierings, 2014).
Turning to the demand-side of the labour market, religion can also affect people’s employment prospects and opportunities by making them publicly visible, and consequently defined as outsiders based on cultural markers such as through clothing (Sikh men wearing the turban or Muslim women wearing the hijab), language and other social or religious practices. For some minority groups, being culturally different within the larger society makes them stand out, often not in a positive way. This in turn can become a basis for discriminatory practices. Some employers, for instance, may favour workers from either their own group or any other group they prefer to employ on the grounds of ‘taste discrimination’ (Becker, 1957); other employers may exercise statistical discrimination (Phelps, 1972), whereby labour market access is restricted for members of certain groups considered to be less productive (compared to the employers’ own co-nationals). These practices are more likely if the immigrant group in question occupies an unfavourable labour market position or low standing in the given country’s ethnic-racial status hierarchies. Discrimination can therefore exacerbate the difficulties and disadvantages faced by immigrant workers in the secondary economy. In many western societies, individuals who are identified as having a different culture that is not compatible with the host culture, e.g. Muslims, are likely to attract some negative responses or even hostility. In the case of Muslims, this is evident with the increase of Islamophobia (Hanniman, 2008; Perry, 2014; Rana, 2007). Here religion operates in some ways similarly to ethnicity, but with one crucial difference. While religion can only be detected through behaviour or cultural symbols (e.g. clothing or growing beards for some groups), very often ethnic groups in western societies belong to racial groups other than the majority white group, e.g. Pakistanis and Indians in Britain, Black Africans and Chinese in Canada and Moroccans in the Netherlands. In these cases, belonging to a visible minority further distinguishes these minorities from the majority group.
In the context of social integration of immigrants, ethnic and religious identities are best understood as two different facets of multifaceted social identities (Khattab and Johnston, 2013). For example, ethnographic studies on the experience of Christian Chinese immigrants in the US found that the process of integration of Chinese immigrants converting to Christianity involved maintaining particular elements of being Chinese, while selectively incorporating elements of what being a Christian American meant to them (Chafetz and Ebaugh, 2000). In the UK context, some ethnic groups perceive religion as part of their identity. For example, most British Pakistanis and Bangladeshis consider religion to be of great importance to them (Modood et al., 1997). However, in the post-9/11 era and the 7/7 London bombing, media and public led discourses have portrayed various ethnic minorities in the UK such as Pakistanis and Bangladeshis through their religious identity, rendering their religious identity more salient than their ethnic identity. Furthermore, because the Pakistani community is the largest Muslim community in the UK, Islam in general has been associated with Pakistanis to the extent that ex-Christian White women who have converted to Islam were called names like ‘Paki’, demonstrating a process of racialization and ‘crossing the borders of whiteness’ (Franks, 2000; Moosavi, 2015). A similar process has occurred in Australia, only in this case the ‘Arab Other’ has been the main target of Islamophobia and racialization (Poynting and Mason, 2007).
This suggests that religion enters the process of identity formation among immigrants in several ways. Not only does it constitute the bedrock for a religious identity but, depending on the context and the ethnic resources available to immigrant communities, religion can play a crucial role in the construction, reformulation and preservation of ethnic identities. In his studies of Asian immigrants to the US, Min found that, through mixing religious and ethnic traditions and rituals to the point where they became more or less fused into one another, Hindu temples and Korean churches played a crucial part in preserving Indian and Korean ethnic identities (Min, 2005). He concluded that conservation of ethnic identity is one of the main functions of religious organisations. Similar results were obtained from studies looking at other immigrant communities in the US (Cadge and Howard Ecklund, 2007). Other researchers have argued that this preservative function underlies the increased saliency of religious identity upon migrating to a new home. For example, Kurien (1998) concluded from his study of Indian immigrants that pride in their Hindu heritage played a role in mediating their transition from Indian immigrants to Indian Americans.
Research on structural integration in Western Europe and Canada has consistently demonstrated that foreign-born immigrants tend to fare worse in terms of labour market outcomes (Frenette and Morissette, 2005; Kogan, 2007). These labour market disadvantages are often attributed to the lack of language proficiency among new migrants (Dustmann and Fabbri, 2003), but are likely to decrease slightly over time (Brekke and Mastekaasa, 2008). Some studies using British data show that although the gap between immigrants and natives seems to decline in the second generation, it also seems to persist across generations. The descendants of immigrants continue to experience higher rates of economic inactivity and unemployment, higher concentrations in lower status occupations (Heath et al., 2008). And while controlling for demography (age, marital status and children in the household) and human capital (qualifications) has been shown to somewhat reduce these differences, a substantial portion of the gap persists and remains unexplained (Khattab and Johnston, 2015). Some researchers have termed the unexplained portion of the gap ‘ethnic penalties’, and argued that these differentials are best explained by discriminatory employment practices (Carmichael and Woods, 2000). Heath et al. (2008), for example, contended that underlying the current pattern of ethnic penalties are race- or colour-based discriminatory employment practices.
A number of recent studies have demonstrated that religious affiliation, particularly for Muslims, emasculates the employment privileges often associated with whiteness, while intensifying the ethnic penalties among groups such as South Asian groups and Blacks (Heath and Martin, 2013; Khattab and Johnston, 2015). However, other researchers argue that the ethnic penalties studies grossly underestimate the importance of socio-cultural variables. They assert that the aforementioned disadvantaged position within the labour market is due to sociocultural differences that can be resolved through cultural integration or even assimilation. Put differently, cultural integration (language proficiency, interethnic social ties and gender values) serves as a prerequisite for structural integration into institutional domains such as the labour market (Dustmann and Fabbri, 2003; Koopmans, 2016). However, these studies have ignored some important factors that are not only likely to influence labour market performance, but the level of cultural integration as well. One of these factors is the place of residence within the host country. A number of studies have demonstrated that the geographical concentration (or residential segregation) of migrants is strongly associated with both labour market outcomes and cultural integration (Beckhusen et al., 2013; Khattab, 2006).
Ethnicity and religion in Canada
For both political and empirical considerations, race and ethnicity, as opposed to religion, have been the primary focus of sociological and economic research on issues of social and structural integration of minorities (Reitz et al., 2009). Politically, following the first large-scale waves of immigration from non-European countries, issues of race-based discrimination in the labour market were salient enough to be regarded as barriers to integration and settlement and to initiate a political response from the government. Religion-based discrimination, on the other hand, lacked that saliency and therefore was not part of the overall discussion of discrimination against, and integration of, immigrants during that period. This was evident in the Employment Equity Act and other governmental legislations aiming to address employment discriminatory practices against ‘visible minorities’ (Pendakur, 2005).
The potential effects of religious affiliation on structural integration were partially concealed by the observation that regardless of religious affiliation, members of ethnic minority groups tended to fare less well on measures of economic success than those of the majority group. For example, within the dominant religious group, Christian members of visible minority groups were consistently found to be disadvantaged relative to both White Christians and White Jews. Furthermore, such differences are accentuated in the case of Blacks who are predominantly Christians and yet tend to experience the greatest disadvantage and report incidences of discriminatory employment practices more often than any other visible minority group including those with non-Christian populations (Frenette and Morissette, 2005).
Although the potential impact of religious affiliation or religion-based discrimination on employment outcomes has been largely neglected, there have been a few exceptions in the Canadian context. Perhaps the first one was a study by Tomes (1983) using the 1971 Canadian Census to investigate returns to education among Jews and Christian groups. Thereafter, other researchers became interested and a few studies treating religious affiliation as a variable were published (Meng and Sentance, 1984).
On the whole, the scant literature on this topic focused exclusively on Judeo-Christian faiths and the first exception in the Canadian context was probably a study by Model and Lin (2002) in which they used data from British national surveys and Canadian censuses to compare labour market outcomes for religious minorities relative to the Christian majority in both countries. They found no cross-national disparities on occupational distribution. On economic activity and unemployment, they found that, compared to British Muslims, Canadians Muslims fared better on employment and less well on labour market participation, while Canadian Sikhs and Hindus had worse employment outcomes than their British counterparts. In their conclusion they reiterated the argument made by Reitz et al. (1999) that Canada’s reputation as the more generous and attractive destination has been blown out of proportion (Model and Lin, 2002). In the next section, we discuss our data and the methods used in the study.
Data and methods
Data were drawn from the 2011 National Household Survey (NHS) which is a voluntary, self-administered survey, introduced as a replacement for census Form 2B, and which is more commonly known as the long-form census questionnaire. A random sample of 4.5 million households, about one-third of all households, was invited to respond to the NHS in the spring and summer of 2011. This survey contains 887,012 records drawn from the population who anonymously responded to the 2011 NHS, representing 2.7% of the Canadian population. Given that the aim of this study was to investigate labour market outcomes, the analysis had to be restricted to working-age population (15–64 years), thus excluding students and retirees, which reduced the sample to 534,988 records.
Dependent variables: Structural integration variables
In this study, we analyse three key labour market outputs: labour market participation, unemployment and occupational attainment. We assume that, if all groups face the same opportunity structure regardless of their religion and ethnicity, controlling for individual differences in human capital and family circumstances will explain all of the differences in labour market outcomes between the groups. If it turns out that such differences still exist even after controlling for individual differences, this is then likely to be a result of ethnic and/or religious penalties that are often attributed to discrimination (Connor and Koenig, 2015). In what follows, these outcome variables are further explained.
Labour force participation (economic inactivity)
A dichotomous variable with a value of 0 for those who are economically active (those either searching for a job or who have a paid job) and a value of 1 for those who are economically inactive (all others, including people with disabilities, housewives, students, retirees).
Unemployment
This variable constitutes a subset of the labour force participation variable. It includes only those who are economically active and participating in the labour market (i.e. those with score 0 on the previous variable). It distinguishes those who are currently employed (0) from those unemployed but searching for a job (1).
Occupational attainment
This variable was derived from one of the survey’s questions regarding the kind of work performed by the respondent. It contained 10 occupational categories based on the National Occupational Classification for Statistics (NOC-S). For the purpose of our study, these classifications were recoded into the following three categories based on skill level: managerial occupations including professional and semi-professional occupations; intermediate occupations; and manual occupations (skilled and unskilled combined). The last category was used in the analysis as the reference group.
Independent variables
Before we discuss our independent variables and how these were derived and coded, we would like to draw the reader’s attention that summary statistics for all independent variables can be found in Table 5.
Ethno-religious grouping
In creating these groupings, we draw on the work of Johnston et al. (2010) who rightly claim that in order, for example, to examine whether two or more ethnic groups differ significantly from each other, it is crucial to do that while neutralising the impact of religion. The same also applies in the case of differences between religious groups. Thus, creating various ethnic/racial groups sharing the same religion would help better capture the ethnic/racial disadvantage. Furthermore, comparing religious groups sharing the same ethnicity would allow us to better understand the extent to which religion is, or is not, important in determining labour market outcomes. In the context of this study, religious affiliations mark differences in religious backgrounds. This is not the same as religiosity which indicates the strength of faith or the degree of commitment to one’s religious beliefs and practices. Sociologists interested in religiosity as a variable tend to employ measures such as self-rated worship attendance (Connor and Koenig, 2015). Considering that one of the objectives of this study is tease out the effects of visibility from those of religious affiliation, people with mixed backgrounds were excluded from the study. The following ethno-religious groups were derived using the survey’s visible minority and religion variables:
Age
Recoded and grouped into the following age categories with the first one being the reference category: (15–19), (20–29), (30–39), (40–49), (50–59), and (60–64).
Gender
This is measured as a dummy variable with men used as the reference group, as well as a series of interaction dummies between gender and the ethno-religious groups.
Marital status
This variable was recoded into singles (0), currently married or in a common law relationship (1) and divorced (2), with singles being the baseline.
Number and age of children
This includes the following variables: Children aged 0–1, children aged 2–5, children aged 6–14, children aged 15–24 and those aged 25 and over. Each one of these variables contained the same two categories: no children (0) and one child or more (1), with the former being the reference group.
Generational status
A series of dummies have been used as follows: 1, first generation, respondents born outside Canada; 2, second generation, respondents born in Canada, both parents born outside Canada; 3, second generation, respondents born in Canada, one parent born outside Canada; 4, and third generation or more, respondents born in Canada, both parents born in Canada. First generation was used as the reference group.
Educational qualification
A series of dummies have been defined as follows: 1, no educational qualification which was the reference group; 2, certificate, diploma or degree below college level; 3, certificate, diploma or degree below bachelor level; 4, Bachelor’s degree, certificate or diploma above bachelor or a degree in medicine, dentistry, veterinary or optometry; and 5, Master’s or earned doctorate degree.
Language proficiency
‘Dummies’ refer to the ability to conduct a conversation in: 1, English only; 2, French only; 3, none of the official languages of Canada; or 4, both English and French, which was used as the reference group.
Region of residence
Recoded into Toronto (0), Montreal (1), Vancouver (2), the rest of the country (3), with the last of these being the reference group.
Findings
Descriptive analysis
In this section, we present a brief statistical description of the dependent variables by ethno-religious groups. We start the section by examining labour force participation, or economic activity, which is presented at the top part of Table 1. The main difference here is between the Muslim groups on one hand (Blacks, Arabs, South Asians, West Asians and Whites) and almost every other group on the other. According to Table 1, participation rate for Muslim groups, ranging between 62% among West Asian Muslims to 68% among White Muslims, lags behind that of the other groups, especially the majority group, White Christians. Most of the other groups have a participation rate that is greater than 70%, especially among Whites with No Religious Affiliation (81%) and the majority group of White Christians (78%). With a participation rate around 73% to 74%, South Asian Hindus and Sikh, Buddhist Asians and Arab Christians fall more or less in the middle between the Muslims groups and the majority White group. Thought to underlie these differences are a host of factors including socio-demographic (marital status and number of dependent children), human capital and social-cultural factors. In the multivariate analysis, we will be able to shed more light on this issue.
Summary statistics for the dependent variables by ethno-religious background (proportions).
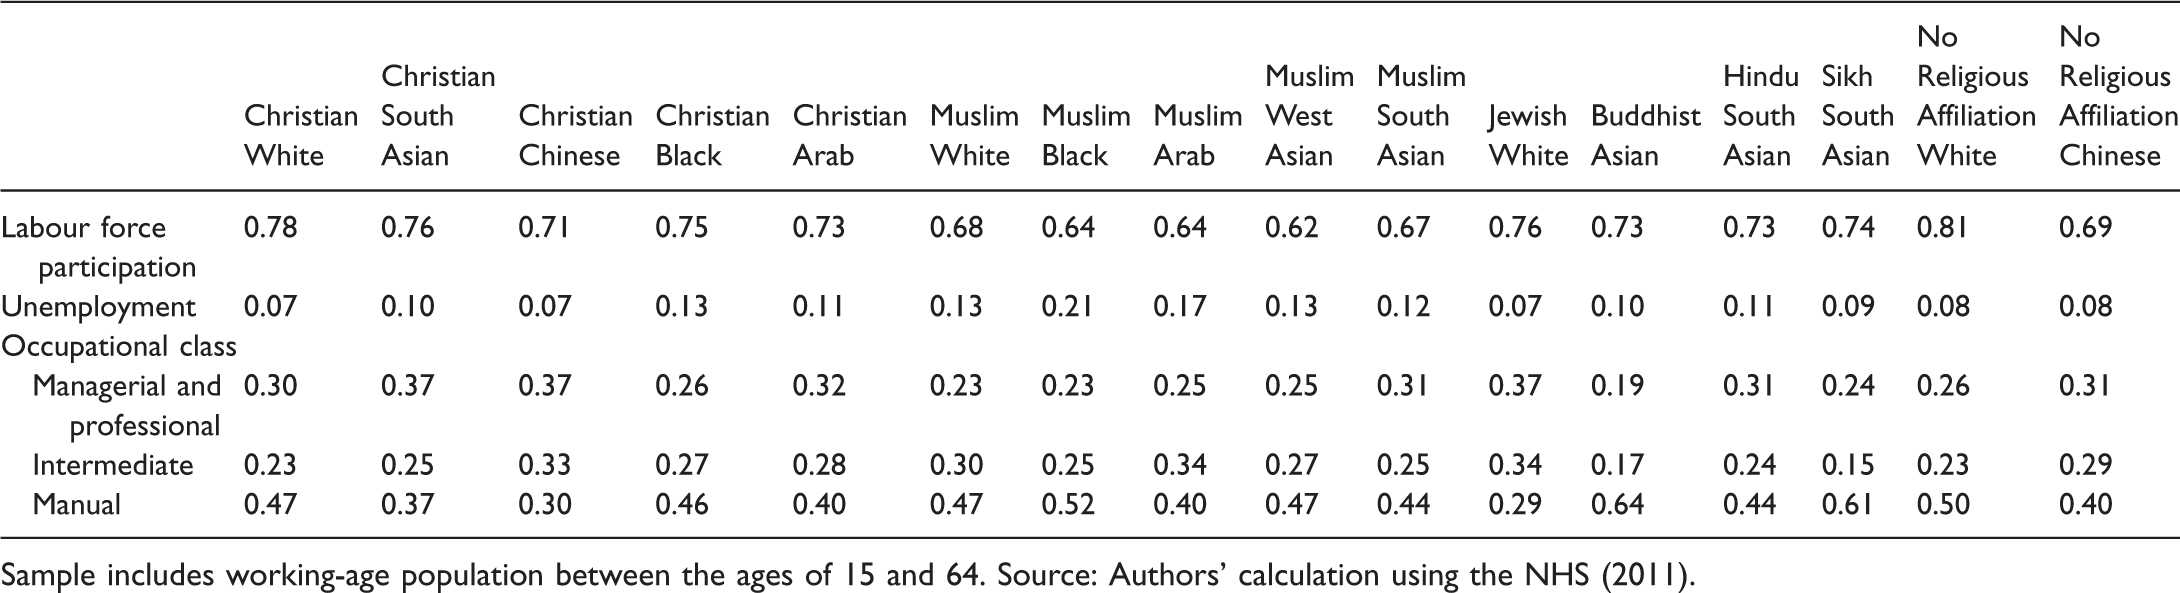
Sample includes working-age population between the ages of 15 and 64. Source: Authors’ calculation using the NHS (2011).
Table 1 reveals a slightly different pattern in relation to unemployment. With an unemployment rate that exceeds 10%, all Muslim groups, along with Black Christians, seem to face the highest level of unemployment, especially Arab and Black Muslims (17% and 21%, respectively). Arab Christians and South Asian Hindus experience a rate of unemployment that is just above 10% (11% each) placing them, along with Buddhist Asians and South Asian Christians (10% each) in the middle between the former groups and the other groups including the White Christians majority and Chinese (both religious groups) and Jews.
The pattern in relation to occupational attainment is not very different from the one discussed earlier in relation to unemployment. All Muslim groups (except for Muslim South Asians) are less likely to be in managerial and professional occupations, and more likely to be in manual jobs than most of the other groups, especially Chinese Christians, South Asian Christians and White Jews. Buddhists, South Asian Sikhs and Black Christians fall on the scale closer to the Muslim groups, than they do to the more privileged groups. White groups (of all religious backgrounds except Muslims) and Christian groups (of all ethnicities except for Blacks) can be described as more advantaged in relation to their occupational attainment. As suggested earlier, these ethnic/racial and religious differences might be the result of differences in their life circumstances (socio-demographics) and their human capital and skills. These differences, if not totally explained by socio-demographic and human capital factors, can potentially be caused by discrimination on the grounds of skin colour, religious affiliation, and the intersection of ethnic and religious identities. In the following section, we will examine these differences further and see whether controlling for the independent variables discussed earlier can explain these differences.
Multivariate analysis
Economic inactivity
Table 2 contains two models depicting our results in relation to economic inactivity. Model 1 highlights the gross variations among the ethno-religious groups. While No Religious Affiliation Whites were less likely to be economically inactive than White Christians, all other groups were significantly more likely to be economically inactive than White Christians. Muslim West Asian was the group with the highest odds of economic inactivity, calculated as the exponent of the ethno-religious coefficient minus one, then multiplied by 100, and were about 123% likelier than White Christians to be economically inactive. All Muslim groups, along with No Religious Affiliation Chinese, were the most likely to be economically inactive, and were at least 60% likelier to be inactive than White Christians.
Coefficients of logistic regression (logits) for economic inactivity.
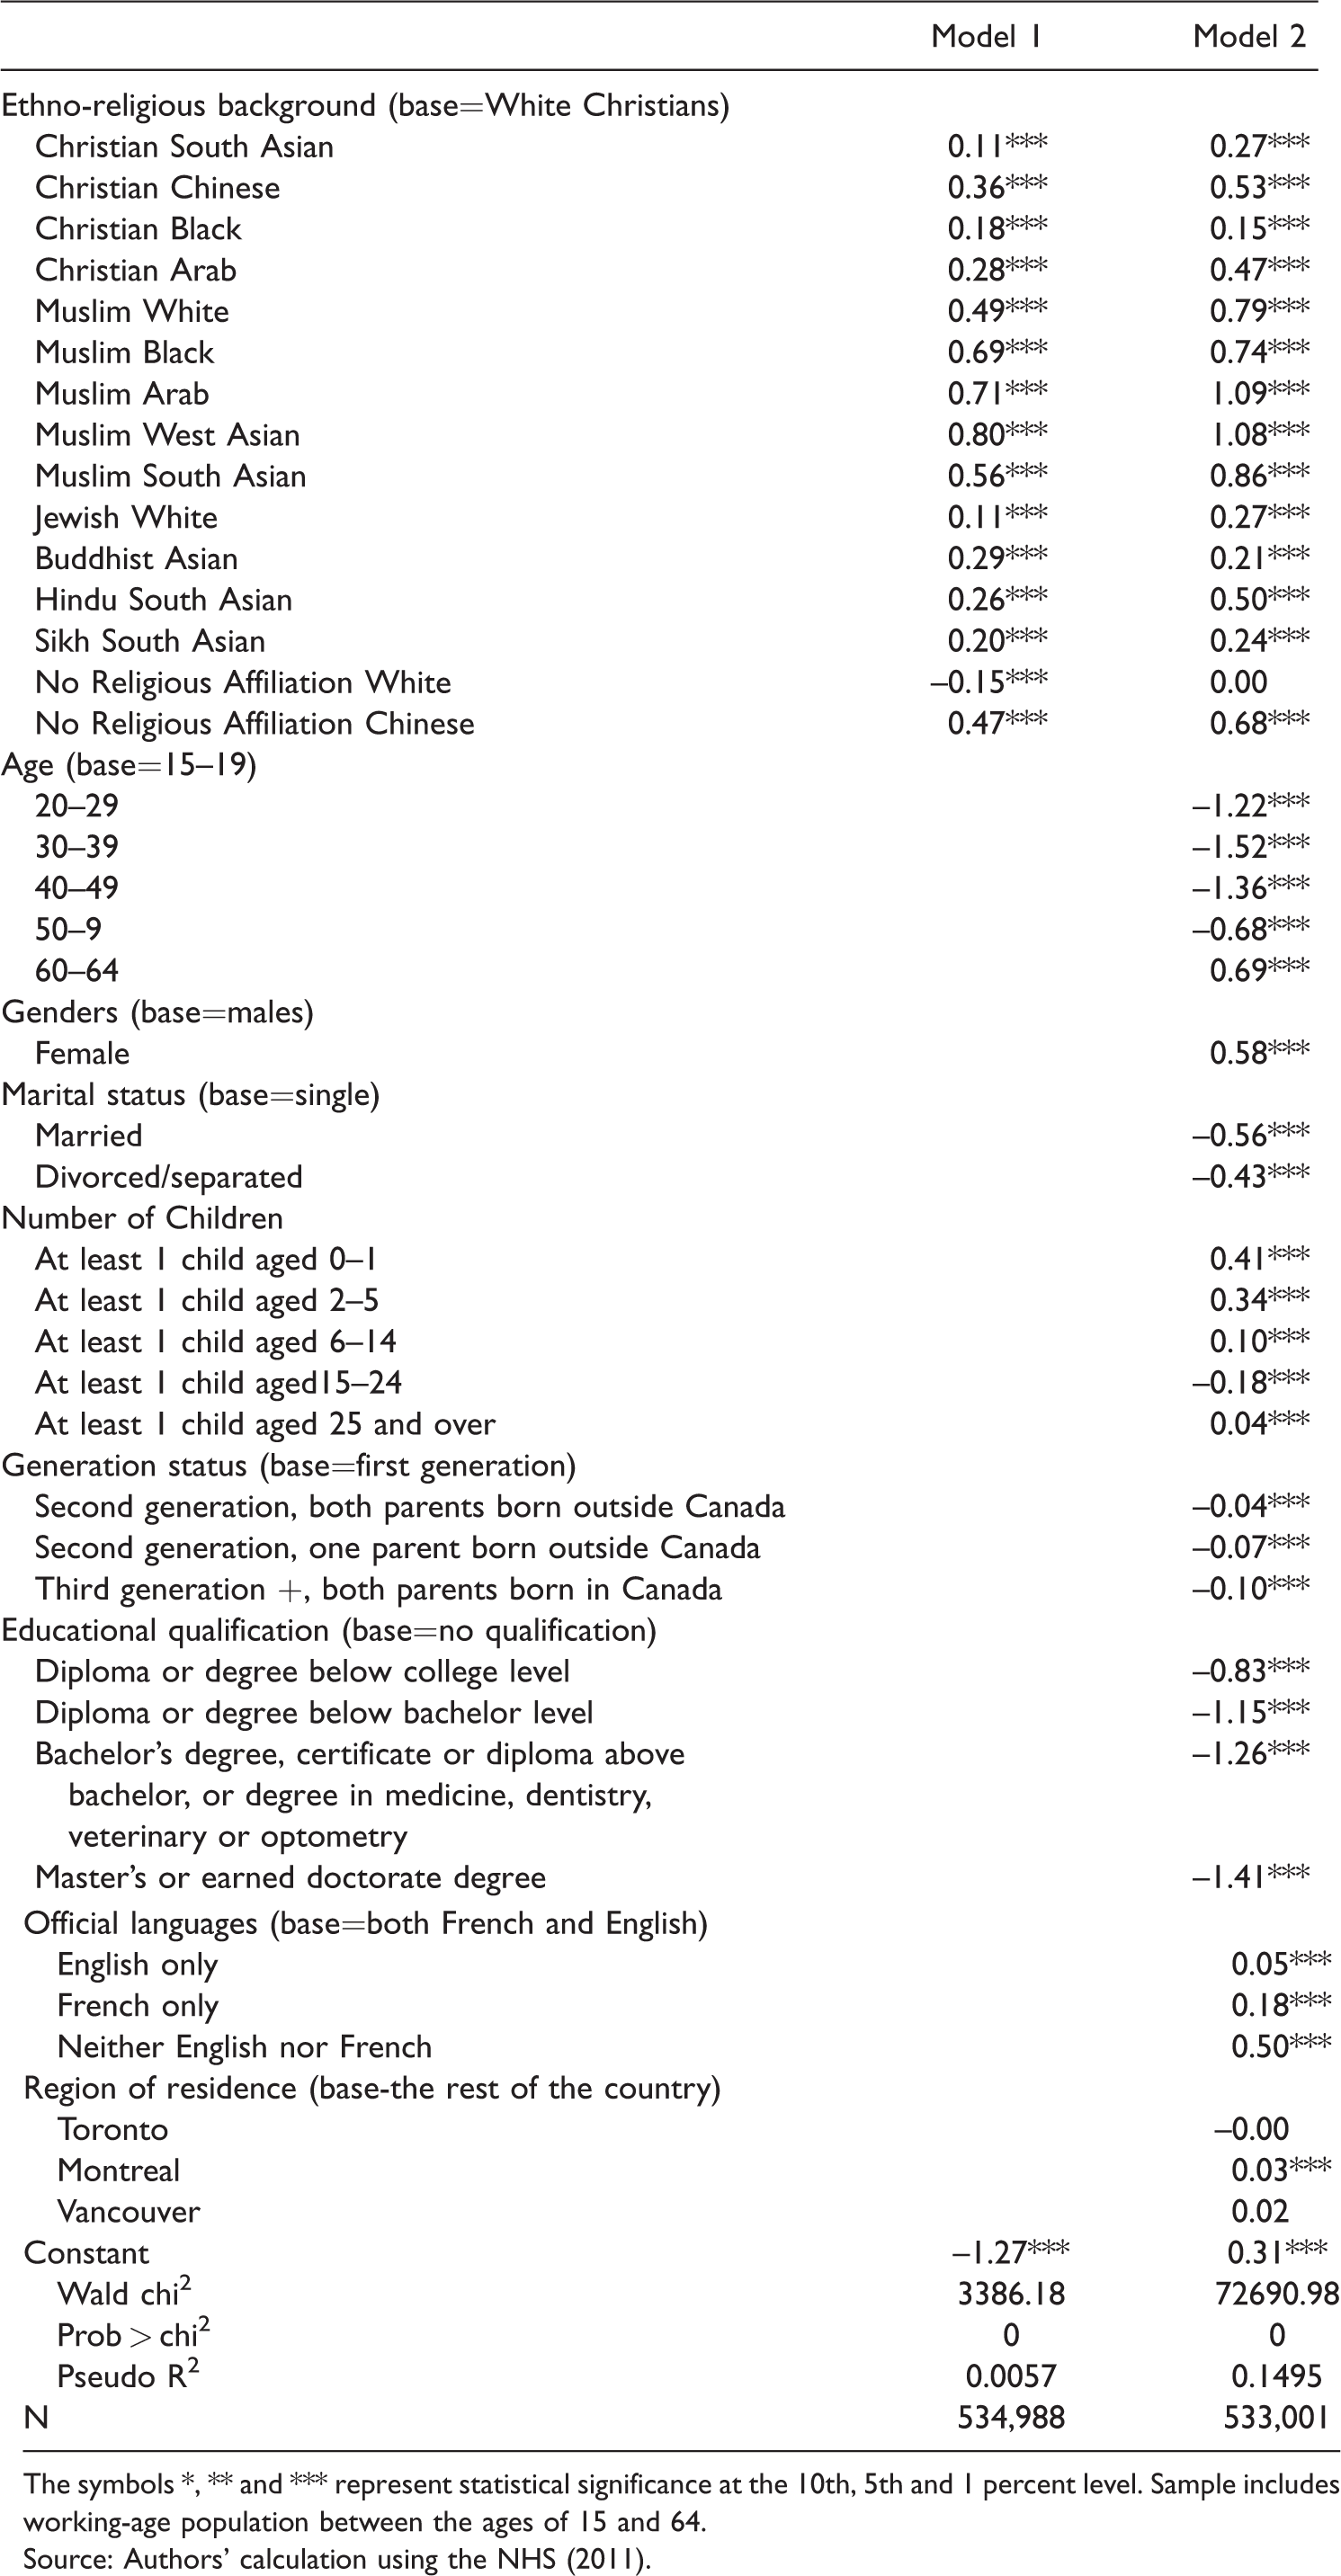
The symbols *, ** and *** represent statistical significance at the 10th, 5th and 1 percent level. Sample includes working-age population between the ages of 15 and 64. Source: Authors’ calculation using the NHS (2011).
Model 2 presents the ethno-religious differences while controlling for demographic background, geographical location, human capital and the other independent variables. Here, the odds ratios for most ethno-religious groups increased. Other than No Religious Affiliation Whites (that was not different from White Christians), all ethno-religious groups were likelier to be economically inactive. Muslim groups again have the highest odds of economic inactivity, all having over 100% of the chances of White Christians. The results from this model suggest that controlling for demography and human capital increased the already existing gap in labour force participation rates between most of the ethno-religious minorities and White Christians. Two of the Muslim groups (Arabs and West Asians) face the highest odds of being economically inactive (197% and 194% more chance than White Christians respectively). The other important pattern that emerges from this model is that within any ethnicity/race (e.g. South Asian, Arabs, etc.), Muslims have higher odds of economic inactivity. Thus, we can conclude that there are significant differences between the groups, which have increased further when controlling for socio-economic background variables rendering these variables unimportant in explaining the ethno-religious differences in labour force participation.
The other independent variables in Model 2 seem to operate in the expected direction. Age decreases the odds of being economically inactive. Compared to our references age group (15–19 years), all groups were significantly less likely to be economically inactive, with the age group (60–64 years) being the only exception. This is not unexpected given that 64 is the age of retirement. Women were more likely than men to be economically inactive. Both married and divorced people were less likely than singles to be economically inactive. As expected, the age of children seems to affect one’s ability to participate in the labour market. Relative to those with no children, parents of dependent children under the age of 14 were more likely to be inactive, while those whose children were above the age of 14 were less likely to be inactive. Compared to first-generation Canadians, second- and third-generation Canadians were slightly less likely to be economically inactive. Education significantly decreased the odds of being economically inactive; the higher the educational qualification, the lower the odds of being inactive. Compared to bilinguals who speak both English and French, those who spoke neither of the two official languages were considerably more likely to be inactive, while those who spoke only one of the two were only slightly more likely to be inactive. Living in census metropolitan areas (CMAs), as opposed to the rest of the country, seems to have a differential effect depending on the particular area of residence. While living in Montreal increased the odds of being economically inactive, living in Vancouver or Toronto did not seem to have any significant effect.
Given that some gender differences are expected in labour market participation and other outcomes, especially among groups such as Muslims, we ran the same model while including an interaction between gender and the ethno-religious background. This analysis is presented in Table 6. This analysis was repeated for the other two labour market outcomes. For men, the ethno-religious gap is still the exponent of the ethno-religious dummy variable minus one multiplied by 100. For women, this gap is the exponent of the sum of both the ethno-religious and the interaction dummy variables, minus one multiplied by 100. One can similarly calculate an intra-ethnic gap by summing the gender and interaction coefficients, exponent them, subtracting one and then multiplying the result by 100. The results for economic inactivity are at the first column of Table 6. For both genders, all groups are more likely than White Christians to be economically inactive. The Arab and West Asian Muslims are the most likely for both genders to be economically inactive – 132% and 129% for men and 278% and 260% for women, respectively. In all groups (including White Christians), women are more likely to be economically inactive than men. Muslim women (of all ethnicities) are more likely to be inactive compared to men, with South Asian Muslim women having 306% more chance than South Asian Muslim men to be economically inactive.
Unemployment
This study now turns to those who are active in the labour force, employed or searching for employment, to compare the odds of unemployment for all groups and to investigate whether individual differences in socio-demographic and human capital backgrounds can explain any potentially existing differences.
As in the previous analysis, here too we present two models (in Table 3). Model 1 shows the gross ethno-religious differences. Compared to White Christians, all other groups, except for Jewish White and Christian Chinese, are more likely to be unemployed. These differences are exceptionally higher for Muslims and Black Christians, with Black Muslims and Arab Muslims experiencing the highest risk (chances) of facing unemployment (the chances of these two groups are 267% and 180% greater than White Christians, respectively).
Coefficients of logistic regression (logits) of unemployment.
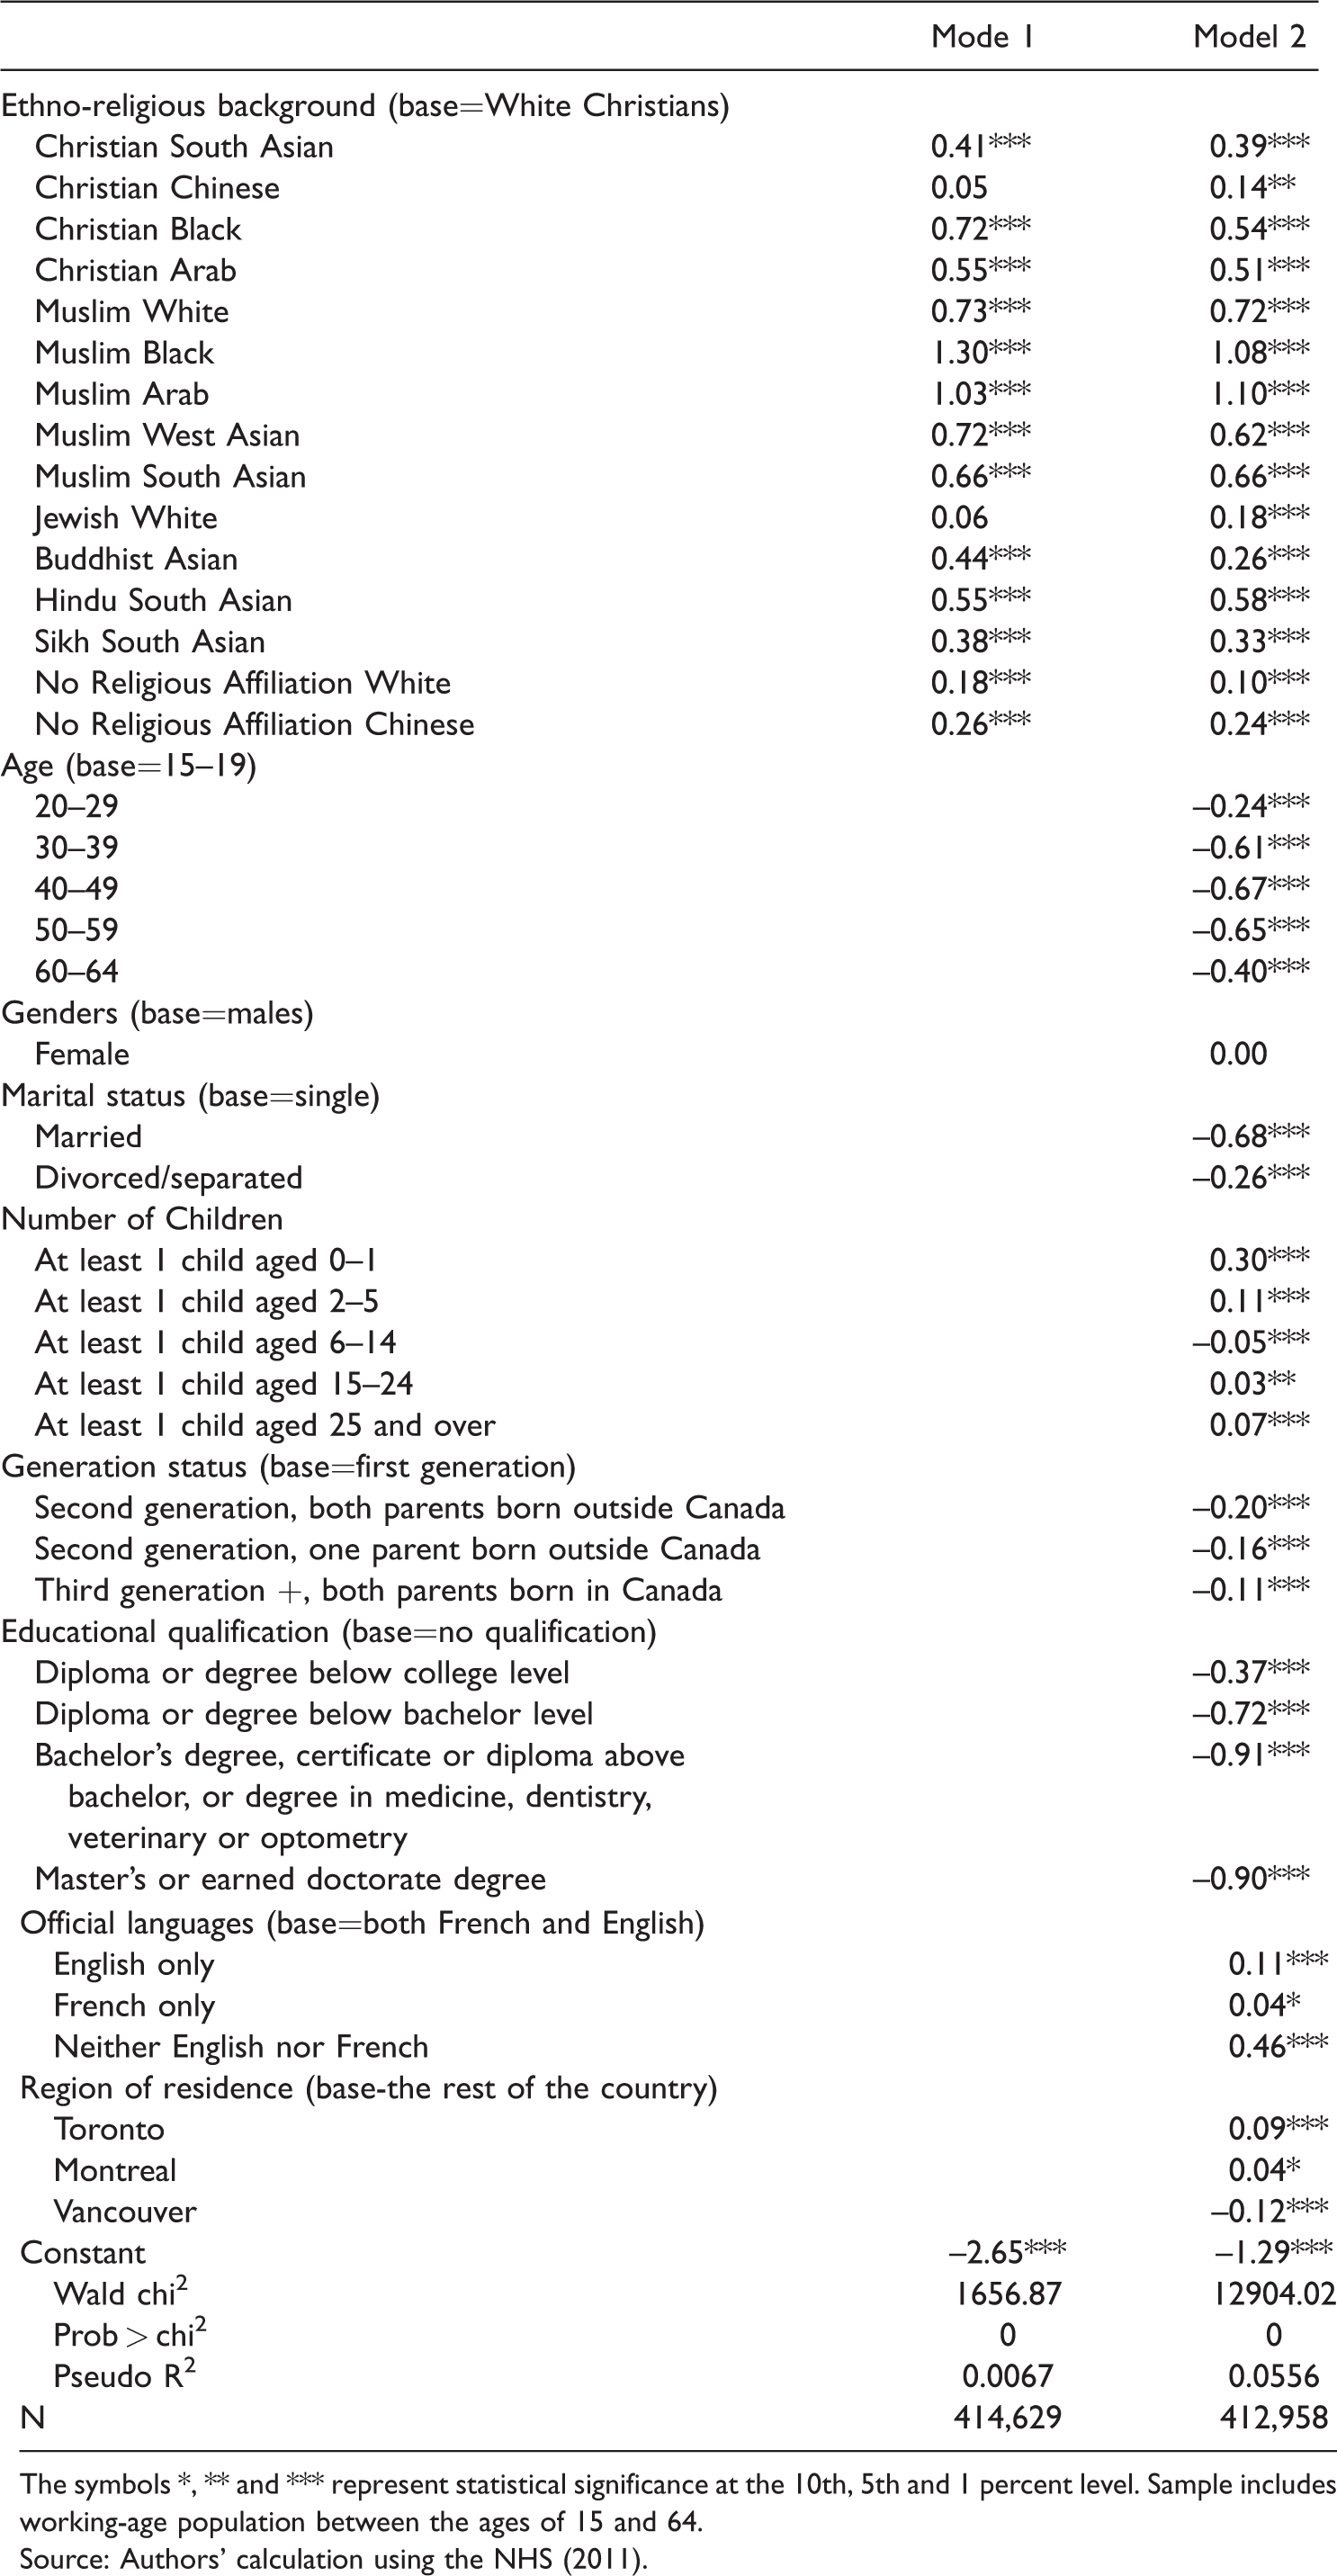
The symbols *, ** and *** represent statistical significance at the 10th, 5th and 1 percent level. Sample includes working-age population between the ages of 15 and 64. Source: Authors’ calculation using the NHS (2011).
Model 2 examines whether the initial differences can be explained by the independent variables. The results show that the independent variables account only partially for the initial differences. The odds of four groups (Chinese Christians, Muslim Arabs, Jewish White and Hindu South Asians) to be unemployed increase due to adding control variables, while the odds decrease or do not change for the other groups. Muslims of all ethnicities face the greatest risk for unemployment. The chances of Black Muslims are 194% greater than White Christians to be unemployed (a decrease from Model 1). The chances for Arab Muslims are now 200% greater, making them the group with the highest penalty. Interestingly enough, Arab Christians are far less likely than Arab Muslims to be unemployed suggesting, in this case, that Arab Muslims might be experiencing a religious penalty. This shows that the anti-Arab sentiment discussed in Helly (2004) is more directed towards Arab Muslims rather than against Arabs in general. Among Blacks, both religious groups face a significant penalty, yet the one associated with Muslims is far higher. The same patterns emerged among the South Asian group and among the White group. In these cases, the Muslim group is more likely to be disadvantaged than the other religious groups.
As for the rest of the independent variables, the overall impact is similar to the impact captured by our models of economic inactivity. Compared to the youngest age group, all other age groups were less likely to be unemployed, even the age of 60–64. Women were as likely as men to be unemployed. Married and divorced people were less likely than singles to be economically inactive and less likely to be unemployed as well. As expected, the age of children seems to affect one’s odds of employment. Relative to those with no children, parents of children under the age of 5 or over the age of 14 were more likely to be unemployed, while those whose children were aged 15–24 were less likely to be unemployed. Second-generation and third-generation Canadians are less likely to be unemployed, compared to first generation. Education impacts the odds of unemployment in about the same direction it does the odds of economic inactivity; the higher the educational qualification, the lower the odds of being unemployed, with the effects for Bachelor and Master degrees or above being almost identical. Compared to bilinguals who speak both English and French, those who spoke neither of the two official languages along with those who spoke only English were significantly more likely to be unemployed, with the former having the highest odds-ratio (58% likelier and 12% likelier, respectively). Those who spoke French only were as likely to be unemployed. Compared to living outside the CMAs, the odds of being unemployed were higher in Toronto and lower in Vancouver. Living in Montreal did not seem to significantly change the odds of employment.
Adding the ethno-religious–gender interactions (Table 6, second column) shows that most groups are more likely than White Christians to be unemployed. All Muslim groups (including Hindu South Asian in the case of women) are the most likely to be unemployed. The Arab and West Asian Muslim women are the most likely for both genders to be unemployed.
Occupational attainment
Model 1 in Table 4 compares White Christians to every other group on whether they are more or less likely to hold managerial or intermediary jobs as opposed to manual ones. In Model 2, we perform the same function but this time with the socio-demographic factors and human capital taken into account. Examining the results in relation to managerial occupations reveals that the pattern in both models is very similar for all groups except for Muslim and Hindu South Asians. In Model 2, Muslim South Asians have become similar to the reference group whereas Hindu South Asians have become significantly disadvantaged. Compared to Christian Whites, three of the four other Christian groups (South Asians, Chinese and Arabs) are more likely to attain managerial positions along with Jewish Whites and Chinese. All the other groups, except for Muslim Arabs, are significantly less likely to hold managerial positions than Christian Whites. It seems that Muslim Arabs fare similarly to the majority group in this regard. Moreover, controlling for individual and human capital differences has, in most cases, reduced the ethno-religious differences (the coefficients/logits) that have been found in Model 1, which suggests that some (but not all) of the initial gaps in occupational attainment between the majority White Christians and the other ethno-religious groups can be attributed to differences in the socio-demographic and human capital background. Of the ethno-religious groups, South Asian Hindus and Sikh Buddhist Asians are the only groups that are significantly disadvantaged in both managerial and intermediary occupations.
Coefficients of multinomial logistic regression (logits) of occupational attainment contrasting managerial and intermediary occupations with manual occupations.
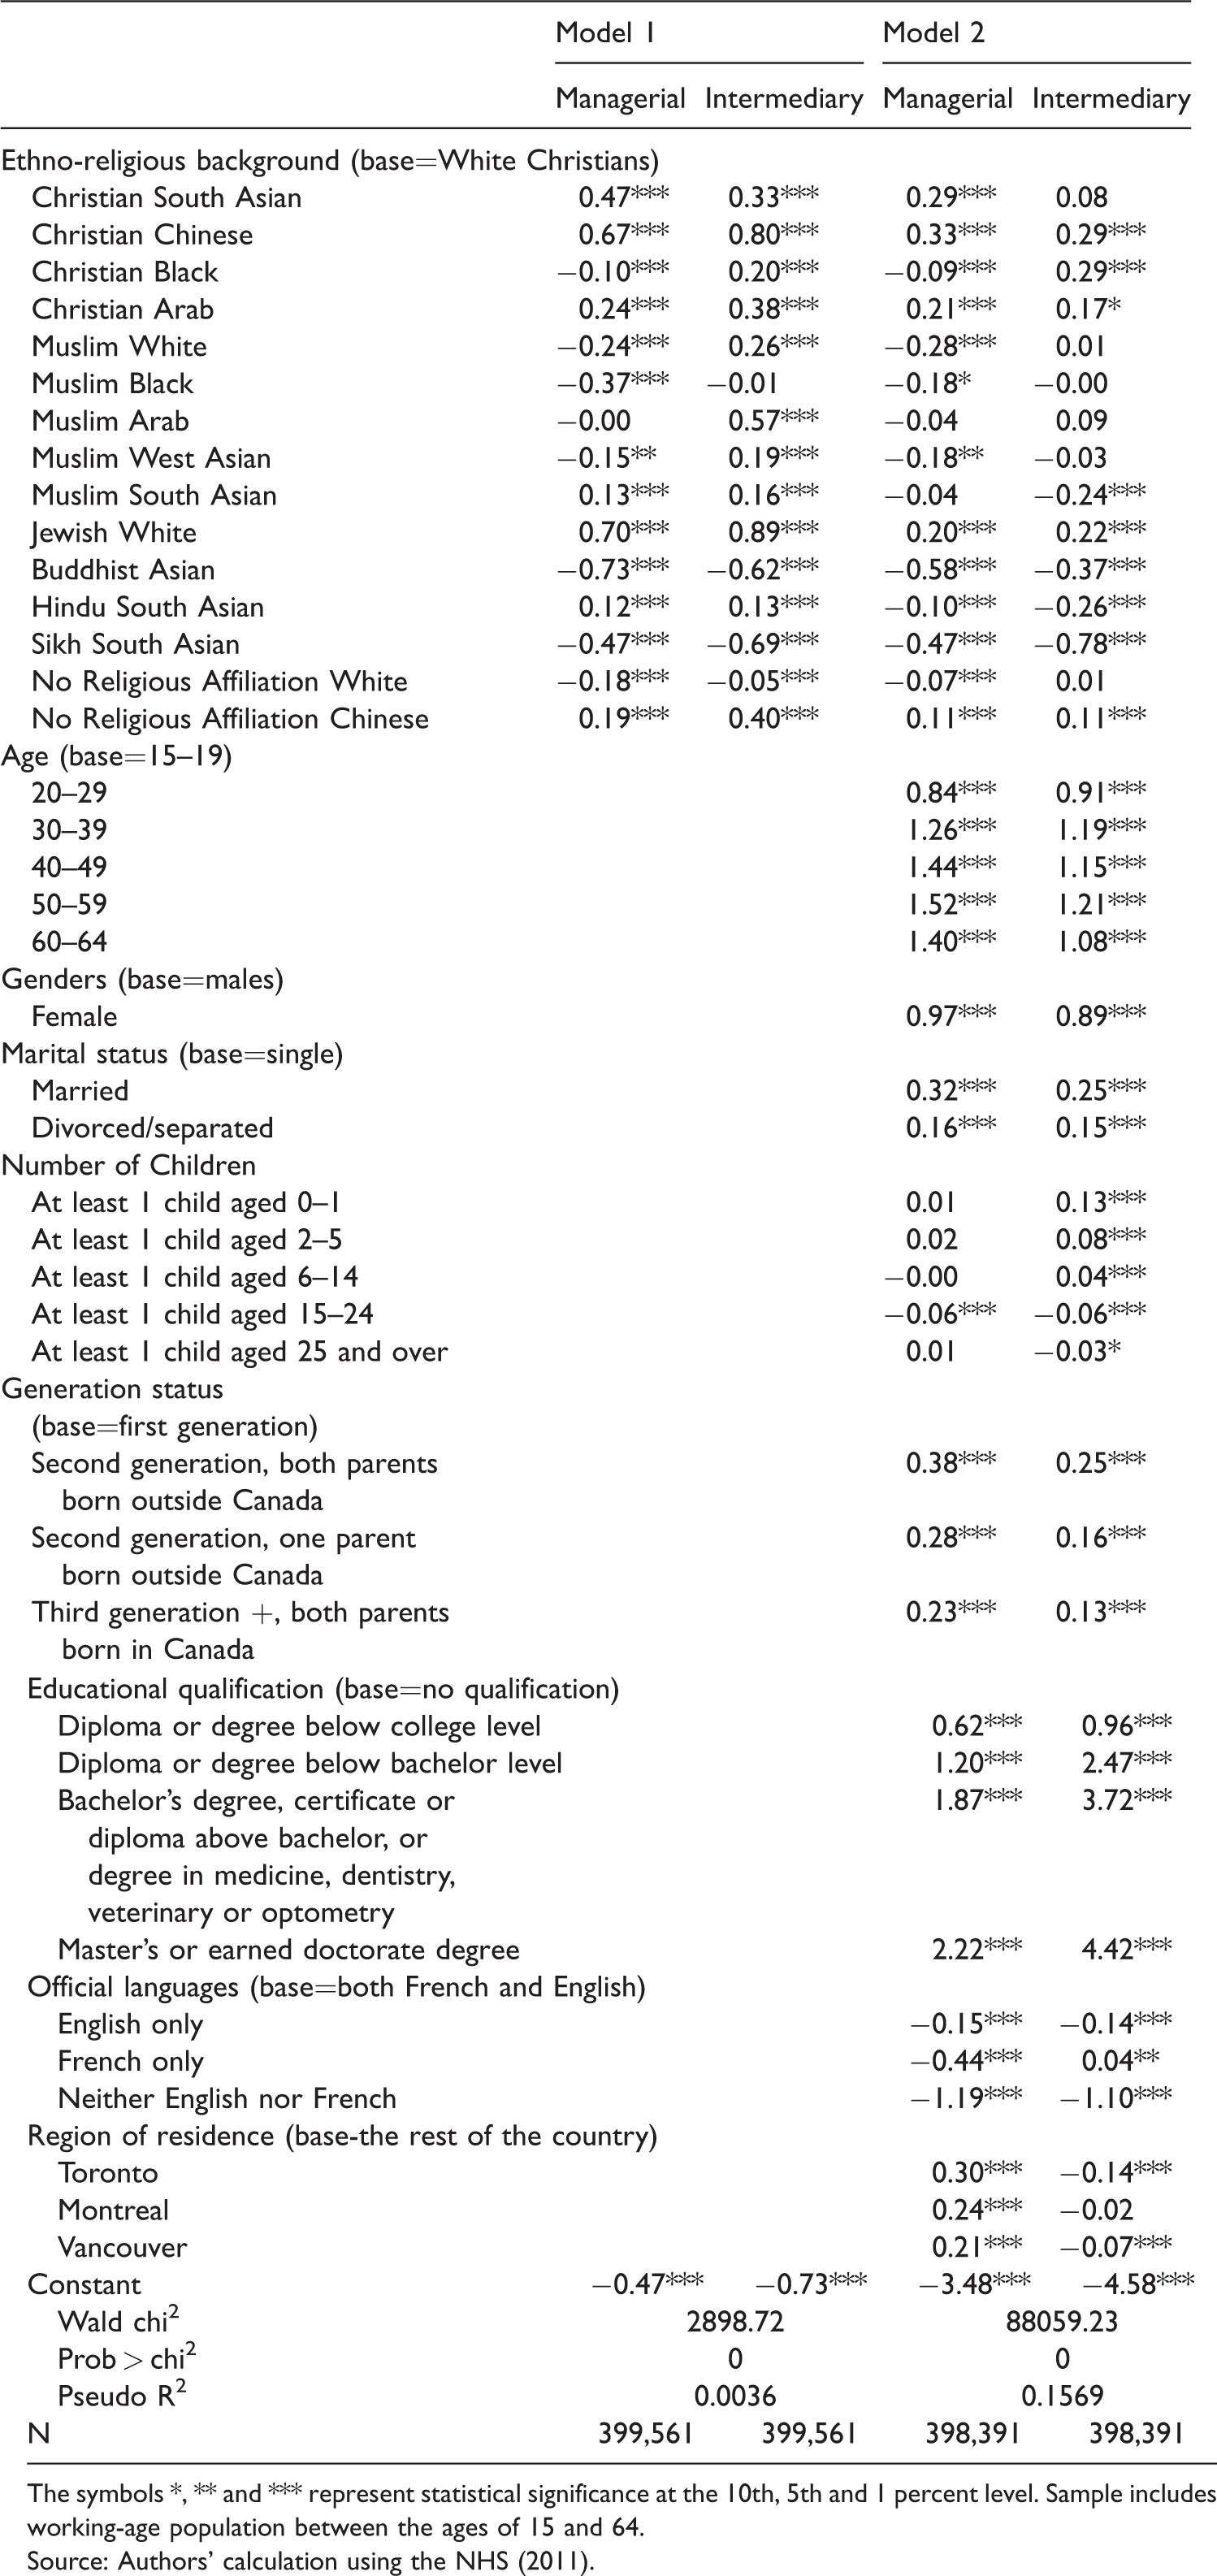
The symbols *, ** and *** represent statistical significance at the 10th, 5th and 1 percent level. Sample includes working-age population between the ages of 15 and 64. Source: Authors’ calculation using the NHS (2011).
The only discernable pattern of the disadvantages (penalties) that these groups face in relation to occupational attainment is the penalty for two non-Muslim South Asian groups and Buddhists. Many groups that are more likely than White Christians to be economically inactive and unemployed, such as Christian Arabs, Muslim Arabs and Muslim Black, are either as likely as White Christians to hold managerial or intermediary positions, or more likely.
Turning to the ethno-religious–gender interactions (Table 6) reveals that in the case of managerial positions (third column), only Muslim White, Muslim Black, Buddhist Asian and Sikh South Asian men are less likely than White Christian men to occupy such positions. In the case of women, non-Christian women of all ethnicities are less likely than White Christian women to hold managerial positions, while non-White Christian Women are more likely, or as likely. In most groups, including White Christians, women are likelier than men to occupy a managerial position, except for Muslim West Asians, Jewish White and Hindu South Asian. In the case of intermediate positions (fourth column), only Sikh South Asian men are less likely than White Christian men to occupy such positions. Almost all groups of women are less likely than White Christian women to hold such a position, except for Christian Black, Muslim White and Muslim Black women. In most groups, women are less likely than men to occupy an intermediary position, except for White Christians, Christian Blacks, Muslim Whites and Muslim Blacks.
Discussion and conclusion
This study builds on previous investigations into the state of structural integration of visible and religious minorities in Canada. Particularly, it presents an attempt to explore the impact of visibility, religious affiliation and ethnicity on labour market outcomes. The results suggest that, relative to White Christians, most ethno-religious groups are significantly disadvantaged in the Canadian labour market, particularly in relation to unemployment. This is not unexpected given findings from previous studies on the structural integration of ethnic and religious minorities (Galabuzi, 2006; Helly, 2004; Model and Lin, 2002; Reitz et al., 2009).
However, because most of the other non-Christian groups happen to be also non-White, as in the case of South Asians, Blacks and other Asians, it is possible that labour market inequalities that we found in relation to unemployment and occupational attainment are a result of ethnic and racial penalties rather than religious. So, in order to explore this possibility further and help disentangling the effect of religion and ethnicity, we should compare first the ethnic groups who belong to different religious backgrounds (South Asians, Chinese, Blacks and Arabs) with the majority group of Christian White Canadians and then compare each of these groups with their co-ethnic counterparts who happen to hold a different faith. For example, if religion is the main contributor to labour market inequalities, then we should find that, regardless of ethnicity, all Christian groups should have better experiences than other religions. However, if ethnicity, rather than religion, is the main engine for labour market inequalities, then these groups are expected to be at least significantly different from the majority group but show similar patterns to those found among their co-ethnic counterparts with different religions.
Considering the performance of South Asians in relation to labour market participation and unemployment shows that the four religious groups (Christian, Sikh, Hindu and Muslims) face different levels of penalty with Muslims encountering the highest level. Likewise, amongst Blacks and Arabs similar pattern emerges, in that Christian Blacks and Christian Arabs face a lower penalty than their co-ethnics who belong to the Muslim faith. Furthermore, considering the performance of Christians reveals major difference on ethnic grounds, with Blacks experiencing the highest penalty. This provides evidence for both types of penalties, ethnic and religious. It seems that both religion and ethnicity play a role, but the evidence suggests that religion has the lion’s share, especially in the case of Muslims, lending further support to previous studies in Canada and Europe (Connor and Koenig, 2015; Heath and Martin, 2013; Helly, 2004). The picture is less clear in the case of occupational attainment than in the case of unemployment and economic inactivity. The higher unemployment risk (chances) amongst minorities means that those who do find jobs are the highly selected due to their skills and unique expertise (i.e. skills in finance or IT). Thus, the apparent advantage in attaining managerial occupations for some groups might only be a selection effect in finding jobs. Moreover, adding interactions between ethnicity, religion and gender does not significantly change the picture and, in the case of occupational choices, further reinforces the importance of selection into the labour force.
Taken together, the findings from the analysis of labour force participation, unemployment and occupational attainment leave little doubt that the dynamic and magnitude of the ethno-religious penalty in the Canadian labour market are also contingent upon the specific labour market outcomes under study. Some groups are likely to face a fixed penalty across the different outcomes, whereas the penalty for other groups is likely to vary across the different outcomes. For example, White Jews were more likely to be economically inactive and more likely to be unemployed than the majority group. However, compared to the majority group, they were more likely to obtain managerial, professional and intermediary occupations than manual occupations. Another example is South Asian Christians: they were more likely than the majority group to be economically inactive or unemployed, more likely to obtain managerial occupations, but as likely to obtain intermediary occupations. Contrary to this, non-Christian South Asian groups (especially Hindu and Sikh) and Buddhist Asians, face a penalty in each of the three labour market outcomes.
It is important, and equally interesting, to point out that most of the differences found in the initial analysis (Model 1 in Tables 2–4) persisted and some even increased, after controlling for age, gender, marital status, number and age of children, generation status, educational qualification, language abilities and region of residence. This strongly suggests that differences in human capital and in other socio-demographic predictors do not fully account for such inequalities. One explanation offered by researchers in this field is discrimination based on visibility and cultural proximity to the hegemonic culture (Khattab and Johnston, 2013). This explanation might be tenable given that members of the hegemonic ethno-religious group were found to be advantaged relative to almost all other groups on almost all measures of economic success. Moreover, this best explains why the differences were produced along the lines of ethnic and religious affiliations and not the amount or type of human capital.
In their discussion of discriminatory employment practices in the US, Portes and Rumbaut (2006: 94) start by observing that ‘widespread discrimination may hold that certain groups should be confined to low-wage menial labour … or it can hold that they are simply too incompetent to be employable at all’. In Canada, Model and Lin (2002: 1063) attributed the differentiation of labour market outcomes on the basis of religious associations to their observation that ‘gatekeepers do not devalue all outsiders equally; they construct a hierarchy of preference, ranking applicants from some backgrounds more favorably than others’. In the UK, quantitative researchers using similar typology on UK’s labour market argue that their results indicate that ethnicity serves as a ‘proxy’ and identify skin colour and religious affiliation as inequality’s main productive and reproductive mechanisms (Khattab and Johnston, 2015).
In closing, while the evidence from this study suggests a strong link between visibility, religious affiliation and labour market inequalities, it is important to point out, as other researchers have, that employment discrimination per se is not captured by a specific variable and could not be directly measured. Hence, the link is not necessarily causal and the unexplained labour gaps are not a direct evidence of discrimination. Koopmans, for one, challenged this interpretation and provided evidence that labour gaps can be explained by sociocultural variables such as host-country language proficiency, host-country family members, liberal gender values, host-country media usage, host-country neighbourhood acquaintances and host-country friendships. Employing data from European surveys of native ethnics and several immigrant ethnic groups of predominantly Muslim background, he found that once sociocultural variables were controlled for, differences in rates of economic inactivity and unemployment between Muslim groups and native ethnics were substantially reduced and in many cases became statistically insignificant (Koopmans, 2016). While the current study did not include all of Koopmans’s sociocultural variables per se, it took into account variables of language proficiency and generation status as proxies for a number of crucial sociocultural influences on cultural integration, and yet the results produced were not supportive of his argument. Other researchers have highlighted the explanatory value of class background and other forms of social and ethnic capital (Modood, 2004). All in all, while this study has arguably provided compelling evidence that religious affiliation and physical visibility play a crucial role in determining labour market outcomes, further investigations should not underestimate the explanatory potential of social capital and sociocultural factors.
Footnotes
Acknowledgements
The authors would like to thank the three anonymous reviewers for their comments and suggestions that significantly contributed to improving the final version of the paper. They would also like to thank Statistics Canada for providing the data, the Editors of Ethnicities for their support during the review process and Mr. Yazid Khattab for his diligent proofreading of this paper.
Declaration of conflicting interests
The authors declared no potential conflicts of interest with respect to the research, authorship, and/or publication of this article.
Funding
The authors received no financial support for the research, authorship, and/or publication of this article.