
Abstract
Although natural gas hydrates and hydrate exploration have been extensively studied for decades, the reaction kinetics and nucleation mechanism of hydrate formation is not fully understood. In its early stage, gas hydrate formation can be assumed to be an autocatalytic kinetic reaction with nucleation and initial growth. In this work, a reaction kinetics model has been established to form structure II methane–propane hydrate in an isochoric reactor. The computational model consists of six pseudo-elementary reactions for three dynamic processes: (1) gas dissolution into the bulk liquid, (2) a slow buildup of hydrate precursors for nucleation onset, and (3) rapid and autocatalytic hydrate growth after onset. The model was programmed using FORTRAN, with initiating parameters and rate constants that were derived or obtained from data fitted using experimental results. The simulations indicate that the length of nucleation induction is determined largely by an accumulation of oligomeric hydrate precursors up to a threshold value. The slow accumulation of precursors is the rate-limiting step for the overall hydrate formation, and its conversion into hydrate particles is critical for the rapid, autocatalytic reaction. By applying this model, the memory effect for hydrate nucleation was studied by assigning varied initial amounts of precursor or hydrate species in the simulations. The presence of pre-existing precursors or hydrate particles could facilitate the nucleation stage with a reduced induction time, and without affecting hydrate growth. The computational model with the performed simulations provides insight into the reaction kinetics and nucleation mechanism of hydrate formation.
Introduction
Gas hydrates are crystalline structures that are formed from water and gas at high pressures and low temperatures. 1 Typical “guest” molecules, such as methane, ethane, propane, and carbon dioxide, are entrapped in “host” water cages, which mostly yield cubic crystals of structure I (s-I) or structure II (s-II) 2 with microscopic constructions of s-I and s-II hydrate unit cells as illustrated in Figure 1.***
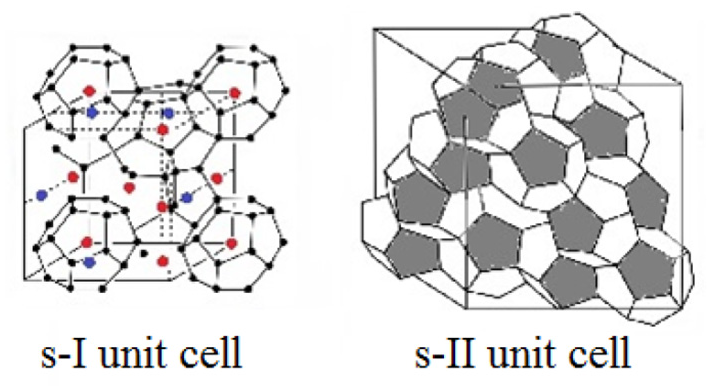
Unit cell assembly of crystalline structure I (s-I) and structure II (s-II) gas hydrates. The s-I unit cell consists of 2 small 512 cavities and 6 large 51262 cavities, and the s-II unit cell consists of 16 small 512 cavities and 8 large 51264 cavities.
Gas hydrates are an industry nuisance when they form in oil–gas pipelines and prevent flow, which causes flow-assurance issues. 4 Common circumstances include that the residual water in the multiphase flow or on the pipe wall would react with suitable natural gas components both above the liquid phase and inside the bulk fluid to form hydrate particles. The process can be slow initially and catastrophic eventually, producing a large amount of hydrate accumulated along the pipe wall and inside the bulk, very likely in the form of a hydrate plug. Remediation of formed hydrate plug to remove the blocking of oil and gas flow usually costs a great deal and causes inconvenience to the production practices by oil companies. On the other hand, the enormous amount of in situ methane hydrates that exist in permafrost and oceanic sediments offers high potential as a future clean-energy source.5,6 It has been debated whether exploration or the in situ melting of hydrates would damage the climate and environment severely, should an unexpected release of methane gas occur.7,8 Recently, researchers have started to study hydrates for use in rewarding engineering applications, such as carbon capture and storage,9,10 hydrate-based gas separation, 11 hydrogen storage, 12 and seawater desalination. 13
From a hydrate-science perspective, the knowledge gap is that its nucleation mechanism is not understood fully, nor has the overall formation process been described in detail. Hydrate formation is divided empirically into two consecutive stages of nucleation and growth with no rigid boundary between them. The rapid, catastrophic growth stage is controlled mainly by mass transfer,14–17 heat transfer,18–21 or coupled mechanisms22–28 that include intrinsic kinetics.29–33 Primary nucleation is a free-energy-driven and statistically random process that is highly sensitive to the driving force. During nucleation and early-stage growth, the mass- and heat-transfer resistance is relatively small, with observable hydrate crystals not yet present in solution. In such cases, the intrinsic kinetics would be influential and should be considered. However, limited literature exists on applying reaction kinetics methodologies (e.g. enzymatic and autocatalytic reactions 34 ) with numerical computations to study hydrate formation. This could be because there is no chemical bonding or strong force between the host and guest molecules in gas-hydrate structures. Weak van der Waals forces maintain the hydrate crystalline structure stability. 35
The aims of this study were to develop a computational model for s-II methane–propane hydrate formation and obtain insights into its intrinsic reaction kinetics and molecular mechanism via numerical simulations. The modeling involved challenging tasks to derive reasonable pseudo-elementary reactions, corresponding rate equations, model computation, and deduction of rate constants. The model was used to simulate several key steps in the hydrate-formation process. These included gas dissolution, a slow accumulation of hydrate precursors, slow hydrate formation, and rapid autocatalytic hydrate growth. The simulation results for the fresh water–gas system were compared with experimental hydrate data so one could see to what extent the model could simulate the process. The so-called “memory effect” phenomenon, which indicates that hydrate onset occurs more rapidly and less randomly if the aqueous phase involves a thermal history of a previous hydrate or ice formation and melting process,29,36,37 was also studied with the model. A current hypothesis is that a trace amount of residual clusters of water molecules or hydrate-cage-like structures remain in the aqueous phase after hydrate dissociation and before the next-round hydrate formation. Positive and negative results that support and oppose this hypothesis, respectively, have both been reported from experimental studies,38,39 and molecular dynamics (MD) simulations.40–42 The methodology to establish a reaction kinetics–based computational model for simulations could provide an alternative approach to study hydrate-formation kinetics and may yield new insights into the process. Such an understanding is important to both hydrate science and engineering.
Experimental
Experimental setup
Figure 2 shows a schematic diagram of the isochoric experimental apparatus and setup. A high-pressure titanium autoclave was used as the hydrate-formation vessel. The reactor with a cylindrical geometry had an inner volume of 141.3 mL. The temperature was measured using a 1/10 DIN Pt-100 temperature sensor with an overall accuracy of ±0.1 K. Two temperature sensors were mounted to allow for simultaneous temperature monitoring in the vapor and aqueous phases. A pressure gauge with a Rosemount 3051 TA absolute pressure transmitter provided pressure readings with an accuracy of ±0.02 MPa. A refrigerating and heating circulator (model Julabo F 34 HL) was used for temperature control by circulating cooling/heating water through the water jacket of the reactor. It had an integrated programmable user interface with a temperature stability of ±0.01 K. LabView was installed on the laboratory personal computer to monitor and record data at 3-s intervals to show real-time pressure/temperature (PT) variations on the computer screen.
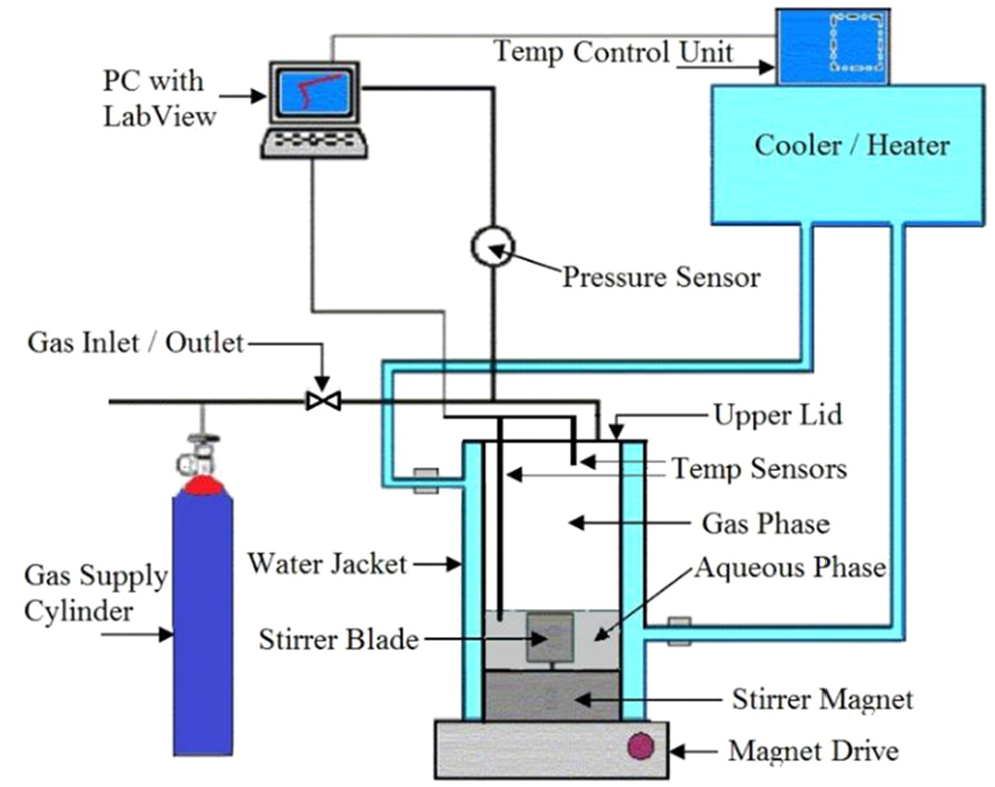
Experimental apparatus and setup used in gas-hydrate studies.
The gas cylinder delivered a synthesized natural gas mixture (SNG2) of methane and propane supplied by Praxair Norway, of 92.5 mol% methane and 7.5 mol% propane. SNG2 gas and water form s-II hydrate. The binary SNG2 has the same composition, thermodynamic properties, and equilibrium curve as that investigated by Abay and Svartaas. 43
Experimental method
To obtain realistic rate constants for the modeling and simulation, gas-dissolution tests were performed prior to the hydrate-formation experiments. Gas dissolution and hydrate-formation experiments were conducted under isochoric and isothermal conditions. The preparation stage for each experiment was similar. The reactor was cleaned thoroughly, rinsed with distilled water, and air-dried. Before changing the vapor phase to the experimental PT conditions, the reactor was purged twice with the actual gas at 4.0 MPa to remove residual air.
Gas-dissolution tests were carried out with 91.3-mL SNG2 gas and 50-mL distilled water at 6.3 MPa and 293.15 K. Agitation (750 r/min) was used to stir the gas into the aqueous phase. The amount of free SNG2 gas in the reactor, initially, during, and after the dissolution process was calculated using the ideal gas equation PV = znRT. The compressibility factor, z, was calculated based on the Dranchuk and Abou–Kassem equation of state.
In the hydrate-formation experiments, 91.3-mL SNG2 gas and 50-mL distilled water were loaded into the reactor and stabilized at 6.3 MPa and 293.15 K. The system was cooled with a constant cooling rate of 2 K h−1 without stirring until it reached the experimental PT of 6.1 MPa and 288.15 K. The magnetic stirrer was started at a fixed rate of 750 r/min, which denoted the start of the experiment and time zero for the measurement of induction time. The induction time was measured from the start of stirring to the first sign that indicated hydrate onset, that is, the first temperature peak with gas consumption (Figure 3).
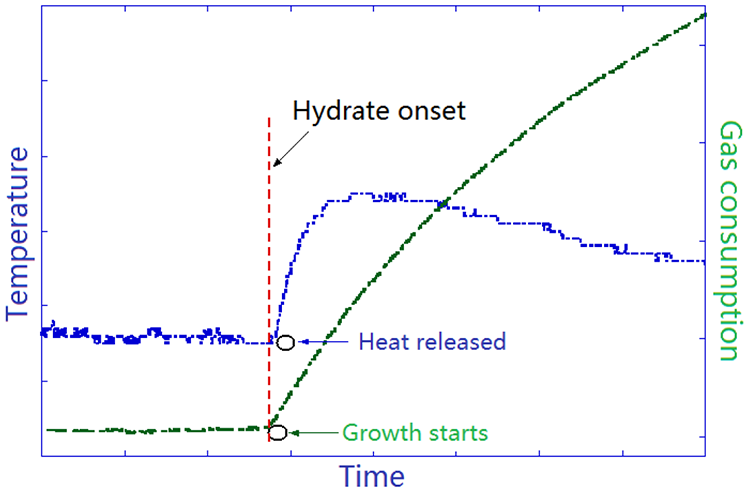
Illustration of temperature (left Y-axis, blue curve) and gas consumption (right Y-axis, green curve) variations shortly before and after hydrate onset.
Computational model
The reaction kinetics model proposed for s-II methane–propane hydrate formation and the simulation process are described below. The following two assumptions were considered:
The nucleation and initial growth stage with no observable hydrate crystals is controlled mainly by the intrinsic reaction kinetics. In a water-access system, the mass-transfer resistance is reflected partially by integrating gas dissolution in the model.
The three-phase mixture that contains water, gas, and hydrate/precursors is assumed to be a homogeneous slurry that bears uniform physical and thermodynamic properties.
The following sections present the pseudo-elementary kinetic reactions, the rate equations, the computing process, and the deduction of rate constants for the simulations, respectively.
Pseudo-elementary kinetic reactions
Our computational model comprised six pseudo-elementary reactions, which were defined by processes M1–M5 (see graphical illustration in Figure 4). Seven time-dependent variables, including three reactants and four products, were involved in this specific hydrate-forming system. The reactants were water (H2O), and free gas components methane (CH4(g)) and propane (C3H8(g)). The products were hydrate particles (
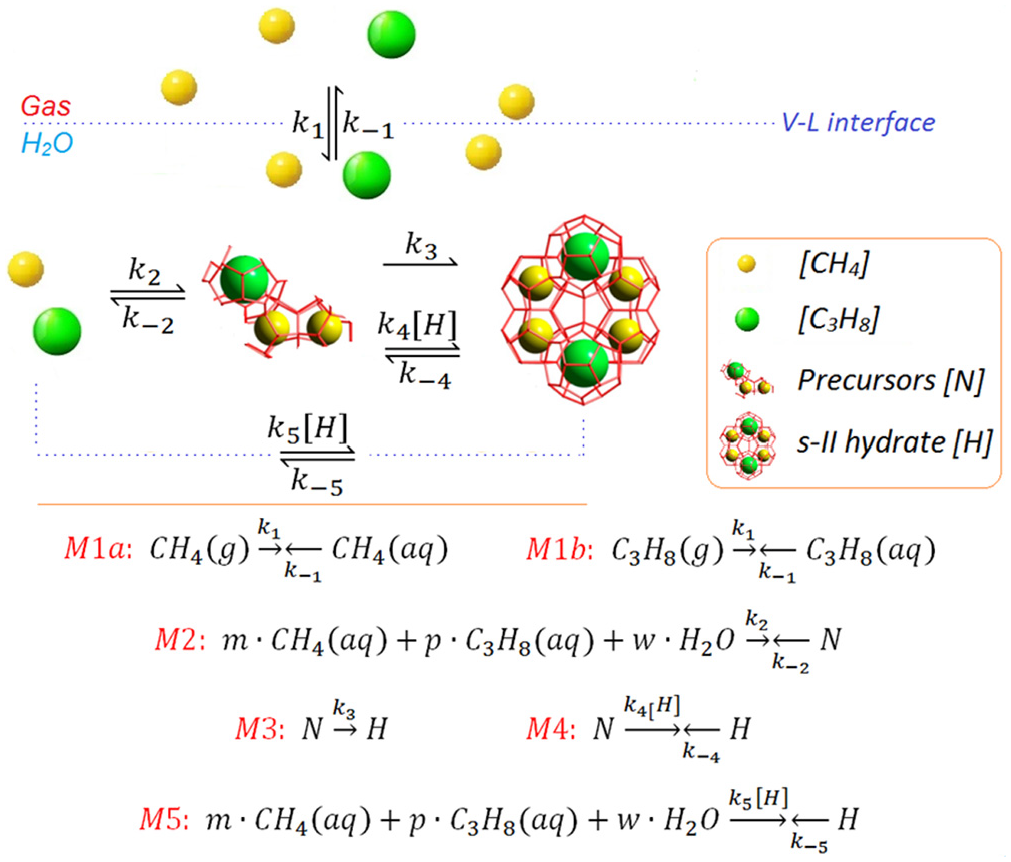
A reaction kinetics model with pseudo-elementary processes established for s-II methane–propane hydrate formation.
As illustrated in Figure 4, M1a and M1b describe the dissolution and effervescence processes of gaseous methane and propane into and out of the liquid phase. M2 describes the reversible formation of precursors
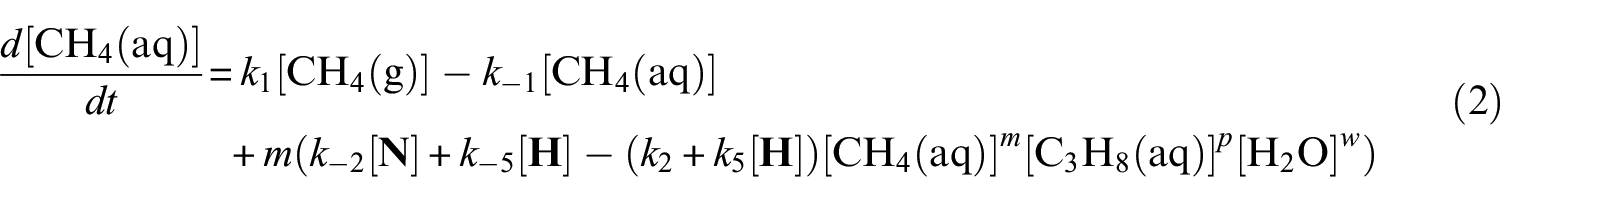
Rate equations
With defined pseudo-elementary processes M1–M5 described in the “Pseudo-elementary kinetic reactions” section, rate equations for each reactant and product can be written as equations (1)–(7) below and solved mathematically. The use of square brackets refers to the real-time mass (in mol) of each component in the system. For example, [CH4(aq)] is the mass of dissolved methane gas in the aqueous phase in mol, a time-dependent variable along the entire reaction/simulation process. Variables m, p, and w are dimensionless, non-stoichiometric ratios for dissolved methane, propane, and water to react and form precursors


Model computations
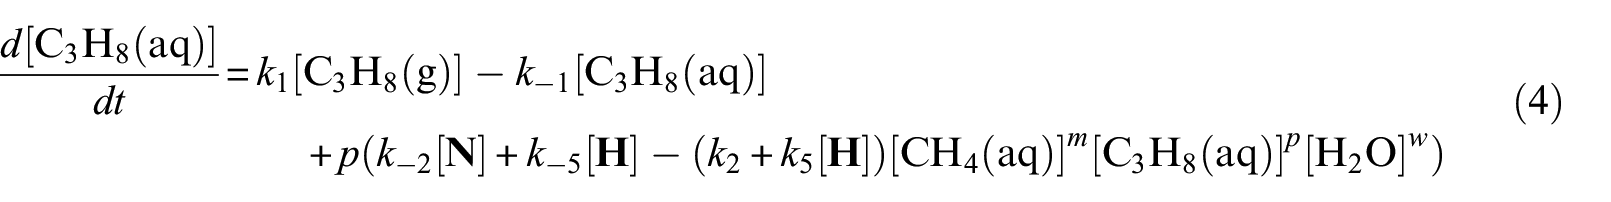
FORTRAN was used to program the established reaction kinetics model with the derived rate equations. The fortran77 compiler version was used for compiling and generating executable (.exe) files for numerical computations. The rate equations (1)–(7) were integrated with FORTRAN subroutine LSODE. 44 Double-precision computations were performed on a UNIX system at the University of Stavanger, and on a LINUX system using the Ubuntu platform (version 14.04 LTS) at Tsinghua University. Figure 5 shows a flowchart of the simulation and computing process.
Simulation and computing flow chart.
A user-defined input (INP) file was called each time for input values to run the executable file. In the INP file, the following parameters were specified: (1) the initial amounts of species at t = 0, (2) the rate constants and non-stoichiometric factors, and (3) the simulation time and time step. In a fresh system with 91.3-mL SNG2 and 50-mL water, the initial amounts were [CH4(g)] = 0.247 mol, C3H8(g) = 0.020 mol, and [H2O] = 2.780 mol. A time step of 0.1 min was used. GNUPLOT, as integrated in PERL, generated graphical output with the computed numerical results.
Deduction of rate constants and factors
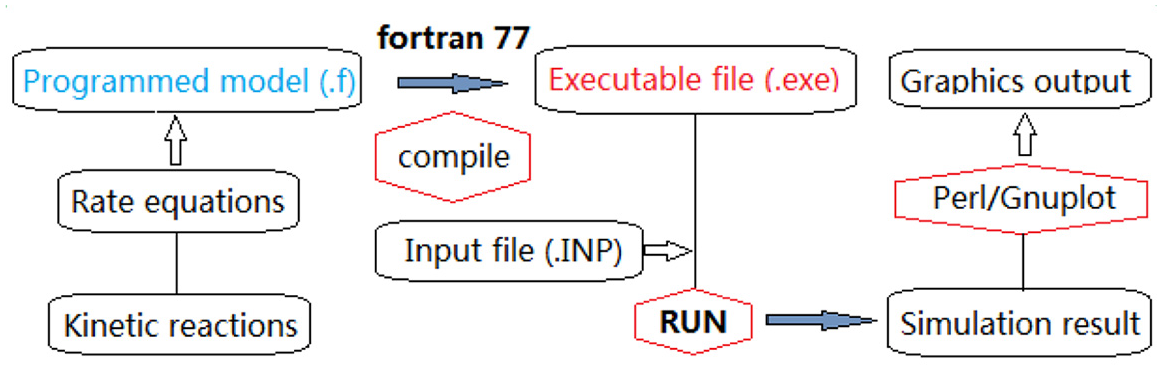
The deduction of k1 and k–1 in processes M1a and M1b through gas-dissolution tests is presented in the “Experimental results” section. The other rate constants, k2–k–5 in processes M2–M5, were data that were fitted subsequently with an induction time of 199.9 min, which was comparable with the 195.2 min that was measured during the experiment. The non-stoichiometric factors, m, p, and w, are normalized values based on previous flash calculations by Abay and Svartaas. 43 Their calculation showed that the molar ratios of methane, propane, and water in the formed SNG2 hydrate phase were 0.0810, 0.0494, and 0.8696, respectively. The rate constants and factors used for numerical computations are summarized in Table 1.
Rate constants and non-stoichiometric factors used in numerical computations.
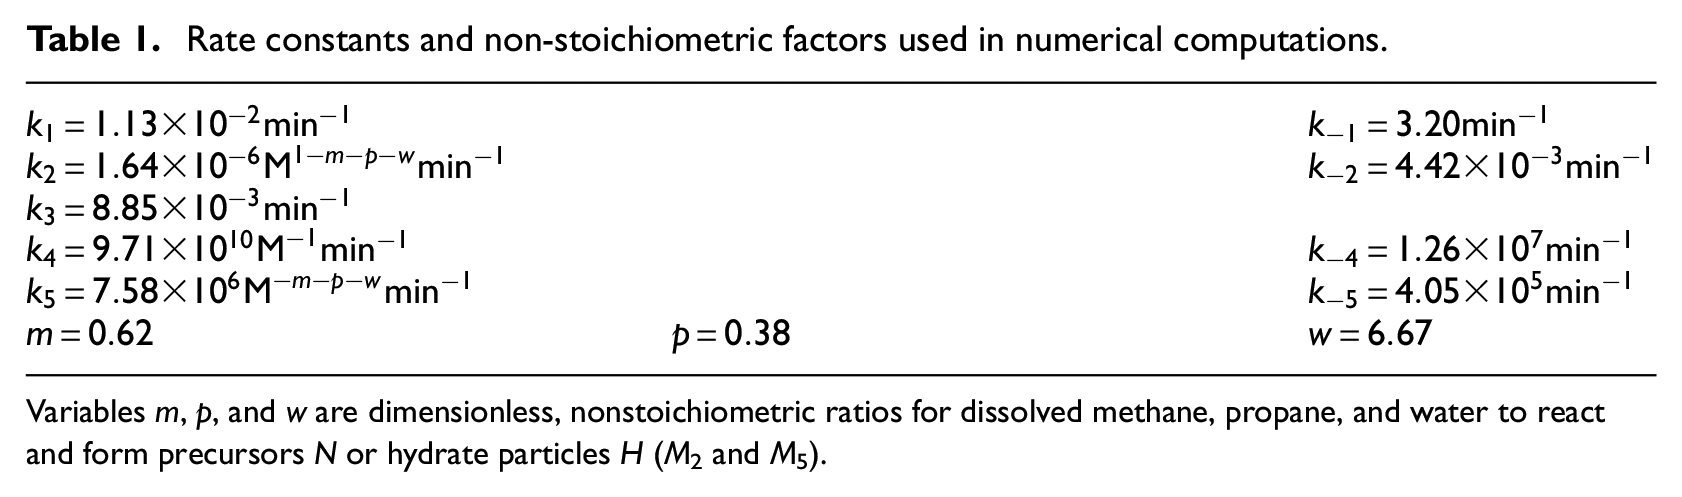
Variables m, p, and w are dimensionless, nonstoichiometric ratios for dissolved methane, propane, and water to react and form precursors N or hydrate particles H (M2 and M5).
Experimental results
SNG2 gas dissolution
The SNG2 gas-dissolution results are presented in Figure 6. No hydrate was formed as the dissolution experiment was conducted outside the hydrate region. The amount of dissolved gas (0.003 mol) was considerably less than that of free water (2.780 mol). Therefore, the dissolution process was expected to follow the standard reversible pseudo first-order kinetics 31 with the following rate law
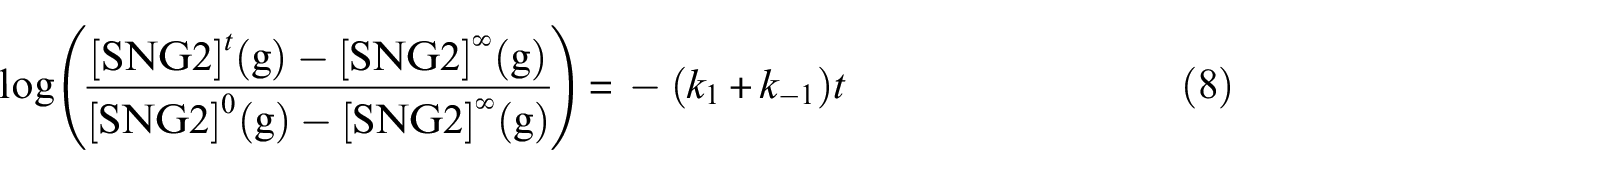
where [SNG2]0(g) is the molar SNG2 concentration in the gas phase at time zero (prior to the start of stirring), [SNG2] t (g) is the molar SNG2 concentration in the gas phase at time t, and [SNG2]∞(g) is the respective equilibrium value (liquid phase being saturated with SNG2 under stirring). The experimental gas-dissolution data are given in the Supplemental Material.
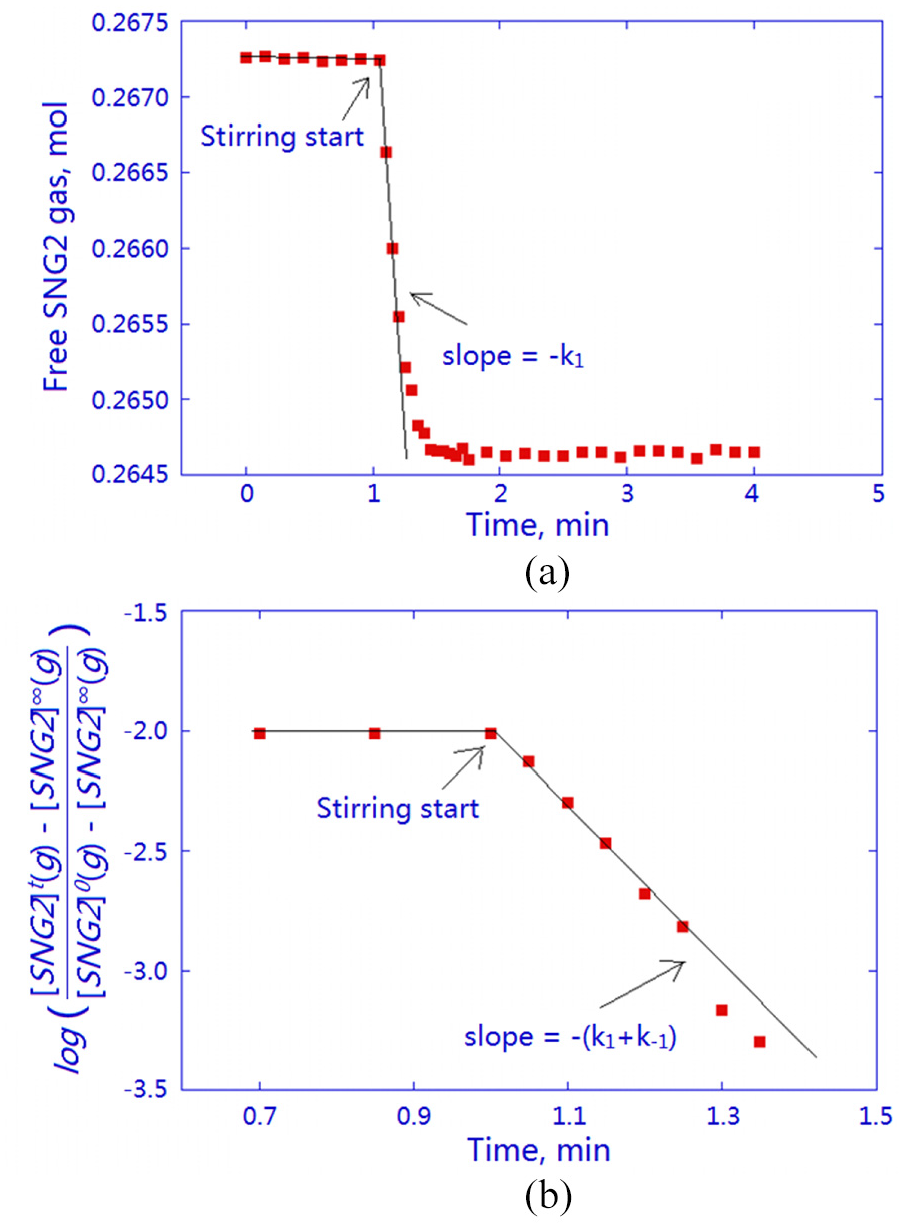
(a) Kinetics of the molar free SNG2 variations when the gas was stirred into the aqueous phase. Initial conditions: 6.3 MPa, 293.15 K, 50-g water (2.780 mol), 91.3-mL SNG2 (0.267 mol). (b) Plot showing that unreactive gas dissolution follows reversible first-order kinetics.
The rate constant k1 was found through the slope in Figure 6(a) from the start of stirring. Figure 6(b) shows that the reversible pseudo first-order kinetics in equation (8) were obeyed, and a slope that equals –(k1 + k–1) resulted. The rate constants for SNG2 dissolution and effervescence into and out of the liquid phase were deduced as k1 = 1.13 × 10⁻² min−1 and k–1 = 3.20 min−1, respectively.
The k1 and k–1 values that are derived here are valid for this experimental system only, with the specified setup, gas compositions, and the initial water–gas ratio. With a changed experimental setup or initial conditions, dissolution tests may have to be repeated and k1 and k–1 re-determined for appropriate numerical computations.
Reaction of SNG2 with water
Figure 7 presents hydrate-formation data with PT profiles and mass variations of free SNG2 gas during the reactive phase. An abrupt pressure drop and a temperature peak upon onset marked the beginning of the reactive phase, where SNG2 gas and water reacted with each other to form hydrates. The measured induction time was 195.2 min, followed by a growth period of 48 min before the reactor was heated and the hydrate-free region was re-entered.
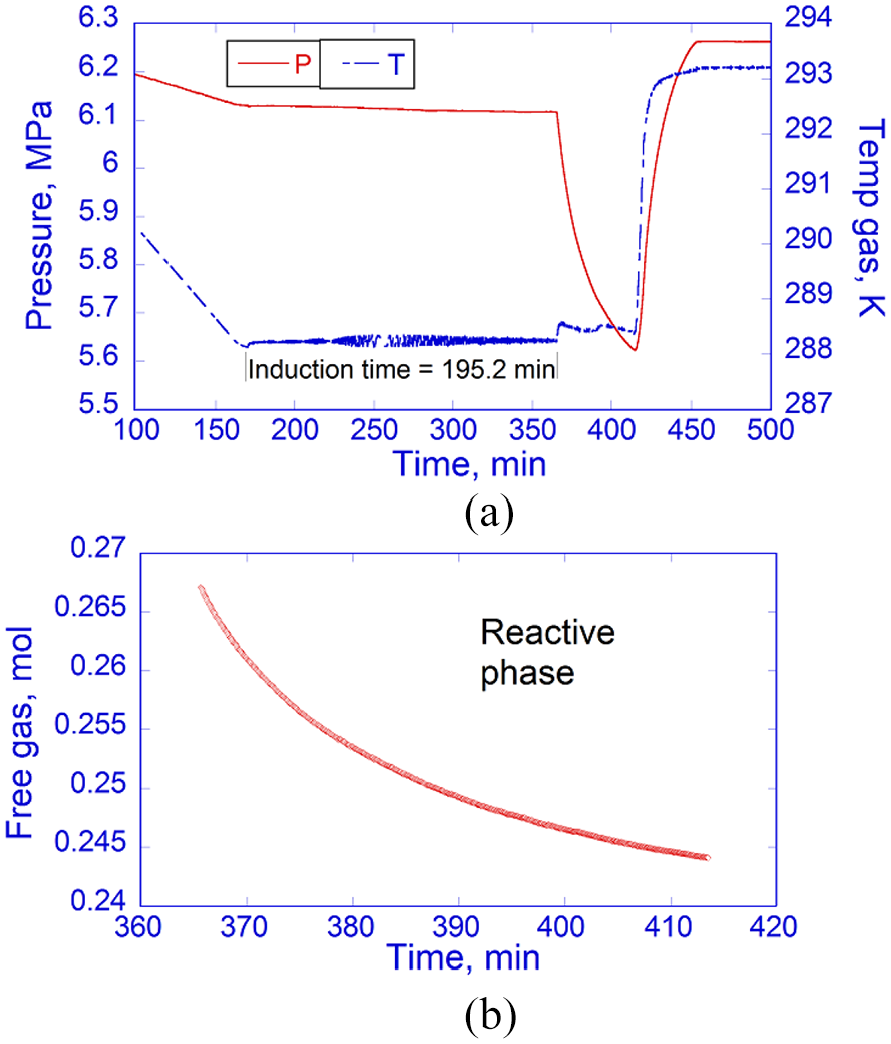
(a) PT profiles before and after hydrate onset in the hydrate formation experiment. The measured induction period was 195.2 min. (b) Growth period of 48 min (365–413 min) with SNG2 gas consumption in the reactive phase.
A total of 2.298 × 10⁻² mol of gas was consumed for hydrate conversion during the growth stage. The experimental hydrate nucleation and growth data are presented and compared with the simulation results in the following section. The measured SNG2 hydrate-formation data are given in the Supplemental Material.
Computational results
Clean water–gas system
Figure 8 shows the simulation results of hydrate nucleation and growth for a fresh SNG2–water system. Mass variations of free gases, CH4(g) and C3H8(g), dissolved gases, CH4(aq) and C3H8(aq), precursors
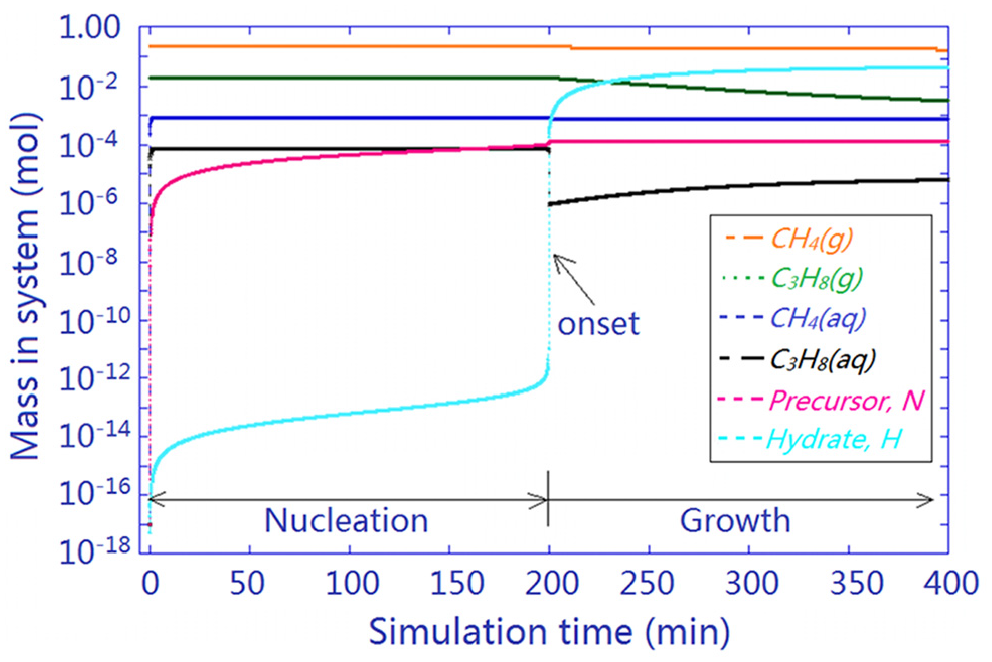
Simulated hydrate formation in a clean water–gas system with an induction period of 199.9 min and a growth stage thereafter. Initial conditions: 2.780-mol water, 0.247-mol methane, and 0.020-mol propane. Simulation time step: 0.1 min.
A small amount of water (0.152 mol, or 5.47 wt%) was consumed according to the simulation; therefore, its variation in this water-access system is not shown in Figure 8. The amount of formed hydrates was limited by the amount of free gas available. Both CH4(aq) and C3H8(aq) were consumed instantly upon hydrate onset, followed by a mass reduction of CH4(g) and C3H8(g) along the growth stage to accumulate hydrate mass
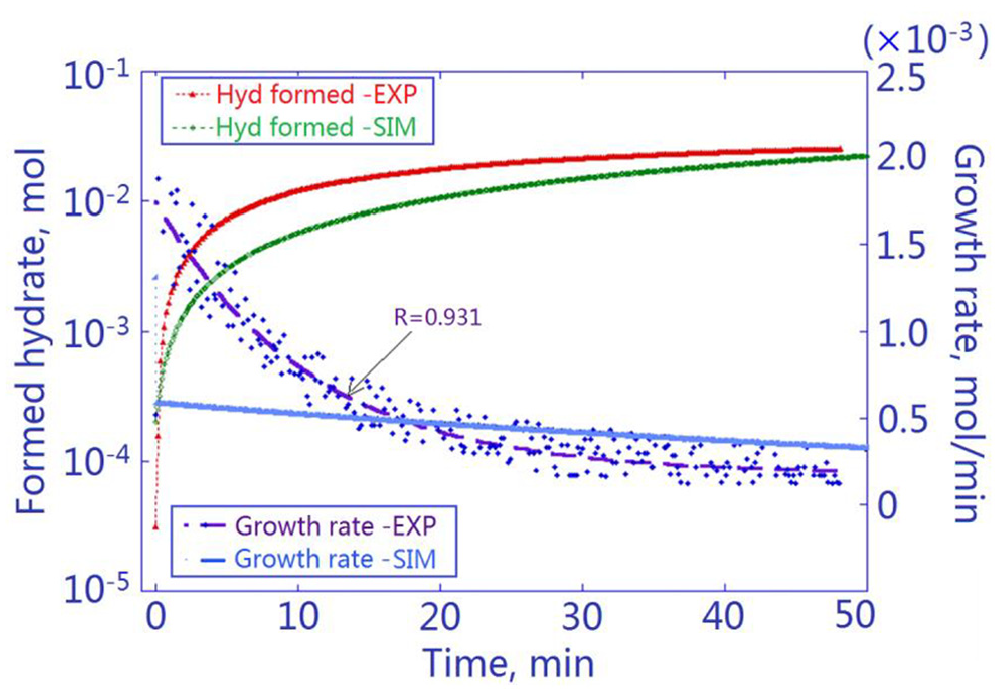
SNG2 hydrate formation: experimental versus simulation results. The blue dots are the real-time growth rates in the hydrate experiment, curve-fitted to give a decaying rate profile.
It can be seen that the initial hydrate growth rate (during the first minute after onset) was 1.70 × 10⁻³ mol min−1 by experiment, while the simulated initial rate was merely 5.67 × 10⁻⁴ mol min−1. The agreement on initial growth rate was non-ideal, indicating that the developed simulation package in its current form needs to be fine-tuned for more delicate computations.
Subsequently, the experimental growth rate underwent a faster decay toward zero. The simulated hydrate formation, on the other hand, produced a milder growth profile with a slower hydrate accumulation and a slower decay in the rate of growth. Nevertheless, close average growth rates by experiment (4.79 × 10⁻⁴ mol min−1) and simulation (4.55 × 10⁻⁴ mol min−1) were observed. This led to a fair agreement on the total amount of hydrate formed (2.298 × 10⁻² mol by experiment vs 2.275 × 10⁻² mol by simulation) within the growth period.
Pre-existing precursors/hydrates and memory effect
Varied initial amounts of
Figure 10 shows the effects of varied initial
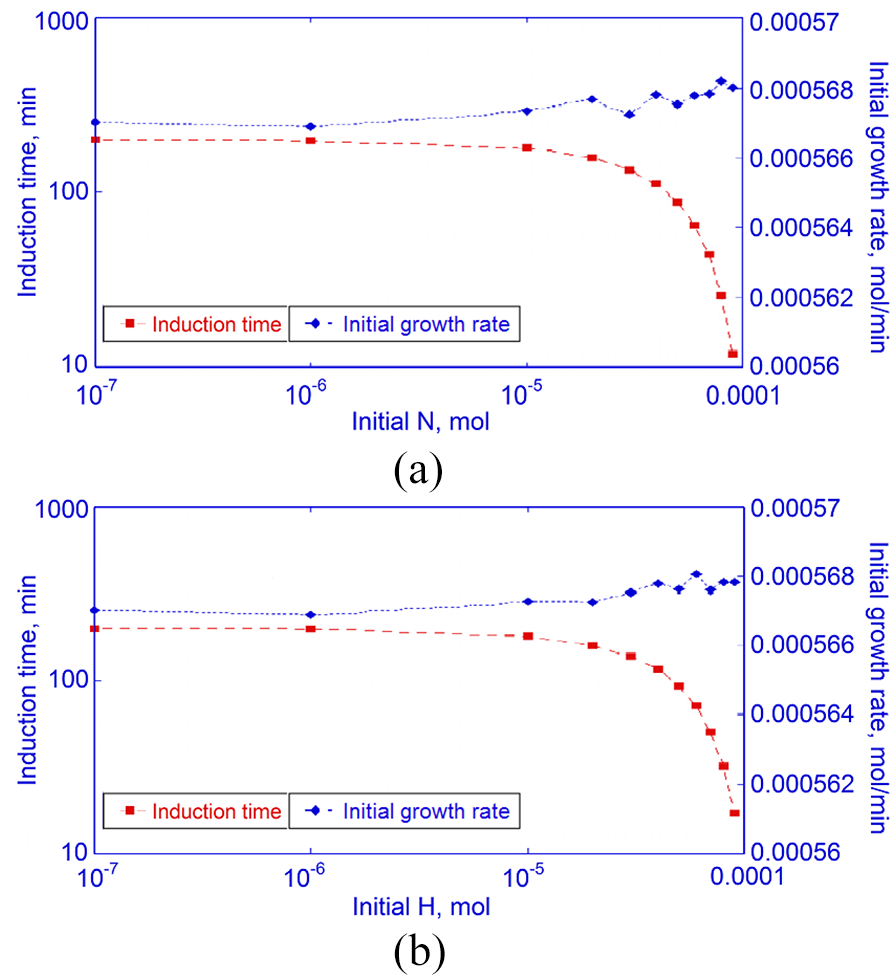
Impact of pre-existing (a) precursors
With pre-existing
Another point of interest with pre-existing
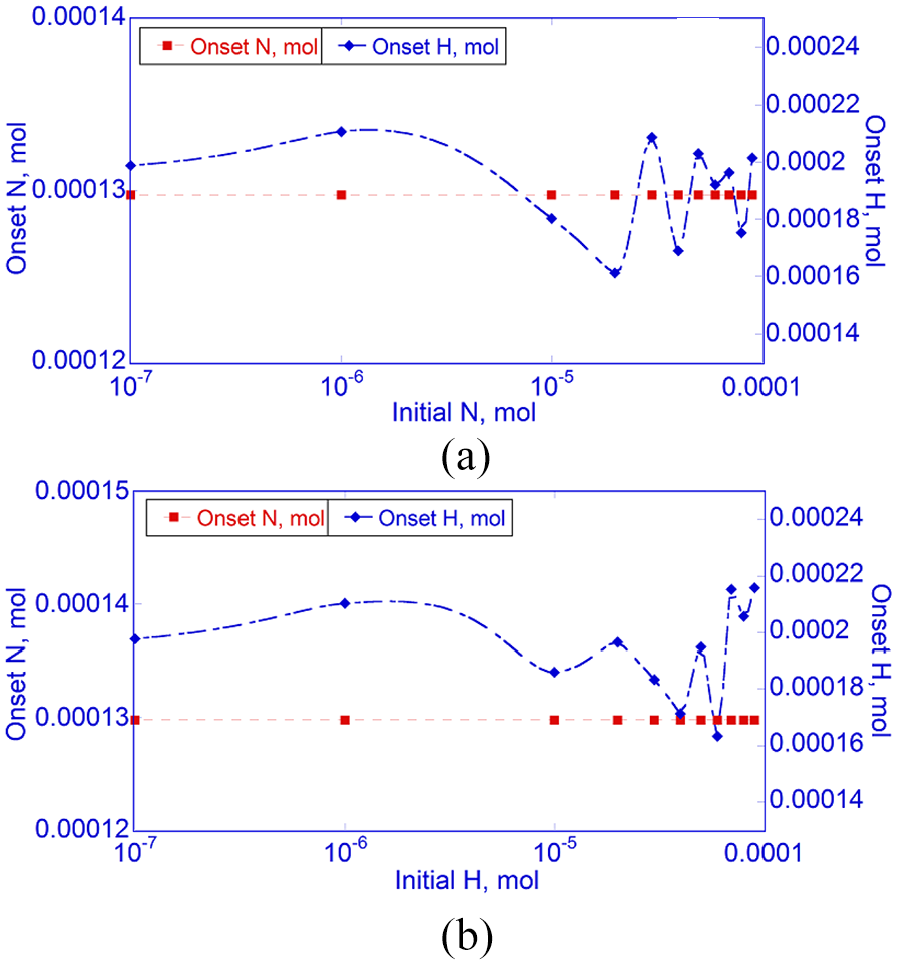
Effects of pre-existing (a)
As the initial
As Figure 12 shows, a pre-existing
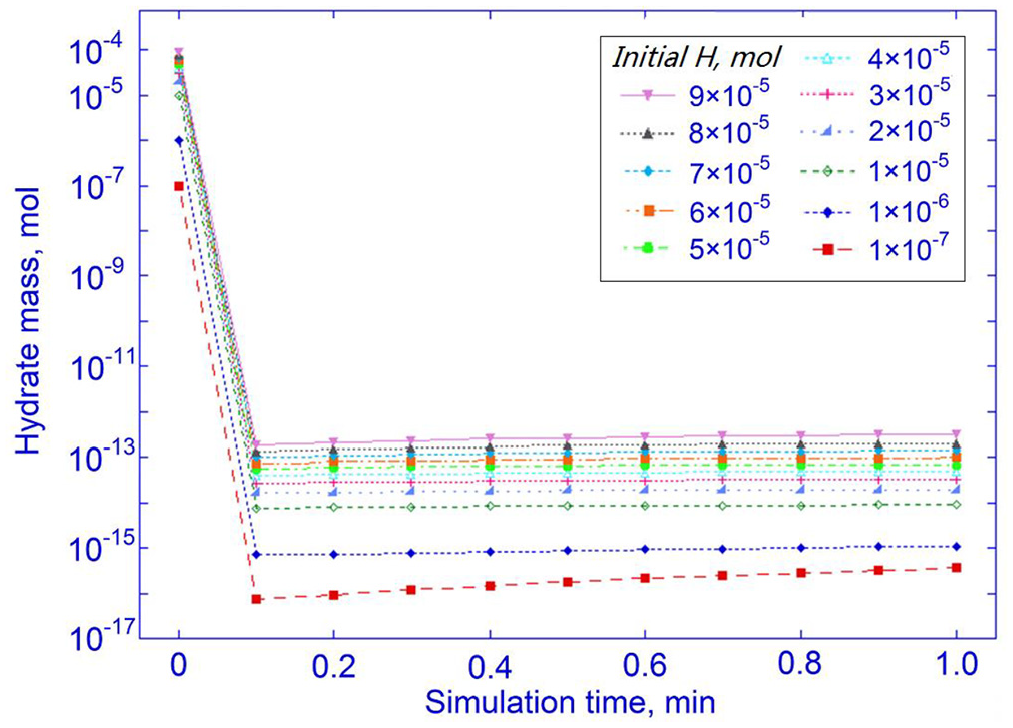
Hydrate mass variation in the first minute of simulation in the presence of pre-existing
This could be related to the reaction kinetics. Before rapid growth (M4–M5) could occur, trace amounts of pre-existing
Discussion
Gas solubility
The gas solubility will decrease upon the appearance of the solid hydrate phase, despite the decreased temperature in the hydrate region.47,48 The rate constants k1 and k–1 that were derived from gas-dissolution experiments are applicable to the induction stage only. With the hydrate onset that was observed in the reactor, or was simulated to occur, k1 and k–1 may need to be re-evaluated for the post-nucleation stage. Rate constants k1 and k–1 were approximated as constants in this work as it was difficult to determine the temperature-dependent solubility profile under the experimental PT with ongoing hydrate formation. This approximation will inevitably affect the accuracy of the simulation. With a reduced k1 after hydrate onset, the simulated hydrate growth is expected to have a decreased growth rate as the growth stage proceeds with time. To improve the model, a more precise measurement of gas solubility as a kinetic variable in the presence of hydrate phase could be performed in future.
Particle concentration versus embryo size
According to classical nucleation theory, 49 nucleation is a dynamic process, and only hydrate nuclei that reach a critical size are energetically favorable to sustain growth. However, it is impractical to incorporate the embryo size as a valid parameter in the current reaction kinetics model. Instead, the modeling and simulation in this work concerns the hydrate-formation process from a mass/concentration perspective. An additional laser scanning module device mounted on the current experimental setup for real-time, in-situ monitoring and collection of particle information would help correlate the size and concentration of hydrate particles as a function of temperature, pressure, and properties of the reacting species. Such an updated system would allow observation of numerous simultaneously growing and shrinking crystal embryos, for experimental validation of our simulations with calculations of species concentrations. Future experimental reaction kinetics modeling and MD simulations are expected to provide new insights.
Memory effect and nucleation mechanism
The labile cluster hypothesis proposed by Sloan and co-workers50,51 claims that hydrate nucleation starts with pure water. The essence is that the labile clusters formed from transient ring structures of water and dissolved gas eventually agglomerate into critical-sized nuclei and initiate subsequent growth. The memory effect says that one could expect faster nucleation if a hydrate-forming system is “seeded” with such labile clusters (equivalent to
The local structuring nucleation hypothesis that was proposed by Radhakrishnan and Trout
46
claims that nucleation starts with dissolved gas. They argue that the spatial configuration of dissolved gas molecules is rearranged first because of local thermal fluctuations which perturb the water structures around them. A recent MD study by Vatamanu and Kusalik
52
suggests that it is unnecessary for hydrate-like structures to remain or be “remembered” for faster nucleation. Instead, higher concentrations of dissolved gas are the promoting factor. However, simulations that we performed by assigning initially dissolved gas at time zero gave different results. The amounts of CH4(aq) and C3H8(aq) in the simulation upon hydrate onset in a fresh system reach 8.7 × 10⁻⁴ and 7.0 × 10⁻⁵ mol, respectively. By assigning their initial amounts at time zero to these values, the numerical computations gave identical amounts of
The most recent “blob mechanism” for hydrate nucleation that was proposed by Jacobson et al.
53
proposes an important item worth noting as related to the established model in this work. The blob hypothesis suggests that blobs of gas molecules with surrounding water form in a reversible manner, and nucleate and dissolve repeatedly with thermal fluctuations. When they exceed a critical size, the blobs emerge as amorphous clathrate by sharing faces and locking the water molecules into the cages to cement the crystalline structure. Thereafter, the amorphous clathrate eventually evolves into stable hydrate nanocrystals. The transient blobs and amorphous clathrate structures are in a sense equivalent to hydrate precursors
Conclusion
A reaction kinetics model was established to simulate s-II methane–propane hydrate formation, and the simulation results were compared to experimental data. Simulations show that the slow accumulation of precursors and their conversion to hydrates dominates the length of nucleation induction and triggers rapid autocatalytic reactions for sustainable hydrate growth.
Simulations also show that pre-existing precursors or hydrate particles above a certain level facilitate hydrate nucleation with a shortened induction, without affecting the growth stage. It is encouraging that the established model could be used to study hydrate-formation kinetics and provide insight into the memory effect phenomenon and hydrate-nucleation mechanism. Being a worthwhile attempt to approach hydrate formation kinetics with elementary reactions, the simulation accuracy can be further improved by integrating dynamic, time-dependent rate constants.
Supplemental Material
prk1800762_esi – Supplemental material for Methane–propane hydrate formation and memory effect study with a reaction kinetics model
Supplemental material, prk1800762_esi for Methane–propane hydrate formation and memory effect study with a reaction kinetics model by Wei Ke, Guang-Jin Chen and Daoyi Chen in Progress in Reaction Kinetics and Mechanism
Footnotes
Acknowledgements
W.K. would like to thank Professor Peter Ruoff at the Centre for Organelle Research, University of Stavanger, Norway, for sharing his invaluable experience in reaction kinetics modeling, without which this work could not have been initiated or completed.
Declaration of conflicting interests
The author(s) declared no potential conflicts of interest with respect to the research, authorship, and/or publication of this article.
Funding
The author(s) disclosed receipt of the following financial support for the research, authorship, and/or publication of this article: This work was supported by China Postdoctoral Science Foundation funded project (Grant no.: 2017M620050) and the National Natural Science Foundation of China (grant no.: 21808122).
Supplemental material
Supplemental material for this article is available online.
References
Supplementary Material
Please find the following supplemental material available below.
For Open Access articles published under a Creative Commons License, all supplemental material carries the same license as the article it is associated with.
For non-Open Access articles published, all supplemental material carries a non-exclusive license, and permission requests for re-use of supplemental material or any part of supplemental material shall be sent directly to the copyright owner as specified in the copyright notice associated with the article.