
Abstract
The production of hydrogen by steam reforming of ethanol was carried out on SBA-15-supported nano NiO catalyst synthesized by the equivalent-volume impregnation method with two different Ni sources (nickel nitrate and nickel sulfamate). The catalyst was characterized by N2 adsorption–desorption, X-ray diffraction, X-ray photoelectron spectroscopy, and transmission electron microscopy to examine the physical and chemical properties. The activity tests were performed with the steam, with water/ethanol molar ratio ranging from 2:1 to 15:1, the N2 flow rate from 20 to 120 mL min−1 to determine the space-time, and the temperature range from 623 to 923 K on the two different Ni source catalysts. A favorable operating condition was established at 823 K using water/ethanol = 6 molar ratio and carrier gas (N2) flow of more than 50 mL min−1 for nickel nitrate source, but for nickel sulfamate source, the optimum temperature changed to 773 K and other conditions were the same as for the nickel nitrate source. After eliminating the influence of internal and external diffusion factors, an empirical power-law kinetic rate equation was derived from the experimental data. The non-linear regression method was used to estimate the kinetic parameter. The activation energy of the catalyst was then calculated, and the supported nickel nitrate and nickel sulfamate catalysts were 25.345 and 41.449 kJ mol−1, respectively, which was in agreement with the experimental and model-predicted results.
Introduction
Currently, with the increase in the world population and developments in technology, energy is an indispensable element in our everyday lives.1,2 The majority of the energy is derived from non-renewable sources, such as fossil fuels. The gradual depletion of these fossil fuel reserves and efforts to reduce greenhouse gas emissions have generated considerable interest in using alternative sources of energy. 3 Hydrogen continues to hold promise as an important energy carrier for the future, with its high gravimetric energy density, its low impact on the environment, 4 and its potential as a fuel for more efficient energy conversion devices such as fuel cells. Various reforming processes such as steam reforming, partial oxidation, auto-thermal reforming, and dry reforming have been investigated for converting hydrocarbons or alcohols into hydrogen.5,6 Among these reforming reactions, alcohol steam reforming has been recognized as the most feasible process for the production of hydrogen. 7 This is because ethanol not only has high hydrogen content, low cost, and easy operation, but also is safe and non-toxic. Moreover, one of the most important reasons for choosing ethanol is that it can be produced in renewable form in large quantities from several biomass sources (energy plants, waste materials from agro-industries, or forestry residue materials). Methanol steam reforming has been widely studied, but the main drawback is its relatively high toxicity. 8
The steam reforming of ethanol (SRE) is an endothermic process that can be represented in the simplest case by the following stoichiometric equation

However, this reaction is highly endothermic, and other reactions can also occur, leading to the formation of H2, CO2, CO, and CH4.
Ethanol steam reforming to synthetic gas (syngas)

Ethanol cracking


Ethanol dehydrogenation

Acetaldehyde decarbonylation

Acetaldehyde steam reforming

Ethanol dehydration

Ethylene steam reforming

Methane steam reforming

Water–gas shift

Coke formation may occur through the following reactions


In recent years, a momentous increase in the number of studies on SRE has been seen in various catalysts. The use of an appropriate catalyst may favor reaction pathways that minimize the formation of undesirable compounds, enhancing selectivity toward main products. Noble metal catalysts, such as Ir, Au, Ru, Pt, and Rh, were investigated as high-performance catalysts, and it was considered that they had higher activity and hydrogen selectivity than the base metal, but they became inactivated rapidly. Regarding the active phase, Co, Rh, and Ni are the most commonly used metals. Supported Ni catalysts are the most prevalent in industry as they are cheaper compared to noble metal catalysts and generally provide good activity and high selectivity to H2 in reforming reactions. Apart from the catalyst active phase, the support plays a crucial role in metal dispersion, distribution, and the reaction pathway. MgO, ZrO2, Al2O3, CeO2, TiO2, and SiO2 are among the supports used in the synthesis of such catalysts.9–17 From such studies, it can be seen that acid supports favor ethanol dehydration to ethylene, which may easily be transformed into coke. In this sense, mesostructured materials with appropriate textural properties have shown good characteristics for accommodating metallic particles due to their controllable pore size, pore volume, and high surface area as well as suitable acidity and basicity.18–22 Thus, silica mesoporous molecular sieves like MCM-41 and SBA-15 have been widely used as supports for various metals. MCM-41 exhibits a hexagonal array of cylindrical pores with diameters that can be varied from 1.5 to 5 nm, 23 while SBA-15 possesses uniform hexagonal channels with diameters ranging from 5 to 30 nm 24 and higher hydrothermal stability than MCM-41. In fact, Ni/SBA-15 samples are very promising catalysts in ethanol steam reforming since nickel species are better dispersed on SBA-15 than on other supports, giving higher hydrogen selectivity.
In addition, nickel precursors, preparation techniques, and synthesis/pre-treatment parameters will have a significant impact on the catalytic performance. 25 In this article, as a continuation of our previous work, 26 two catalysts with different sources of nickel (nickel sulfamate, nickel nitrate) were examined for ethanol steam reforming. The activity of the prepared catalyst was assessed by ethanol conversion and hydrogen yield. A kinetic study was also carried out to propose a power-law rate expression for SRE for Ni/SBA-15 catalyst.27–29
Experimental
Catalyst preparation
A pure silica SBA-15 sample was used as a support for the Ni active phase. The synthesis of this material was carried out by a hydrothermal method described by Zhao et al. 30 The sample was then calcined at 823 K in static conditions for 5 h with a heating rate of 1.0 K min−1 in order to remove the template agent. The active phase was added to the support by incipient wetness impregnation using mixed aqueous solutions of the metallic precursors, Ni(NO3)2·6H2O or Ni(NH2SO3)2·4H2O (Aldrich), with the appropriate concentration to obtain the desired Ni loadings. Then, the impregnated catalysts were dried overnight at 338 K and calcined at 823 K for 8 h with a heating rate of 1.0 K min−1. This calcination temperature was selected in order to completely remove metal precursors avoiding the sintering of the metallic phase. The catalysts with nickel from nickel nitrate are being denoted as Ni(1)xSBA, while that from nickel sulfamate as Ni(2)xSBA, where x represents the weight content of Ni to SiO2.
Characterization of catalysts
The microstructures of the catalysts were investigated using transmission electron microscope (TEM; JEM-1011) equipped with an energy-dispersive X-ray spectrometer (EDS).
The atomic absorption spectroscopic (AAS) technique was used to determine the nickel content of each sample (HITACHI Z-8000). Before the AAS analysis, the samples were digested in a mixture of HF and HNO3.
N2 adsorption–desorption isotherms were measured with a Micromeritics ASAP 2020 instrument. Prior to each measurement, the samples were degassed under vacuum at 573 K for 8 h. The specific surface area was calculated by the Brunauer–Emmett–Teller (BET) method, and the pore size was determined on the basis of the Barrett–Joyner–Halenda (BJH) method using the data of desorption branches.
The X-ray diffraction (XRD) patterns were performed on a Rigaku D/MAX-2500 instrument (40 KV, 100 mA) using Cu Kα radiation at a scanning speed of 8° (2θ) per minute, with the scanning range of 10°–80°.
X-ray photoelectron spectroscopy (XPS) measurements were performed with a Kratos AXIS Ultra DLD instrument equipped with an Al Kα source in a chamber with a background pressure of 1 × 10⁻⁹ torr. The measured spectra were deconvoluted after background subtraction by a least-squares fitting to Gaussian–Lorentzian functions using the software PeakFit.
Catalytic performance test
Ethanol steam reforming experiments were carried out in a fixed-bed vertical tubular reactor placed inside a cylindrical electrical furnace. About 0.8 g of catalyst mixed with 4 g of quartz particles was loaded in the middle of the reactor with 10 mm inner diameter so that the center of the catalyst bed corresponded to the central heating zone of the furnace. Before each reaction, the system was out-gassed with N2 for 30 min, and then the catalysts were reduced in H2 at 823 K for 4 h. The thermocouple inserted into the thermowell of a reactor recorded the catalyst bed temperature. After catalyst activation, the reaction temperature was fixed at a desired temperature and catalytic steam reforming reaction was performed isothermally at atmospheric pressure. The feed consisting of an appropriate ratio of ethanol–water mixture was pumped at a desired flow rate to vaporize at about 393 K in the preheater and then mixed with N2 (as a carrier gas) in the mixer before entering the reactor. After passing the outlet product stream through the condenser, the liquid was separated in gas–liquid separator and gaseous product stream was analyzed online at different time-on-stream by gas chromatography. The on-line gas chromatography was equipped with a thermal conductivity detector (TCD) and a flame ionization detector (FID) and with two packed columns strung together—TDX-01 packed column was used to separate H2 and N2, whereas CO, CH4, CO2, and C2H4 were separated using a GDX-401 column. In order to solve the problem that CO2 content is non-linear with its peak area, a reformer was installed in the chromatography, causing the conversion of CO2 into CH4. The liquid products collected from the gas–liquid separator were analyzed off-line on another gas chromatograph equipped with a Porapak Q column and a TCD by manual injection. As a result of the product variation, the catalyst performance was characterized by two parameters. Si represents the product distribution of i, and ethanol conversion is denoted as Xethanol. They were calculated according to equations (15) and (16)

Results and discussion
Catalyst characterization
TEM
The TEM of the freshly prepared catalyst shown in Figure 1 indicates that the nickel oxide is uniformly dispersed in the catalyst (Appendix 1). Nevertheless, in the figure, the nickel oxide loading to SBA-15 in different areas can be seen for Ni(1)7.5SBA and Ni(2)7.5SBA. For catalyst Ni(1)7.5SBA, nickel oxide mainly was loaded to the inside channel, while for catalyst Ni(2)7.5SBA the nickel oxide was loaded on the SBA-15 surface. This difference may be due to the fact that nickel nitrate is a small molecule that easily enters the internal channel. Nickel sulfamate is a macromolecule that can only be loaded on the surface rather than in the inside channel. All of this may affect the catalytic activity after reduction.
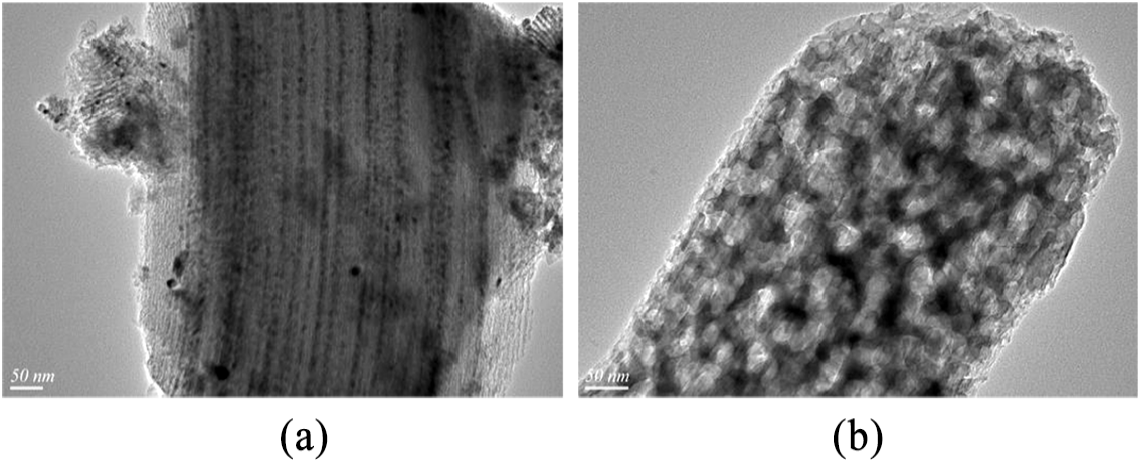
TEM images of (a) Ni(1)7.5SBA and (b) Ni(2)7.5SBA.
The EDS analysis at the different area of the same catalyst also shows uniform distribution of nickel oxide. The composition of catalyst after reduction at 823 K for 4 h (with 7.5% targeted Ni loading) as obtained from EDS is presented in Table 1.
The EDS analysis (the percent content of the elements (wt%)) of the prepared catalyst.
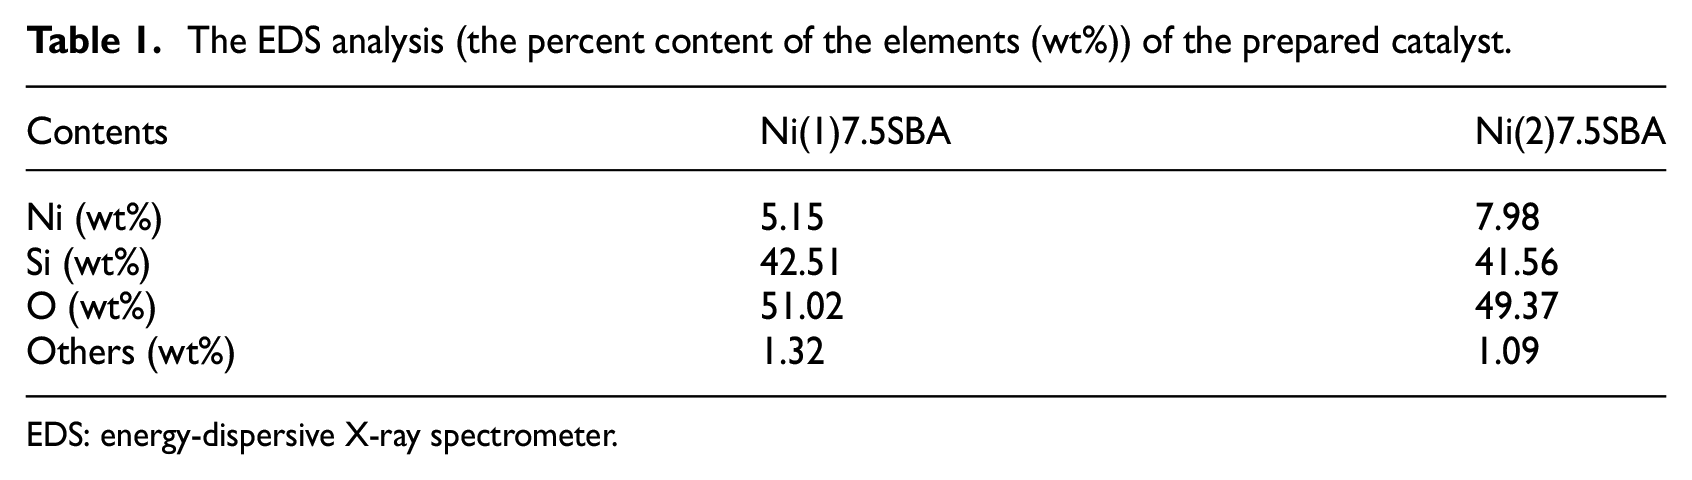
EDS: energy-dispersive X-ray spectrometer.
N2 adsorption–desorption
Figure 2 shows typical N2 adsorption–desorption isotherms for SBA-15, Ni(1)7.5SBA, and Ni(2)7.5SBA, and the calculated textural properties are summarized in Table 2. From the figure, the shape of the N2 adsorption/desorption isotherms were type IV together with an H1-type hysteresis loop, which demonstrated that the materials’ pores were of hexagonal structure and the parallel part of the hysteresis loop above P/P0 of 0.8 indicated the presence of open mesopores. 31 From adsorption–desorption isotherm intersection point, it was well matched with BJH pore size distribution. Since nickel nitrate is a smaller molecule, most of it enters into the pore during the operation, which makes part of the pore size smaller, but nickel sulfamate is a larger molecule, due to which it prefers to load to SBA-15 outer surface than enter the pore. All of these conclusions agree with the TEM. From Table 2, it can be seen that Ni from inorganic nickel source changed the surface area less than the organic nickel sources. This may be due to that the organic nickel sources more easily agglomerate when roasted.
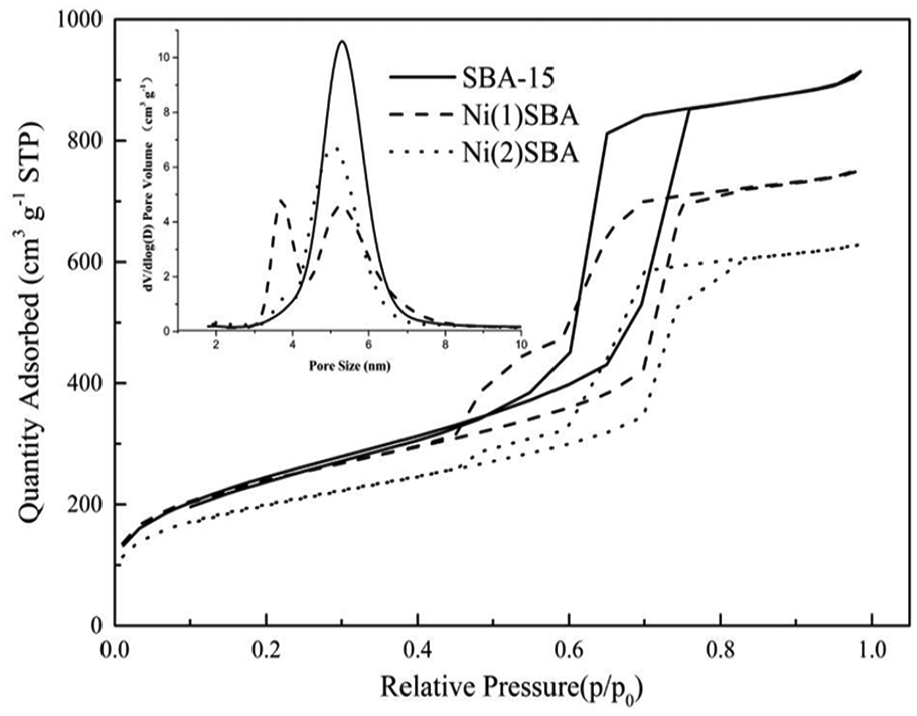
N2 adsorption–desorption isotherms of SBA-15, Ni(1)7.5SBA, and Ni(2)7.5SBA.
Summary of the textural properties of different samples.
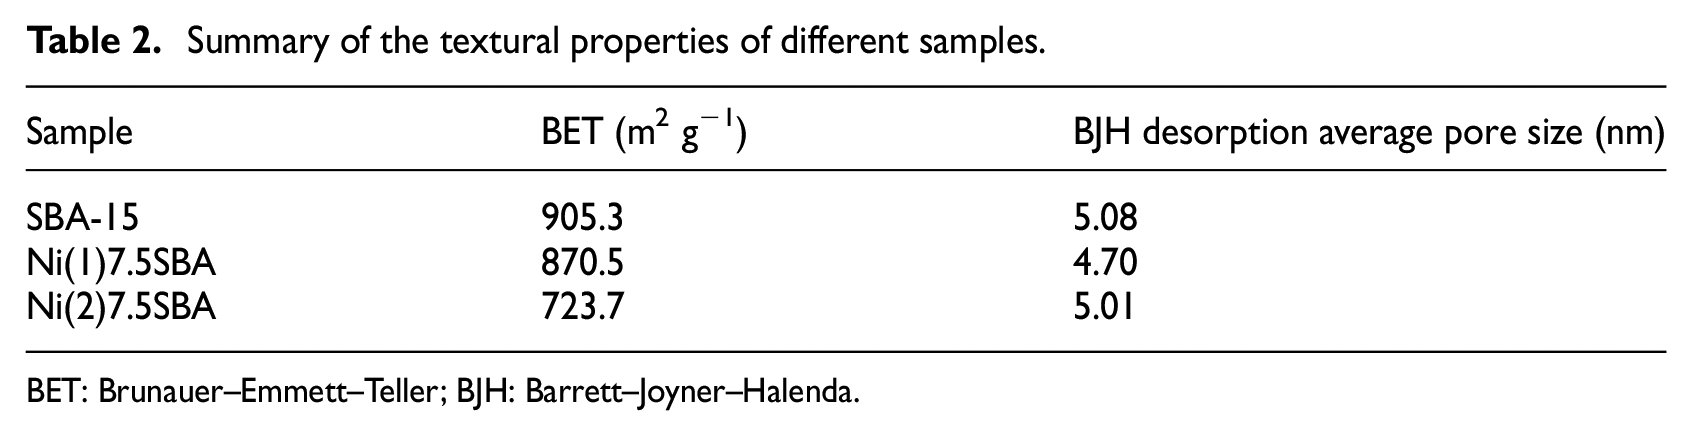
BET: Brunauer–Emmett–Teller; BJH: Barrett–Joyner–Halenda.
XRD patterns
Figure 3 shows the X-ray diffractograms corresponding to samples containing nickel by different sources. The XRD pattern at low angle provides information about the support structure (Figure 3(a)). An intense main diffraction peak and two weak peaks are assigned to (100), (110), and (200) reflection planes, respectively, which are evident in Ni(1)7.5SBA and Ni(2)7.5SBA catalysts, indicating their ordered hexagonal mesostructure. However, the peak intensity is slightly reduced for Ni(1)7.5SBA and Ni(2)7.5SBA. This indicates that the structure is damaged to some extent. From Figure 3(a), we can also know that the angle of Ni(1)7.5SBA to the right offset is greater than that of Ni(2)7.5SBA, which means that the former has a smaller pore size. With this, the same conclusion can be obtained from Figure 2. At high angles (Figure 3(b)), diffraction peaks corresponding to nickel oxides can be found, and metallic nickel is produced after calcination and reduction at 823 K. The angle of about 20° is a peak of amorphous silica. From Figure 3(b), we can also know that in order to fully reduce to Ni, the reduction time should be no less than 2 h. However, in reduced catalysts, the diffraction peaks of Ni0 from Ni(1)7.5SBA and Ni(2)7.5SBA are different. The Ni0 space group from Ni(1)7.5SBA is P63/mm (No. 194) (JCPDS45-1027) and the other is Fm3m (No. 225) (JCPDS 65-0380).
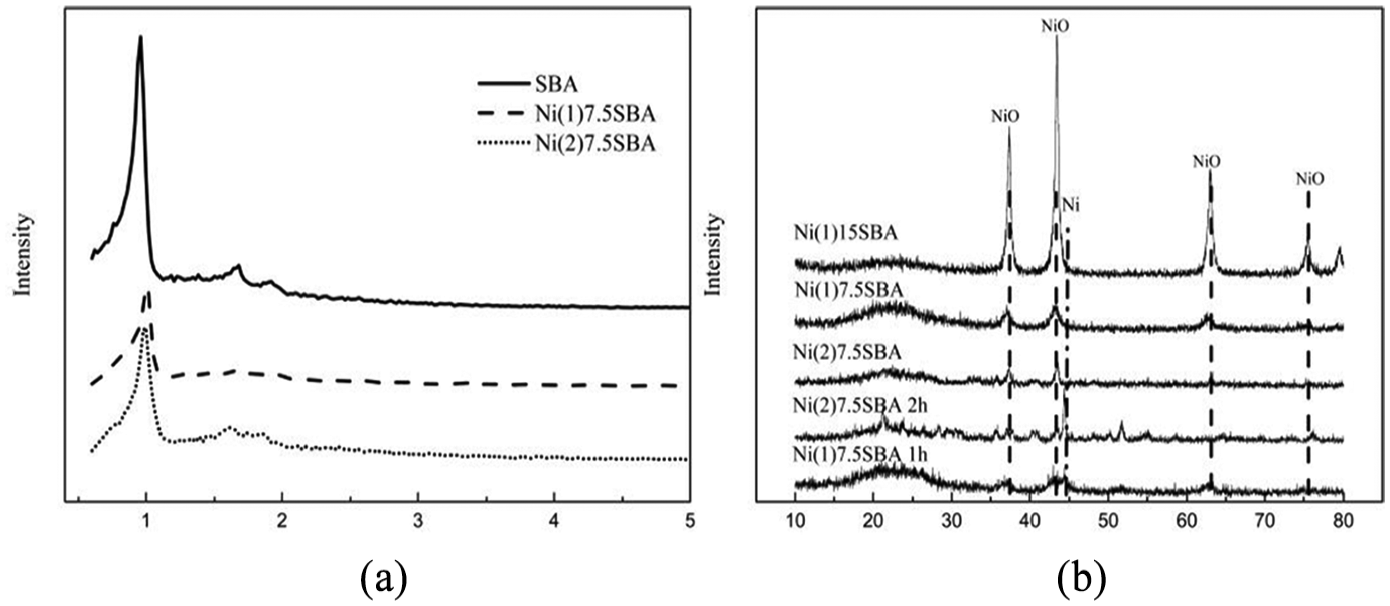
X-ray diffractograms for catalysts prepared by different sources of nickel: (a) low angle and (b) high angle.
X-ray photoelectron spectroscopy
The nickel 2p XPS spectra of the two kinds of catalysts after reduction for 4 h are shown in Figure 4. Using a Gaussian fitting method, the nickel 2p3/2 binding energy at 852.4 and 853.5 eV, respectively, is also comparable to Ni and is in good agreement with the higher values reported in the literature for Ni. 32 From the figure, it can be seen that the position of Ni 2p3/2 for Ni(1)7.5SBA catalyst’s peak is higher than for Ni(2)7.5SBA after 4-h reduction. This may be because the nickel in the two kinds of catalysts surrounds different environments after the reduction. The nickel inside the hole is surrounded by a large number of Si-OH, making its electron cloud density decrease, leading to the binding energy be higher. All of this may be affect the catalysts’ results.
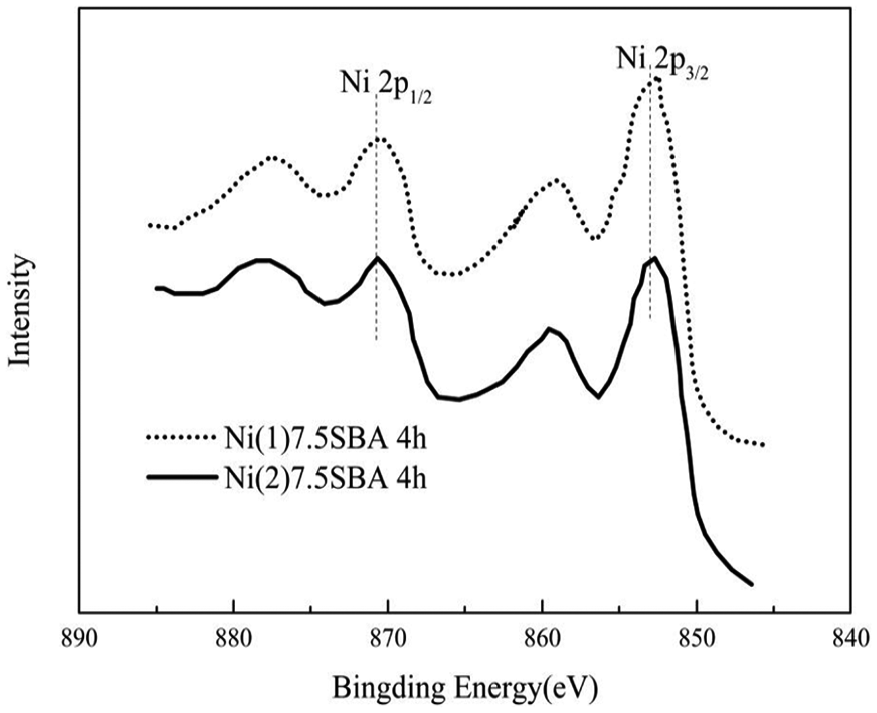
Nickel 2p XPS for Ni(1)7.5SBA and Ni(2)7.5SBA after reduction for 4 h.
Effect of nickel loading
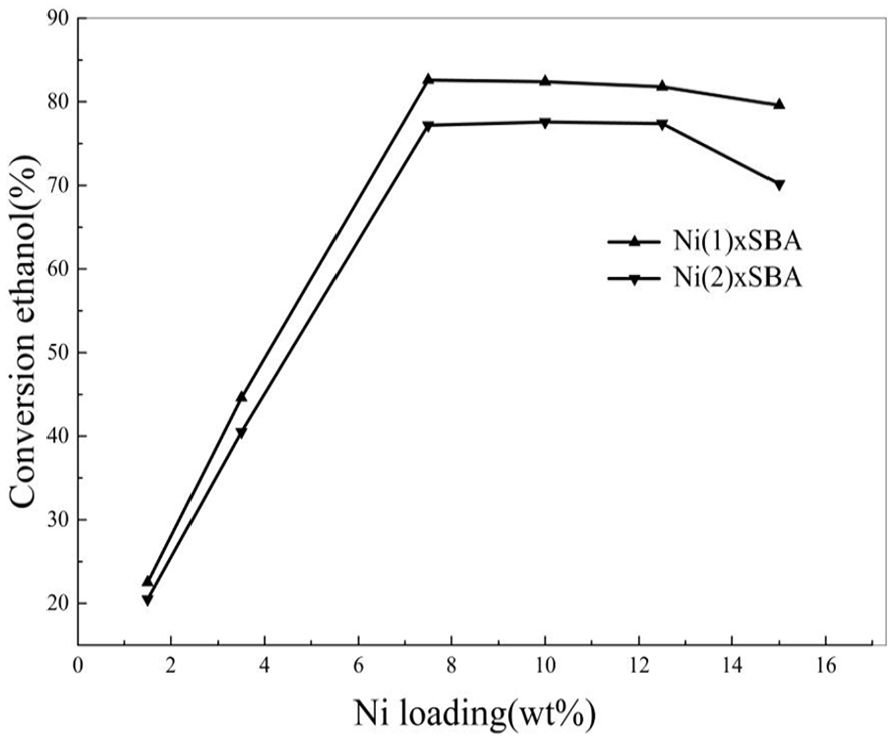
In order to determine the optimum nickel loading in ethanol steam reforming reaction, catalysts were prepared and tested for nickel nitrate and nickel sulfamate in two groups with 1.5, 3.5, 7.5, 10, 12.5, and 15 wt% Ni loadings (targeted). Reactions were conducted at 773 K using water/ethanol = 8 molar ratio.
As can be seen from Figure 5, the conclusions of the different methods of synthesizing the catalysts are the same: with the increasing Ni content, ethanol conversion increases, and when Ni content reaches a concentration of about 7.5 wt%, the ethanol conversion reaches the maximum. At this time, if the content of Ni continues to increase, the conversion rate begins to decline. Simultaneously, we may also see that the activity of catalyst from organic nickel sources is lower than the inorganic nickel source catalyst. The catalytic activity of nickel-based catalyst is closely related to both nickel content and nickel dispersion, but the effects of these two factors on the catalytic activity are opposite. 33 In our experiment, the catalytic activity of Ni/SBA increases with nickel content due to increased number of active nickel sites. However, when the nickel content is about 12.5 wt%, the catalytic activity decreases; this is due to the aggregation of nickel gets . In general, nickel content of conventional Ni/SBA catalysts used in steam reforming does not exceed 12.5 wt% to avoid severe aggregation or sintering of nickel particles during the reaction. The activity between organic source of nickel and inorganic source of nickel is different for different nickel environments and positions; these can be confirmed in the XRD and TEM.
Effect of Ni loading on ethanol conversion.
Considering the conversion of ethanol and the cost, the best selection loading nickel is about 7.5%. All further experiments were carried out with catalyst containing 7.5 wt% nickel.
Time-on-stream behavior of the catalyst
The activity of the catalyst was tested by performing reactions at a temperature of 823 K using water/ethanol = 8 molar ratio for 214 h on-stream as shown in Figure 6(a). The catalyst showed steady performance with no significant loss of activity (about 2%) in operation for 214 h. Almost 94.1% and 84.2% ethanol conversion was obtained for catalysts Ni(1)1.5SBA and Ni(2)1.5SBA. Through Figure 6(b), we can see that the catalytic activity is nearly steady after 1 h, so kinetic tests should be performed 1 h later.
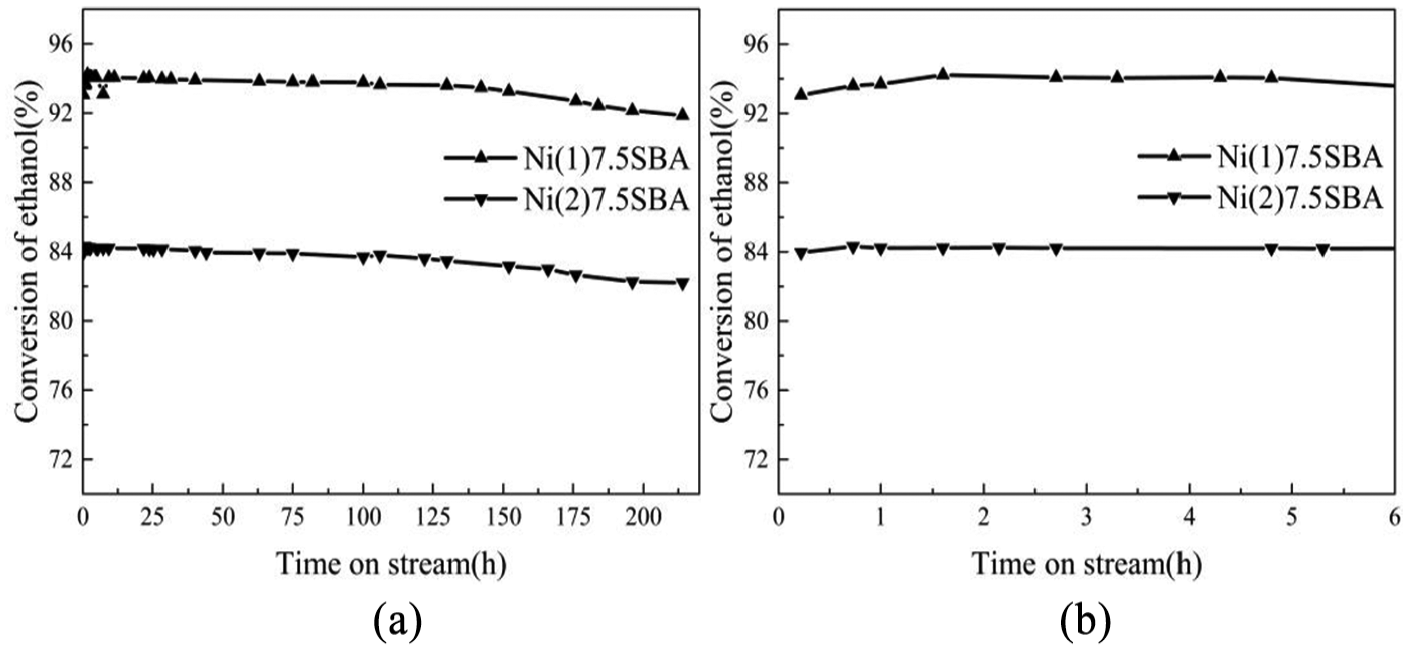
Time-on-stream behavior of the catalyst: (a) 0−214 h and (b) 0−6 h.
Effect of temperature
Based on the performance of catalysts for higher hydrogen selectivity and lower deactivation rate, Ni(1)7.5SBA and Ni(2)7.5SBA catalysts were chosen for further studies. Figure 7 shows the variation of ethanol conversion and product distribution with reforming temperature. As can be seen from Figure 7, the ethanol conversion increases with the increase in temperature; almost 95% conversion for Ni(1)7.5SBA was obtained at 823 K and almost 84% for Ni(2)7.5SBA at 773 K. Beyond these temperatures, ethanol conversion increases very slowly. The presence of intermediate product (acetaldehyde) was detected in the product stream only under low temperature and it was found to be very minimal.
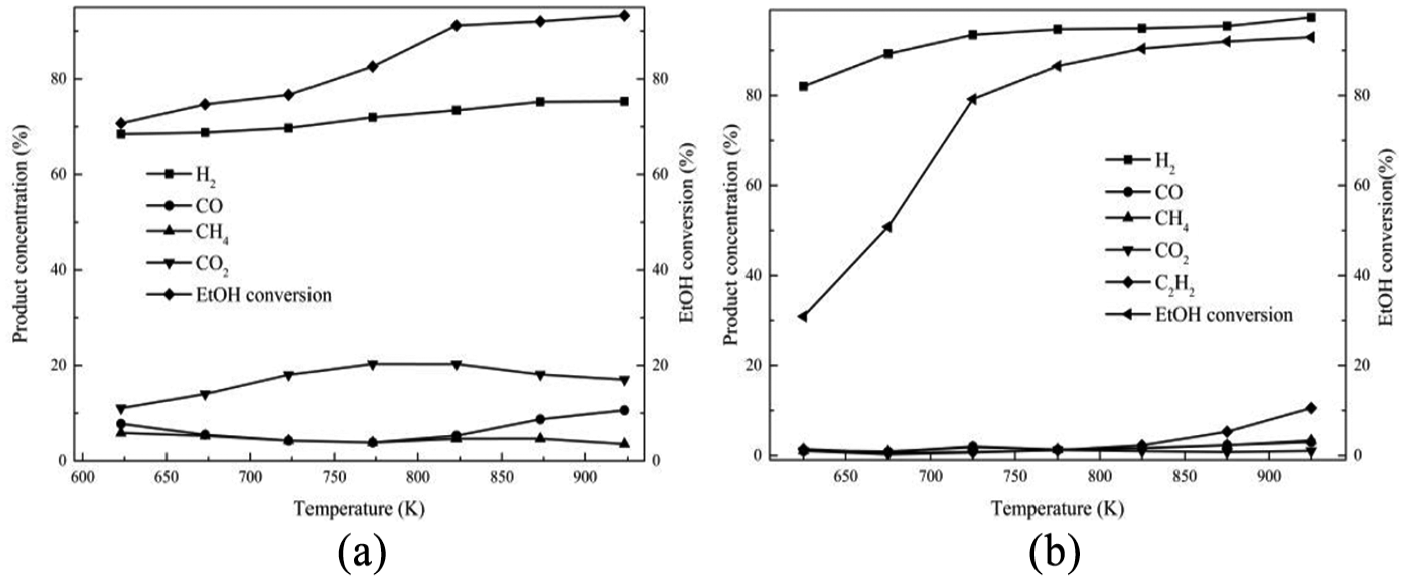
Effect of temperature on ethanol conversion and product distribution: (a) Ni(1)7.5SBA and (b) Ni(2)7.5SBA.
It can be noticed that hydrogen concentration increases very slowly with increasing temperature, while CO2 concentration reaches the maximum and CO reaches the minimum in the exit gas as illustrated in Figure 7(a). The CH4 concentration remains almost constant with the increase in temperature over the range of temperature studied. At a lower temperature of 823 K, the main possible reactions that occurred are reactions (2), (3), (10), and (11), and CO2 is mainly produced from CO due to the occurrence of water–gas shift reaction (reaction (11)). This is due to the fact that CO2 formation is thermodynamically favored at low temperature. With the increase in temperature, reaction (2) can be carried out easily. Then, the more the consumption of CO by reaction (11), the more the generation of CO2. However, the CH4 generated by reaction (3) and consumed by reaction (10) are equal. Beyond the temperature 823 K, the main possible reactions that occurred are reactions (2), (3), (10), and (11). With the increase in temperature, the water–gas shift reaction is inhibited; reaction (2), on the other hand, is promoted. From these reasons, it can be concluded that when the temperature increases, CO2 reduces but CO and H2 increase. The optimal temperature of Ni(1)7.5SBA catalyst is about 823 K.
It can be seen from Figure 7(b) that the hydrogen selectivity increases as well as ethylene. Reactions (8) and (9) may be attributed, which are thermodynamically favored. With the increase in temperature, these two reactions are promoted, especially for reaction (8). For this reason, ethylene selectivity is higher at higher temperature. Considering the ethanol conversion, hydrogen selectivity, and economic effect of operating factors, the Ni(2)7.5SBA catalyst has an optimal temperature of about 773 K.
Based on those mentioned above, the reactions on the catalyst are different. Different sources of catalysts lead to those phenomena. From XPS and XRD, it is known that the morphology of nickel is different after reduction; all of these affect the SRE reaction mechanism on the two kinds of catalysts.
Effect of contact time
In order to eliminate the influence of internal diffusion factors on the reaction, it is necessary to study contact time. The contact time of the two kinds of catalysts was calculated by changing the N2 flow rate from 20 to 120 mL min−1 at the optimal temperature, as mentioned above, with an H2O/ethanol ratio of 4.5:1. As illustrated in Figure 8, the conversion of ethanol reduces with the increasing N2 flow rate and then becomes almost constant, just as expected.
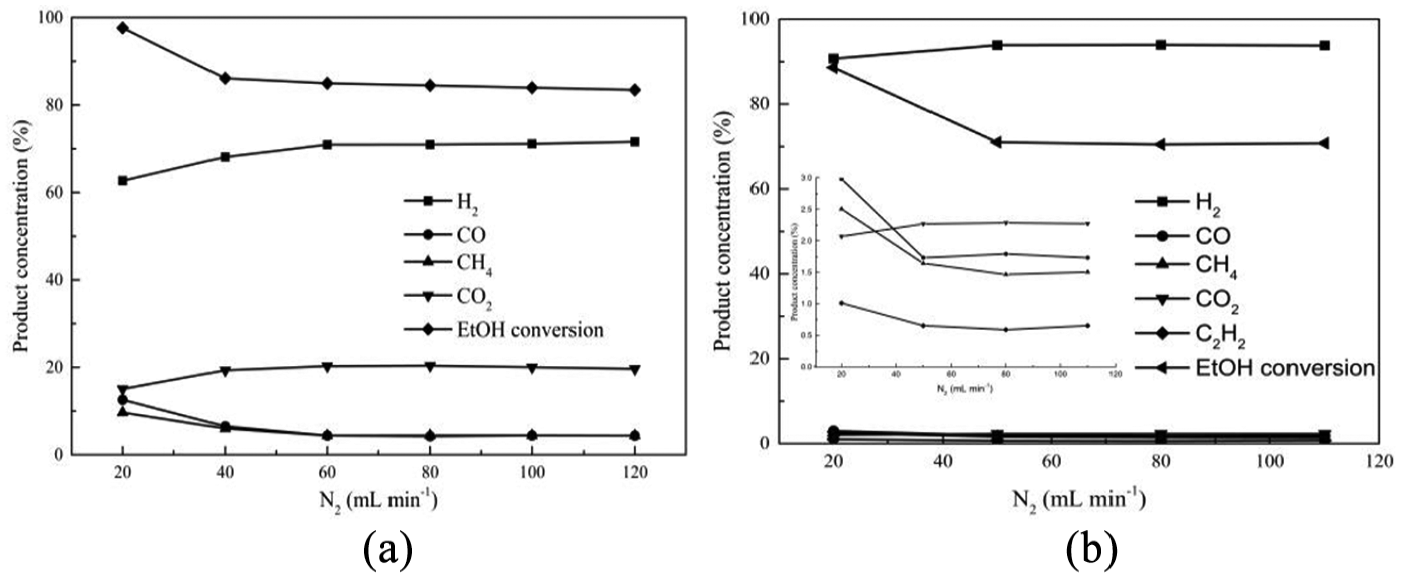
Effect of contact time on conversion of ethanol and product distribution: (a) Ni(1)7.5SBA and (b) Ni(2)7.5SBA.
Figure 8(a) presents the distribution of products with variation of N2 flow rate on Ni(1)7.5SBA. It can be seen from the figure that at higher N2 flow rate, the concentrations of H2, CO, CH4, and CO2 are almost steady, indicating simultaneous occurrence of ethanol decomposition (reactions (1), (2), (3), (4), and (8)) and water–gas shift reactions (reaction (8)). With increasing N2 flow rate, the concentration of H2 and CO2 increases gradually with a decline in the concentration of CH4 and CO. This behavior indicates that steam reforming of methane (reaction (10)) together with water–gas shift reactions (reaction (8)) occurs predominantly under the reaction conditions employed. After analyzing the results, a maximum of 85% of ethanol conversion was obtained at 823 K with an H2O/ethanol ratio of 4.5:1 and an N2 flow rate above 40 mL min−1, and this is the optimum operating condition for ethanol steam reforming over the studied range of parameters.
On the other hand, it can be noticed from Figure 8(b) that the concentration of products shows no obvious changes in higher ranges of N2 flow rate. At a lower flow rate, all of the product species change a lot; this can be ascribed to internal diffusion factors. As can be seen from Figure 8(a) and (b), when internal diffusion occurs predominantly, the water–gas shift reaction is suppressed and the hydrogen is selectivity decreased.
Considering those mentioned above, in order to obtain high selectivity of hydrogen or eliminate the influence of internal diffusion factor in these two kinds of catalysts, the carrier gas (N2) flow should be controlled to be more than 50 mL min−1 in our device.
Effect of water/ethanol molar ratio
The variation of ethanol conversion and product composition at different water/ethanol molar ratios is shown in Figure 9. The experiments were performed in the H2O/ethanol molar ratio range from 2:1 to 15:1 at the above-mentioned optimal temperature with carrier gas (N2) flow at 60 mL min−1. It can be seen from these two figures that the addition of water to the feed results in a positive impact on conversion of ethanol during reforming reaction; a maximum of 93% ethanol conversion for Ni(1)7.5SBA and 82% for Ni(2)7.5SBA was achieved at 6:1 H2O/ethanol molar ratio under the operating conditions employed. Moreover, it is observed that increasing the H2O/ethanol molar ratio beyond 6:1 has no beneficial effect on the conversion of ethanol and product composition.
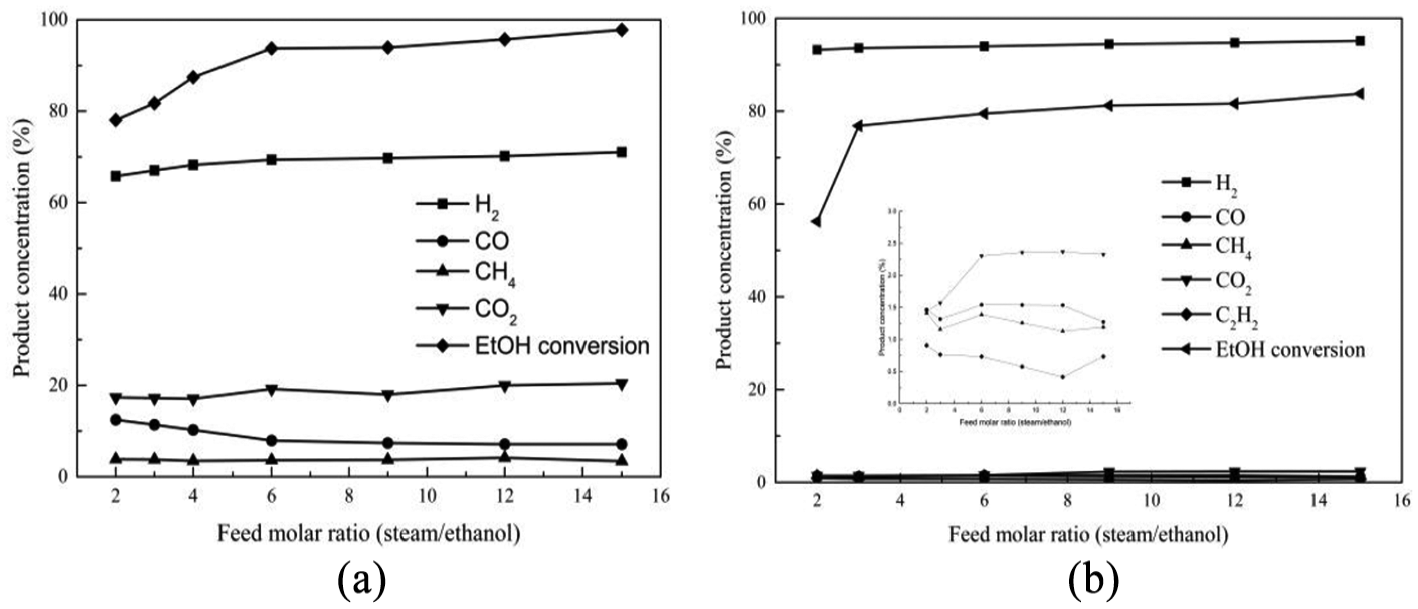
Effect of feed composition on ethanol conversion and product distribution: (a)Ni(1)7.5SBA and (b) Ni(2)7.5SBA.
Figure 9(a) shows the distribution of gaseous product species obtained at different feed H2O/ethanol molar ratios for Ni(1)7.5SBA. At lower values of feed ratio, the product composition is similar to the effect of lower temperature, which has been discussed in Figure 7(a). The higher H2O/ethanol molar ratio promotes the water–gas shift reactions (reaction (8)), but reactions (3) and (10) are not affected, hydrogen concentration increases with increasing CO2, and CH4 content remains the same. When the H2O/ethanol molar ratio is up to 6, the product composition is almost constant. As can be seen from Figure 9(b), it is not as regular as in Figure 9(a). When the H2O/ethanol molar ratio is up to 6, the amount of CO2 does not increase anymore and the selectivity and variation of the hydrogen is also small. We also see that higher H2O/ethanol molar ratio promotes the methane shift reactions (reaction (10)) and ethylene shift reactions (reaction (9)) for Ni(2)7.5SBA. These results suggest that when the water/ethanol molar ratio is up to 6, the addition of excess steam in the feed does not affect the concentration of the product.
Kinetics study
Intraparticle mass transfer resistance
To study the intrinsic kinetics of a solid-catalyzed gas-phase reaction, the reaction rate must be measured only when the intraparticle mass transfer resistance, which is the source of external diffusion factor and the effect of internal diffusion factor, must be eliminated. From the above studies, when the carrier gas (N2) flow is more than 50 mL min−1 in our device, the internal diffusion factor can be eliminated. In order to eliminate the external diffusion factor, it is necessary to verify the catalysts in different particles. This was done by keeping the N2 flow rate constant (60 mL min−1) and other conditions unchanged, increasing the particle size in mesh. The result in Figure 10 proved that different particle sizes effect ethanol conversion. When the particle size of catalysts is about 60–80 mesh, the conversion of ethanol was almost identical to the result obtained when external diffusion factor was eliminated.
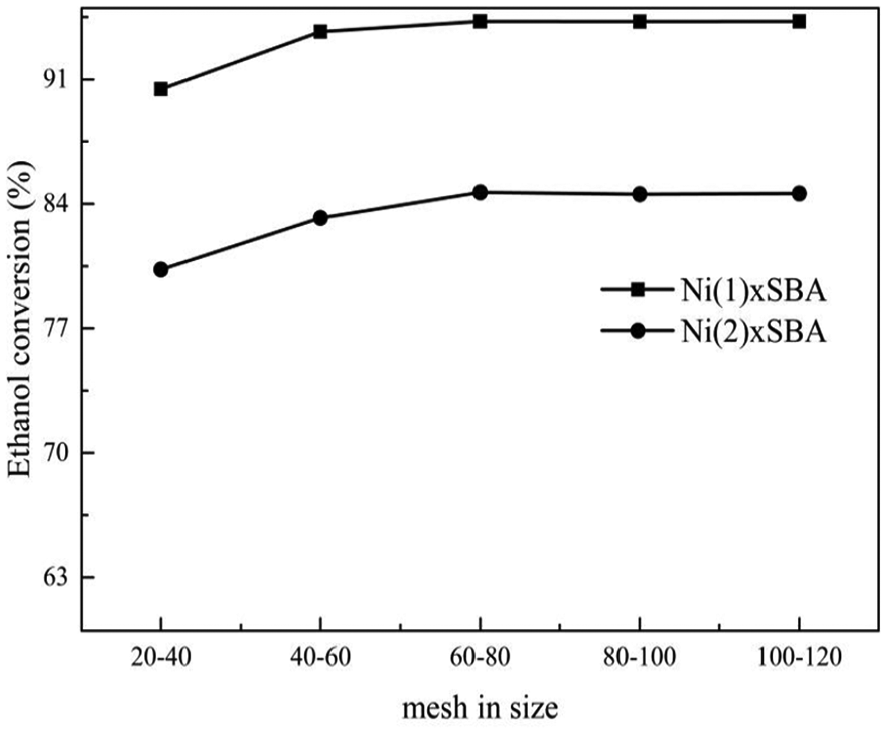
Effect of particle size of catalysts on ethanol conversion.
Analysis of reforming kinetics
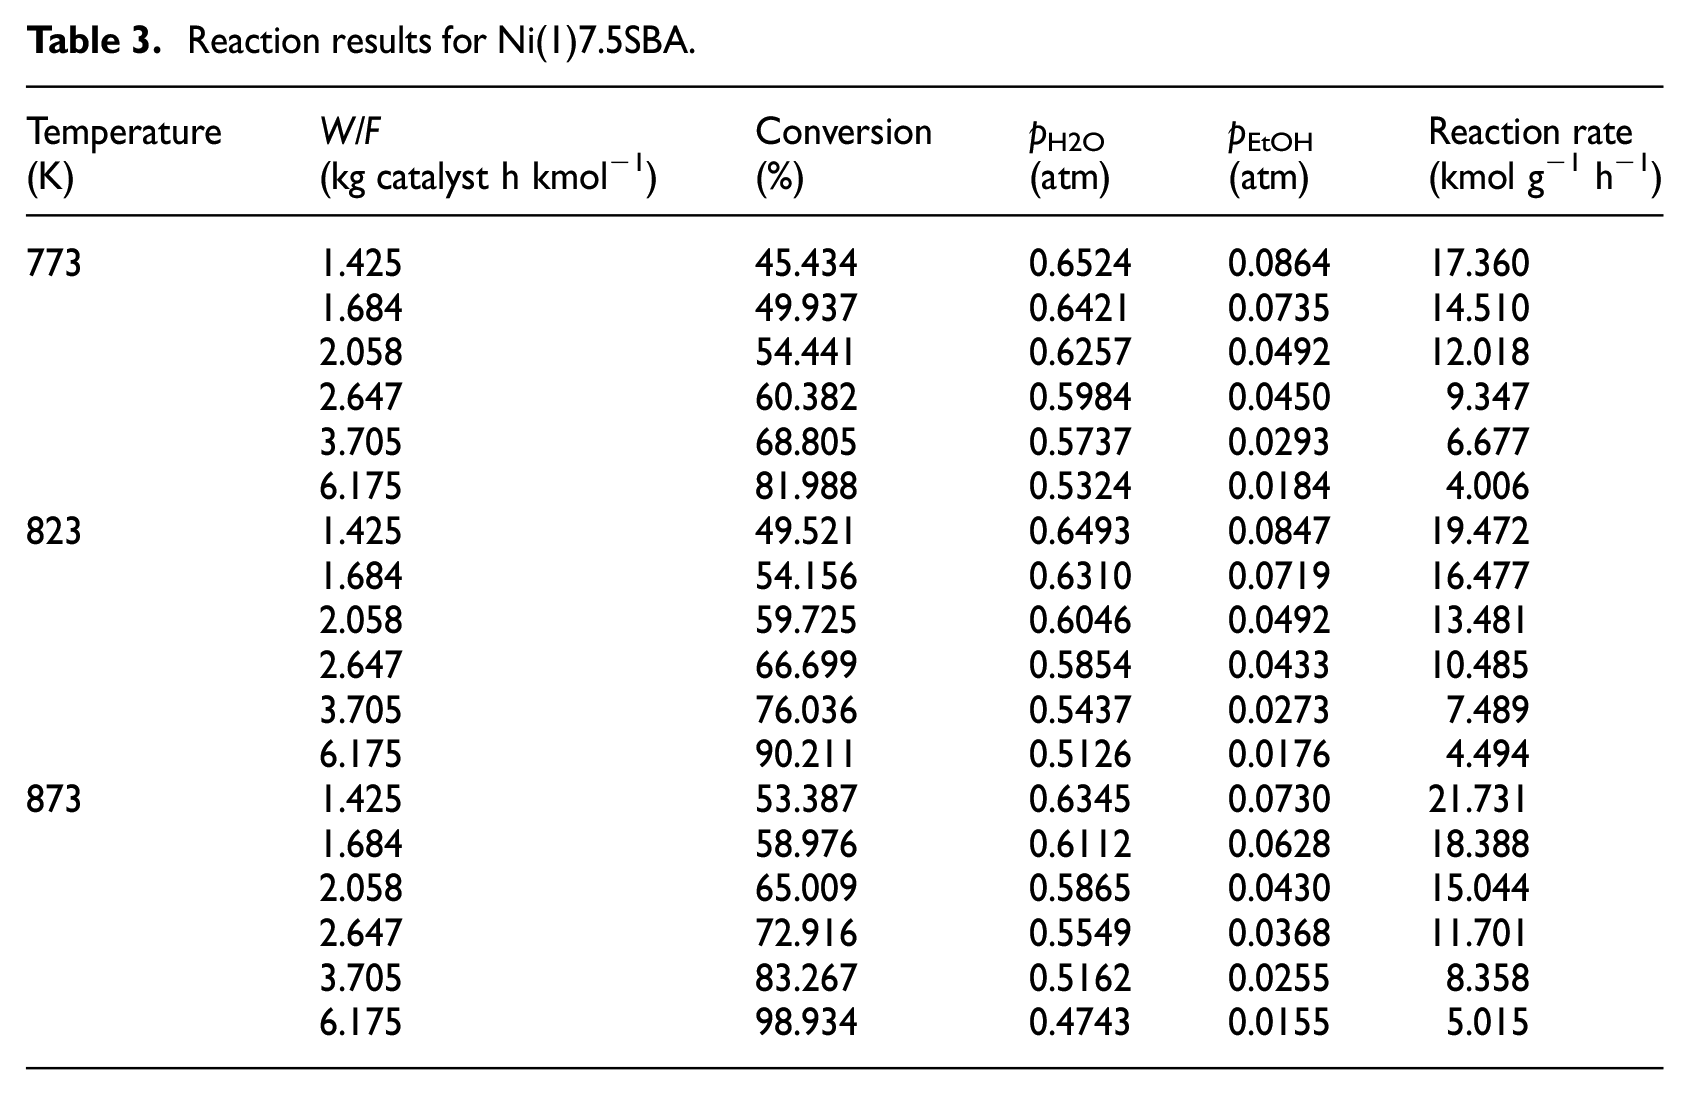
In order to collect the kinetic data, the experiments were carried out at 773, 823, and 873 K, keeping H2O/ethanol molar ratio at 6:1 and N2 flow rate at 60 mL min−1 while varying ethanol fed (W/F) from 1.3 to 6.2 kg catalyst h kmol−1for Ni(1)7.5SBA catalyst; the catalyst was crushed into particles of 60–80 mesh in size. To obtain another catalyst’s (Ni(2)7.5SBA) kinetic data, the operating parameters are the same as Ni(1)7.5SBA, except for the reaction temperature (723, 773, and 823 K). The conversion data with varied W/F have been represented in Tables 3 and 4, respectively. Ethanol conversion increases as the temperature increases, with variation in W/F. It is well known that the reaction of H2 formation from H2O and ethanol can be considered irreversible; reaction (17) was chosen as the reaction model. For each temperature, ethanol conversion at different W/F was fitted to logarithmic regression curve with the help of MATLAB program as shown in Tables 3 and 4

Reaction results for Ni(1)7.5SBA.
Reaction results for Ni(2)7.5SBA.
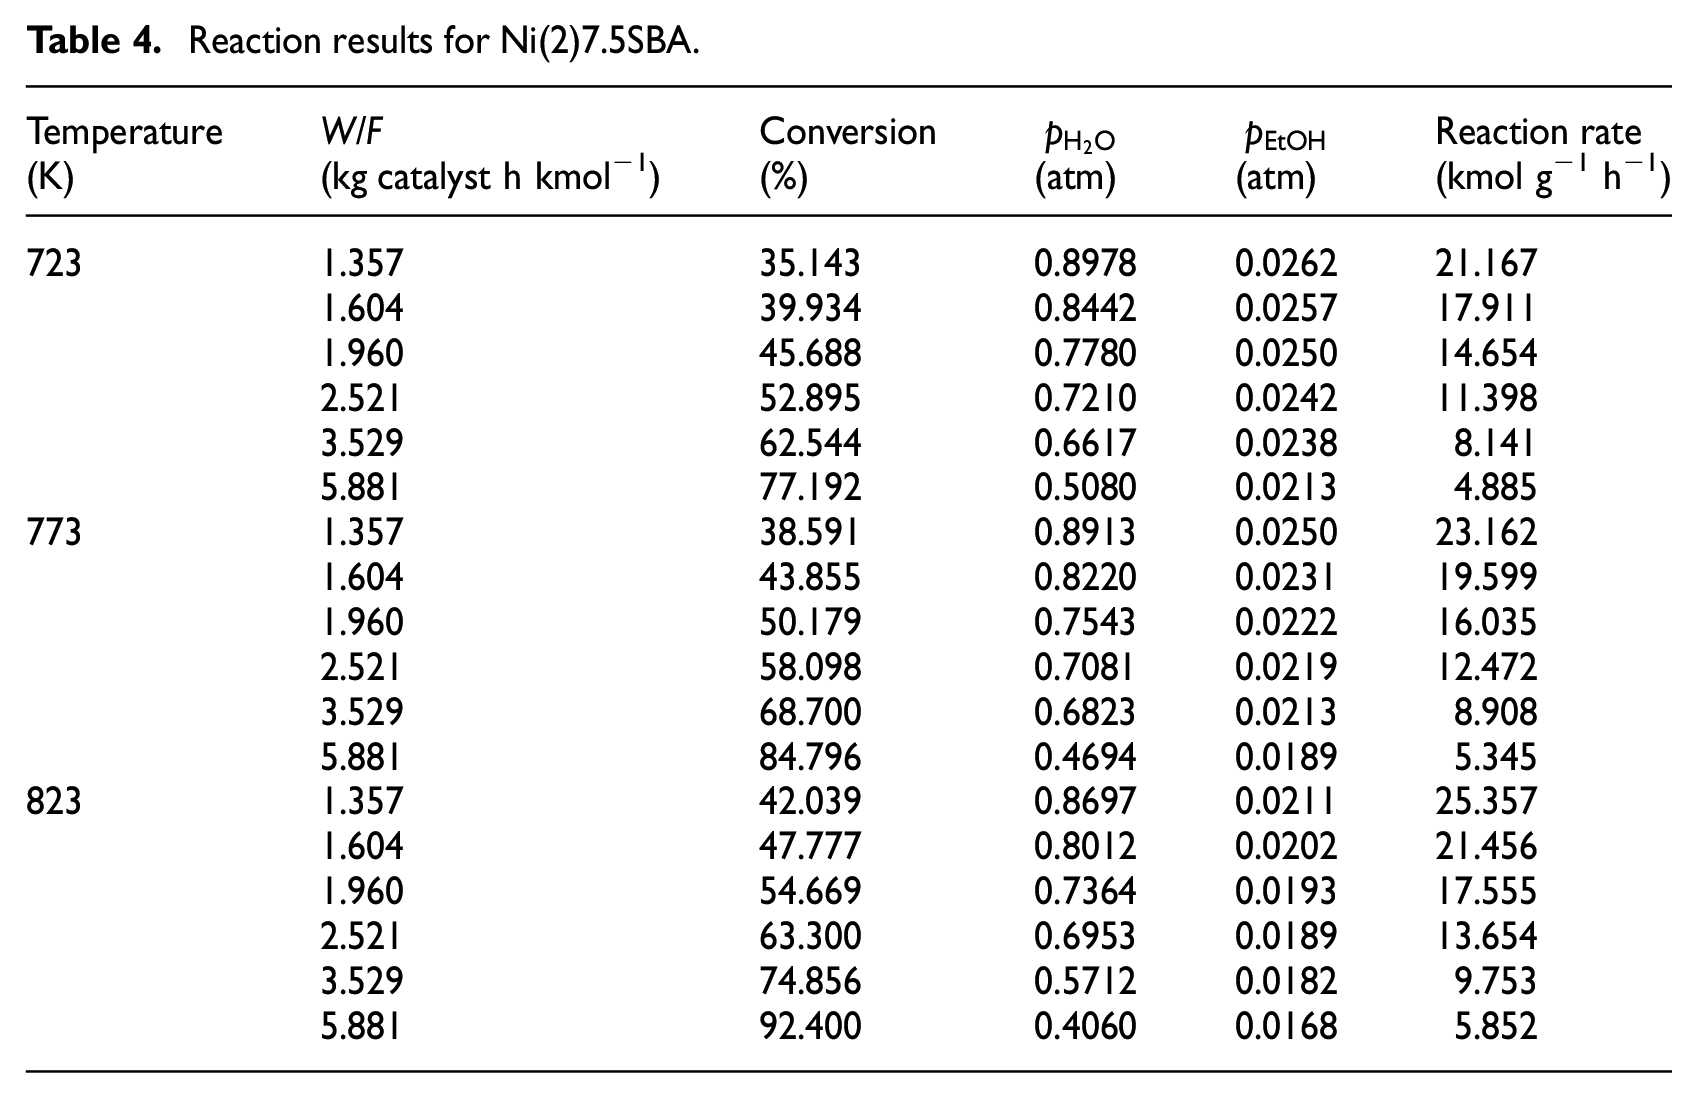
Figure 11 shows the logarithmic curve as a function of space-time for each temperature for the two catalysts. The slope of the fitted curve is expressed as the rate of reaction determined by differentiating the regression equation with respect to W/F. The reaction rate of each experiment for all the three temperatures of the two catalysts is represented in Table 5.
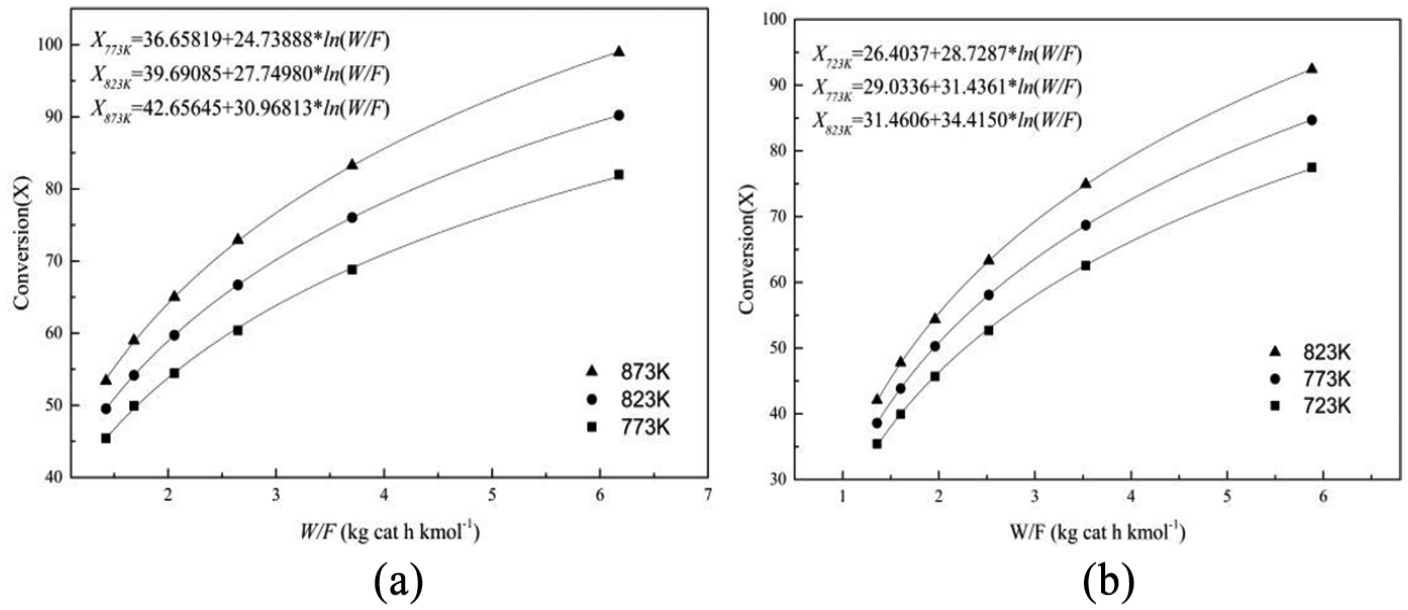
Conversion versus W/F at different temperatures: (a) Ni(1)7.5SBA and (b) Ni(2)7.5SBA.
Reaction rate.
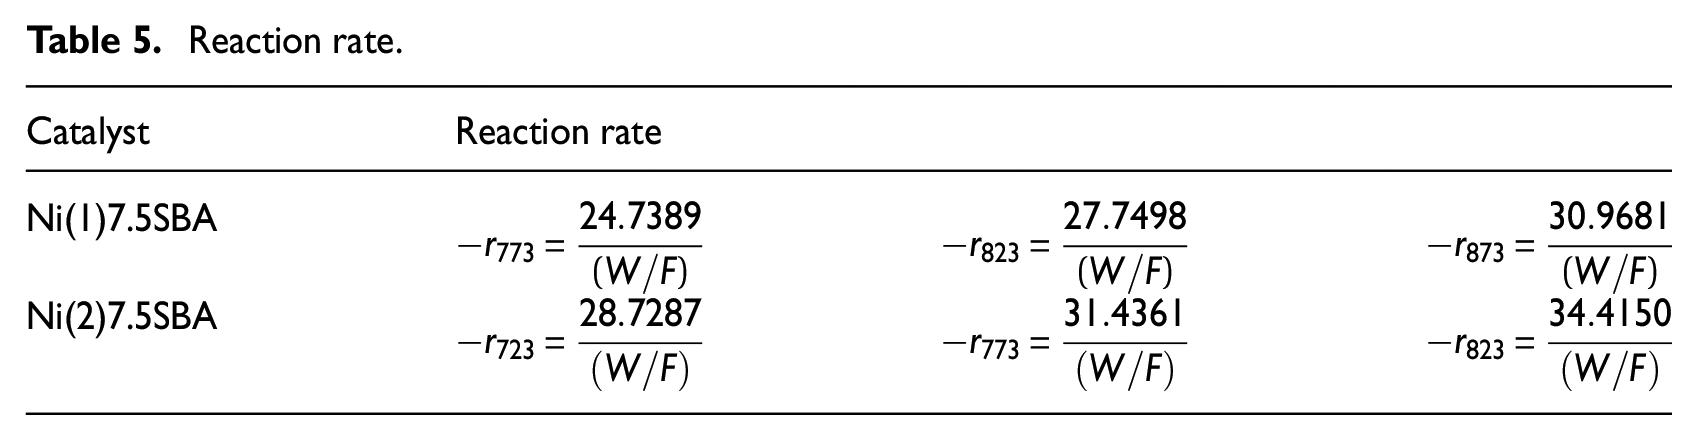
In order to study the kinetic data, the power-law type equation (18) was used as the model equation. To determine the reaction rate equation, each calculated reaction rate and corresponding partial pressure of ethanol and water must be employed. The partial pressures of ethanol and water were obtained from product gas composition. All the dates are presented in Tables 3 and 4

Activation energy of the reaction and frequency factor can be obtained from Arrhenius equation

From equations (17)–(19)

The Levenberg–Marquardt and lsqcurvefit methods in MATLAB software were used for the regression of experimental dates.34,35 The initial value can be continuously changed by fitting the results until the initial value and results are consistent; then the operation is finished. The function to be minimized is of the following form
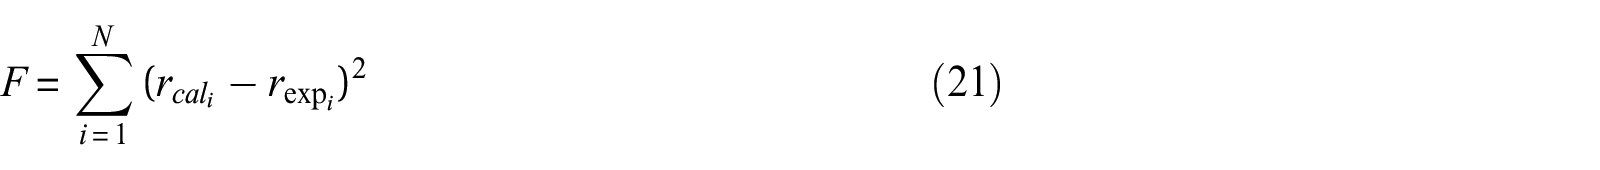
In this function,


It is well known that the power-law model is not based on any reaction mechanism; this empirical correlation enables the estimation of the disappeared ethanol rate. However, from the above kinetic rate equation, it also can be seen that the mechanism of the reaction is different from two kinds of catalysts.
In order to estimate activation energy value and exponent for partial pressure of steam and ethanol, the experiments were conducted in the absence of diffusional resistances. The intrinsic kinetic dates also show the non-elementary nature of the steam reforming process. The correlation coefficient (R2) value for all the dates was above 0.95, which indicated that the errors between experimental and simulated results are within the statistically permissible limits. The model-predicted results and the experimental results at all temperatures fit well.
Conclusion
The two catalysts with different sources of nickel were found to show different activities through SRE. Before the kinetic data were established, an extensive experimental study on SRE has been conducted, which deals with the wide range of nickel loading, reforming temperature, water/ethanol molar ratio, and space-time. From the study, we found that the temperature, space-time, and water/ethanol molar ratio significantly affected the conversion of ethanol and reformate distribution for these two catalysts.
The optimized condition of ethanol steam reforming in terms of conversion was established at 823 K with the water/ethanol molar ratio beyond 6:1 and carrier gas (N2) flow more than 50 mL min−1 for Ni(1)7.5SBA, but for Ni(2)7.5SBA, the optimized temperature was changed to 773 K and other conditions were the same as Ni(1)7.5SBA. Under this optimum condition, conversion of ethanol was almost 91% and 84%. After eliminating the influence of internal and external diffusion factor, an empirical power-law kinetic rate equation was proposed to estimate the intrinsic kinetic dates. The activation energy and pre-exponential factor were estimated to be 25.345 kJ mol−1, 41.449 kJ mol−1 and 8.9995 × 10³ kmol kg−1catalyst h−1 atm−2.39, 5.5733 × 10⁷ kmol kg−1catalyst h−1 atm−3.65 for Ni(1)7.5SBA and Ni(2)7.5SBA, respectively. A good agreement between the calculated rate from model and the experimental rate was observed.
Another issue was why the effects of the two kinds of catalysts containing the same nickel are different. This is characterized by TEM, N2 adsorption–desorption, XRD, XPS, and so on. Through these representations, the reason may be that the scattered parts and the environment of the nickel are different after reduction.
Footnotes
Appendix 1
Declaration of conflicting interests
The author(s) declared no potential conflicts of interest with respect to the research, authorship, and/or publication of this article.
Funding
The author(s) disclosed receipt of the following financial support for the research, authorship, and/or publication of this article: The authors gratefully acknowledge financial support from the National Natural Science Foundation of China (51978436) and the Natural Science Foundation of Shanxi Province (201701D121042).