
Abstract
The reaction kinetics of carbon reduction of silica were investigated using thermodynamic concepts and by fitting to relevant models the experimental data obtained for this reduction using a thermogravimetric unit in the temperature range of 1566 to 1933 K. The results show that the only way to produce SiC in this reduction is the reaction of Si, SiO, or SiO2 at the surface or by diffusion of SiO inside the carbon particles while CO and CO2 have no direct effect on the process. The controlling step of this reduction at temperatures lower than 1750 K is the chemical gas–solid or solid–solid reaction at the surface of the carbon particles, while at higher temperatures, the rate of SiO diffusing inside the carbon particles controls the rate of this reduction.
Introduction
Several mechanisms have been defined for the production of silicon carbide (SiC) using the reaction of silica (SiO2) and carbon (C) at high temperatures.1–9 Among these mechanisms, some cases have been widely accepted in the temperature range of 1500 to 2000 K.7–9 Nevertheless, attending to the complexity of this reaction, there is no complete investigation for obtaining this mechanism, based on the thermodynamic and kinematic of this reaction.
Shimoo et al.
10
studied the reaction of silica and graphite in argon atmosphere for producing SiC and SiO. They concluded that, in the first stage, an interfacial reaction (a chemical process on the surface of graphite particles) controls this reduction; then, diffusion of carbon in the produced layer of SiC controls this reduction. Agarwal and Pal
11
resulted that, at temperatures above 1773 K, this reduction has been composed of three reactions with effects of CO as the major component, and the reaction rate is controlled by a combination of reduction reaction of silica and the Boudouard reaction (i.e.
Attending to the existence of several differences among the presented theories in the mentioned relevant references, and also importance of improving the production rate and also quality of the produced SiC in different processes, such as the Acheson process, it is necessary to present a complete study for obtaining the mechanism of this reaction. In this study, the stoichiometric reaction of SiO2 and C has been investigated at temperatures between 1533 and 1966 K. First, all the thermodynamically possible reactions in this reduction have been obtained using their Gibbs energy changes (i.e. ΔG). These reactions help us to recognize the possible mechanisms for this reduction. Then, we investigated the rate of this reduction using a TGA experimental study to obtain the possible reaction mechanisms.
Experiments
In this section, experimental procedure for reduction of silica using carbon powder is described. Carbon powders had a high purity (more than 99 %w total carbon, from Merck Company); silica powder (crystalline quartz from Mount Rose, Canada) contained more than 95 %w SiO2; and Helium gas with 99.999% purity (from Air Products Company) was used to minimize effects of impurities on the reaction. Each of the solid particles having a nominal particle size of 1 µm.
A commercial TGA device with a gas detector at the exhaust line was used to reduce a mixture of 1 mol of silica powder by 3 mol of carbon powder in a small crucible that contained 100 mg of mixed powder, which provides a solid bed with 9-mm height and 6-mm diameter. A computer-recorded weight change of the solid content of the crucible over time and the reaction temperature was measured using accurate thermocouples that were located at the outside surface of the crucible inside the reactor. Flowing of the helium gas caused a ±0.2-K temperature variation during the experiments. Exhaust gas of the reactor passed through a gas detector for measuring the CO and CO2 content of this gas. The furnace heated up the reactor with the rate of 50 K.min−1 to the target temperature, and at a same time, 100 L.hr−1 of helium purged air content of the reactor.
Results and discussions
Thermodynamic
Thermodynamic approach involves study of equilibrium states. This study tests the possibility of a reaction and indicates whether this reaction is a spontaneous process or not. Changes of the Gibbs energy of a reaction may approve the possibility of occurrence of this reaction in the evaluated thermodynamic condition. Figure 1 displays the equilibrium curves relevant to possible equilibrium compositions in the solid, liquid, and gas phases at the temperature range of 1566 to 1933 K relevant to the reaction between 1000-mol SiO2 and 3000-mol C. 37 Based on this graph, the reduction of these solid particles produces solid Si and SiC, and also CO and SiO gases at these temperatures. However, escaping of these gases from the formed pores in the reduced solid phase prevents a complete equilibrium conditions occurrence. In addition, other components, such as CO2 gas, have intermediate effects on the occurred reactions for producing these components.
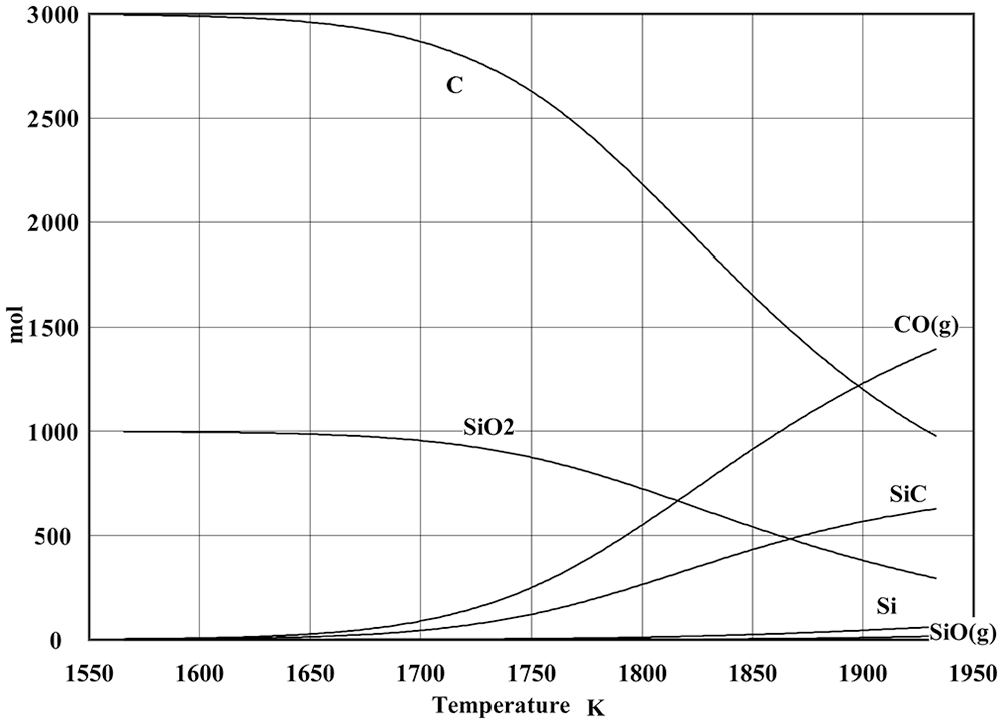
Equilibrium curves of the possible equilibrium compositions relevant to the reaction between 1000-mol SiO2 and 3000-mol C. 37
Spontaneous processes have non-positive ΔG at constant temperature and pressure. Figure 2 shows ΔG of the possible reactions relevant to this reduction at different temperatures. 37 (Some greyscale figures have been presented in this article. In these figures, the darkness of each line or bar indicates the importance of them.) As seen in this figure, the following reactions have chances of occurrence in this reduction (the reactions with ΔG < 0, which have been shown with dark lines in this figure)


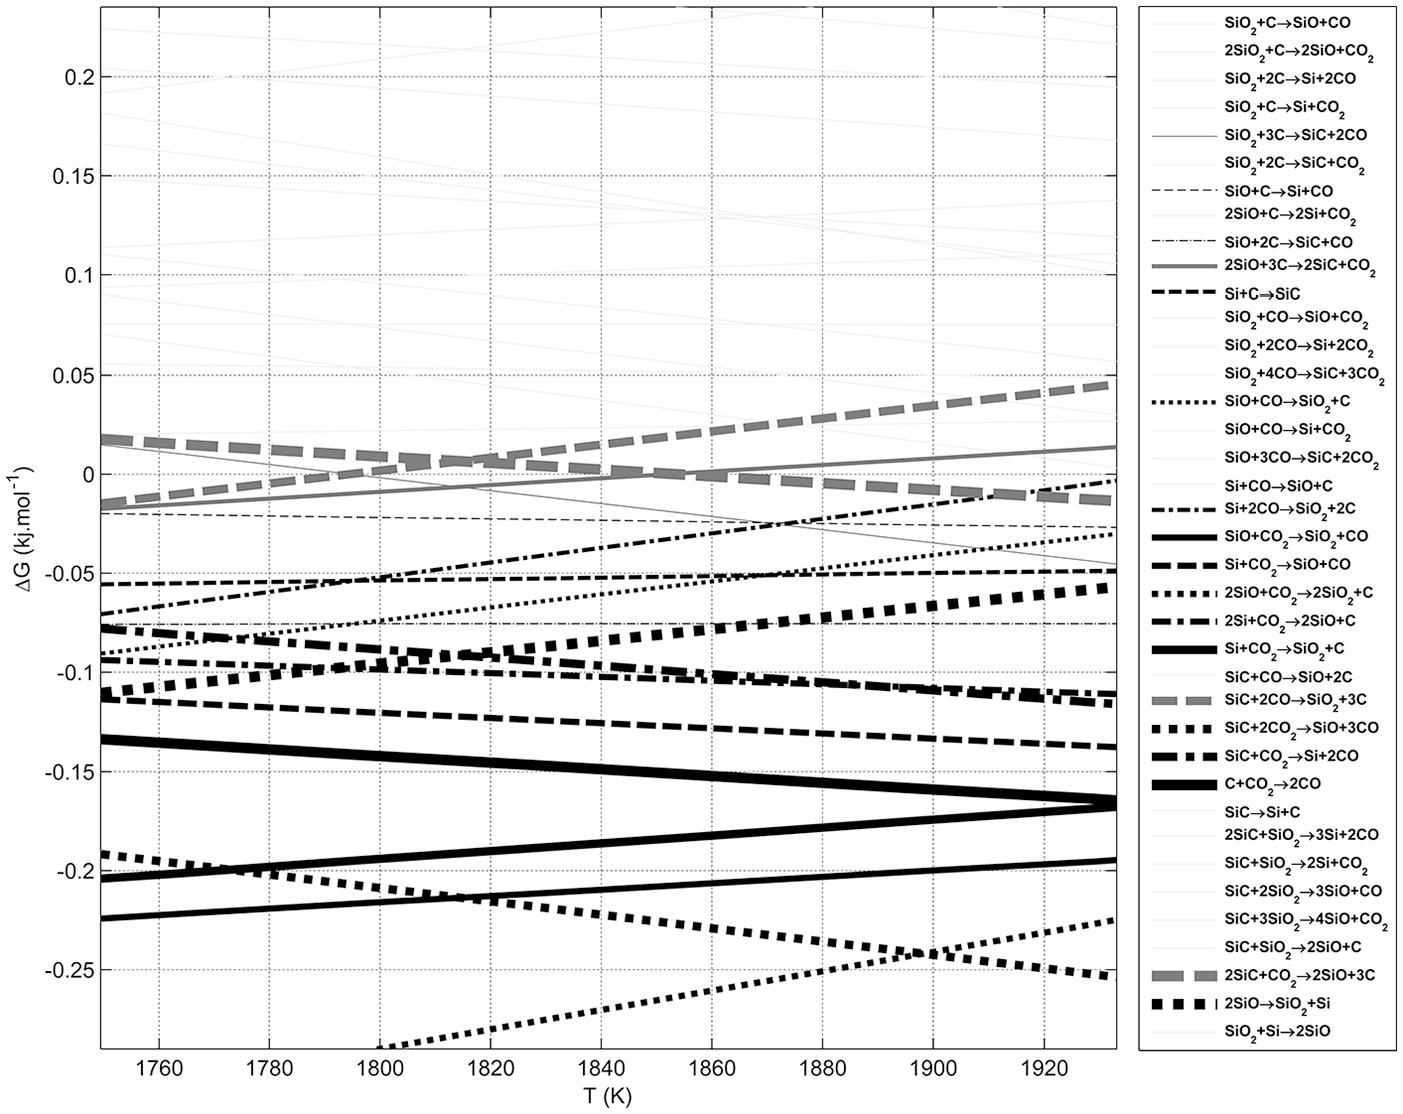
ΔG of the possible reactions. 37
This list indicates that the only way for producing SiC in this reaction is the reaction of solid carbon (and not CO or CO2 gases) with the silicon components (i.e. Si, SiO, or SiO2). Therefore, SiC is formed by the reaction of solid Si or SiO2 at the surface of the carbon particles, or by the reaction of diffused SiO gas with C inside graphite particle. Therefore, CO and CO2 have no direct effects on the SiC production, and these components may have intermediate effects on this reaction.
Mechanism
The reaction of carbon with silica removes its oxygen contents and decreases its weight. Therefore, a common method for study progress of this reaction is TGA. The extent of this reaction can be defined by comparing weight loss of the sample at any time (Wi– W, where Wi is the initial weight of the sample) with the final amount of weight loss (Wi– Wf) when the weight loss is stopped experimentally (
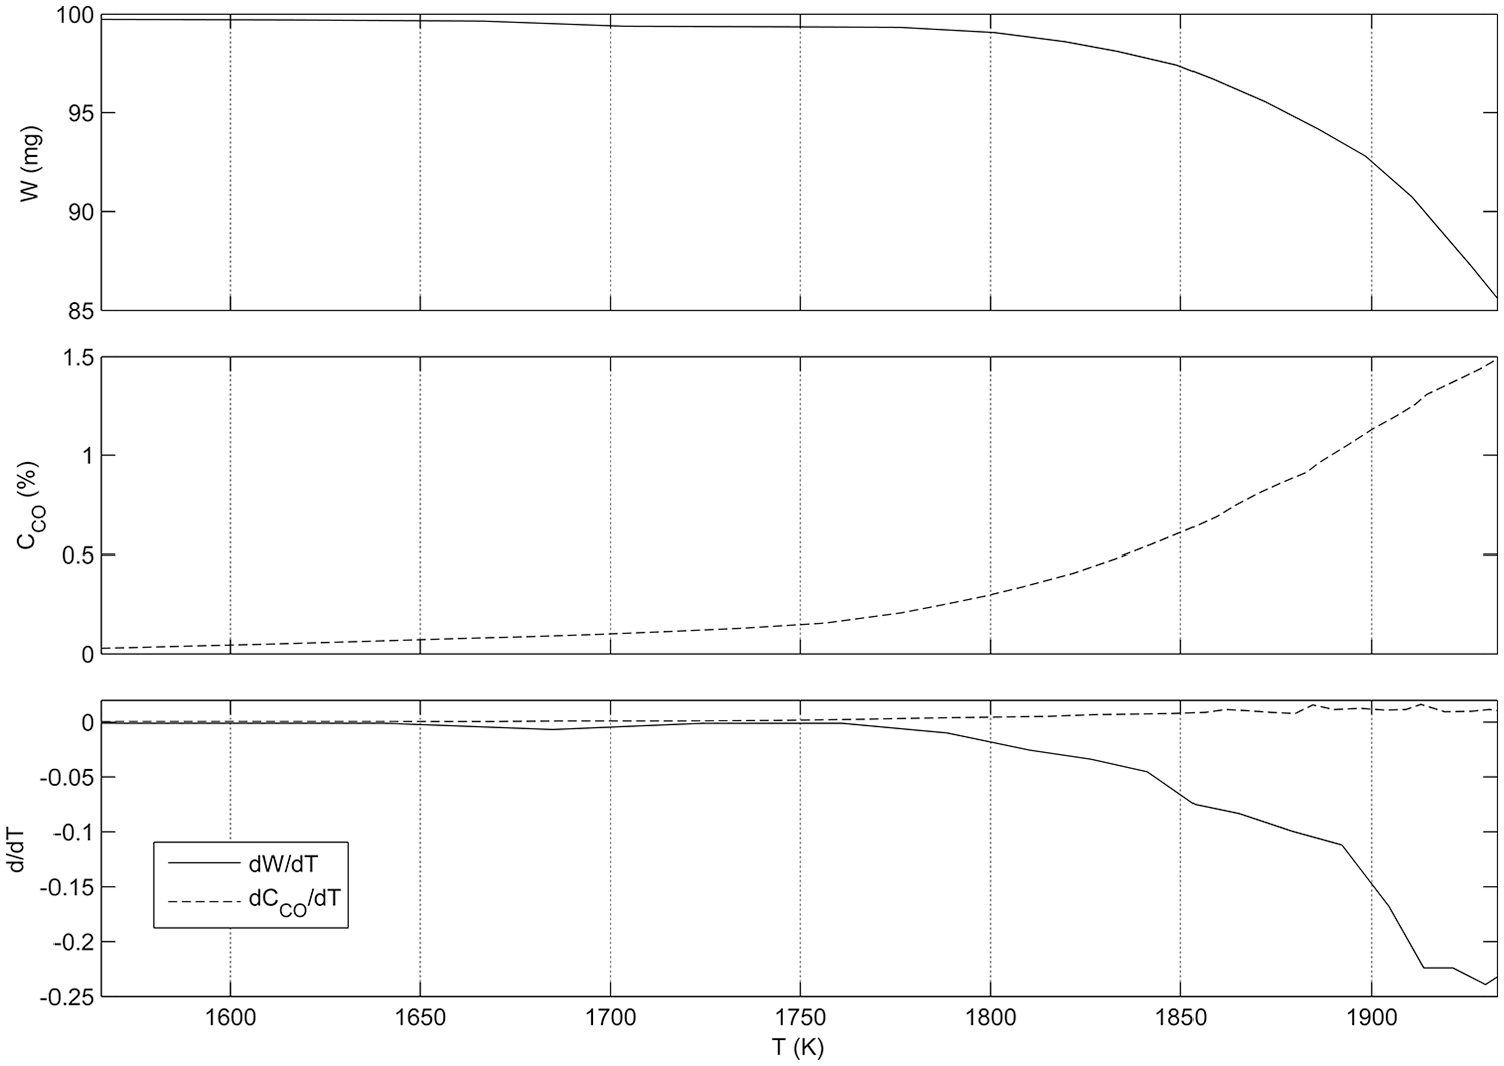
Measured weight loss of the solid sample, detected carbon monoxide concentration in the exhaust gas, and their differential variations with temperature.
The reduction kinetics of silica with carbon has been studied using the existing models (see Table 139–54), which are based on a single-step kinetic equation 42

where t is time, T is temperature, X is solid conversion and f(X) is reaction model as a function of the solid conversion, and k(T) is reaction rate constant as a function of temperature. Dependency of this constant to the temperature has been defined by the Arrhenius equation (
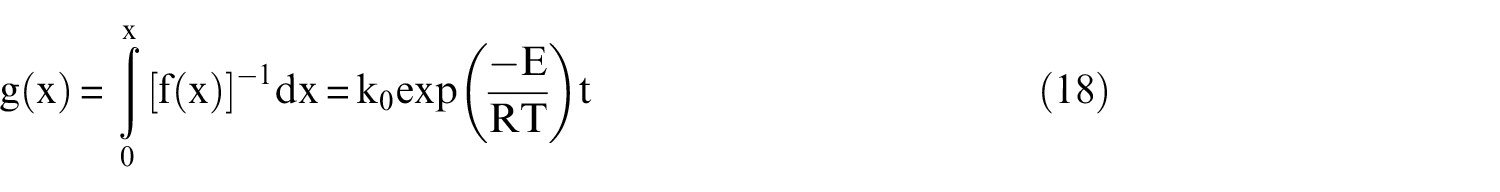
which k0 is pre-exponential factor and g(x) is an integral form of the reaction model. One of the common methods of mechanism analyzing of such reactions is fitting the experimental data (isothermal conversion vs time) with the conventional models and validating this fitting using correlation coefficient. 55
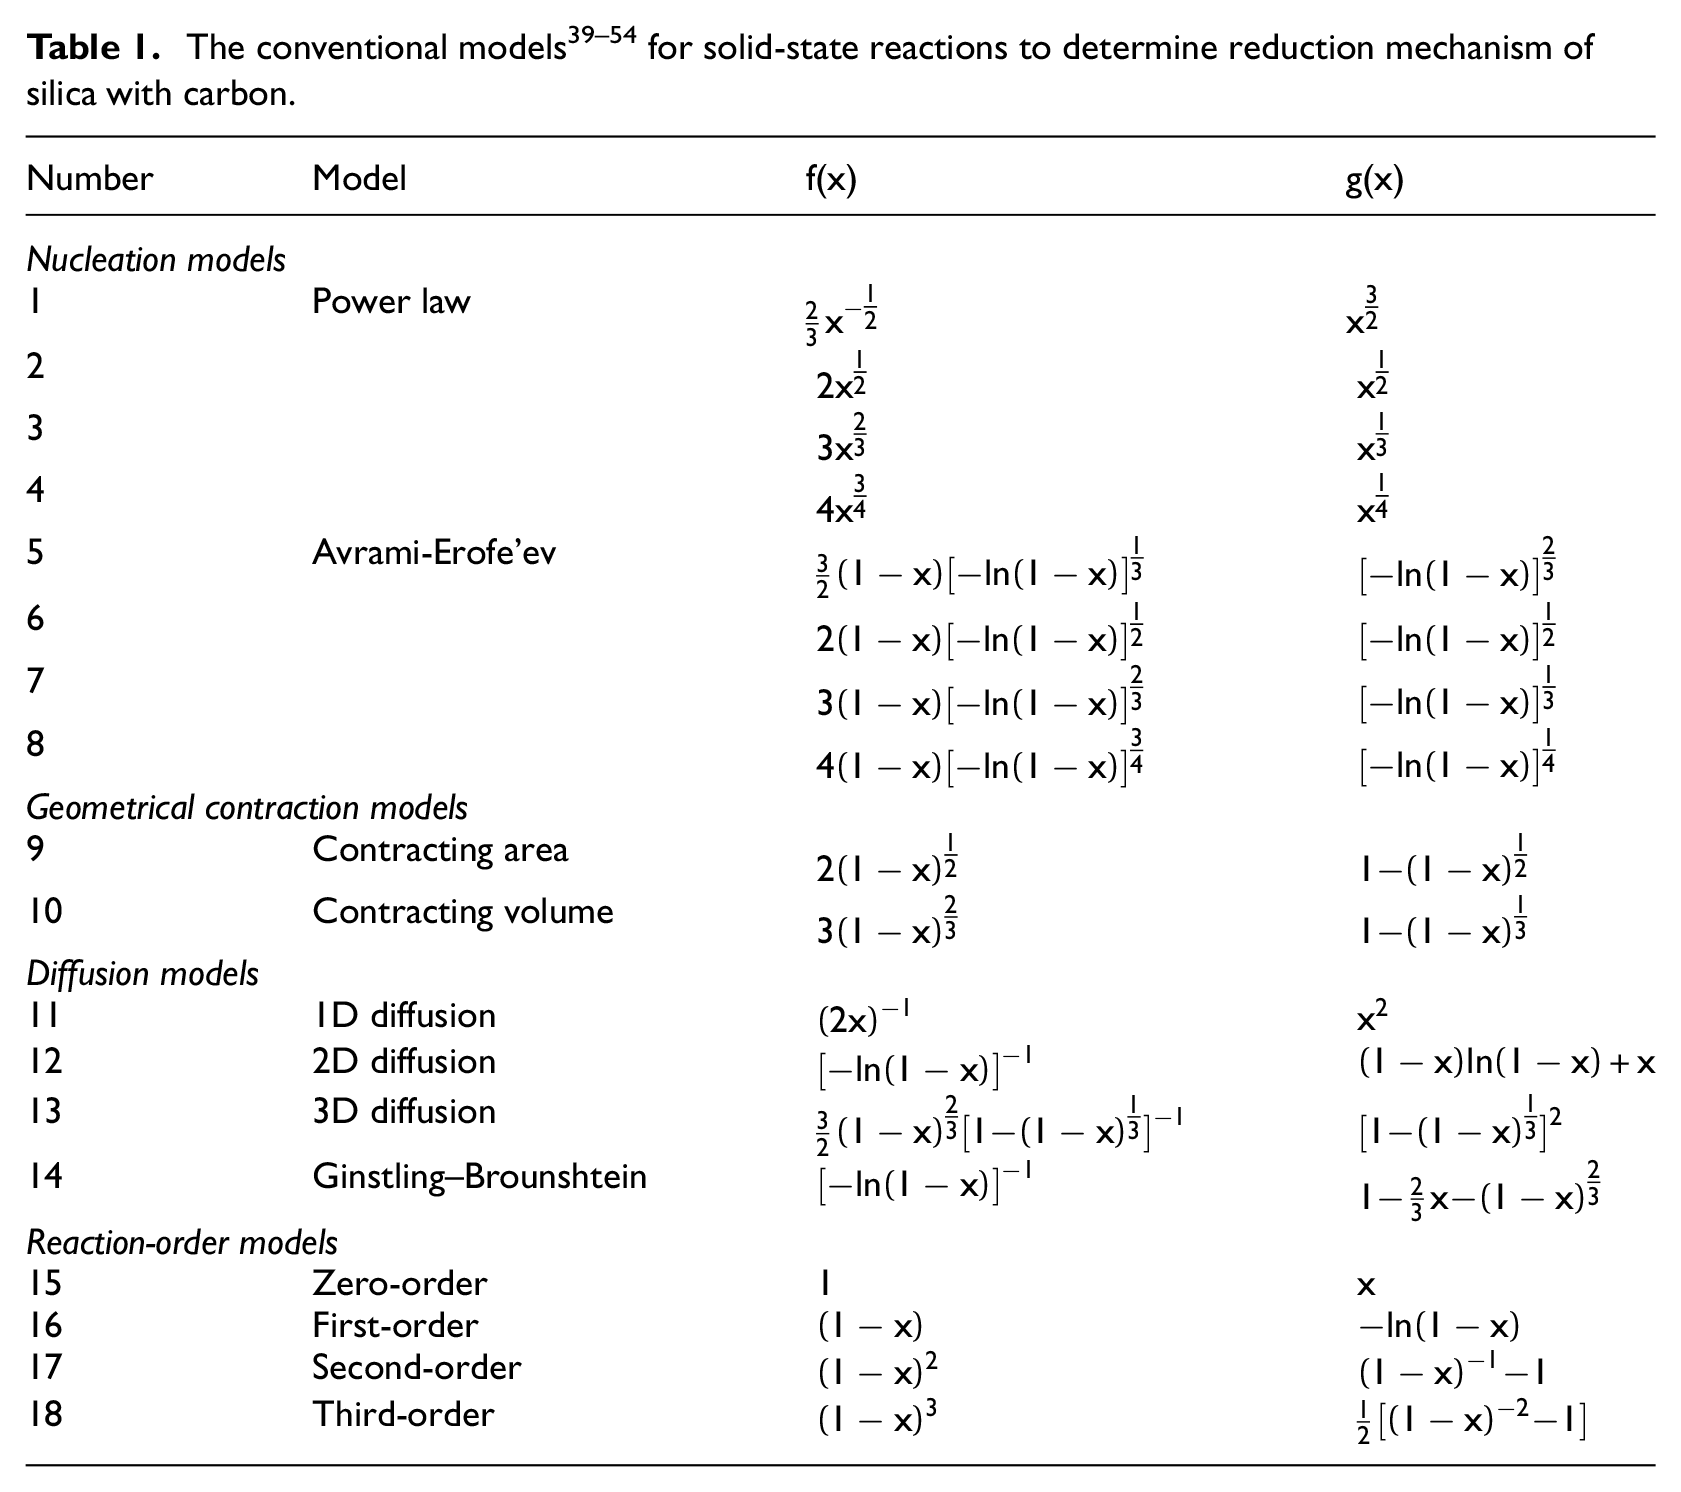
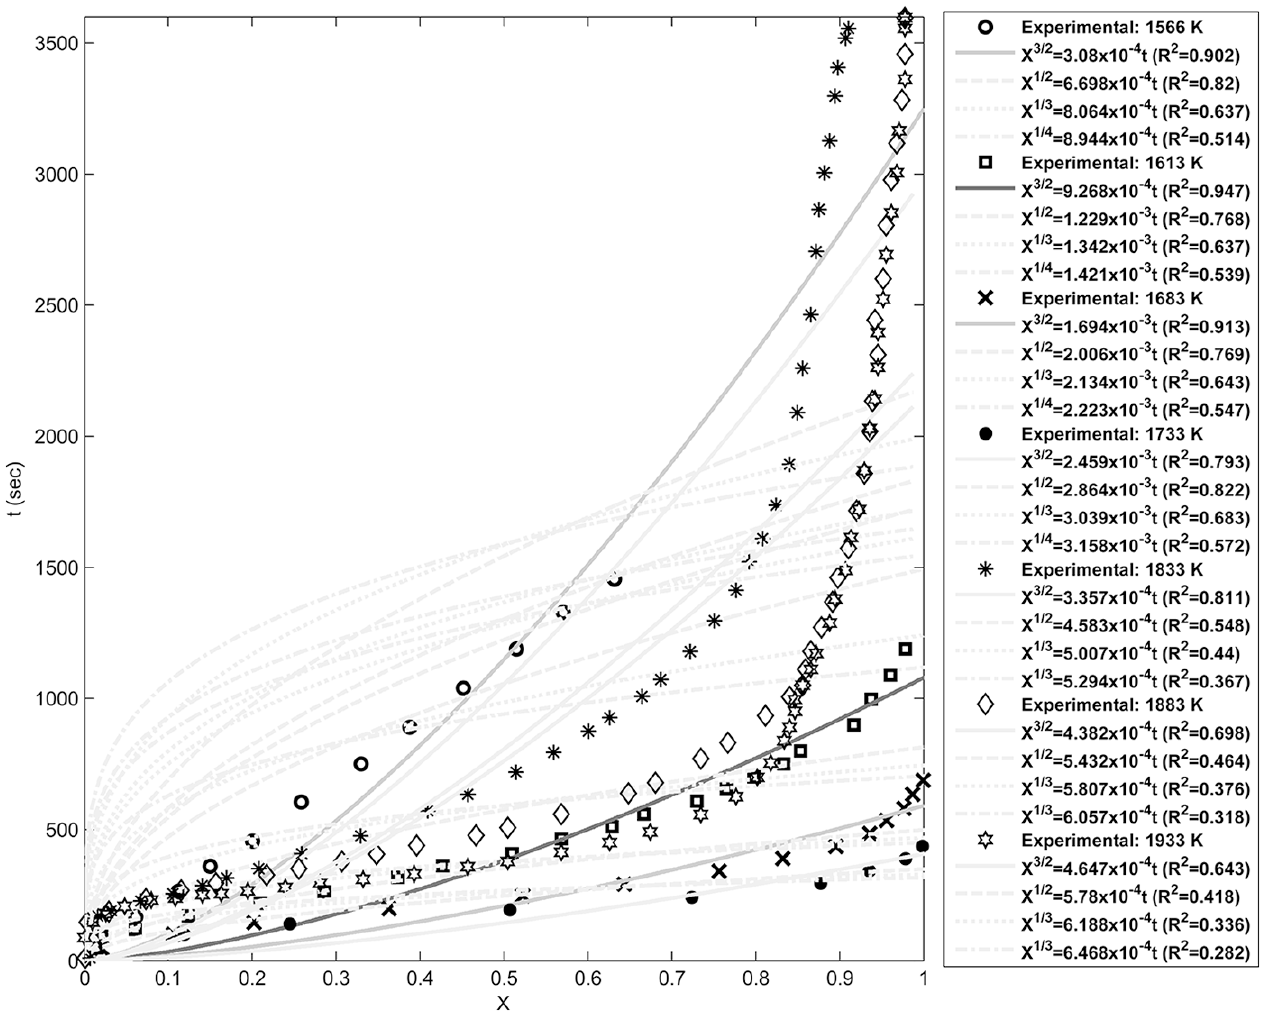
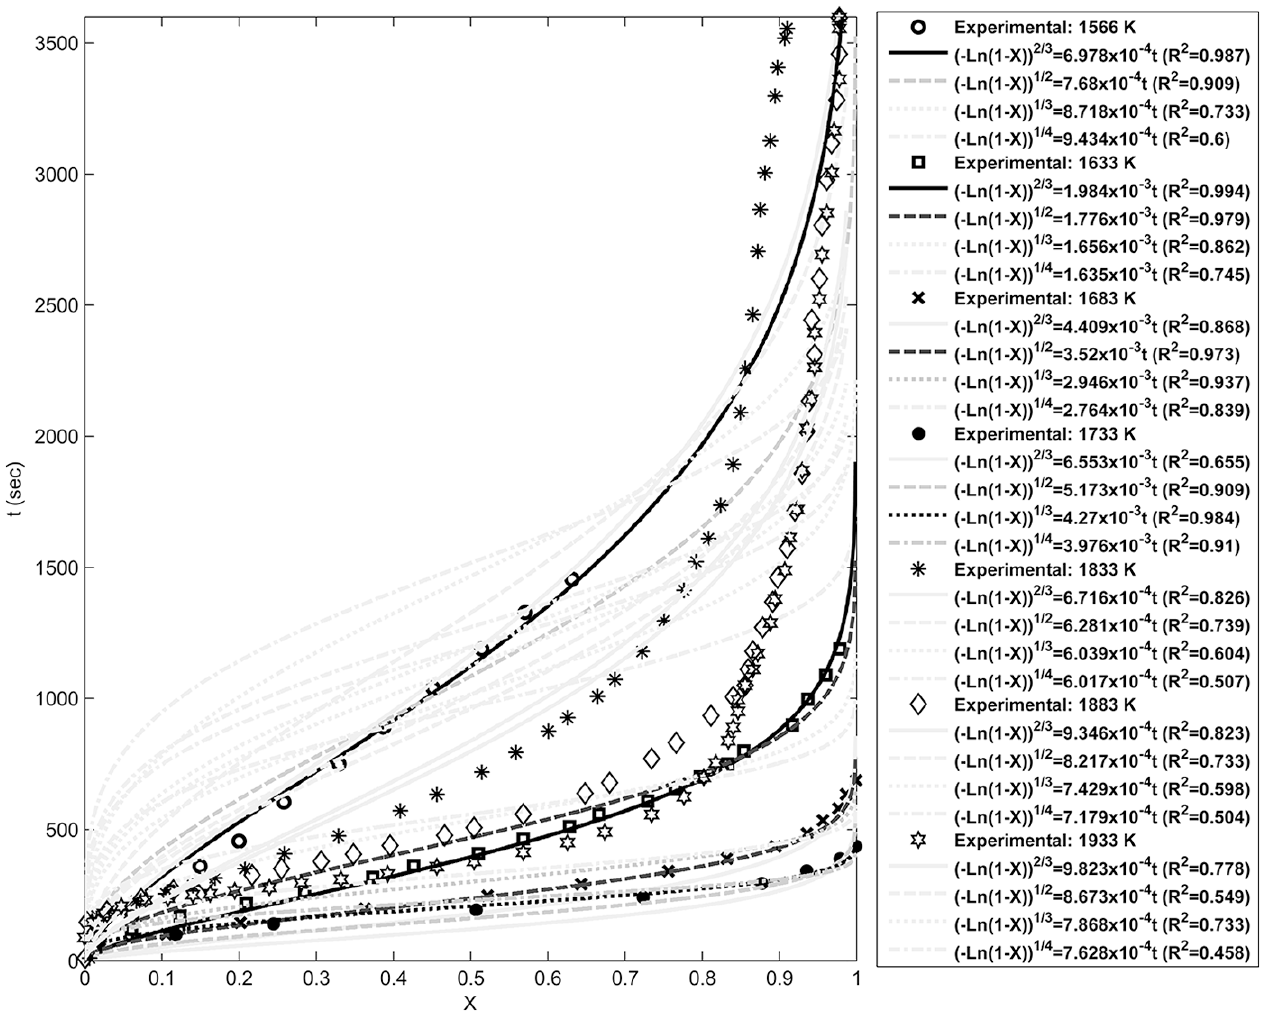
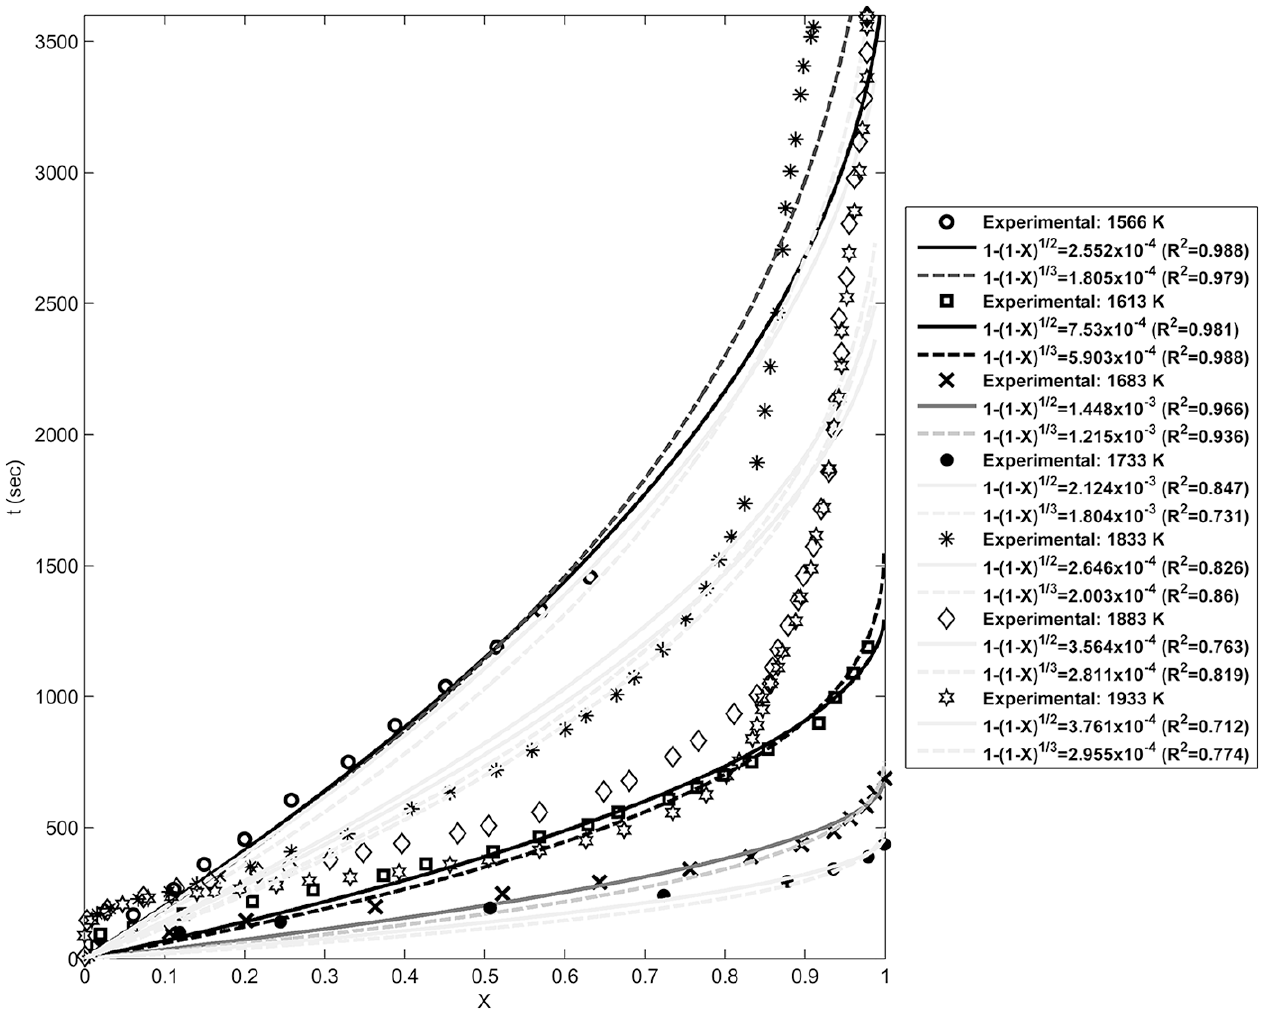
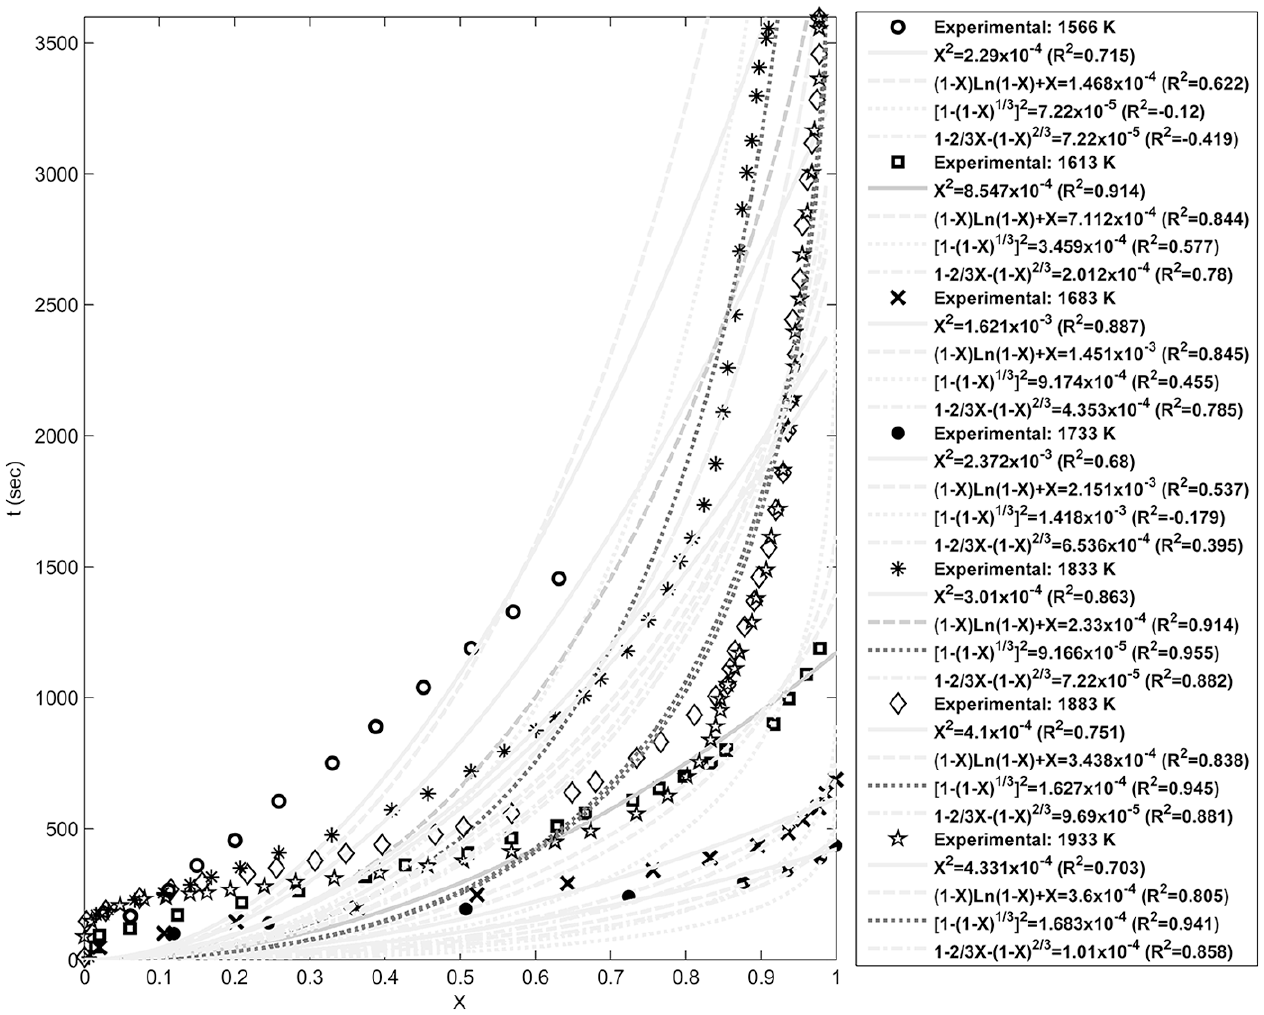
Figures 4–8 show fitting of the presented models in Table 1 with the experimental reduction data at different temperatures. The obtained k values by these models and their relevant R2 have been presented in these figures. Fitted curves that have more importance (attending to the calculated R2 values) have darker lines in these figures. Figures 9 and 10 show logarithmic form of the calculated k versus T−1 for the reactions at temperatures less and more than 1750 K, respectively. The accordance of these fitted straight lines with the experimental data (that were shown as markers in these figures) has been presented by R2 values. Lower importance models (based on their R2 values) were presented with lighter lines in this figure. Now, the reaction activation energy and pre-exponential factor can be calculated by each one of these models. Figures 11 and 12 compare the calculated activation energies as the vertical bars for the reactions at temperatures less and more than 1750 K, respectively. Width of each bar has been calculated using the presented values of R2 in Figures 9 and 10, and the darkness of each bar has been calculated using the average value of the presented values of R2 in Figures 4–8 for that model. Therefore, the darkness of each bar shows the accordance of that model with the experimental data and the width of each bar indicates the acceptability degree of calculated E value. It is clear from these figures that the reaction has suitable accordance with different models and follows their defined mechanisms at temperatures less and more than 1750 K. This reduction follows a combination of the nucleation and growth and also the geometrical contracting area mechanisms, and it is a second-order reaction at the temperatures lower than 1750 K, which indicates that the controlling step of this reduction process is the chemical gas–solid or solid–solid reaction at the surface of the carbon particles. On the other hand, at more temperatures, this reduction is a first-order reaction and follows the 3D diffusion mechanism, which indicates that the reaction rate is fast enough at these temperatures and rate of the diffusing of SiO gas inside the carbon particles controls the total rate of the reaction.
Fitting of the power law models with the experimental data at different temperatures.
Fitting of the Avrami-Erofe’ev models with the experimental data at different temperatures.
Fitting of the geometrical contraction models with the experimental data at different temperatures.
Fitting of the diffusion models with the experimental data at different temperatures.
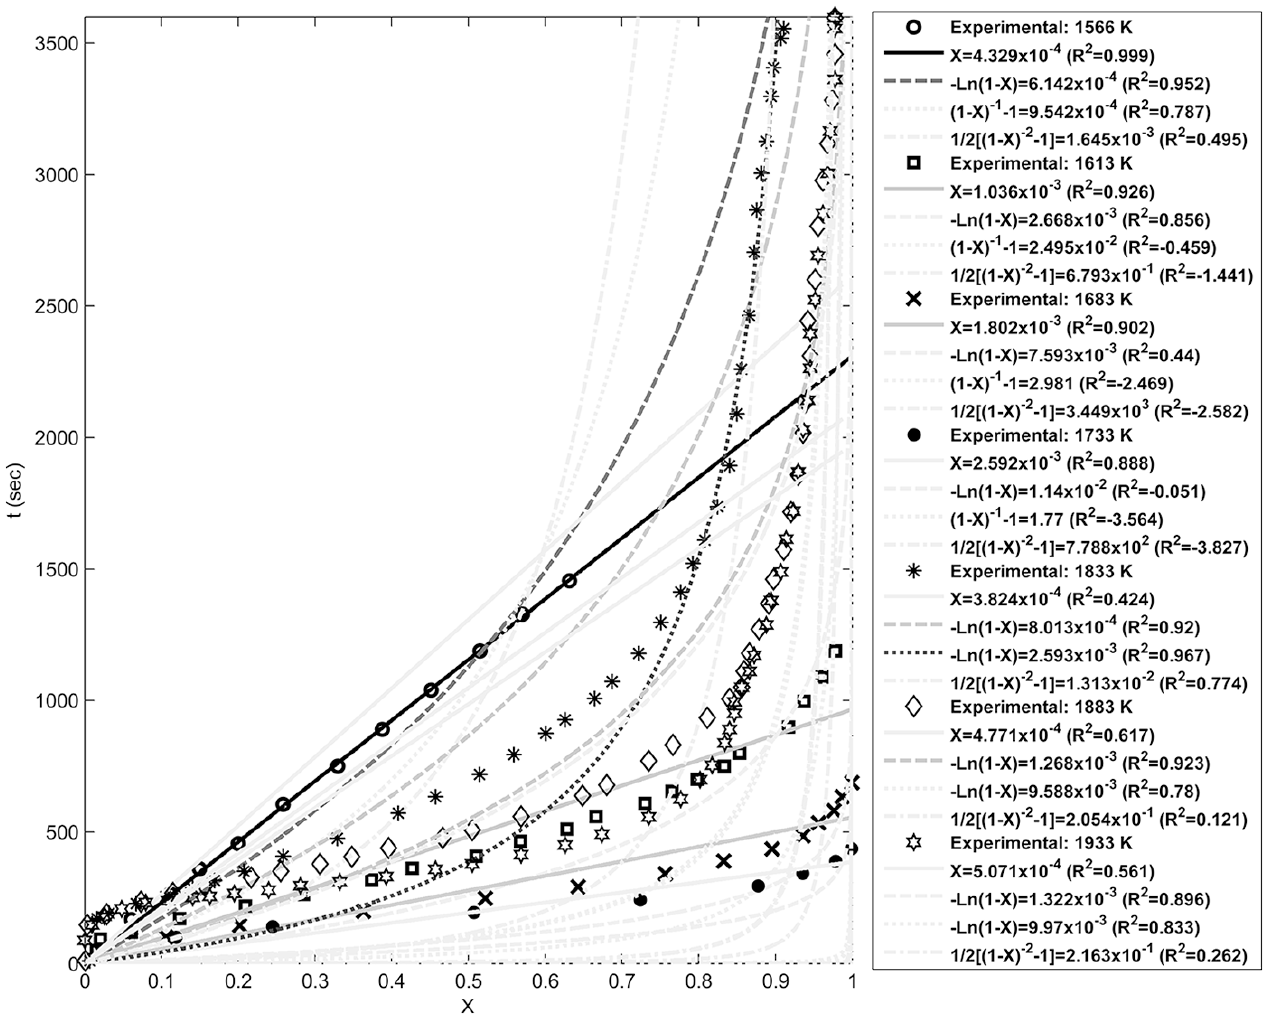
Fitting of the reaction-order models with the experimental data at different temperatures.
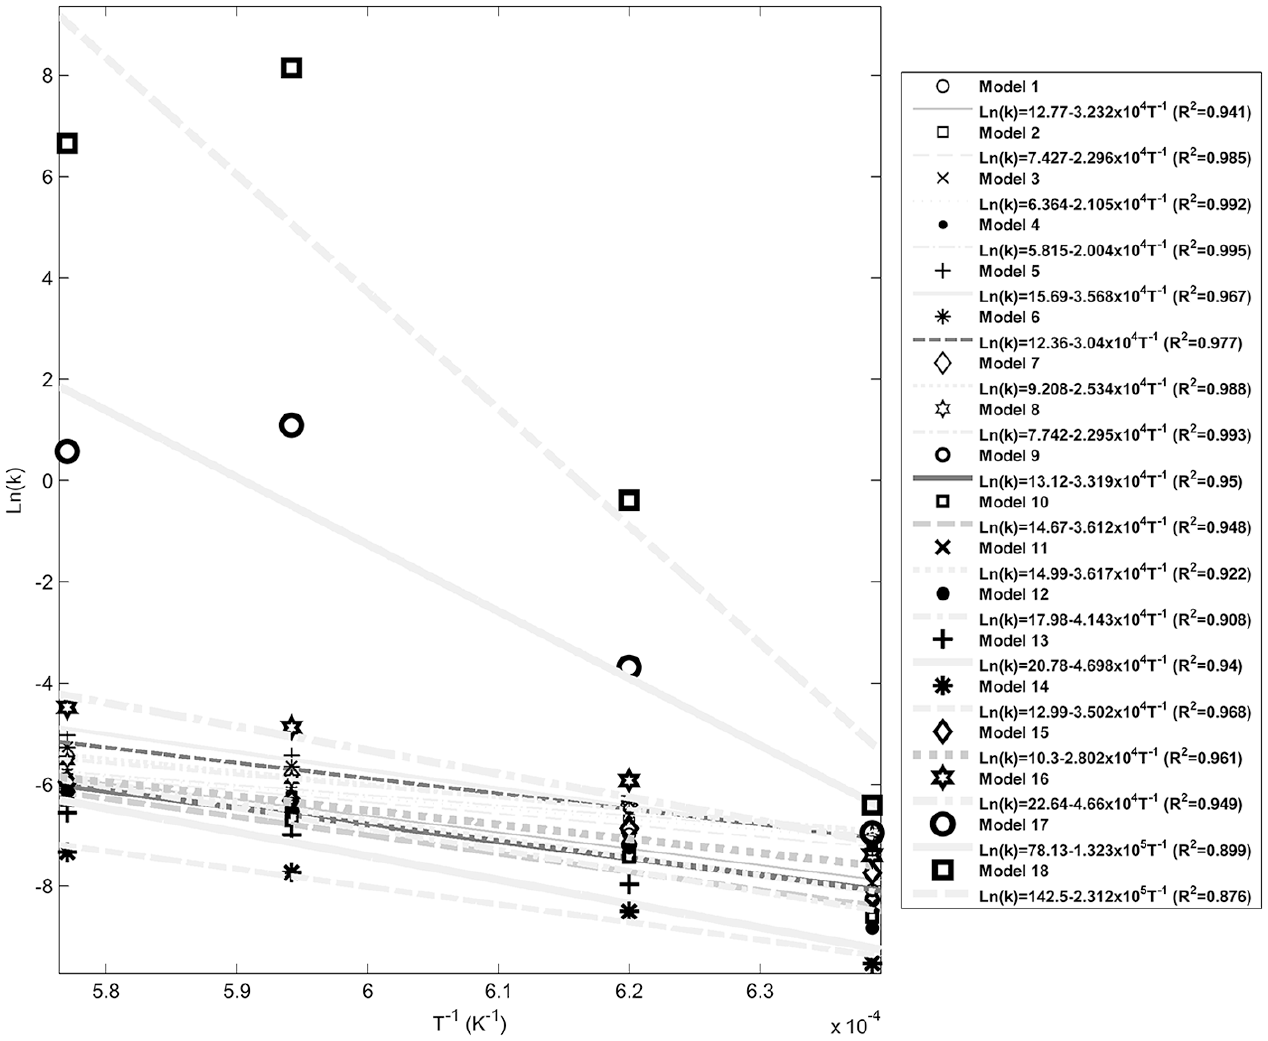
Logarithmic form of k versus T−1 at temperatures less than 1750 K.
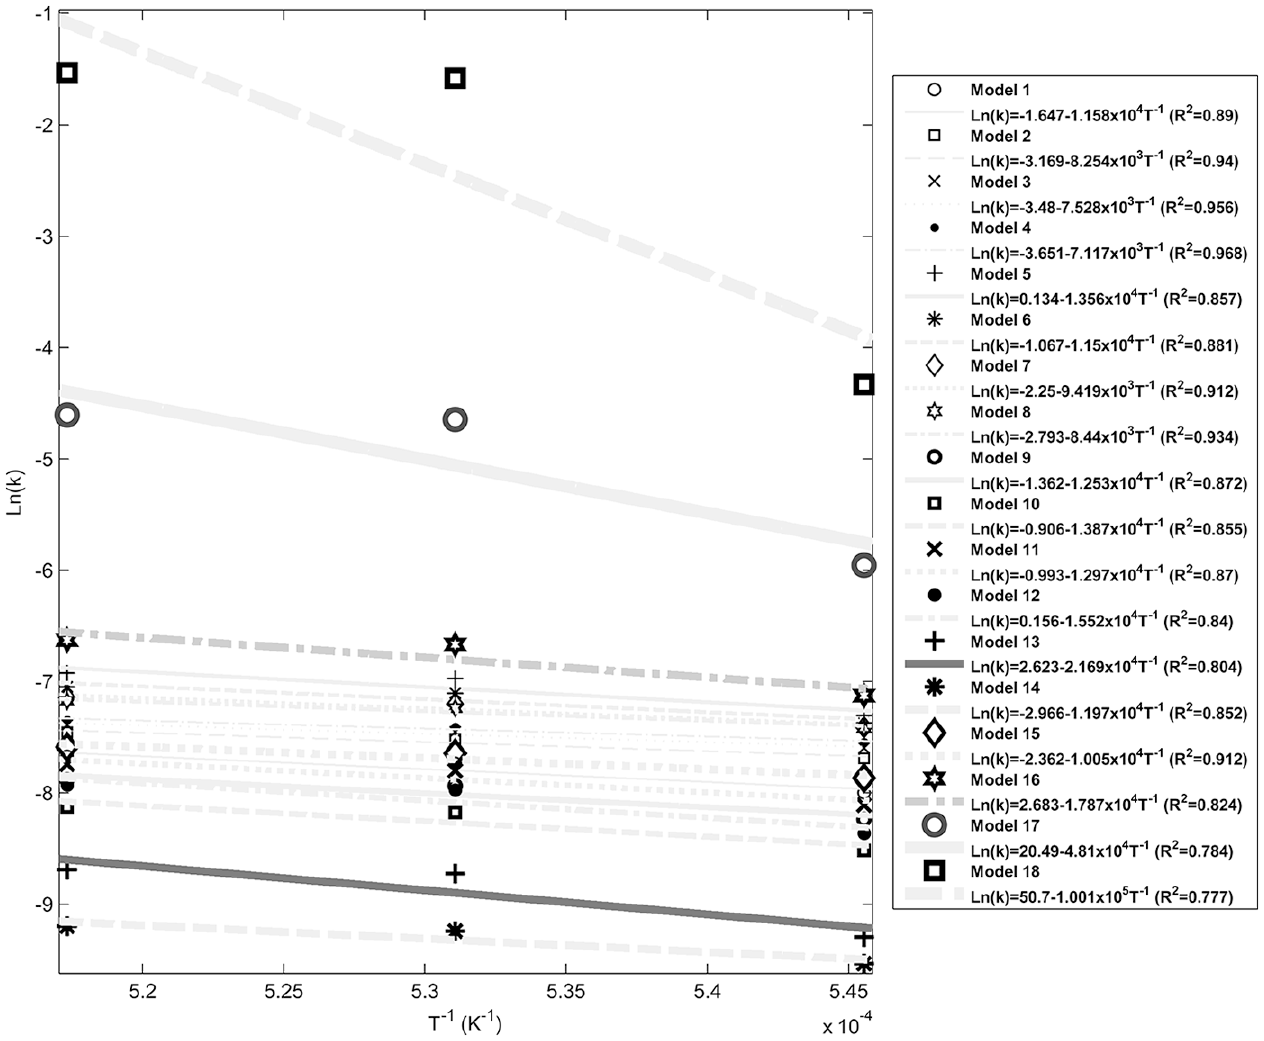
Logarithmic form of k versus T−1 at temperatures more than 1750 K.
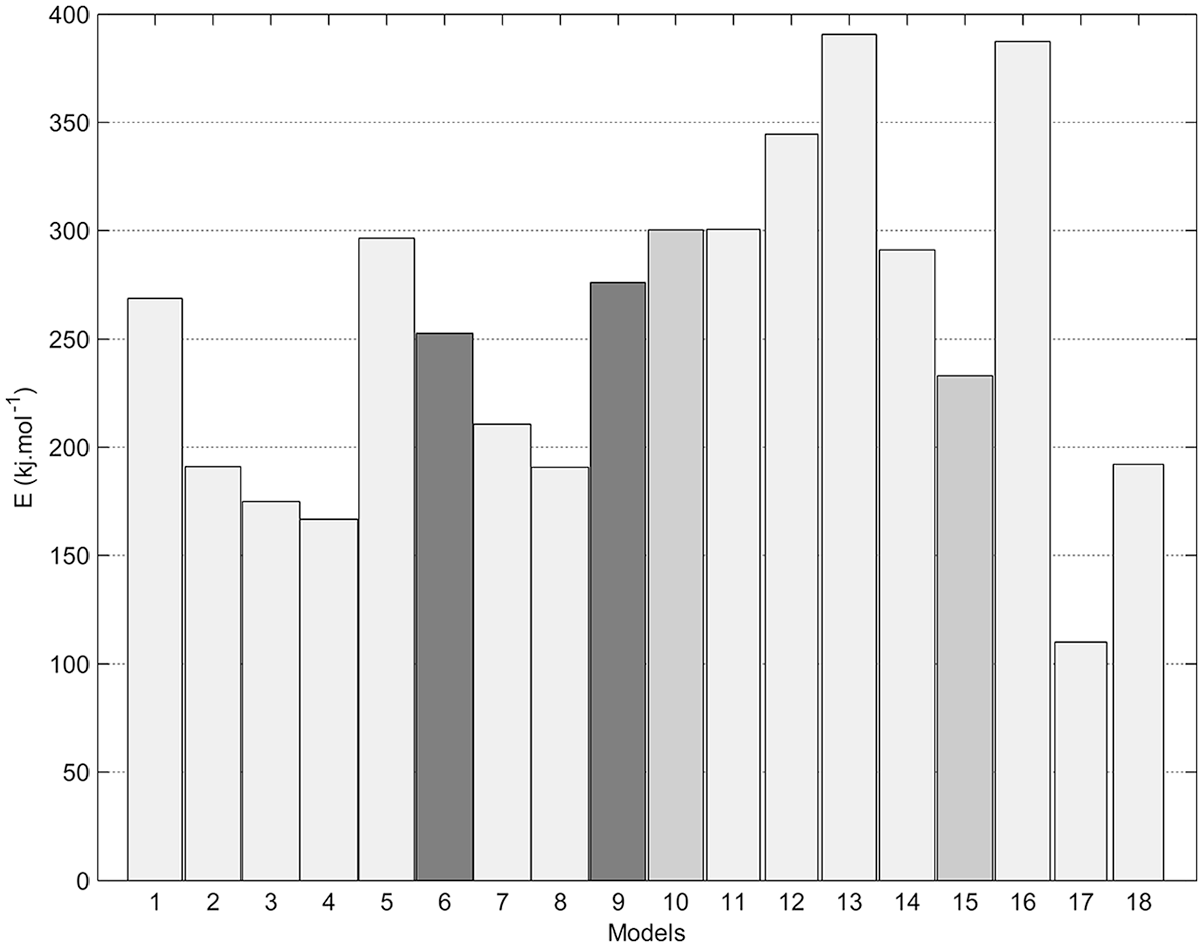
Calculated activation energy of SiO2-Carbon reduction at temperatures less than 1750 K, using the presented models in Table 1.
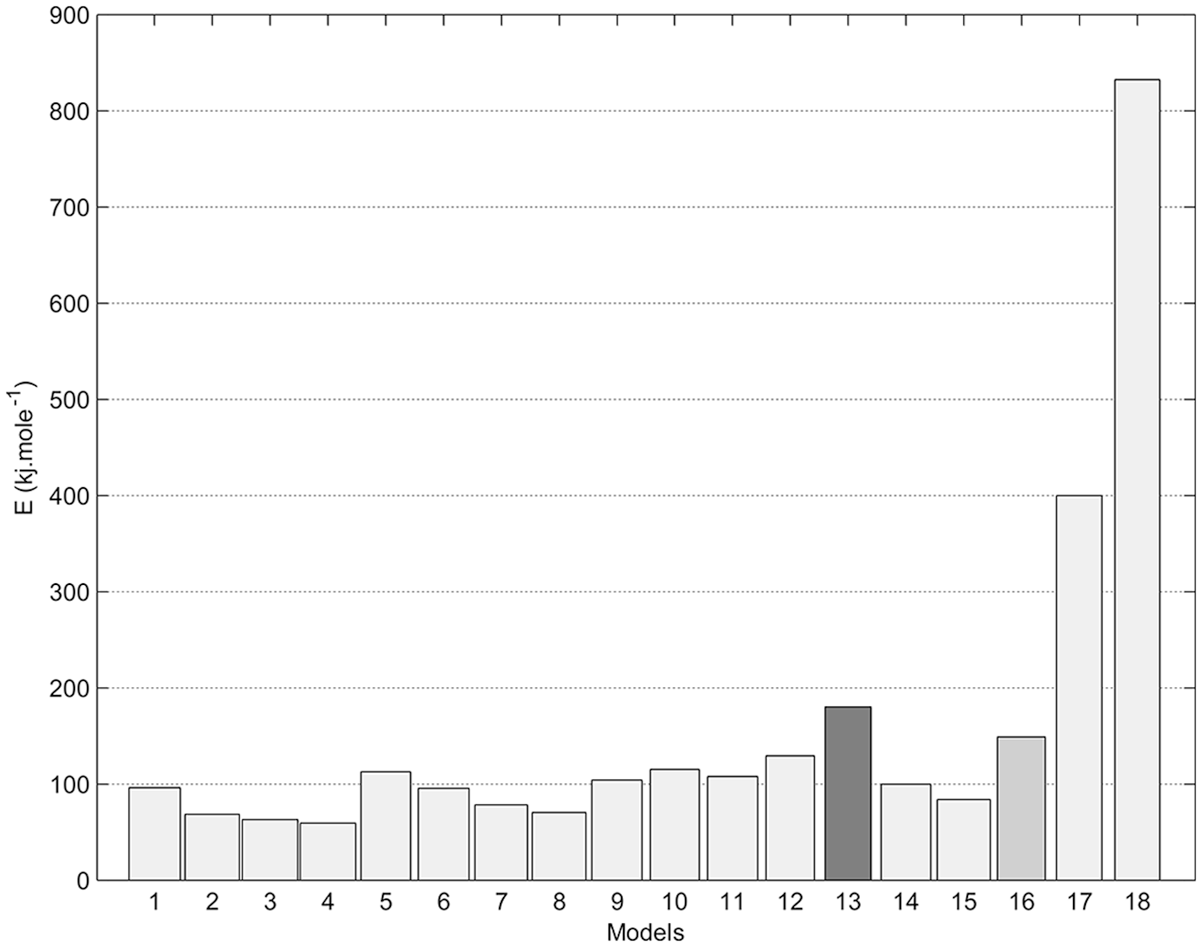
Calculated activation energy of SiO2-Carbon reduction at temperatures more than 1750 K, using the presented models in Table 1.
Conclusion
In this study, the reaction kinetics of carbon reduction of silica particles was investigated. For this purpose, a TGA unit was used to study the reaction kinetics at the temperature range of 1566 to 1933 K. Fitting method was used to obtain the mechanism of this reaction. The spontaneity of the possible reactions has been tested using the thermodynamic concepts attending to the change of their Gibbs energy. It was resulted that the only way for producing SiC in this reaction was the reaction of the silicon components at the surface or by diffusion inside the carbon particles, and CO and CO2 have no direct effects on this production. It was also resulted that the controlling step of this reduction process at temperatures lower than 1750 K is the chemical gas–solid or solid–solid reaction at the surface of the carbon particles. At temperatures more than 1750 K, the reaction rate of this reduction process is fast enough and the rate of SiO diffusing inside the carbon particles controls the total rate of the reaction.
Footnotes
Declaration of conflicting interests
The author(s) declared no potential conflicts of interest with respect to the research, authorship, and/or publication of this article.
Funding
The author(s) received no financial support for the research, authorship, and/or publication of this article.