
Abstract
Platinum-carbonaceous catalysts were prepared by the wet impregnation method and tested for catalytic oxidation of toluene as a volatile organic compound. The textural properties of the constructed catalysts were considered by X-ray diffraction, X-ray fluorescence, inductively coupled plasma – optical emission spectroscopy, Fourier transform infrared, scanning electron microscope and N2 adsorption–desorption analysis. The catalytic assessments showed that the best activity (>99%) and high stability and selectivity to CO2 (>99%) are related to platinum-supported carbon nanotube. The curves of the conversion and selectivity demonstrate that the performance of catalysts to eliminate the volatile organic compound and turn it into CO2 conforms to the following descending order: platinum-supported carbon nanotube >platinum-supported graphene >platinum-supported activated carbon >platinum-supported carbon nanofibre. The kinetic of toluene oxidation has been evaluated as a function of toluene and oxygen partial pressures in different temperatures. Two kinetic models (Power Law and Mars–van Krevelen mechanisms) were applied to the reaction and compared with the experimental data. Mars–van Krevelen model is more appropriate than the Power Law model for this reaction as Mars–van Krevelen model showed better prediction of the behaviour of the reaction.
Introduction
Volatile organic compounds (VOCs) are those compounds with a vapour pressure above 10.3 Pa at standard temperature and pressure (STP) conditions, which means they are quickly evaporated at room temperature (298.15 K). VOCs are considered as one of the most important air pollutants. The emission of VOCs into the air by various industrial processes caused health issues like carcinogenic effects on humans and environmental problems like climate changes and toxicity of the atmosphere. Thus, it is so important to eliminate the VOCs released into the air from emission sources.1–3
In order to control the emission of VOCs, lots of methods already have been investigated. These methods are based on either recovery or destruction. The recovery-based techniques consist of adsorption, absorption, condensation and membrane separation.2,4 In the destruction-based methods, VOCs are turned into CO2 and water, which can be achieved by thermal oxidation or catalytic oxidation. In both oxidations, VOCs are burned and converted into CO2 and H2O.2,5 Thermal oxidation needs high flow rate, high concentration of VOCs and high temperatures. 6 But the advantage of catalytic oxidation is that it works for dilute VOCs and much lower temperatures (250°C–500°C). The catalysts used in VOCs oxidation are categorized into two different groups:
Supported noble-metal catalysts like Pt, Pd, Rh and Au.
Non-noble metal oxides like CeO2, CuO and MnOx.
The oxidation reaction occurs in the presence of an appropriate catalyst. Therefore, catalytic oxidation is more effective and economical. The supports used in the catalytic oxidation of VOCs must have good thermal stability and large specific surface areas like alumina, Zirconia, silica, zeolites and porous adsorbents like carbon-based materials. These carbonaceous adsorbents are extremely used in gas purification and also VOCs treatments due to their porous structure, high surface area and high adsorption capacity. Due to their ordered and porous structure, active sites are more available and the accumulation of metals as an active site occurs less. Among active sites for catalytic oxidation of VOCs, the platinum-supported ones are extensively used owing to their high stability and activity.2,7–9
This study discusses the catalytic oxidation of toluene as a VOC into CO2 and H2O using four different types of prepared carbonaceous supports, including activated carbon (AC), carbon nanofibre (CNF), carbon nanotube (CNT) and graphene (Gr). We perform a comparison of Pt-supported catalysts for the total oxidation of pure toluene at temperatures between 200°C and 500°C.
Experimental part
Catalyst preparation
The synthesis details for each support were reported elsewhere. Briefly, multi-walled carbon nanotubes (MWCNTs) were prepared by the catalytic decay of acetylene over catalysts supported by CaCO3 at 720°C. 10 CNFs were prepared by a certain amount of nickel-impregnated CNT catalyst, which was introduced into a quartz reactor. The catalyst was reduced. Then the hydrogen flow was exchanged by a mixture of ethane and hydrogen. 11 Graphene support was obtained by electrochemical exfoliation of graphite, which was achieved in a two-electrode system using platinum as a cathode electrode and a graphite foil as an anode electrode. 12 AC was bought from the Merck company (Darmstadt, Germany).
Pt-supported catalysts, including the Pt/CNT, Pt/CNF, Pt/Gr and Pt/AC were prepared by the incipient impregnation method using H2PtCl6.6H2O (as a platinum precursor). The synthesized supported metal catalysts were dried in an oven at 80°C and then calcined at 500°C for 4 h in air. The platinum content of the catalysts was adjusted to 0.6 wt% that was checked by the X-ray fluorescence (XRF) method.
Catalyst characterization
For the catalyst characterization, many techniques were used such as powder X-ray diffraction (XRD), XRF, Fourier transform infrared (FT-IR), N2 adsorption–desorption measurement and scanning electron microscope (SEM) that are briefly explained as follows.
XRF was performed using an a Thermo Scientific (Thermo Fisher Scientific Company, USA) XRFARL-8410 Rh apparatus with a voltage of 60 kV. Powder XRD patterns of the catalysts were obtained by an X-ray diffractometer Malvern, (Panalytical X’Pert PRO, UK) using Ni-filtered Cu k α radiation at 45 kV and 50 mA with a 0.06 2θ-step and 1 s per step. FT-IR was used to identify the nature of chemical bonds in the catalysts. The spectra were obtained with a BOMEM FT-IR spectrophotometer model Arid-zone TM, MB series in 400–4000 cm−1, while a certain amount of the catalysts was compelled into a disc by mixing KBr. The amount of impregnated platinum in catalysts was determined by inductively coupled plasma – optical emission spectroscopy (ICP-OES) using a Varian VistaPRO instrument (Varian Inc., Australia). The amount of platinum for each catalyst was around 0.6 wt%.
N2 Brunauer–Emmet–Teller (BET) isotherms were obtained using an all-glass high vacuum line on an ASAP-2010 micromeritics Company (USA) gas sorption analyser. The total pore volumes (Vp) were measured by N2 adsorption–desorption at 77 K and a relative pressure (P/P0) of Ca. 0.99. The mesopore size distributions were obtained from the adsorption branch of the N2 isotherms using the Barrett–Joyner–Halenda (BJH) method. SEM imaging of the coated catalysts with gold were performed by a Hitachi SU3500 (Hitachi Ltd., Tokyo, Japan) instrument operating at an accelerating voltage of 30 kV.
Catalytic tests
Catalytic oxidation of toluene was done in a continuous fixed-bed microreactor, connected to an on-line gas analyser (Delta 1600-L) at atmospheric pressure and temperatures between 200°C and 500°C. The experiments were achieved using a catalytic bed of 0.3 g of each catalyst and conducted at a toluene flow rate of 2 mL h−1 and an oxygen flow rate of 3 mL s−1. The only obtained products were detected as toluene (Tu), H2O, CO and CO2. Catalytic activity is represented in terms of toluene conversion (CTu) and selectivity to CO and CO2 (SCO and SCO2)


The catalytic stability was also performed under the same conditions as activity tests at a fixed temperature of 350°C for 60 h each on stream.
Kinetic study
Kinetics study of toluene oxidation was executed over these catalysts at the conditions as follows: temperature range of 200°C–500°C, a different flow rate of gas toluene from 1.5 to 3 mL h−1 and a varied O2 flow rate of 0.2–0.8 mL s−1. Two kinetics (Power Law (PL) and Mars–van Krevelen (MvK)) models were also used to study the kinetics of reaction on prepared catalysts in conversions less than 10%.
Results and discussion
Catalyst characterization
The powder XRD patterns of the Pt/CNT, Pt/CNF, Pt/Gr and Pt/AC catalysts are shown in Figure 1. The diffraction peak in the CNT and CNF pattern at 2θ = 26° and 43° is allocated to the crystal face of carbon, which exhibits the crystallized graphite and high electric conductivity, (0 0 2) and (1 0 0).13–15 In the graphene pattern, the peak at 2θ = 23° indicates the formation of graphene from graphene oxide after the solvothermal process (0 0 2) and the diffraction peak at approximately 2θ = 43° demonstrates (1 0 0) plane which shows the hexagonal structure of carbon.16,17 The appearance of a peak at 2θ between 20° and 30° shows the presence of carbon in the pattern of AC. 18 The absence of the peaks relevant to platinum in Figure 1 demonstrates the well-dispersed platinum particles on carbonaceous supports, which could be attributed to suitable calcination conditions and impregnation or low loading of platinum on supports.19,20
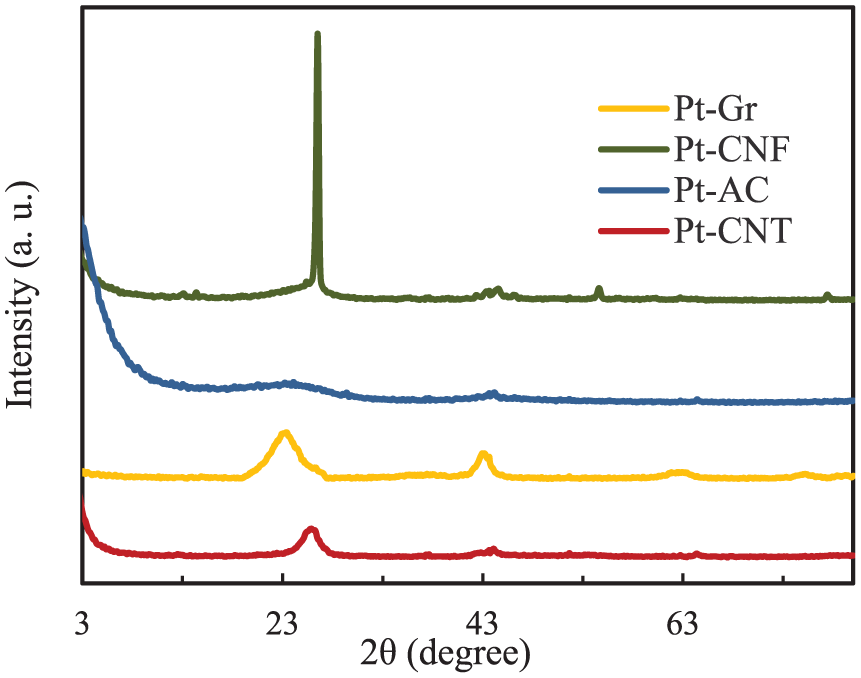
XRD patterns of Pt catalysts supported on AC, Gr, CNT and CNF.
Figure 2 shows the infrared spectra of prepared catalysts. The peak at near 3500 cm−1 corresponds to an H-bonded O–H stretching vibrations. A sharp peak at 1730 cm−1 attributed to C = O stretching vibration of the carboxylic acid. 21 Absorption bands at approximately 1580, 1640, 3440 cm−1 and bands between 1000 and 1300 cm−1 were also observed. Bands around 1580 cm−1 could correspond to the C–C stretching vibrations of polyaromatic C=C, and those in 1640 and 3440 cm−1 are assigned to H2O adsorbed in KBr, respectively. 22 The peaks at 3400 and 1700 cm−1 correspond to O–H and C=O bands. After the reduction of graphene oxide to graphene, the C=O band disappears, and new bands at 2900 and 2800 cm−1 appear, which shows the C–H stretch vibrations. 23 The sharp peak around3400 cm−1 is assigned to the O–H stretching vibration of hydroxyl or carboxylic groups, which is due to adsorbed water. The peaks at 2800 and 2900 cm−1 represent the C–H stretch of CH, CH2 and CH3. 24
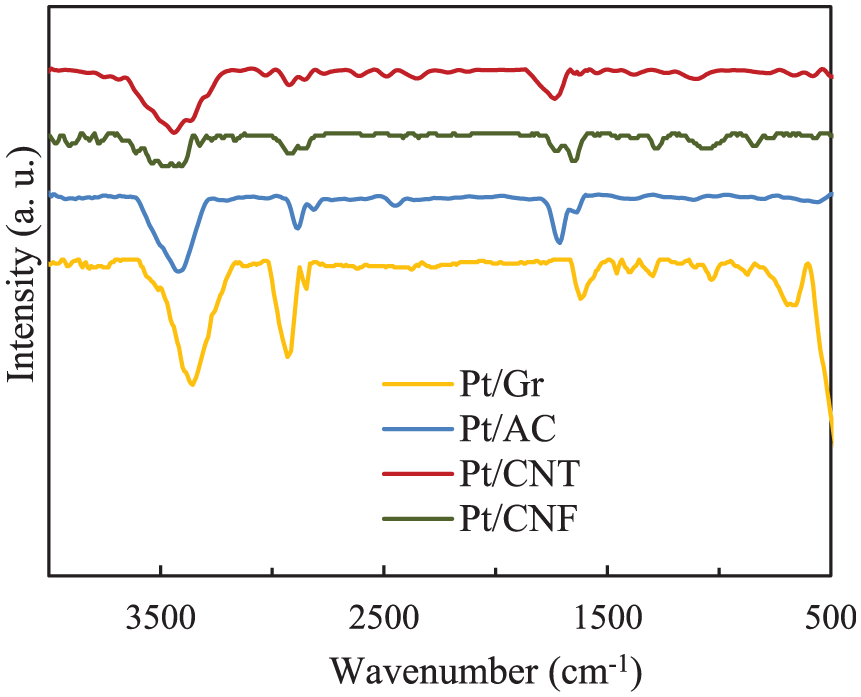
FT-IR spectra of platinum-supported catalysts.
The N2 adsorption–desorption behaviour curves of AC, Gr and CNF materials(Figure 3) show type-I(b) isotherms declaring the micropores and narrow mesopores(<2.5 nm), but CNT isotherm shows type-IV isotherm, which indicates the mesopore structure of CNT. 25
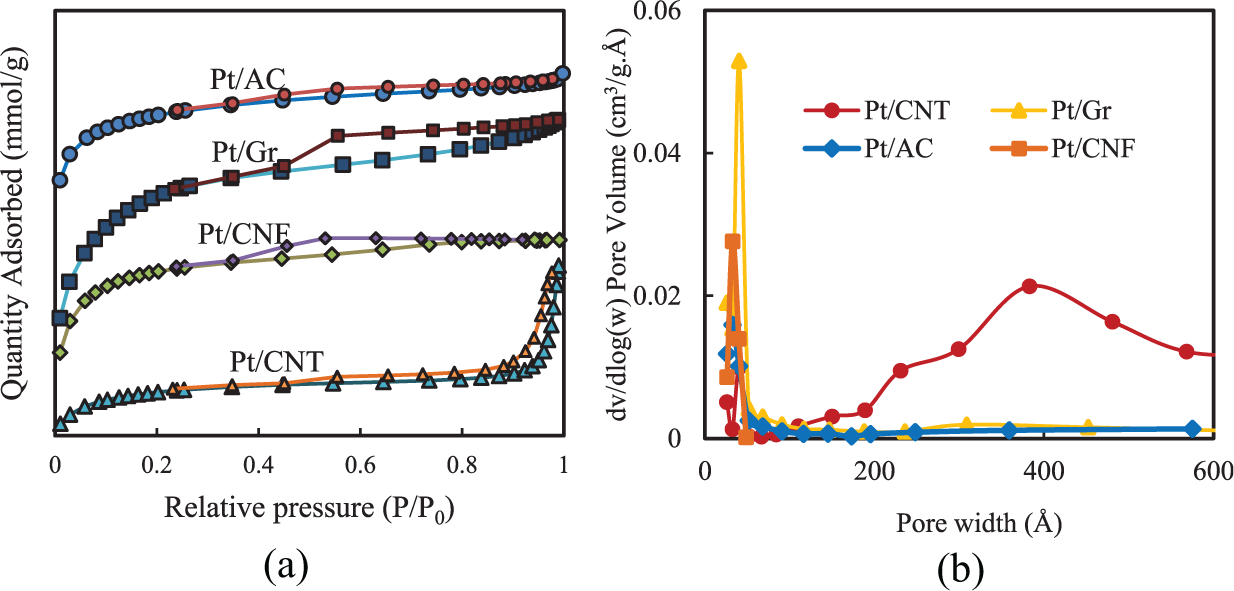
(a) N2 adsorption–desorption isotherms at −196°C and (b) pore diameter distributions ofPt-supported catalysts.
Most of the pore diameters are in the range of 1.9–2.1 nm (Table 1). The adsorption increases slowly with the relative pressure. As it has shown in this figure, all carbonaceous materials, except AC have mesoporous structure.
Physical and chemical properties of the carbonaceous supports.
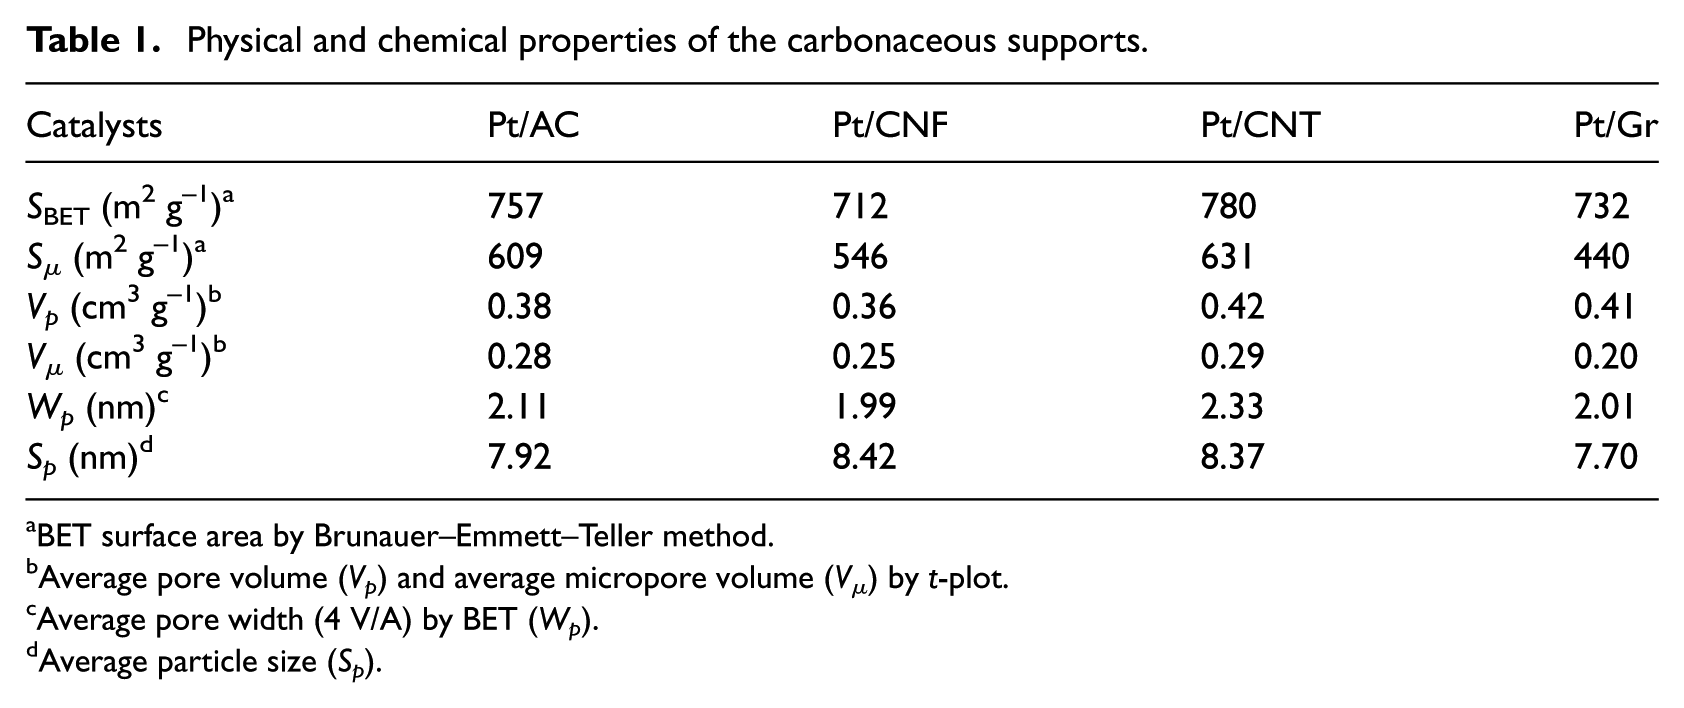
BET surface area by Brunauer–Emmett–Teller method.
Average pore volume (Vp) and average micropore volume (Vµ) by t-plot.
Average pore width (4 V/A) by BET (Wp).
Average particle size (Sp).
Figure 4 demonstrates SEM images of the CNT, CNF, AC and Gr solids. It is evident from these images that the CNT consists of highly tangled tubes. 21
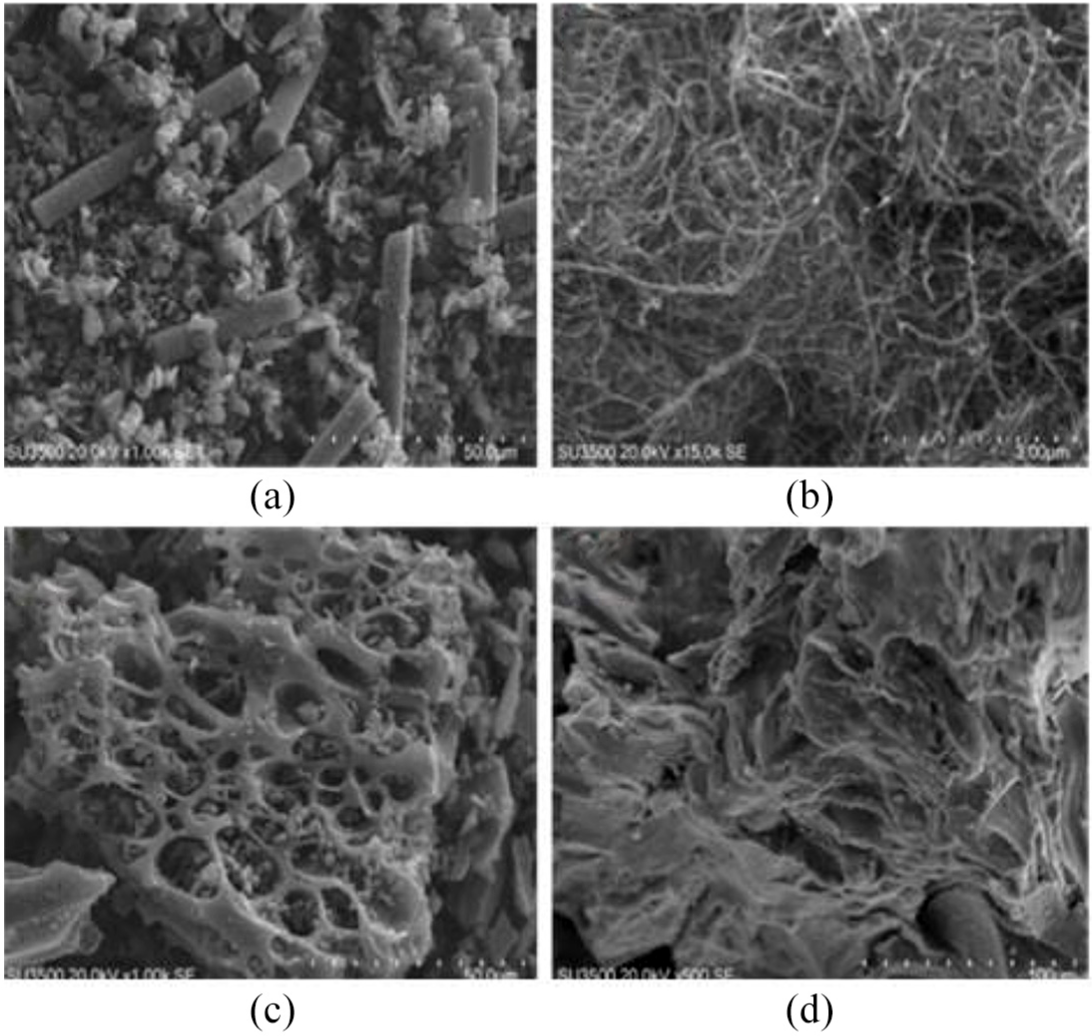
SEM images of (a) CNF, (b) CNT, (c) AC and (d) Gr.
The CNF sheets include ultrafine CNFs, which have both small-sized particulates and long tube-liked pieces. 26 Gr is like thin sheets aggregated in some parts with edges and wrinkled surfaces and folding. 27 SEM image of AC is considered as cavities and pores, and it has rough surface areas. 28
Catalytic oxidation of toluene
The experiments have been performed on carbon-supported Pt catalysts. The catalysts activities were assessed by oxidation performance of pure toluene over prepared catalysts between 200°C and 500°C. Figure 5 shows the toluene (Tu) conversion and selectivity to CO and CO2 over different catalysts. The formation of CO is undesirable, and the origin of producing CO is because of the partial combustion of toluene. For all of the catalysts, with increasing the temperature from 200°C to 500°C, Tu conversion reaches its maximum level at a higher temperature. At temperatures under 300°C, toluene conversions for each catalyst are less than 50%, which means catalytic oxidation of pure toluene is more functional at temperatures higher than 300°C.
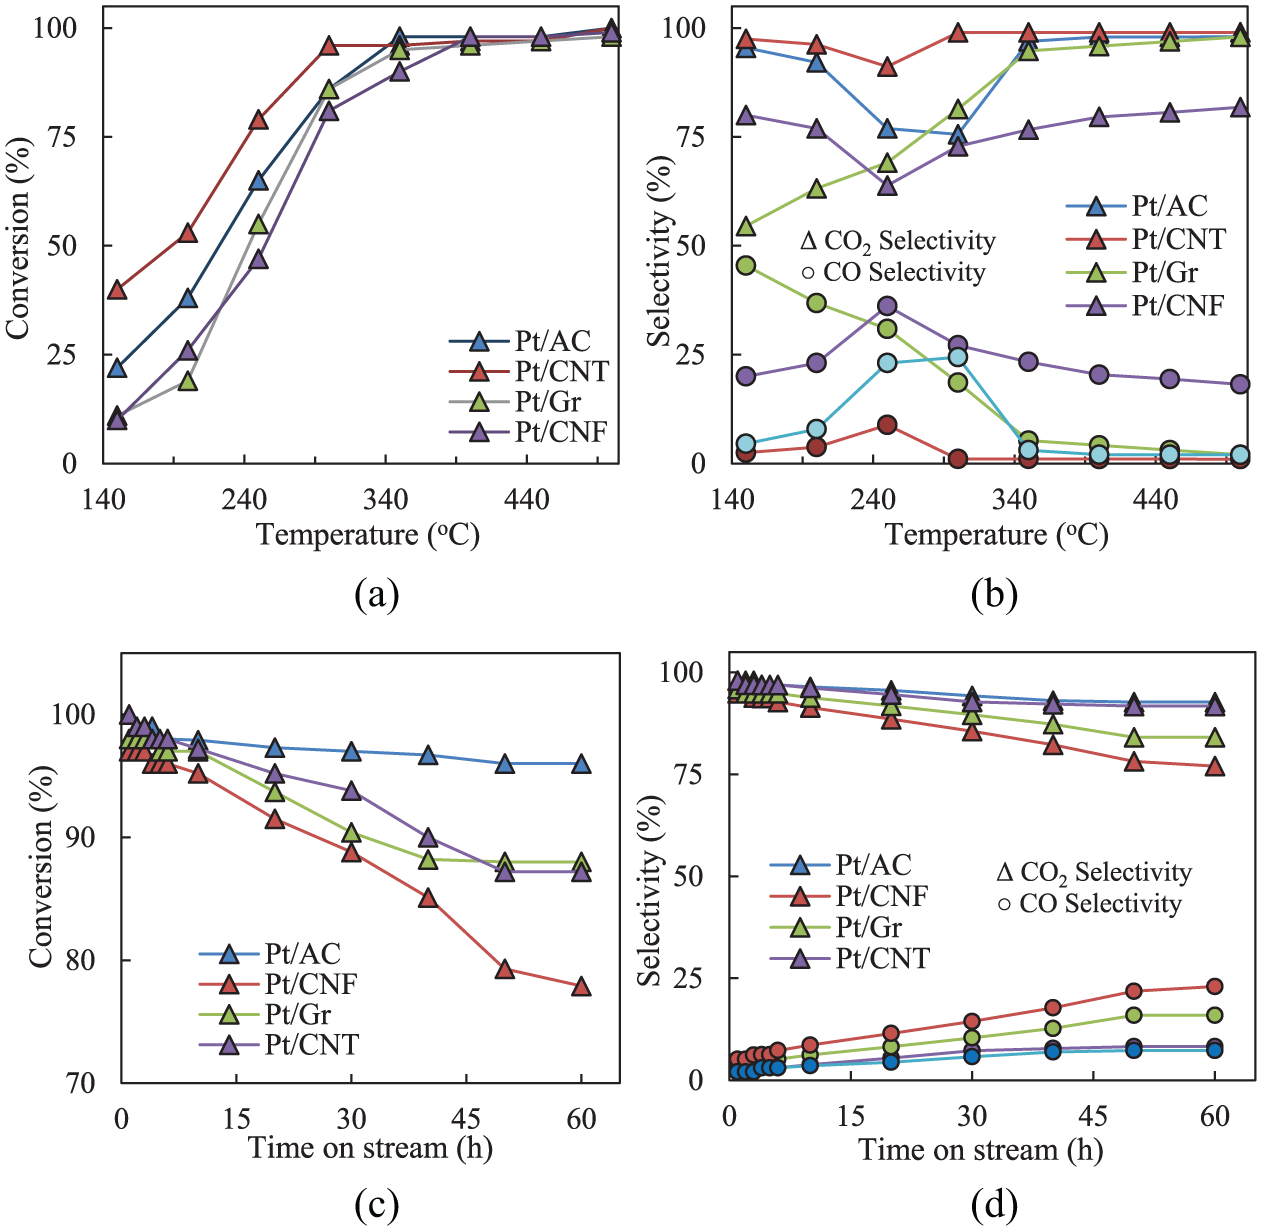
Toluene conversion and catalytic selectivity to CO2 and CO as a function of reaction temperature ((a) and (b), respectively) and as a function of time on stream ((c) and (d), respectively).
The results show that the Pt-impregnated catalysts have high activity as conversion and selectivity to CO2 by increasing the temperatures. The results exhibit that for all catalysts, CO2, H2O and CO are the major products for total oxidation of toluene. The maximum Tu conversion is 100% achieved on the catalysts Pt/AC and Pt/CNT at 500°C. In addition, these catalysts exhibit better selectivity to CO2 and lower selectivity to the undesirable product as CO than others. Pt/Gr also shows high selectivity to CO2. The oxidation stability of carbonaceous catalysts was also investigated. The stability test is crucial because carbon-based catalysts could be burned-off in the air. The stability of prepared catalysts in oxidation reaction was determined at 350°C for 60 h. As shown in Figure 5, results indicate that the Pt/CNT catalyst has excellent stability in the oxidation of toluene at 350°C. CO2 selectivity and toluene conversion decreased lightly after 60 h. Since the catalysts start to deactivate at a higher time, the increase in residence time decreases CO2 selectivity. Wu et al. 29 have studied the catalytic oxidation of benzene–toluene–xylene (BTX) on the surface of Pt/AC. They have proposed that hydrocarbons can be adsorbed either on Pt or AC, but they are mostly adsorbed on AC because they have a much larger surface area than Pt nanoparticles. 30
During the oxidation process, the Pt surface is covered by oxygen. The oxidation reaction happens to activated sites of Pt, which leads to oxidation of Pt and the creation of Pt–O. Then Pt–O reduces by oxidized hydrocarbon on Pt–O-active sites. Thus, the activities of the catalysts can be affected by hydrocarbons during the oxidation reaction. 1
According to the N2 adsorption–desorption results (Table 1), the highest pore size is related to CNT, which could be the reason for the maximum selectivity to CO2 in the catalytic oxidation of toluene. After this catalyst, AC, Gr and CNF have the highest pore size and highest selectivity, respectively. Consequently, it can be decided that the selectivity to CO2 can be increased with increasing the pore size. The molecular size of toluene is 0.59 nm. So, it can easily penetrate the mesopores and micropores. The high surface area is related to the CNT and the most amount of conversion is dedicated to CNT, which probably means the catalytic activity of CNT is affected by pore sizes and surface areas. The lowest conversion to CO2 is related to CNF catalyst, and it is not only because of the small pore size but also the smallest surface area of CNF.
Kinetic study
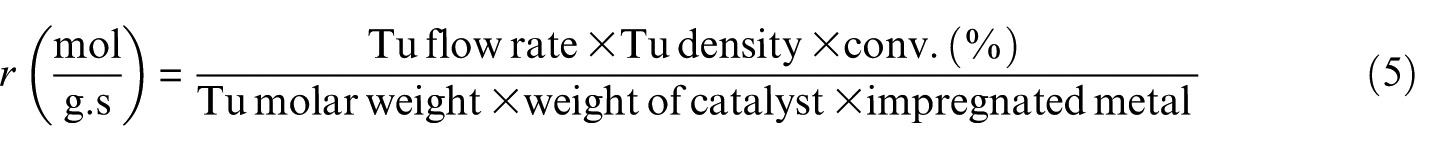
In the kinetic study of catalytic oxidation of toluene, the results were obtained over different mixtures of toluene and O2 partial pressures with regard to finding the orders of the oxidation reaction. Table 2 and Figure 6 show the rate–temperatures measurements of the reaction. First, in order to calculate the exponents of toluene and O2 in this reaction, the PL model was applied. Figure 6(c) indicates the calculated rate of reaction versus experimental rate values with a correlation coefficient (R2) of 1.0. The PL model in this reaction, which is formed on the partial pressure of toluene

where r is the reaction rate (mol g−1 s−1), and n and m are the rate exponents of reaction, and

where
The activation energies (49.64–108.48 kJ mol−1) obtained from the Tu oxidation for the prepared catalysts (Table 2) are lower than what were reported for other catalysts. 23
Kinetic parameters for toluene oxidation.
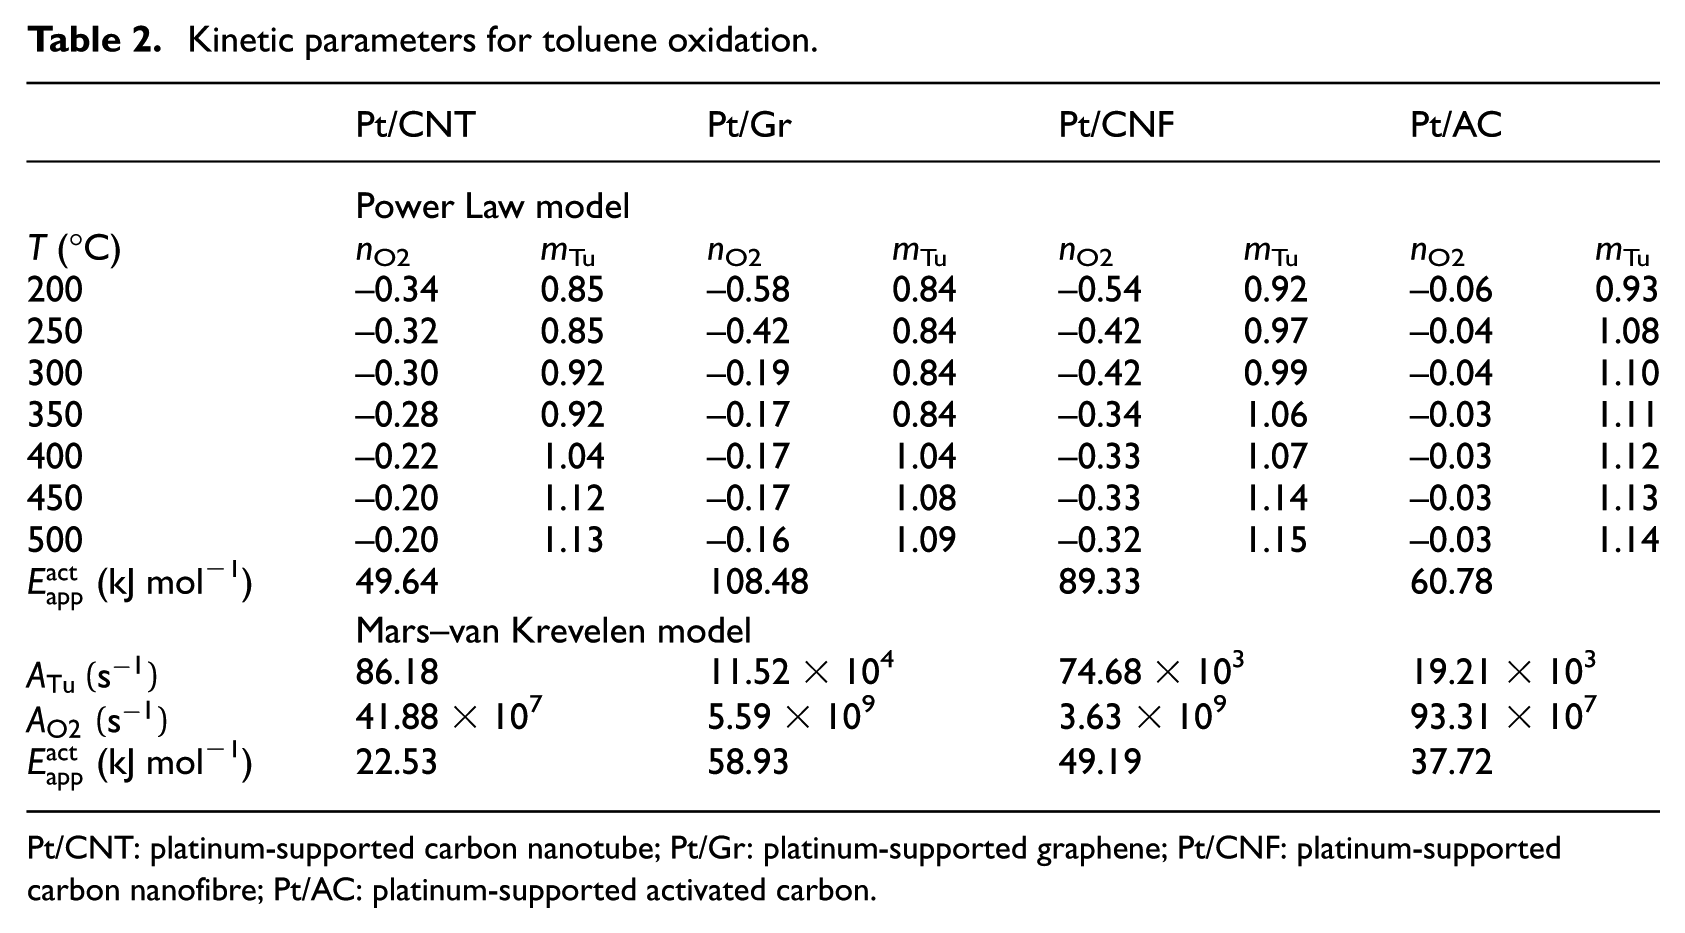
Pt/CNT: platinum-supported carbon nanotube; Pt/Gr: platinum-supported graphene; Pt/CNF: platinum-supported carbon nanofibre; Pt/AC: platinum-supported activated carbon.
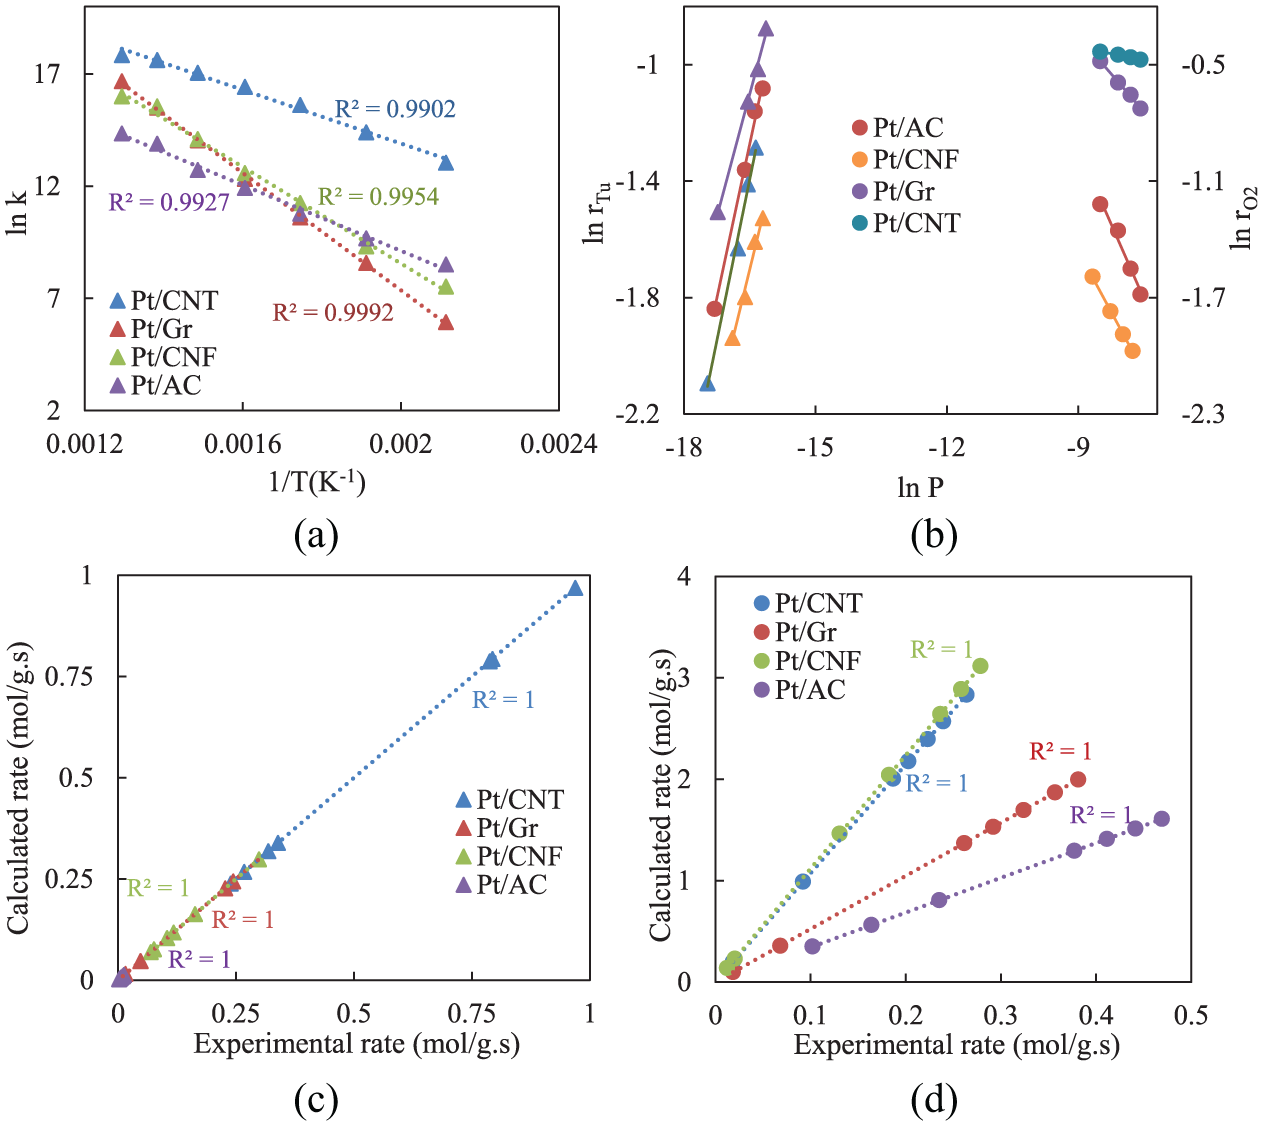
(a) Arrhenius plots, (b) double-log plots of the reaction rates versus the partial pressures of toluene and O2 at a selected temperature (350°C), estimated data by (c) Power Law model and (d) Mars–van Krevelen model.
In order to calculate activation energies, apparent rate constants for each catalyst were fitted into the Arrhenius equation (equation (4)) and Figure 6(a). As shown in Figure 6(b), the reaction rates versus the partial pressures of toluene and O2 at 350°C indicate strong adsorption between toluene and surfaces of the catalysts and also the inhibitory effect of oxygen (positive and negative exponents, respectively). Table 2 shows the parameters of the PL model, including reaction orders. The results display that as the O2 pressure increases, the reaction rate will decrease.
In addition, the MvK model
25
was also investigated to study the kinetics of toluene oxidation precisely. The calculated values of MvK model are summarized in Table 2. The presentation of this kinetic model is based on the partial pressure of O2 and Tu

In this equation,

The evaluated results with MvK model attained lower activation energies compared to the PL model. Table 2 shows that the pre-exponential factor of O2 adsorption
Furthermore, fitting the data in the relevant equation gave the regression coefficient of 1.0. Since the PL model is a simple statistical model versus numerical adjustment and does not consider the adsorption of molecules on catalytic surfaces, its result is unreliable. Accordingly, to better estimate, it sounds that the MvK model can better predict the behaviour of catalytic oxidation reaction of toluene over the prepared catalysts in kinetics study


where P is the pressure; V is the volume; n is the amount of substance; R is universal gas constant and T is the temperature.
Conclusion
Catalytic oxidation of toluene as a VOC was evaluated over four porous carbonaceous supported catalysts, including CNT, CNF, AC and Gr. The results show that the performance of the Pt catalyst containing CNT displays the best catalytic properties to oxidize toluene and turn it into CO2. For all of the catalysts, the complete catalytic oxidation for toluene illustrates good results at low temperatures. But Pt/CNT exhibits high selectivity to CO2 of almost 99% and noticeably high conversion of more than 96% at the temperature of 350°C. The stability of the catalysts was also determined for 60 h at 350°C. All of the catalysts show excellent stabilities and remained intact after 60 h of reaction; only AC was burned off due to its low thermal resistance. In kinetics study, two used models show concurrence of MvK mechanism with the obtained experimental data. The final results demonstrate that porous carbonaceous supports can be used for the treatment of VOCs pollution.
Footnotes
Acknowledgements
The authors thank the Iran National Science Foundation and also the Research Centre of Chemistry and Petroleum Sciences of Shahid Beheshti University for supporting this study.
Declaration of conflicting interests
The author(s) declared no potential conflicts of interest with respect to the research, authorship and/or publication of this article.
Funding
The author(s) received no financial support for the research, authorship and/or publication of this article.