
Abstract
Interpreting complex flows, which may include transient features, non-linearity, and high dimensionality, is challenging because averages may not represent any individual flow field. This work evaluates the variability of dimensionally-reduced flow field data measured using Particle Image Velocimetry (PIV) compared to an ensemble mean, using several novel vector comparison metrics, namely; Weighted Relevance Index (WRI), Weighted Magnitude Index (WMI), and a modified Combined Magnitude and Relevance Index (modified-CMRI). Three dimensionality-reduction techniques were assessed, Proper Orthogonal Decomposition (POD), Dynamic Mode Decomposition (DMD) and Sparsity-Promoting DMD (SPDMD) using the proposed metrics. The PIV data were collected using an optically accessible single-cylinder engine under motored conditions at two crank-angle degrees (CAD), 460 CAD (maximum inlet valve lift) and 700 CAD (a typical spark-timing angle). The results show that the 0 Hz SPDMD mode preserves the vector magnitude and alignment and thereby better captures intake jet dynamics, aligning more closely with individual snapshots than ensemble averaging. Furthermore, the metrics consistently identify discrepant snapshots in both datasets when compared to the 0 Hz SPDMD mode, outperforming the traditional ensemble mean approach. These findings underscore the utility of the proposed vector comparison metrics in evaluating dimensionality reduction techniques and their potential to enhance the analysis of complex flow fields, ultimately aiding in the identification of cycle-to-cycle variations (CCVs) in large in-cylinder flow datasets. Taken together, the use of SPDMD to extract a physically representative reference flow field and the modified-CMRI to quantify deviations from individual cycles, provides a unified framework for analyzing in-cylinder highly variable flows.
Keywords
Introduction
Understanding in-cylinder flows in internal combustion (IC) engines, is essential for optimizing combustion efficiency and reducing emissions.1,2 However, these flows exhibit high dimensionality and pronounced cycle-to-cycle variations (CCVs), driven largely by the intake jet turbulent dynamics. 3 CCVs are most pronounced in the presence of a high-momentum intake jet, where jet-flapping 4 and speed or velocity magnitude variations 3 play a decisive role in determining the initial large-scale tumble motion. Moreover, at the late compression stage near spark timing, the flow field undergoes strong tumble breakdown, and the variations in alignment of local velocity vectors govern flame kernel survival and subsequent combustion stability. 5 Accurately capturing such variability remains a persistent challenge, since traditional methods like ensemble averaging often obscures the dominant physical mechanisms.
Ensemble averaged flow fields are often used to represent the general behavior in a collection of flow fields and to compare one dataset to other. However, ensemble averaging can mask the underlying variability present in the data, particularly diminishing the resultant vector magnitudes in regions of high variability. 6 This can lead to a misrepresentation of the flow field and its associated physical phenomena, especially when considering ensemble averaged flow field as a validation target for numerical simulations. 4 Thus, there is a need for more robust methods to analyze and extract representative flow fields from high-dimensional and variable datasets. Recently, data-driven dimensionality reduction techniques have gained traction in the analysis of complex flow fields. These methods, including dynamic mode decomposition (DMD) 7 and its sparsity-promoting variants (SPDMD), 8 offer powerful tools for extracting coherent structures from high-dimensional datasets. This is especially useful in engine research studies, as they provide significant insight into the underlying physical mechanisms by identifying dominant flow features and their temporal dynamics. Dimensionality reduction techniques can identify these features, providing insight into the underlying physical mechanisms, especially in engine research. 9 However, the performance of these methods in capturing CCVs remains inadequately quantified. This gap hinders their adoption for diagnostics or control purposes in real-world engine applications.
Previous attempts to evaluate the performance of dimensionality-reduced flow fields have utilized field-wise and point-wise comparison methods such as the Relevance Index (RI), 9 Magnitude Similarity Index (MSI), 10 and their local variants, Local Magnitude Index (LMI) and Local Structure Index (LSI). These methods, while useful, are often shown to be sensitive to low-velocity flow fields, such as in-cylinder tumble motion in IC engines. Improved version of these metrics, such as Weighted Magnitude Index (WMI) and Weighted Relevance Index (WRI), as well as the Combined Magnitude and Relevance Index (CMRI) have subsequently been developed and have shown improvements in these low-velocity regions. 11
However, existing metrics for evaluating dimensionality reduction techniques often focus on reconstruction error rather than physical fidelity to transient phenomena such as CCVs. 12 Few studies address how well these techniques preserve alignment and magnitude variability across individual cycles especially for highly dynamic phenomena such as intake jet flows, which have been shown to be directly linked to CCVs. As a result, a modified-CMRI metric has been proposed, combining WMI and WRI such that both indices contribute equally to the overall variability in the flow field. 13 This study provides the first comprehensive comparison of dimensionality reduction methods, specifically POD, DMD and SPDMD, using single field metrics, including WMI, WRI, and modified-CMRI, in capturing flow field variations. Using experimental PIV data, this study demonstrates that these metrics can be used to quantitatively compare dimensionality-reduced flows to ensemble mean and individual snapshots, enabling a more nuanced extraction of representative flow fields. As such, this work proposes a unified approach for analysis of CCVs using a physically representative flow field extracted using dimensionality reduction techniques and novel vector comparison metrics.
Methodology
Experimental setup
Particle image velocimetry (PIV) data was sourced from an optically accessible single-cylinder engine at TU Darmstadt (TUD).
14
Measurements were collected by imaging the Mie scattering of
Engine operating conditions and parameters. 14
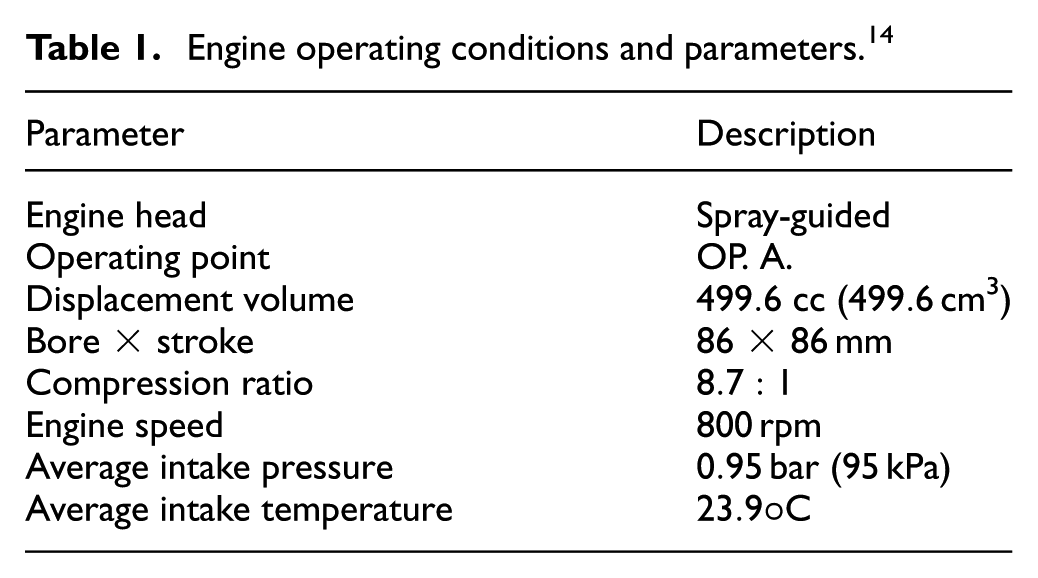
The PIV dataset consists of 250 consecutive cycle snapshots captured on the valve plane, 19 mm offset from the cylinder center to align with the intake valves. Measurements were taken every five crank angle degrees (CAD) between 360 and 720 CAD, corresponding to the start of the intake and power strokes respectively. This study focuses on two fixed crank angles, 470 and 700 CAD. At 470 CAD, the intake valves reach peak lift, where the intake jet is fully developed and represents a key physical phenomenon in the development of the in-cylinder turbulence structure and air-fuel mixing. About 700 CAD is chosen as being immediately prior to a typical spark timing point, where the in-cylinder flow field has a significant impact on initial flame kernel development and where CCVs are known to influence combustion stability.
9
The inter-cycle imaging interval was
Numerical methods
This study employs the following dimensionality reduction techniques: Proper Orthogonal Decomposition (POD), Dynamic Mode Decomposition (DMD), and Sparsity-Promoting Dynamic Mode Decomposition (SPDMD), to extract representative flow fields from the PIV dataset. The mathematical formulations of these methods are briefly outlined below.
Proper orthogonal decomposition
Phase-dependent Proper Orthogonal Decomposition (POD) analysis 16 is used since the snapshot dataset is collected periodically at a specific crank angle. Briefly, POD is a widely used technique that determines a set of orthonormal basis functions that best represent the flow field in a least-squares sense.17,18 It is then established that these basis functions are optimal in the sense of minimizing the mean square error between the original flow field and its approximation using a finite number of modes. As such, POD returns a set of new orthonormal variables that best capture the variance in the dataset. For more details on the mathematical formulation of POD, refer to the work of Brunton and Kutz. 19
In this study, we first begin with a rectangular data matrix (

where,
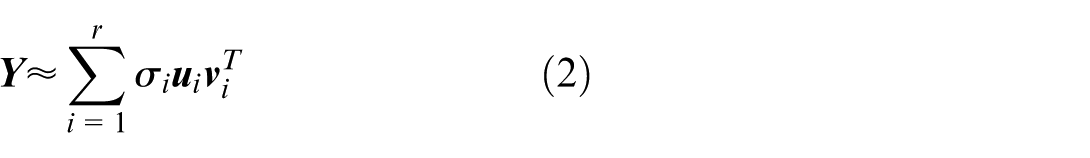
where,
DMD and SPDMD
In this study, dynamic mode decomposition (DMD) and sparsity-promoting dynamic mode decomposition (SPDMD) are employed to extract coherent spatio-temporal features from PIV dataset. For detailed information on DMD and SPDMD formulations, please refer to the work of Schmid 7 and Jovanović et al. 8 Briefly, DMD decomposes the flow field into a set of spatial modes and their corresponding temporal dynamics, allowing for the identification of dominant structures in the flow. DMD assumes a locally linear, discrete-time dynamical system:

where,
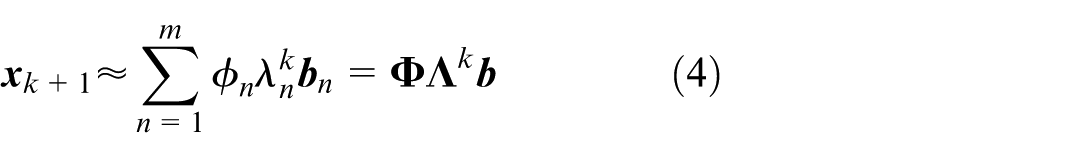
where, leading spatial mode are represented by
Definition of mode amplitudes in DMD assumes that the flow field evolves linearly in time starting from the initial conditions. 8 However, in case of highly non-linear flows and phase-dependent datasets, this assumption may not hold true. 22 Moreover, outlier flow structures and anomalous measurements can cause high decay rates and large mode amplitudes due to their time-local nature, leading to inaccurate representation and identification of the physically prominent flow structures. As such, an alternative definition of mode amplitude is sought. Jovanović et al. 8 proposed an alternative definition of mode amplitudes based on including a sparsity promoting term, which allows for the selection of only the most relevant modes. This definition is cast as an optimization problem, where the objective is to minimize the data reconstruction error while retaining as few DMD modes as possible,
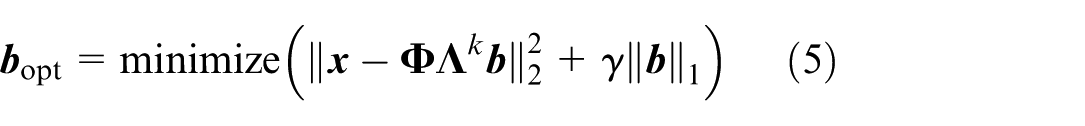
where, the first term represents the data reconstruction error, and the second term is the sparsity promoting term represented by the
This study utilizes phase-dependent SPDMD to extract average (0 Hz) flow structure which preserve the magnitude and vector alignment of the overall PIV dataset. As such, this SPDMD 0 Hz mode is treated as a physically representative reference flow field against which cycle-to-cycle variations are quantitatively assessed. For this, firstly the standard DMD is applied to the PIV dataset following the method of Kutz et al.
22
In this, given PIV data is arranged into a 2D matrix, where each column represents a snapshot of the flow field (
Quantitative metrics
The analysis of the flow field data was performed using a combination of novel vector comparison metrics, including the Weighted Magnitude Index (WMI), Weighted Relevance Index (WRI), and the modified Combined Magnitude and Relevance Index (modified-CMRI). For further details on their formulation and application, please refer to the work of Nowruzi et al. 13 In brief, WMI quantified the magnitude of velocity vector variability, while the WRI evaluated the variability in alignment. The modified-CMRI combined both indices equally to provide a comprehensive assessment of the combined influence of both the magnitude and alignment of velocity vectors. Since one-by-one qualitative comparison of the flow fields was not feasible, ensemble versions of these metrics were utilized to assess the performance of the dimensionality reduction methods. The ensemble versions of the metrics are defined as follows:

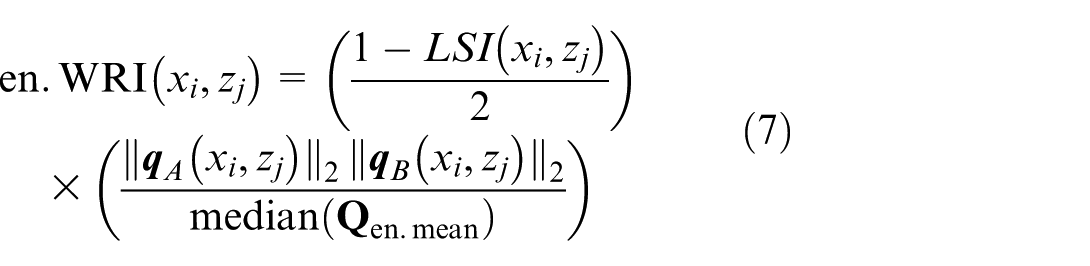
When combined with a representative reference flow field, these metrics enable a consistent quantification of CCVs by capturing deviations in both speed and vector alignment across individual cycles. To assess the performance of the proposed dimensionality reduction techniques, the two ‘worst’ cycles at 470 CAD, cycles 99 and 216 as identified by Nowruzi et al., 13 are selected as a benchmark for comparison. These two cycles are seen as the ’worst’ because they feature significantly higher instantaneous speeds as well as alignment variations, 13 which makes them suitable indicators for assessing the performance of each dimensionality reduction method. The aim for a representative flow field, extracted from the dimensionality reduction methods, is to then consistently identify these cycles as outliers using the proposed quantitative metrics. Cycles 99 and 216 are thus selected as representative instances of strongly deviating realizations to illustrate the sensitivity of the proposed metrics. The applicability of the same framework to cycles with more moderate variability is demonstrated at 700 CAD later in the article.
Results
Flow field overview
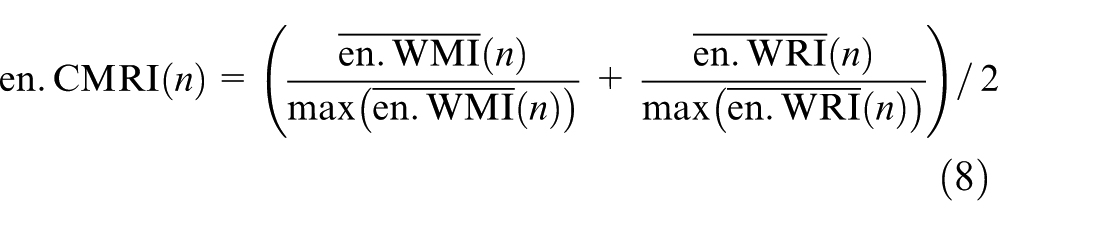
A representative flow field is one that accurately captures the underlying flow structures and their associated dynamics, while also preserving speeds and their vector alignment present in the data. This is particularly important in applications where accurate representation of the flow field is critical for understanding the underlying physical phenomena, such as in IC engines. 13 Figure 1(a) presents the ensemble mean flow field at 470 CAD, which is a common approach to represent the average behavior of the flow. However, this method can mask the underlying variability present in the data, particularly in regions with high CCVs. The ensemble mean flow field shows a significant reduction in speeds compared to an arbitrary snapshots shown in Figure 1(b) and (c). Moreover, the intake jet in both of the arbitrary snapshots extends further into the flow field. Shorter intake jet length predicted by the ensemble mean flow field is thus not representative of the actual flow behavior and points toward a variability of the intake jet length, which is averaged out by the ensemble mean.
Contours of ensemble mean (a and d) and arbitrary PIV snapshots (b, c, e, and f) at 470 (top) and 700 (bottom) CAD. Every second vector is plotted for clarity.
Similar trends are observed at 700 CAD, as shown in Figure 1(d)–(f). Particularly, at this crank angle, the flow field undergoes a strong tumble breakdown, with a strong recirculating zone present on the top right corner of the images. The differences in vector alignment in this region are noted in both arbitrary snapshots, which are not captured in the ensemble mean flow field. The discrepancies in both speeds and vector alignment between the ensemble mean and arbitrary snapshots highlight the limitations of using ensemble mean flow fields to represent the instantaneous flow behavior. It is clear that the ensemble mean flow field fails to capture the variations in instantaneous speeds and vector alignment at the conditions tested. As such, there is a need for more robust methods to analyze and extract representative flow fields from high-dimensional and variable datasets. To that end, dimensionality reduction methods, including POD, DMD, and SPDMD, are explored in this study as potential alternatives to ensemble mean flow fields.
Dimensionality reduction methods
We begin first by benchmarking POD as an alternative method to extract a representative flow field. As discussed previously, POD offers a method to extract the most dominant flow structures from the data by decomposing the flow field into a set of orthonormal modes. The hierarchy of modes is defined by their singular values, with larger singular values representing more energetic and influential modes. 12 Figure 2(a) and (d) show the first POD modes, which have the largest singular values, for both crank angles. Since singular values are proportional to the energy content of the modes, 16 the first POD mode captures the most dominant flow structure in the dataset. Figure 2(a) shows that the first POD mode captures the intake jet structure at 470 CAD, but it does not preserve the speeds observed in the arbitrary snapshots (Figure 1(b) and (c)). Similar trends are observed in case of 700 CAD, where the flow fields match those of ensemble PIV data in Figure 1(d) and the top-right corner recirculation zone is clearly observed. In both cases, the POD mode shows a significant reduction in speeds compared to the arbitrary snapshot, consistent with the ensemble mean flow field measurements. Moreover, each POD mode contains a mixture of different frequencies, 24 such that the fluctuating structures containing large energy content are grouped with the steady flow structures, resulting in a large singular values. 25 This can lead to a misrepresentation of the flow field and its associated physical phenomena, especially when considering POD modes as a validation target for high-fidelity numerical simulations. 26 As such, spatio-temporal dimensionality reduction techniques, such as DMD and SPDMD, are sought in this work.
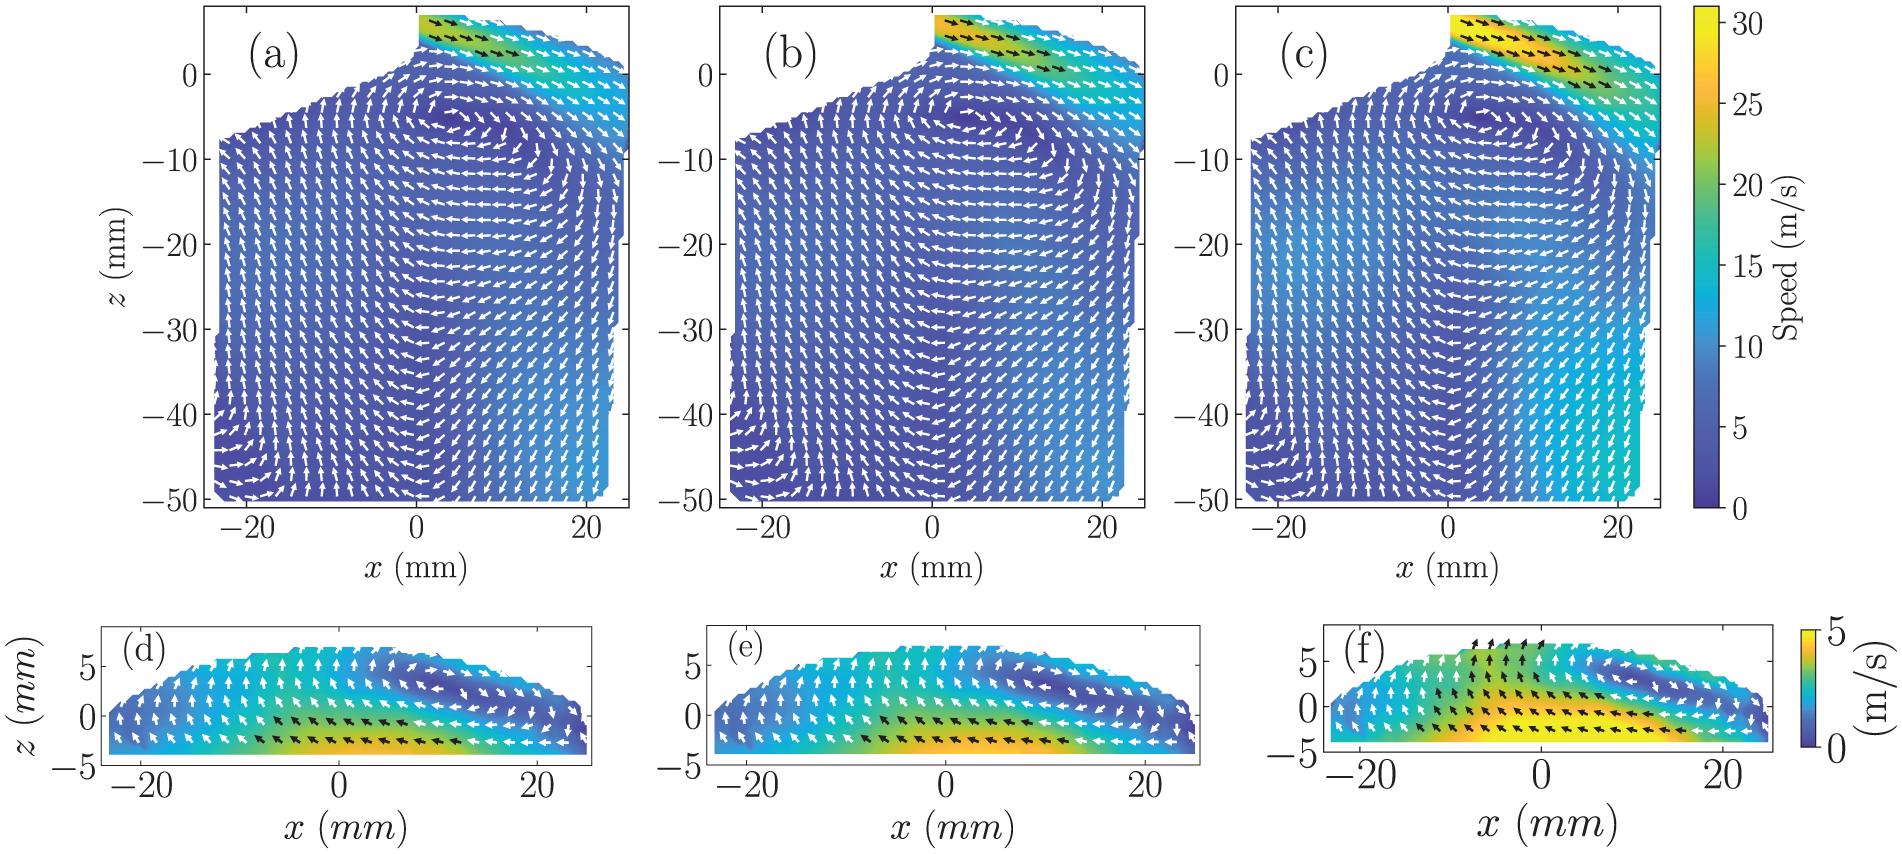
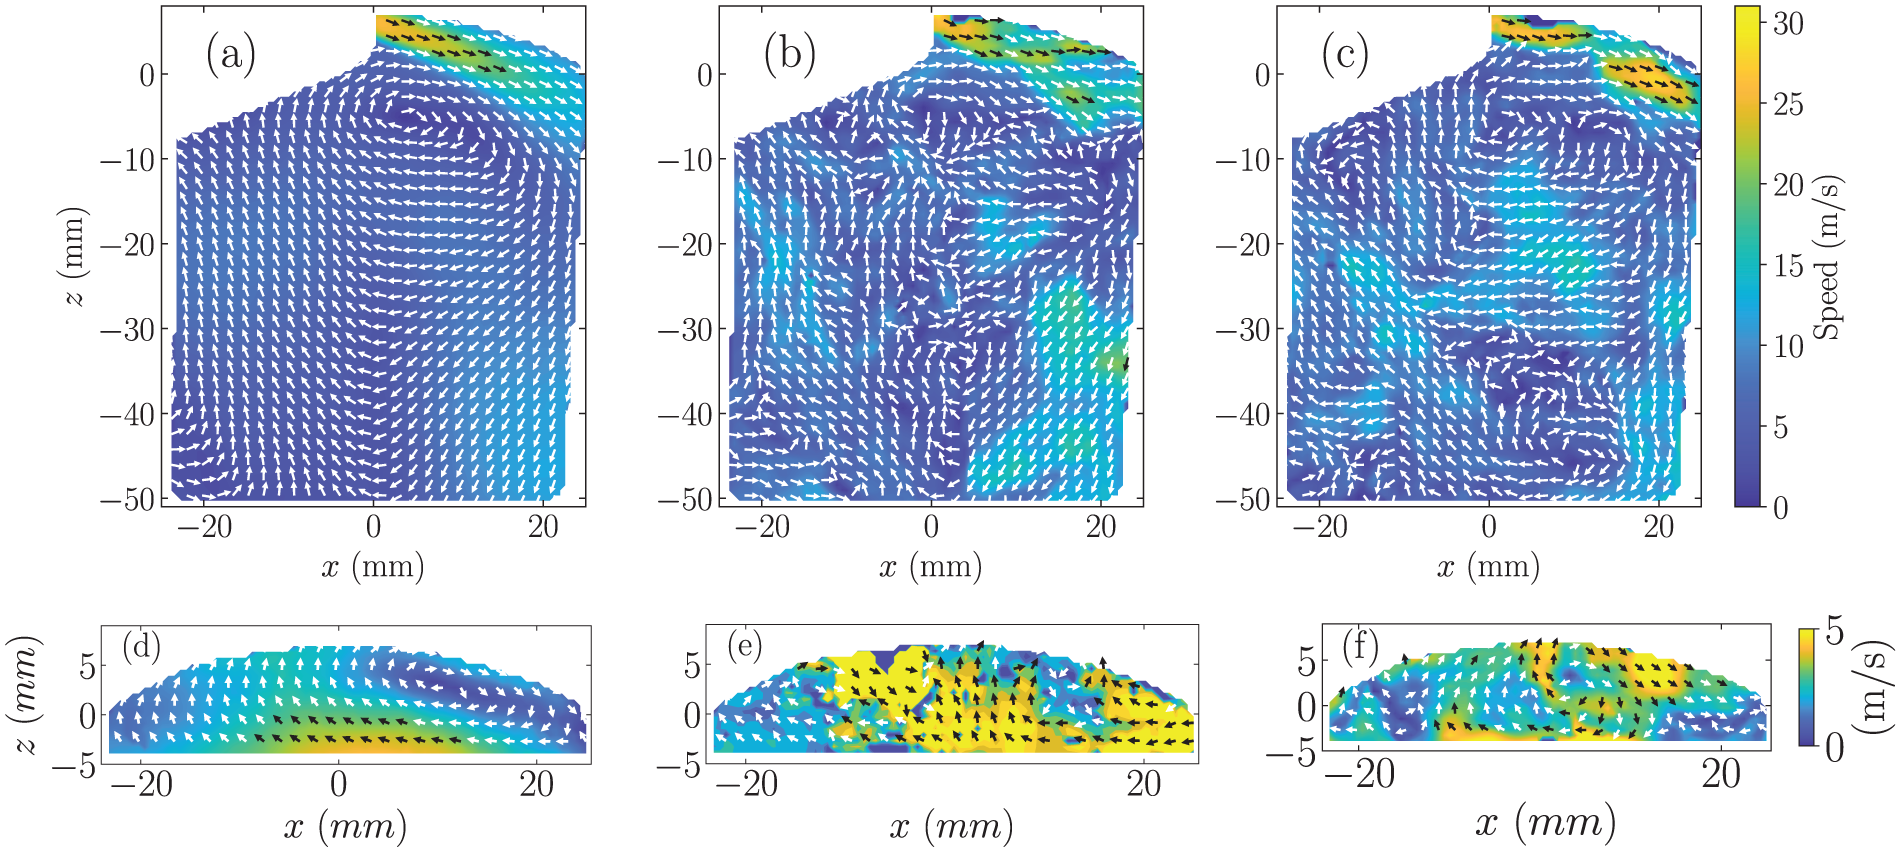
Flow fields at 470 (top) and 700 (bottom) CAD for POD Mode 1 (a and d), DMD 0 Hz mode (b and e), and SPDMD 0 Hz mode (c and f). Every second vector is plotted for clarity.
DMD modes are coherent in space and time, with one frequency associated with each mode. Moreover, the hierarchy of the DMD modes is determined by their mode amplitudes and decay rates. Thus, DMD modes with larger amplitudes and smaller decay rates are considered more stable and dominant in the flow field. However, due to the linear assumption of DMD, the mode amplitudes can be significantly affected by outliers and noise in the data. As such, the highest amplitude DMD mode is not necessarily the most stable mode in the data, rather the DMD 0 Hz mode can be more stable and coherent. For example, Figure 3 shows the DMD spectra for the first 57 modes for the 470 CAD case, where the mode amplitudes and decay rates are plotted. Truncation, or hard threshold for the retained DMD modes for analyses, is set to 57 and 189 for 470 and 700 CAD measurements, respectively, following the guidelines provided by Baker et al. 9 In Figure 3, the highest amplitude DMD modes are highlighted in red, while the background (0 Hz) mode is highlighted in green. It becomes evident from the results that the highest amplitude DMD modes do not necessarily represent the most stable modes in the flow field. In fact, the DMD 0 Hz mode with near-zero decay rate and high mode amplitude indicates that it is the most stable and dominant mode. Figure 2(b) and (e) show the DMD 0 Hz modes for 470 and 700 CAD, respectively. At 470 CAD, the DMD mode captures the intake jet structure but it does not accurately preserve the speeds observed in the arbitrary snapshot. In case of 700 CAD, the higher speeds are effectively captured. Both cases show a reduction in speeds compared to the arbitrary snapshots, similar to the ensemble mean flow field.
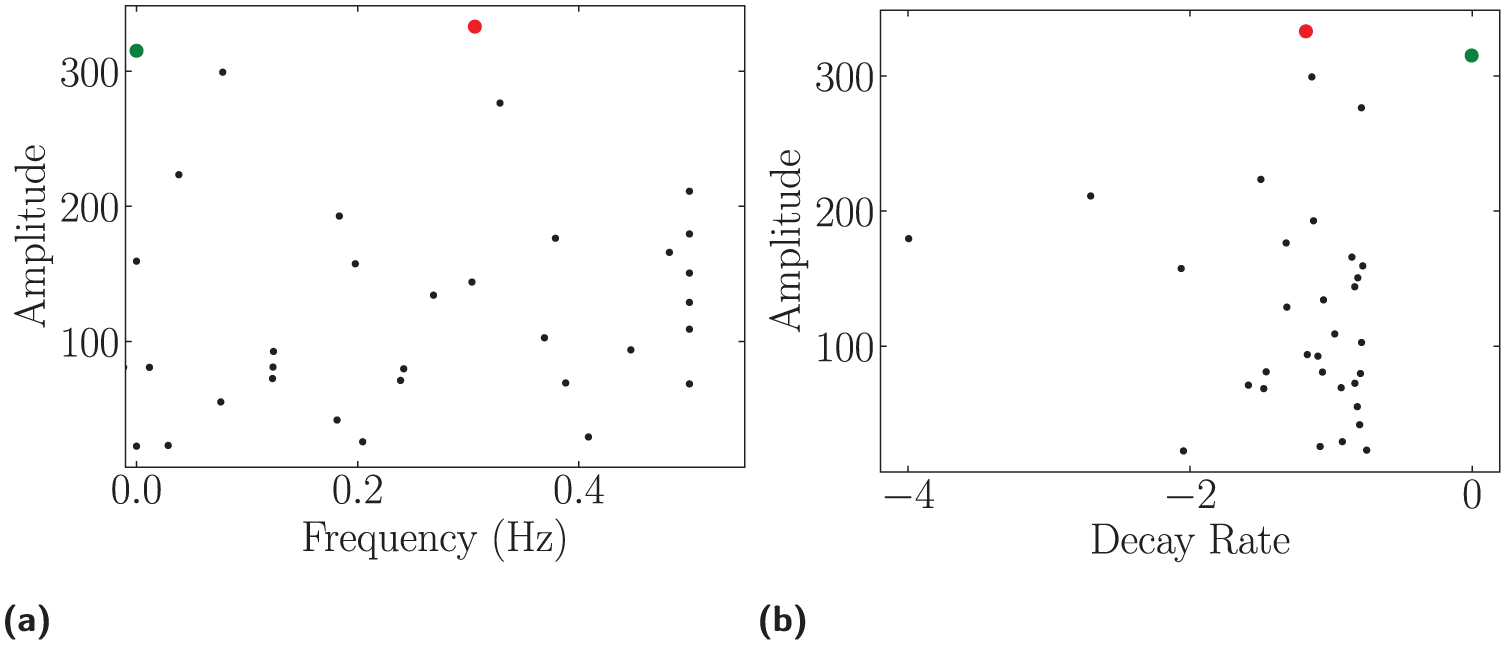
DMD spectra for 470 CAD showing mode amplitudes (a) and decay rates (b) for the first 57 DMD modes following methodology stated by Baker et al. 9 Dominant modes are highlighted in red, while the background (0 Hz) mode is highlighted in green.
Since the implementation of DMD in this study is phase-dependent, in other words the snapshots are collected periodically at a specific crank angle, the linear mapping assumption of DMD may not hold true. 22 Moreover, the DMD mode amplitudes can be significantly affected by outliers and noise in the data, leading to inaccurate representation of the flow field. As such, SPDMD is used as an alternative, in order to extract the most relevant modes from the data. SPDMD optimizes the mode amplitudes to reconstruct the original dataset with high fidelity, while minimizing the number of modes. This approach prioritizes modes that contribute most significantly to the overall dataset, removing the bias from rapidly decaying outliers. Figure 4 shows the SPDMD spectra for the first 57 modes of 470 CAD data, where the mode amplitudes and decay rates are plotted. In this instance, SPDMD 0 Hz mode, highlighted in green, presents near-zero decay rates and highest mode amplitudes, indicating that it is the most stable and dominant mode in the flow field. Similar observations are noted for 700 CAD measurements, which are omitted for brevity. Figure 2(c) shows the SPDMD 0 Hz mode for 470 CAD, which captures the intake jet structure and speeds more accurately than both the ensemble mean and DMD 0 Hz mode. Similarly, at 700 CAD, the higher speed and the location of recirculation zone off the top of upward moving piston are clearly observed in Figure 2(f). In both cases, SPDMD 0 Hz mode also shows a more realistic representation of the arbitrary PIV snapshots, indicating that it is a more suitable method for analyzing complex flow fields. This characteristic makes the SPDMD 0 Hz mode particularly well suited as a baseline flow field for CCV analysis using the vector comparison metrics.
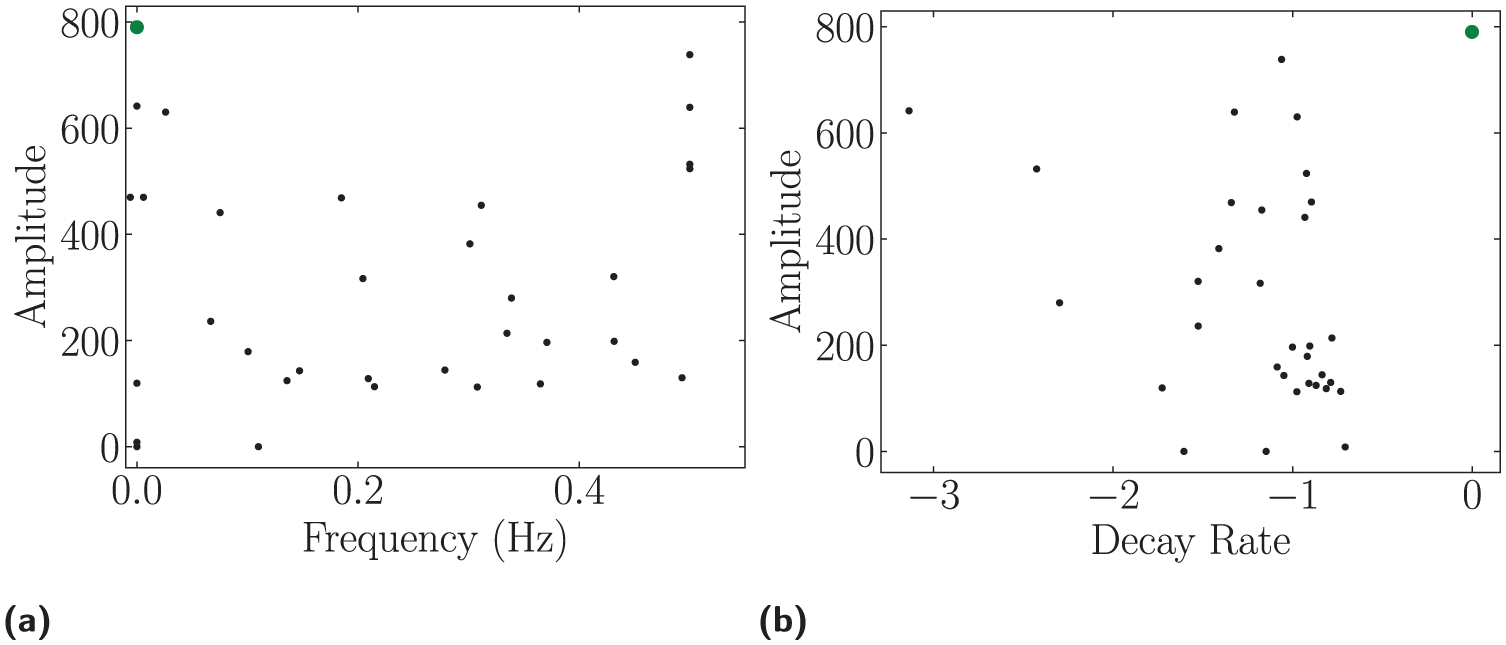
SPDMD spectra for 470 CAD showing mode amplitudes (a) and decay rates (b) for the first 57 modes following methodology stated by Baker et al. 9 The dominant modes, which are the leading background (0 Hz) modes, are highlighted in green.
Quantitative metrics comparison with a fully developed intake jet
The performance of ensemble mean and dimensionality reduction methods is further evaluated using vector comparison metrics. The two ‘worst’ cycles identified previously by Nowruzi et al.,
13
99 and 216 (highlighted in red), are selected as a benchmark for comparison. Figure 5 presents the flow fields for cycles 99 and 216 at 470 CAD – where the intake jet is fully developed. Contour lines at 4 and
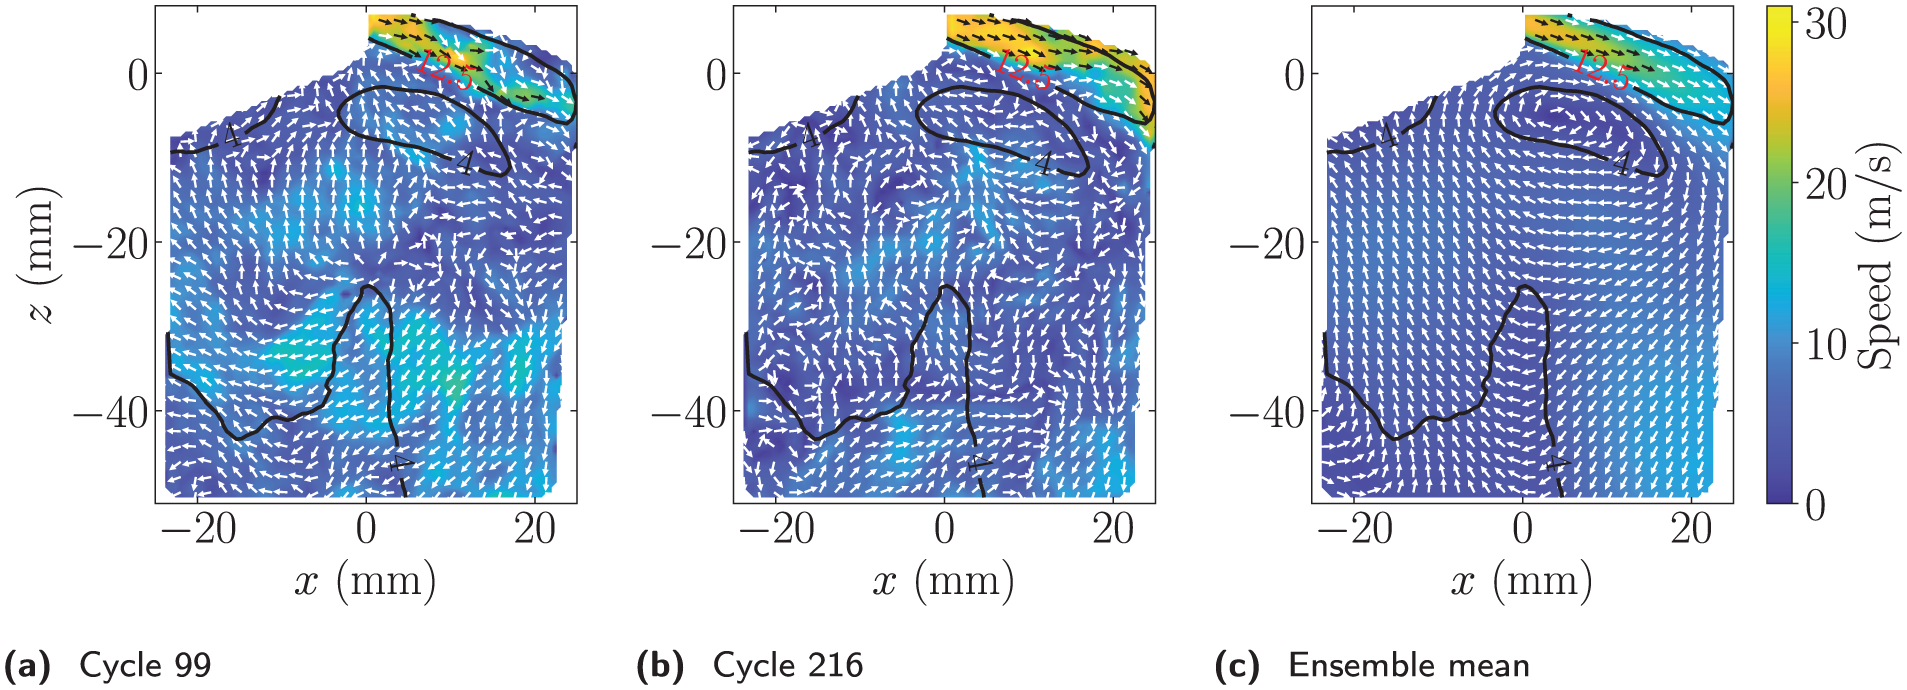
Flow fields at 470 CAD for cycle 99 (a), cycle 216 (b), and the ensemble mean (c). Every second vector is plotted for clarity. Contour lines at 4 and 12.5 m/s from the ensemble mean flow field are overlayed for reference. (a) Cycle 99, (b) cycle 216, and (c) ensemble mean.
Figure 6 shows the WMI, WRI, and modified-CMRI metrics for the ensemble mean, POD Mode 1, DMD 0 Hz mode, and SPDMD 0 Hz mode. The mean and two standard deviations of the WMI, WRI, and modified-CMRI metrics are shown as dashed red lines and solid black lines, respectively. Note that the labels along the left-hand side of Figure 6 denote the reference field used to compute the indices and do not represent physical axis quantities. The magnitude variations between individual snapshots and the evaluated methods are shown in Figure 6(a), (d), (g), and (j), respectively. Since ensemble mean, POD Mode 1 and DMD 0 Hz mode show a significant reduction in speeds, the WMI trends show significant discrepancy in capturing the two discrepant cycles. Moreover, all three methods fail to capture cycle 216 as anomalous. In contrast, the SPDMD 0 Hz mode shows a more realistic representation of the speeds, with both cycles 99 and 216 being identified as outliers. The WRI trends are shown in Figure 6(b), (e), (h), and (k), for all assessed methods. The results show that all methods capture the alignment variations in both cycles 99 and 216, mainly due to the general alignment of vectors in the intake jet region is similar across all snapshots. This further shows that the vector alignment variations are influential, but do not dominate the CCVs in in-cylinder flows. Overall, the SPDMD 0 Hz mode shows a higher magnitude of WRI for cycles 99 and 216, indicating that it is more sensitive to alignment variations compared to the ensemble mean and DMD 0 Hz mode.
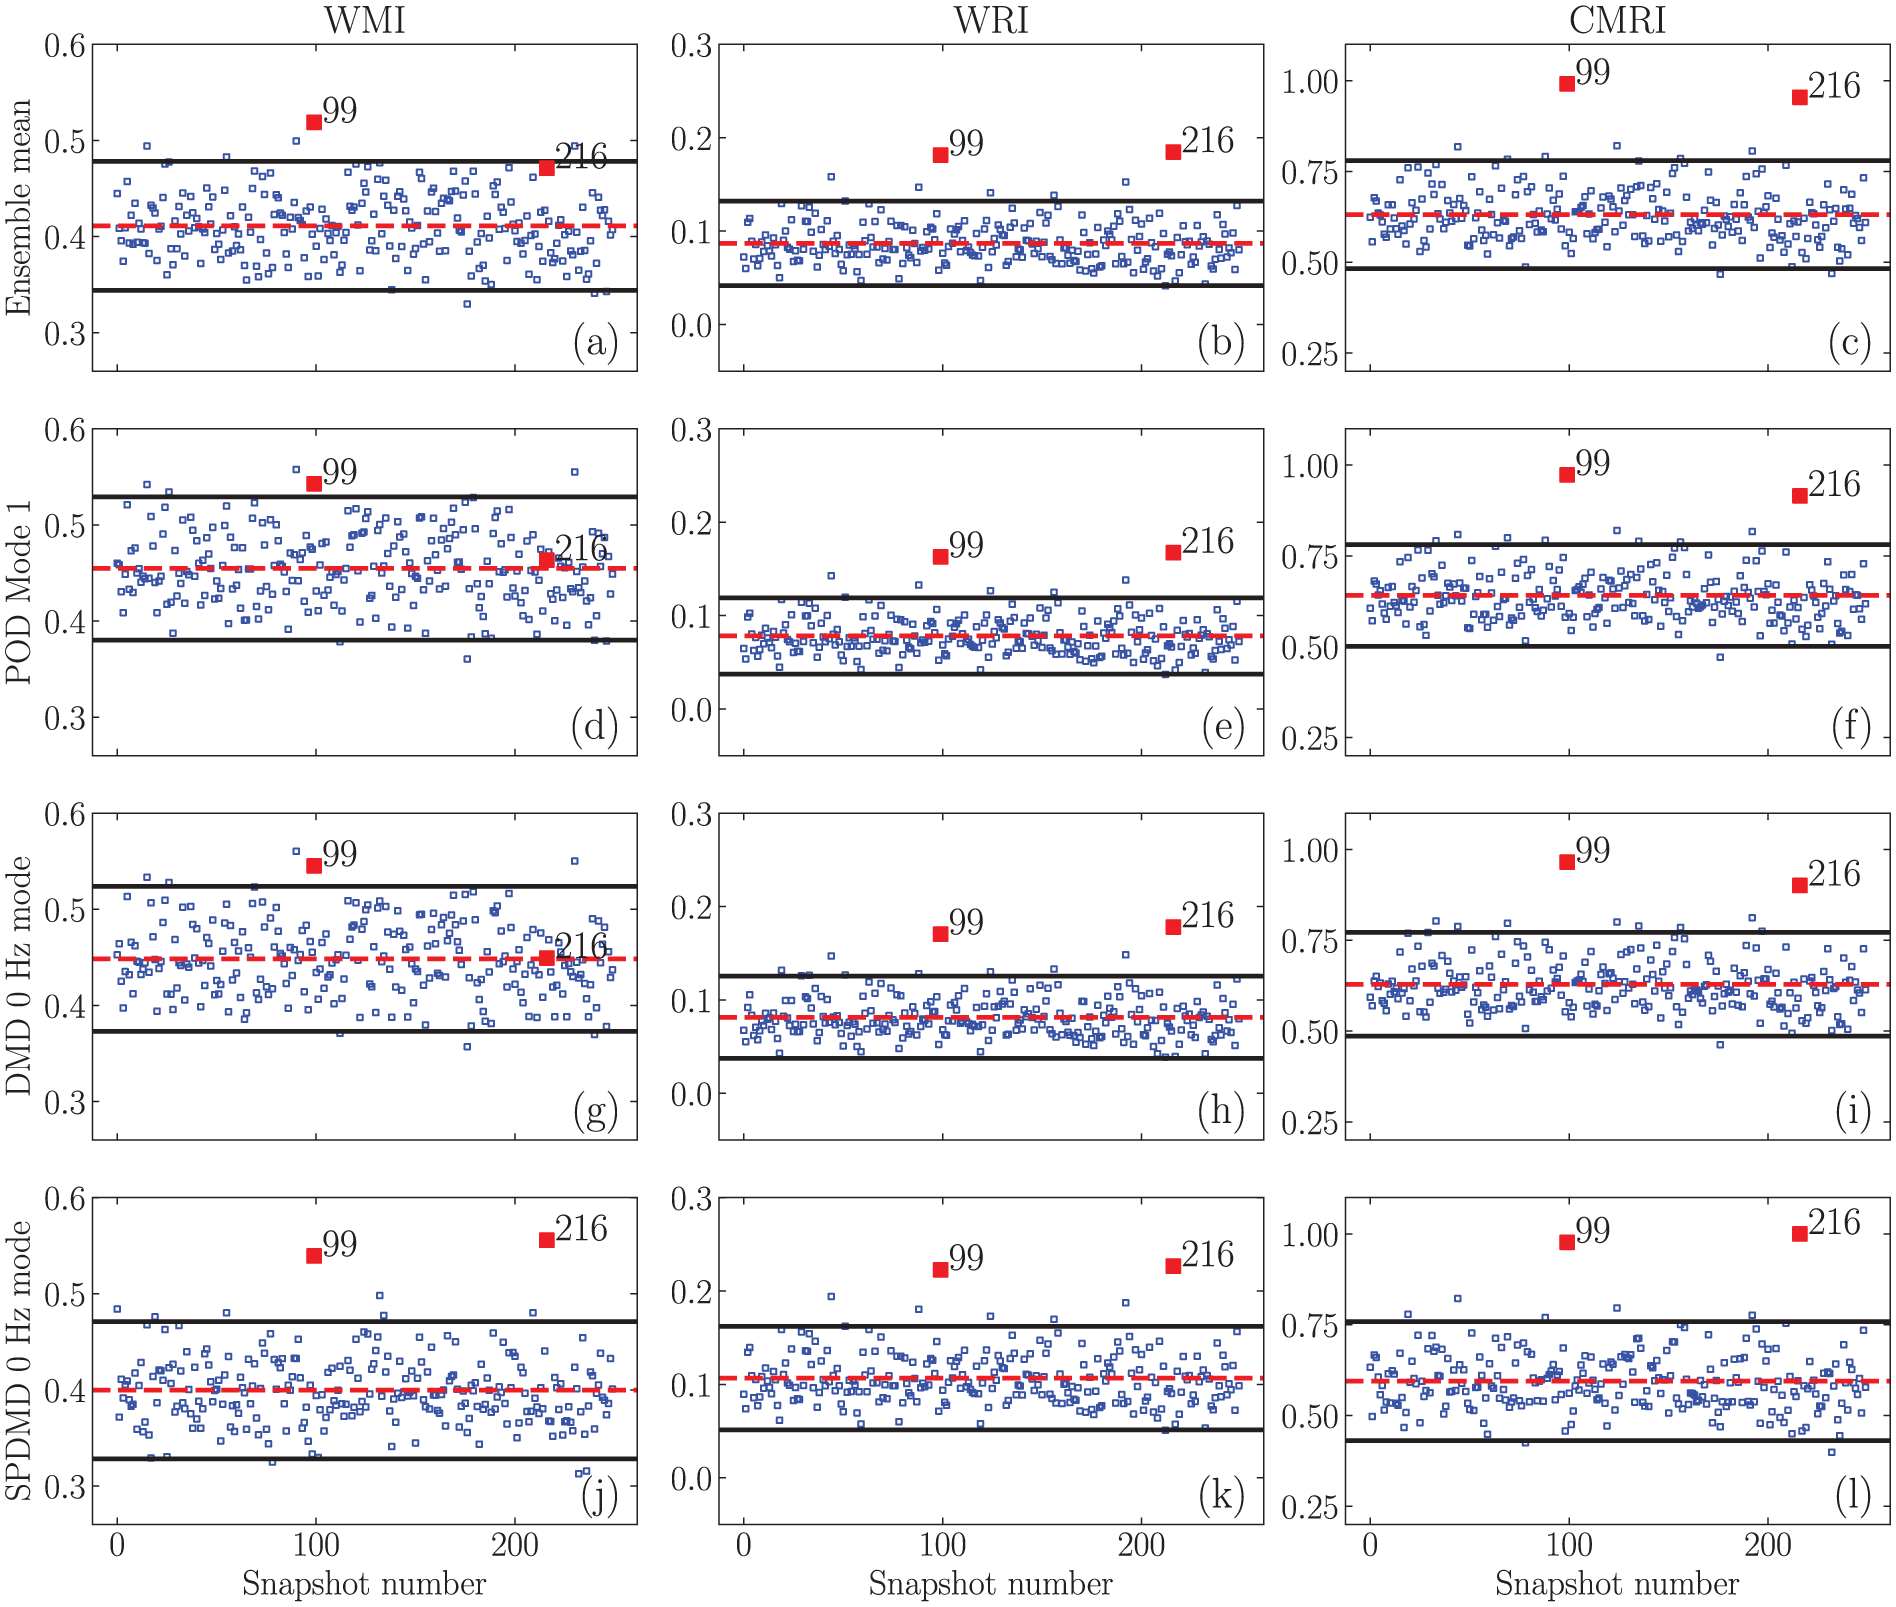
Variation of individual snapshots at 470 CAD, quantified using WMI, WRI, and CMRI. Rows correspond to the reference field used in the index evaluation, namely the ensemble-mean field (a–c), POD mode 1 (d–f), DMD 0 Hz mode (g–i), and SPDMD 0 Hz mode (j–l), while columns show WMI (a, d, g, and j), WRI (b, e, h, and k), and modified CMRI (c, f, i, and l). The solid black lines show two standard deviations from the mean, while dashed red line represent the mean. Red markers show the two ‘worst’ cycles 99 and 216 captured by Nowruzi et al. 13
The combined variation in the flow field is quantified using the modified-CMRI, which combines both the magnitude and alignment variations. Modified-CMRI trends are shown in Figure 6(c), (f), (i), and (l). Since WRI and WMI contribute equally to modified-CMRI, the trends indicate that all methods capture the overall variability in cycles 99 and 216. This is mainly attributed to all methods consistently capturing the WRI trends. Yet the modified-CMRI trends show that SPDMD 0 Hz mode is more sensitive to the overall variability in the flow field compared to the other methods. This is further evident from the results showing that the modified-CMRI trends for ensemble mean and DMD 0 Hz mode show cycle 99 to be the worst cycle, while cycle 216 is identified as the worst cycle by SPDMD 0 Hz mode consistently. These results thus indicate that the proposed vector comparison metrics provide a robust framework for evaluating the performance of dimensionality reduction methods in capturing flow field variations, and SPDMD stands out as a promising approach for analyzing such complex and variable flow fields. The findings further highlight the effectiveness of the modified-CMRI in capturing the overall variability in the flow field, making it a valuable tool for assessing highly variable and complex datasets, such as in-cylinder flow fields.
Investigations immediately before spark timing
We now use the proposed vector comparison metrics to access the in-cylinder flow field at 700 CAD – just before a typical spark timing crank angle (CA). The level of turbulence around the spark plug can have a significant effect on the combustion process, from flame kernel initiation to mixture combustion and flame propagation, and has been shown to affect CCVs.5,27 Figure 7 shows the WMI, WRI, and modified-CMRI metrics for the SPDMD Hz mode. The mean and two standard deviations of the WMI, WRI, and modified-CMRI metrics are shown as dashed red lines and solid black lines, respectively. The modified-CMRI trends in Figure 7(c) identify cycles 130, 201, and 228 as the anomalous cycles, indicating that these cycles exhibit significantly higher overall variations compared to the mean flow field. Since modified-CMRI combines both magnitude and alignment variations equally, the WMI and WRI trends are further analyzed to understand the underlying causes of variability in these cycles. The WMI trends in Figure 7(a) show that cycles 130 and 201 exhibit significantly higher magnitude variations compared to the mean flow field, indicating that these cycles have higher instantaneous speeds. On the other hand, the WRI trends in Figure 7(b) show that cycles 130 and 228 exhibit significantly higher alignment variations compared to the mean flow field, indicating that this cycle has more pronounced changes in vector alignment. Finally, the combined influence of both magnitude and alignment variations results in cycle 201 being identified as anomalous in modified-CMRI trends.
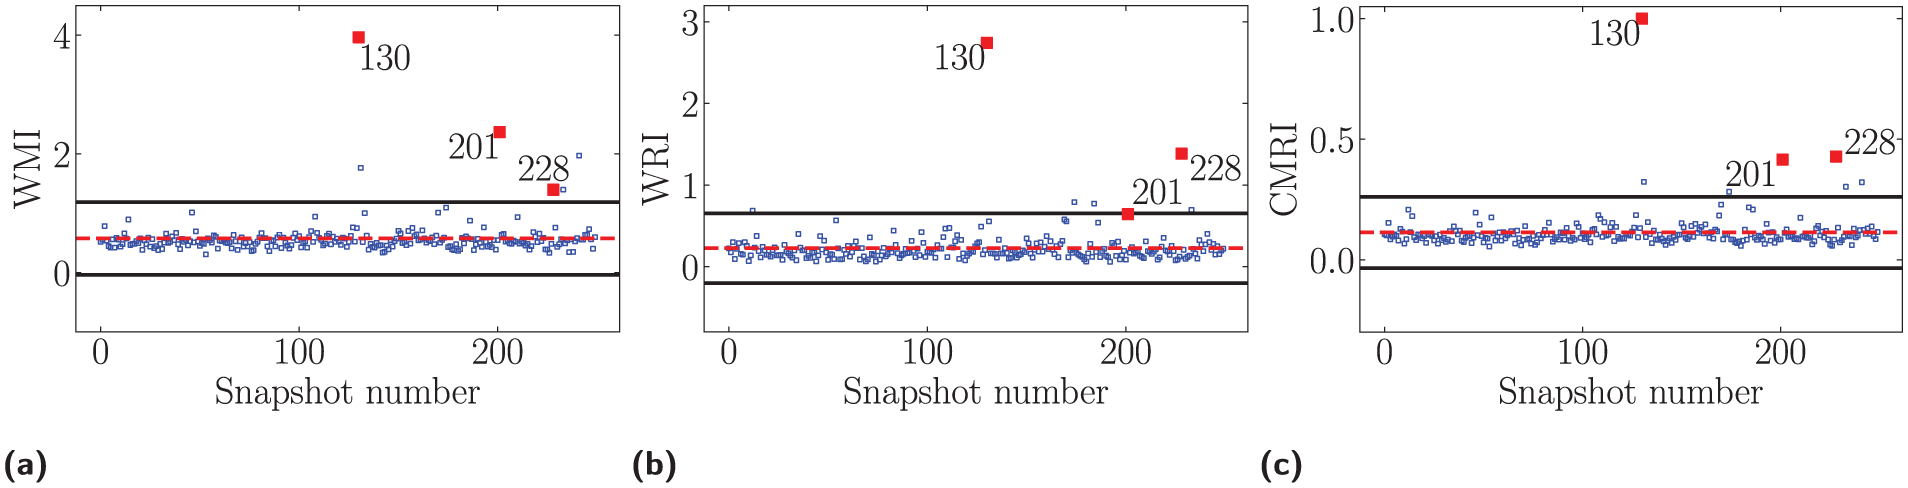
Variation in individual snapshots at 700 CAD captured by SPDMD 0 Hz mode, quantified using WMI (a), WRI (b), and modified-CMRI (c). The solid black lines show two standard deviations from the mean, while dashed red line represent the mean.
Figure 8 presents the flow fields for these three anomalous cycles at 700 CAD compared with the SPDMD 0 Hz mode. Contour lines at
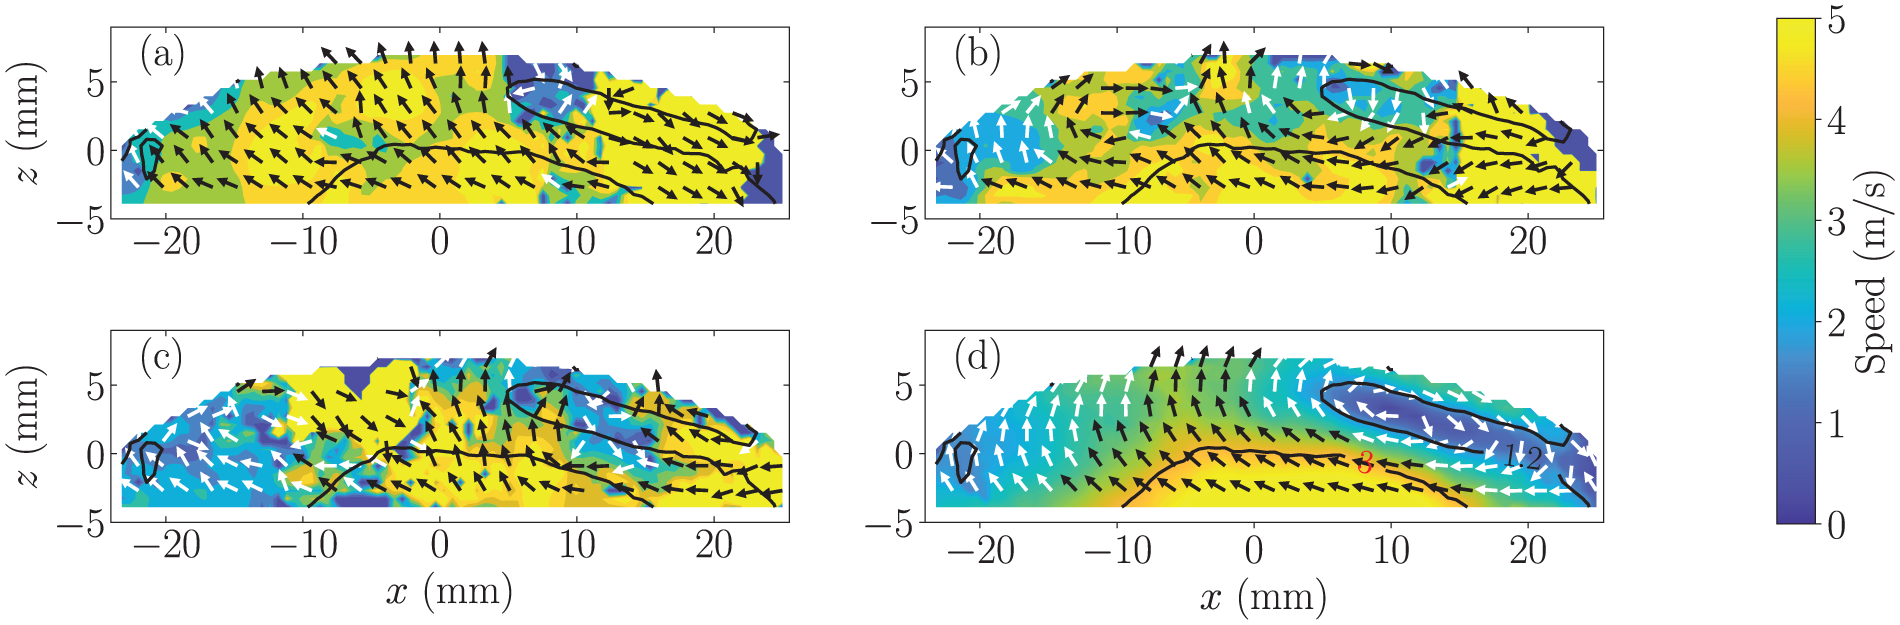
Flow fields at 700 CAD for cycle 130 (a), cycle 201 (b), cycle 228 (c), and SPDMD 0 Hz mode (d). Every second vector is plotted for clarity. Contour lines at 1.2 and 3 m/s from the ensemble mean flow field are overlayed for reference.
Finally, the apparent differences in the magnitude and alignment variations in the worst cycle (130) are further analyzed in Figure 9. Figure 9(a) shows the spatial distribution of velocity difference between cycle 130 and SPDMD 0 Hz mode, highlighting regions with significant magnitude variations. In this case, the highest velocity difference is identified in the region close to the top-right recirculation zone. The WRI distribution in Figure 9(b) indicates that the most pronounced alignment variations occur in the same region, albeit closer to the piston walls. The WMI distribution in Figure 9(c) is consistent with the velocity difference contours. The combined influence of both magnitude and alignment variations is captured in the modified-CMRI distribution in Figure 9(d), which highlights regions close to the piston walls, with overall high variability. This highlights the applicability of the proposed vector comparison metrics at different crank angles, providing a robust framework for evaluating the performance of dimensionality reduction methods in capturing flow-field variations. This analysis further evaluates the robustness of the proposed CCV analysis framework, using representative SPDMD 0 Hz mode field and modified-CMRI, when applied to a different phase of the engine cycle.
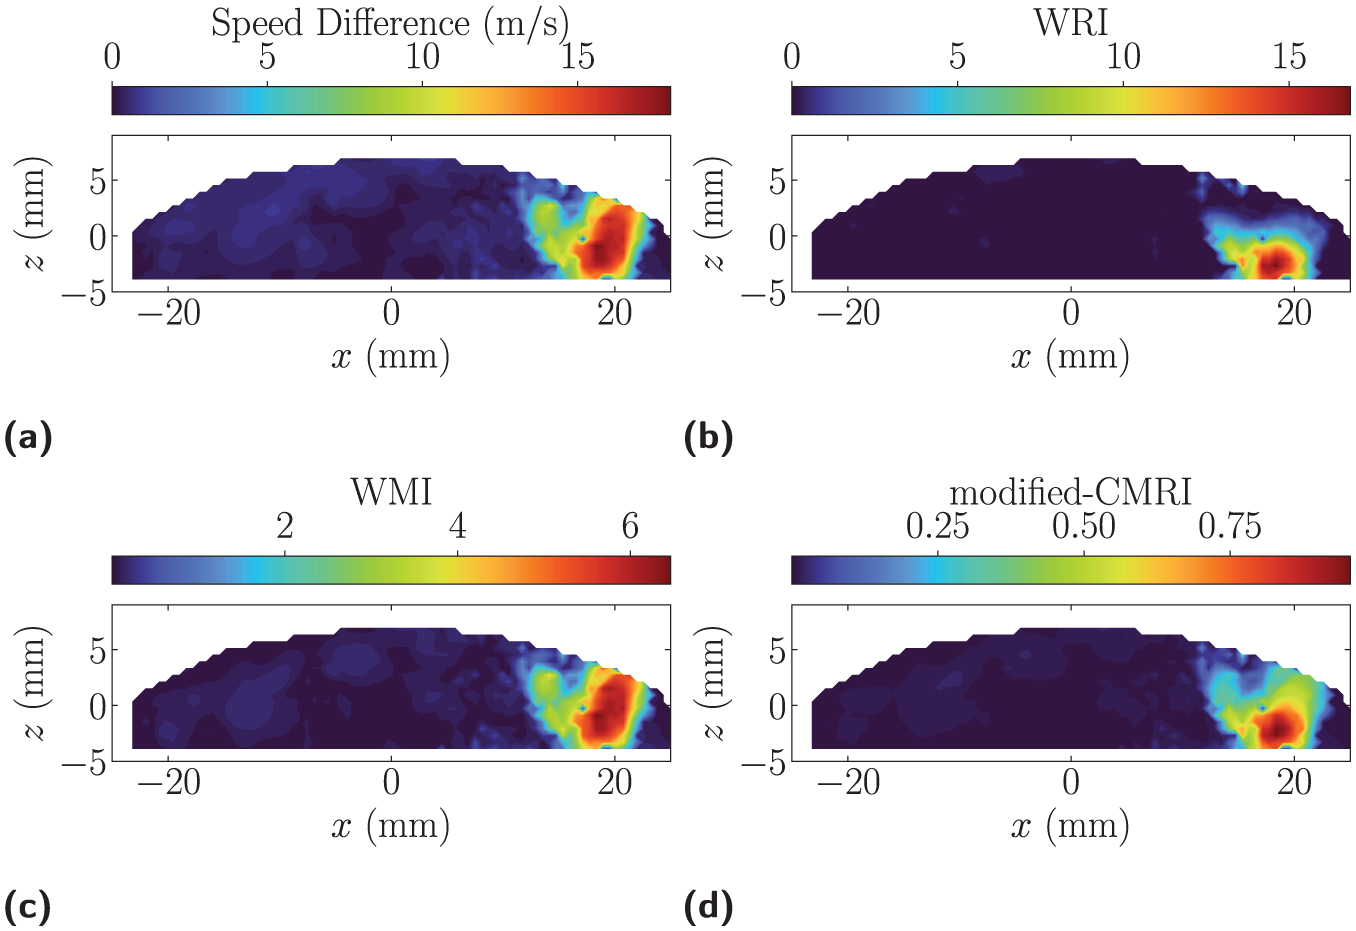
Variation in spatial distribution of speed difference between cycle 130 and SPDMD 0 Hz mode (a), WRI (b), WMI (c), and modified-CMRI (d) for cycle 130 at 700 CAD.
Conclusions
This study systematically evaluated the ability of ensemble averaging and three dimensionality-reduction techniques, specifically POD, DMD and SPDMD, to extract representative in-cylinder flow fields from highly variable, phase-dependent PIV measurements. To enable a physically meaningful assessment, a suite of novel vector comparison metrics framework, including WMI, WRI, and modified-CMRI, was utilized to quantify the magnitude and alignment variations in the flow field and access the performance of each method. The analysis was conducted using experimental PIV data from an optically accessible single-cylinder engine. The results demonstrate that ensemble-averaged flow fields, while commonly used, substantially suppress instantaneous speeds, particularly in regions dominated by high cycle-to-cycle variations (CCVs). Similar limitations were observed for the leading POD mode, which captured dominant large-scale structures but presented reduced speeds, thereby limiting its utility in analyzing highly fluctuating flow fields. DMD 0 Hz mode provided improved spatio-temporal coherence and frequency separation. However, its sensitivity to noise, outliers, and the linear evolution assumption led to inconsistent mode ranking and incomplete preservation of magnitude variability. While the DMD 0 Hz mode captured the dominant flow features, it did not consistently represent the instantaneous speeds observed across individual cycles. In contrast, SPDMD emerged as the most robust dimensionality-reduction approach for CCV analysis. SPDMD effectively mitigated the influence of transient outliers and identified a stable 0 Hz mode that preserved both speed and vector alignment. When evaluated using the proposed metrics, the SPDMD 0 Hz mode consistently identified anomalous cycles at both maximum intake valve lift and immediately prior to spark timing, outperforming ensemble mean, POD, and standard DMD. The modified-CMRI, further proved essential for robust CCV identification, particularly in cases where individual metrics alone were insufficient. Overall, this work demonstrates that the combined use of SPDMD and modified-CMRI provides a physically consistent and quantitatively robust framework for analyzing highly variable in-cylinder flows, offering clear advantages for experimental diagnostics, model validation, and the analysis of highly variable engine flow datasets.
Footnotes
Acknowledgements
We want to thank the TU Darmstadt research group for providing the PIV data used in this study. We also acknowledge Prof. Stefano Fontanesi for inspiring the inception of this research.
Funding
The authors disclosed receipt of the following financial support for the research, authorship, and/or publication of this article: The authors gratefully acknowledge the financial support provided by Natural Sciences and Engineering Research Council of Canada (NSERC), Alberta Innovates, and the Engineering and Physical Sciences Research Council (EP/R511742/1).
Declaration of conflicting interests
The authors declared no potential conflicts of interest with respect to the research, authorship, and/or publication of this article.