
Abstract
With the decarbonization of internal combustion engines, alternative fuels have gained increasing attention. When using fuels with low combustibility, such as ammonia, detailed analysis of the intake system and in-cylinder flow is essential for improving combustion efficiency. Proper orthogonal decomposition (POD) has been widely used to extract coherent structures in flow fields within internal combustion engines. However, most previous studies have focused on analyzing cycle-to-cycle variations in gasoline engines, while time-resolved analysis within a single cycle of diesel engines has rarely been conducted. In this study, the effect of tangential port opening on in-cylinder flow characteristics was investigated using an optical single-cylinder diesel engine equipped with two intake ports and two exhaust ports. The opening area of the tangential port was varied under five conditions using different gaskets, and in-cylinder velocities were measured using particle image velocimetry. POD was applied to the acquired velocity data to evaluate the flow structures of the higher modes and their correlations with the mean flow and turbulence intensity. The results showed that in POD mode 1, a swirl flow was formed during the compression stroke when the tangential port opening exceeded 25%. Evaluation of the correlation between POD mode 1 and the ensemble-averaged flow using the relevance index revealed a strong correlation during the compression stroke. In POD mode 2, complex flows were observed during the intake stroke, and structures different from the mean flow were also confirmed during the compression stroke. A moderate correlation was observed between POD mode 2 and turbulence intensity under all conditions. Energy contribution analysis indicated that in the early intake stroke, the variation in mode 1 was large, and the flows represented by mode 2 and higher modes were dominant, whereas in the late compression stroke, mode 1 consistently accounted for a higher proportion.
Keywords
Background and objective
In recent years, the automotive industry has faced increasing energy demand and stringent exhaust emission regulations, making the development of new combustion systems an urgent priority. In particular, carbon-free fuels such as hydrogen 1 and ammonia2,3 are gaining attention as promising options for providing sustainable propulsion. Ammonia is considered a difficult fuel to ignite due to its chemical properties, such as high latent heat of vaporization and low laminar flame speed. 2 Therefore, improving combustion efficiency requires a high intake air temperature, the formation of a homogeneous air-fuel mixture, and appropriate turbulence characteristics in the combustion chamber. Recent studies have reported that increasing the swirl ratio in ammonia-fueled engines contributes to enhanced combustion and a reduction in unburned ammonia emissions. Lu et al. 4 demonstrated that increasing the swirl ratio from 0.5 to 4.0 resulted in approximately a 3.5% increase in the peak combustion pressure, while increasing it from 0.5 to 3.0 reduced the in-cylinder unburned ammonia emissions by about 14.9%. These findings indicate that higher swirl intensity promotes the formation of a combustible mixture and effectively shortens the ignition delay in ammonia combustion. Enhancement of swirl intensity also contributes to achieving stable combustion at high ammonia fractions. Liu et al. 5 investigated premixed, swirl-stabilized methane/air combustion using mixed fuels with ammonia volume fractions ranging from 0% to 80% and demonstrated that increasing the swirl intensity in three stages improved combustion stability under high-ammonia-ratio conditions by expanding the recirculation zone and enhancing flame compactness. Similarly, Wang et al. 6 showed that, in ammonia–methane–air premixed swirl flames, increasing the swirl number from 0.6 to 1.0 led to combustion stabilization and emission improvement under conditions with an equivalence ratio of 0.9 and an ammonia fraction of 80% or higher. In addition, since the density and viscosity of alternative fuels differ from those of conventional internal combustion engine (ICE) fuels, it is necessary to analyze changes in in-cylinder flow characteristics during each engine stroke in detail to achieve efficient combustion.
Many previous studies have reported the influence of in-cylinder flow on combustion characteristics. Brijesh and Sreedhara 7 and Bari et al. 8 have shown that insufficient atomization of fuel droplets inside the combustion chamber leads to soot accumulation. On the other hand, it has been found that when turbulence is generated inside the cylinder, fuel droplet atomization improves and the mixing with air proceeds more rapidly, leading to enhanced engine performance and reduced harmful emissions. Furthermore, Yoon et al. 9 and Feng et al. 10 have demonstrated that high swirl intensity positively affects combustion efficiency and emission characteristics. It has also been shown that the swirl flow inside the cylinder is significantly influenced by the shape of the piston bowl11–14 and the configuration of the intake port.12,15–22 In particular, the intake port structure plays a crucial role in swirl generation and turbulence intensity, thereby directly affecting combustion efficiency and emissions. Previous studies have also revealed that variations in the opening areas of helical and tangential ports exert different influences on the swirl flow.12,16–22
To measure in-cylinder flow, hot-wire anemometry 23 and laser Doppler velocimetry 24 have been used. Although these techniques provide excellent temporal and spatial resolution, they have limitations in measurement area and make it difficult to capture the spatial flow structure. Therefore, particle image velocimetry (PIV), which enables non-contact measurement of velocity at multiple points in the flow field, has been widely applied in the analysis of in-cylinder flow in diesel engines.14–18,20–22,25–27 Aljarf et al. 16 reported that reducing the opening area of the tangential port causes the swirl center shifts toward the cylinder axis and increases the swirl ratio. Kim et al. 18 showed that the intake port geometry, such as the distance between the intake ports, the presence of a bypass, and the open or closed state of the swirl control valve (SCV), affects swirl formation, and concluded that the use of an SCV is highly effective for swirl control. Zha et al. 21 conducted swirl ratio control by throttling the intake port and visualized changes in swirl axis symmetry during the compression stroke using PIV, showing that increasing the swirl ratio reduces flow asymmetry. Furthermore, in our previous study, 22 it was shown that under conditions with stepwise reductions in tangential port opening, a stable swirl flow can be maintained by controlling the distribution of turbulent kinetic energy (TKE) and swirl center position (SCP). These studies have clarified the temporal variation of average in-cylinder flow characteristics such as swirl ratio, TKE, and SCP using velocity field measurements obtained through PIV. On the other hand, sufficient investigation has not yet been conducted to extract large-scale energy structures in the overall in-cylinder flow and to clarify how they vary and transition over time.
In recent years, proper orthogonal decomposition (POD)28–32 has emerged as an effective method for efficiently analyzing the large volumes of velocity field data obtained through PIV. POD is a technique for extracting dominant flow structures from multidimensional data based on the contribution of kinetic energy in the flow field, and it is known to provide an optimal basis for low-dimensional representations of turbulence. 28 POD is also mathematically equivalent to the Karhunen–Loève decomposition (KLD), principal component analysis (PCA), and singular value decomposition (SVD), 29 and has been applied in various fields. Owing to these characteristics, the application of POD to the analysis of turbulent jets and combustion flow fields inside engine cylinders has been increasing.30–39 Chen et al. 31 applied POD to clarify the change in in-cylinder flow when misfire occurs in a gasoline direct-injection engine and showed that the energy contribution of the dominant flow mode decreases upon misfire and the structure of the higher modes becomes disordered. Zhuang et al. 34 applied POD at the fixed crank angle to visualize the temporal evolution of vortex structures inside a SIDI engine from the intake to the compression stroke and demonstrated that the process of the dominant vortex structures collapsing during the advancement of the compression stroke can be visualized by the lower-order modes. Furthermore, Cosadia et al. 38 applied POD to analyze the cycle-to-cycle variation of swirl flow in a diesel engine, showing that the dominant flow structures vary with each cycle and that the energy contributions of these different modes differ accordingly. However, there are few studies in which POD has been applied to PIV data during the intake and compression strokes of diesel engines to analyze the structural changes of flow modes within a cycle and the variations in energy contribution for each mode, and this has not been systematically investigated.
In this study, aiming to enable combustion with an increased proportion of ammonia, which has low flammability, we focus on the intake system and conduct a detailed analysis of the swirl flow formation process in the cylinder of a diesel engine. To clarify the influence of the tangential port opening on the in-cylinder flow structure, PIV measurements were conducted under conditions in which the opening area was gradually varied using gaskets. Velocity fields were obtained during the intake and compression strokes. In this study, as an initial step, we focused on a representative plane located 30 mm below the cylinder head and applied POD analysis to extract the dominant flow structures, aiming to clarify the fundamental flow characteristics under different port opening conditions. Furthermore, POD was applied to the obtained velocity fields, and the spatial structures of the dominant modes were visualized using velocity vectors and streamlines. In addition, relevance index was used to quantitatively evaluate correlations between the low POD modes, the ensemble-averaged flow, and turbulence intensity.
Experimental apparatus and methodology
Experimental apparatus
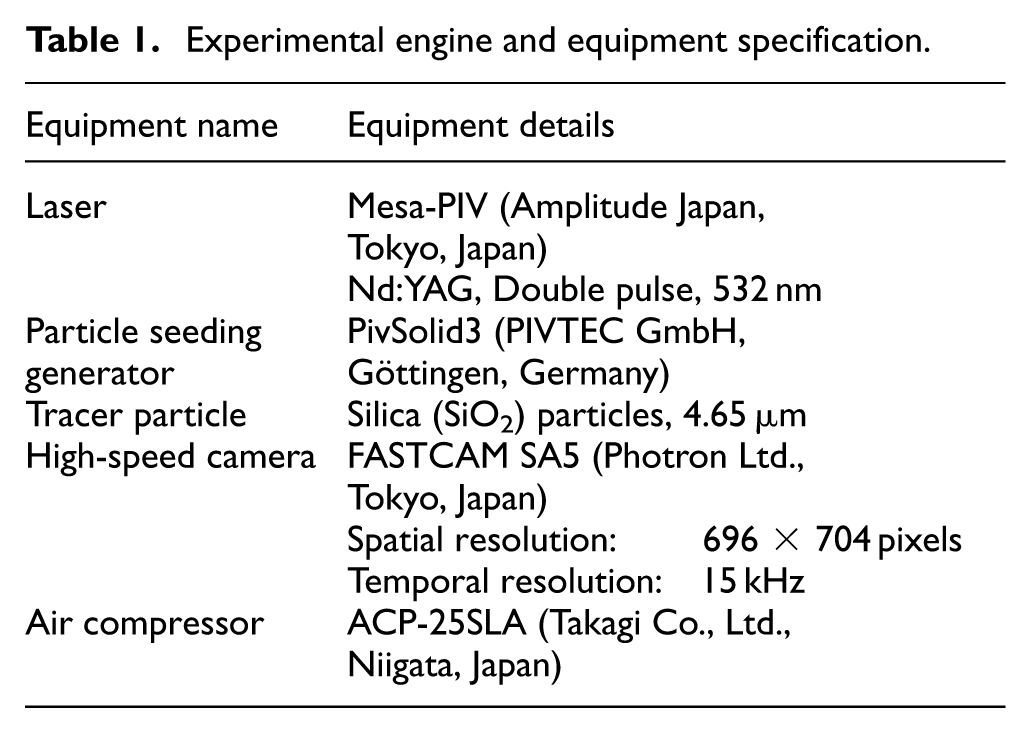
The experimental apparatus, shown in Figure 1, is based on an optical single-cylinder diesel engine, and the specifications of the PIV system are listed in Table 1. This apparatus employs a four-valve optical engine equipped with two intake ports and two exhaust ports. The intake ports consist of a tangential port and a helical port, each generating swirl flow with distinct characteristics. In this study, a gasket was installed at the junction between the intake pipe and the intake port to restrict the opening area of the tangential port. As shown in Figure 2, the tangential port has a straight structure and introduces air along the cylinder wall, generating a large-diameter swirl flow. In contrast, the helical port is highly inclined relative to the cylinder axis and has a spiral structure, which generates a small-diameter swirl flow. The main specifications of the engine are a bore of 85 mm, a stroke of 96.9 mm, and a piston cavity diameter of 51.6 mm. To visualize the interior of the cylinder, the cylinder is made of transparent quartz glass, and the piston cavity is made of sapphire glass. In the PIV system, a mirror is installed at the bottom of the piston, allowing observation inside the cylinder. The visualization area is limited to the piston combustion chamber, with the crank angle (CA) range for visualization extending from 70 °CA to 290 °CA. In this study, the top dead center (TDC) for combustion corresponds to 360 °CA.
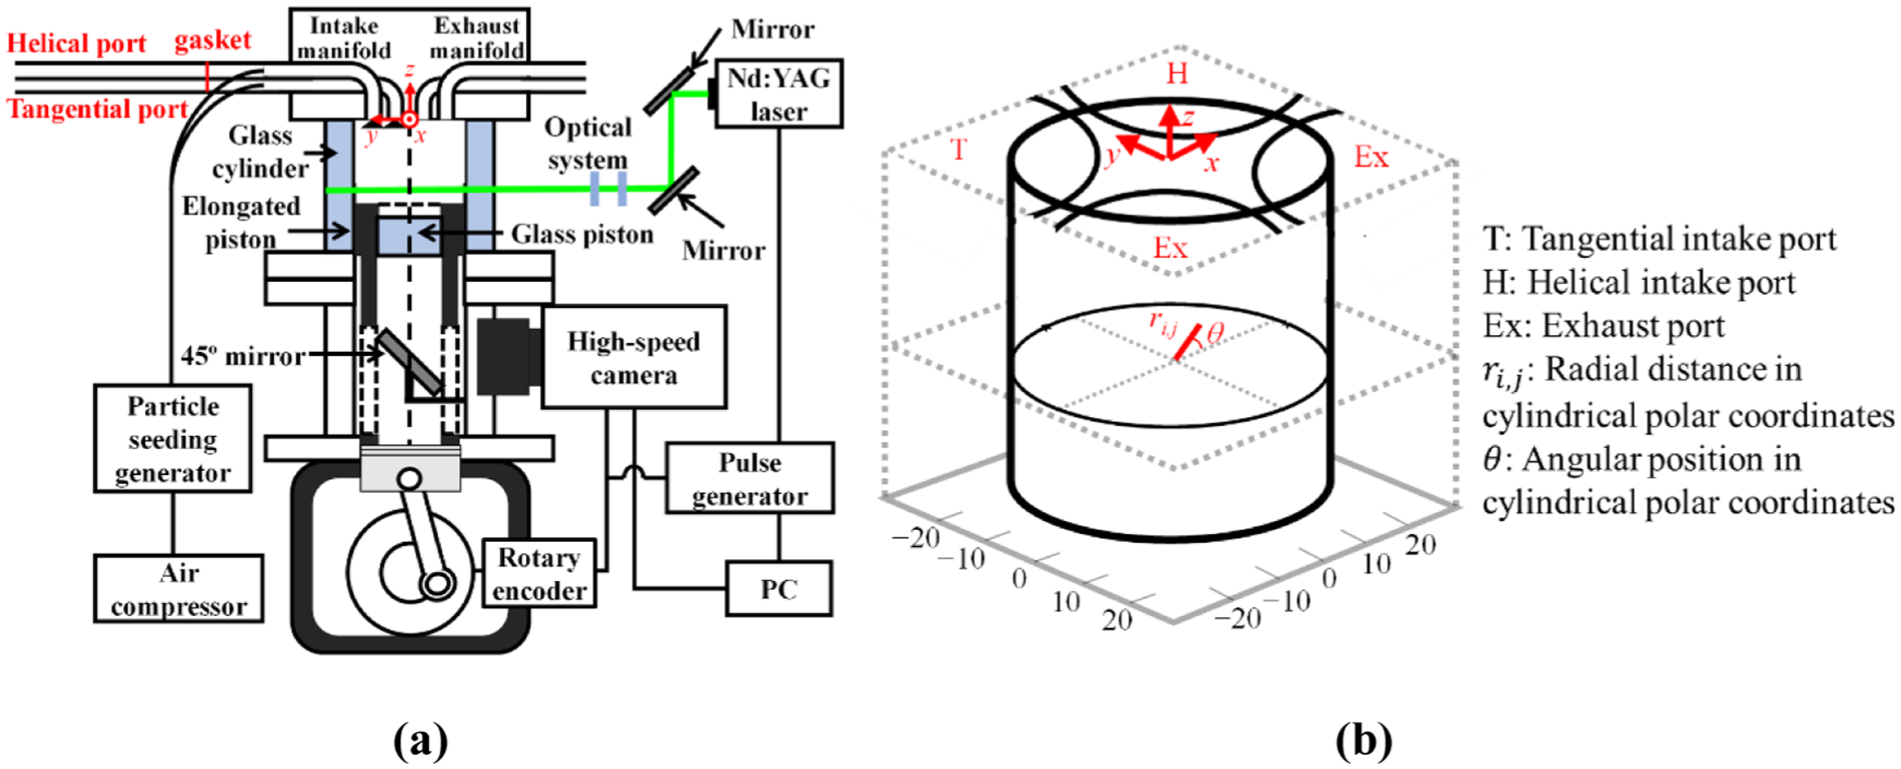
(a) Experimental apparatus and (b) location of each port on the cylinder head and its coordinates. Units are mm.
Experimental engine and equipment specification.
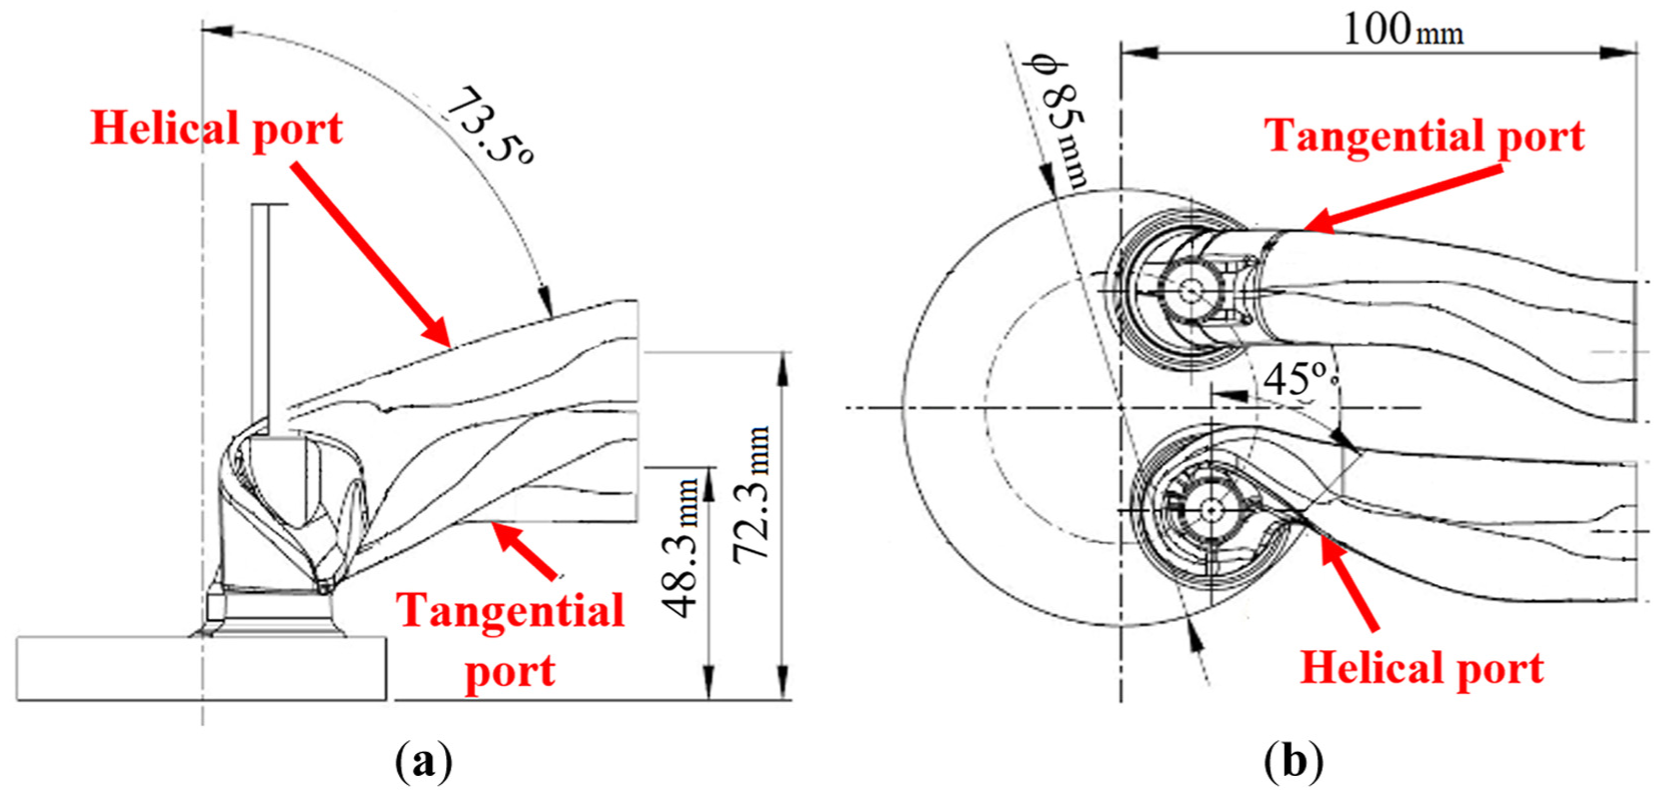
(a) Side view and (b) top view of the helical and tangential intake ports.
A double-pulse Nd:YAG laser with a wavelength of 532 nm (Mesa-PIV, Amplitude Japan, Tokyo, Japan) was used as the light source. The laser beam passes through the cylindrical and condenser lenses and forms a laser sheet with a thickness of 1 mm, which illuminates the interior of the cylinder horizontally. The height of the laser sheet is set to a plane at z = –30 mm, and it enables the tracking of particle movement inside the cylinder. Silica (SiO2) particles with an average diameter of 4.65 µm were used as tracer particles, and their flow tracking capability was confirmed by LDV measurements. 40 The tracer particles were introduced through the intake port using a seeding generator (PivSolid3, PIVTEC GmbH) and an air compressor (ACP-25SLA, Takagi Co., Ltd., Niigata, Japan). The tracer particles that entered the cylinder during the intake stroke were illuminated by scattered light reflected by the mirror at the bottom of the piston and captured by a high-speed CMOS camera (FASTCAM SA5, Photron Ltd., Tokyo, Japan). The camera operates at 15,000 fps with a spatial resolution of 696 × 704 pixels. The captured images were analyzed using commercial software (FtrPIV, version 3.2.0.0, Flowtech Research Inc., Kanagawa, Japan), and velocity vectors were calculated using the direct cross-correlation method. The interrogation area and the search area were set to 16 × 16 pixels and 33 × 33 pixels, respectively, and adjacent interrogation areas were arranged with 50% overlap. The engine, high-speed camera, and laser were synchronized using a pulse generator based on signals output at every 2 °CA from a rotary encoder installed on the engine. This synchronization allowed the laser and camera to operate at 2 °CA intervals, enabling two images to be captured with an interval of 10 µs.
Experimental conditions
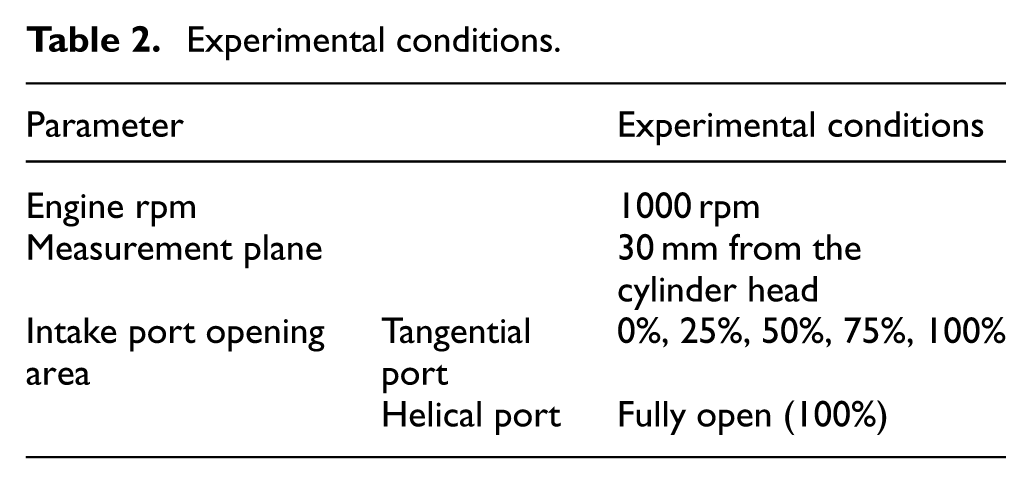
The experimental conditions in the present study are summarized in Table 2. In this study, the opening area of the helical port was fixed at 100%, while that of the tangential port was varied to 0%, 25%, 50%, 75%, and 100% using five different gaskets. Velocity measurements were conducted on a plane located 30 mm below the cylinder head (z = –30 mm). Although this measurement plane is positioned near the intake valve and may be influenced by local flow effects, it was selected as a representative observation plane for assessing the swirl formation process. Based on our previous study, which showed that engine speed has little influence on the structure of the swirl flow, 20 the engine speed was fixed at 1000 rpm.
Experimental conditions.
To ensure statistical reliability, PIV measurements were conducted over 32 engine cycles, and the ensemble-averaged velocity fields were used for analysis. In addition, statistical evaluations were performed based on in-cylinder pressure data to assess the effect of cycle-to-cycle variations. Figure 3 presents, as a representative example, the pressure traces for individual cycles together with the ensemble-averaged trace under the 25% port opening condition. The variance of the peak in-cylinder pressure among all 32 cycles was 6.21 × 10⁻⁶ MPa2, and the relative standard deviation with respect to the mean peak pressure was 0.085%. Similar tendencies were observed under other opening conditions, confirming that the cycle-to-cycle variation was negligibly small.
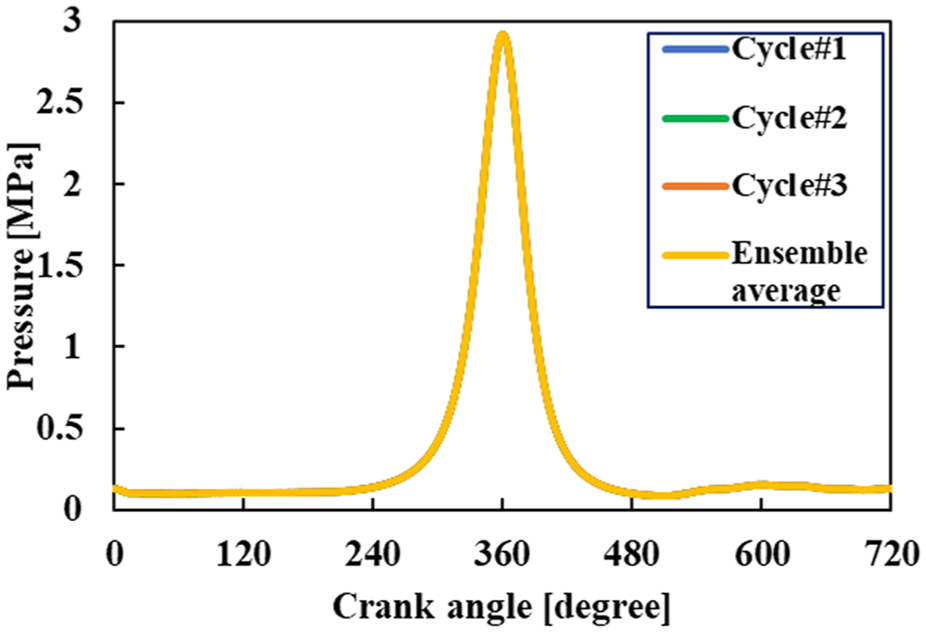
Comparison of in-cylinder pressure traces for individual cycles and the ensemble-averaged result.
To investigate the effect of variations in the tangential port opening area on the charge efficiency, the in-cylinder pressure was measured. Figure 4 shows the in-cylinder pressure traces for each opening condition. The relative error between the highest and lowest peak in-cylinder pressures at TDC, observed under the 25% and 100% opening conditions, respectively, was 4.15%. In addition, the maximum relative error within the analyzed crank angle range was 3.41%. Since these differences were sufficiently small, the influence of variations in the opening area on charge efficiency was considered limited.
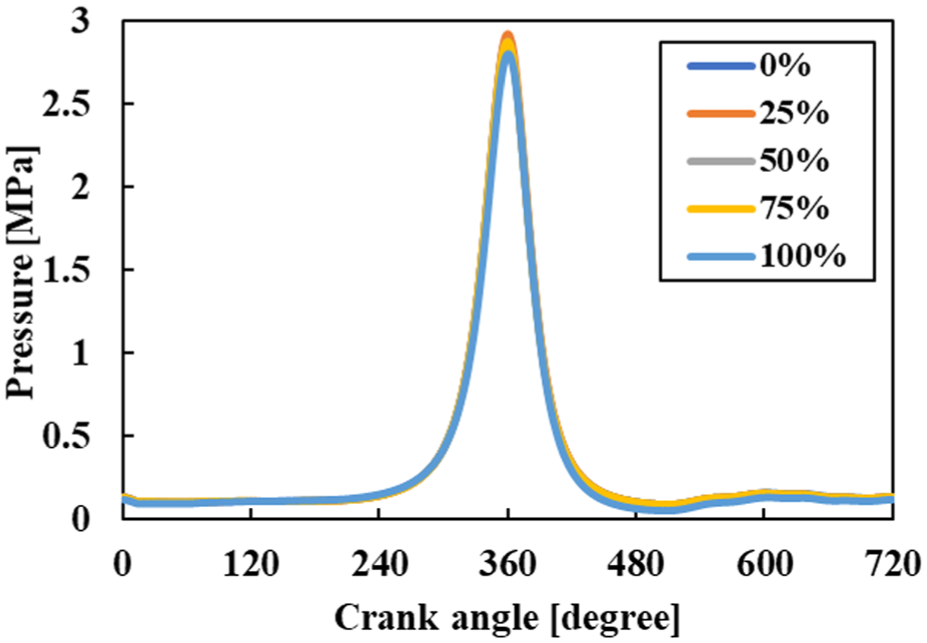
In-cylinder pressure traces under different tangential port opening conditions.
POD analysis and evaluation method
POD analysis procedure
POD28–32 is a form of principal component analysis method used to extract low-dimensional components from multidimensional data, and it can capture large-scale structures that govern complex turbulent flows. In this study, the velocity distribution
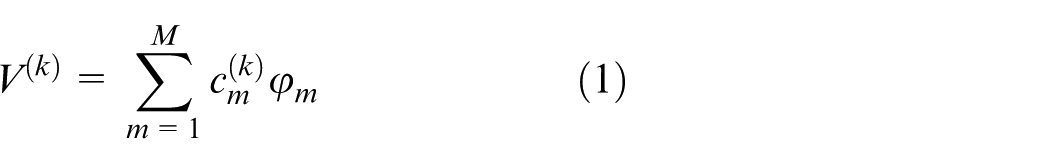
The coefficient
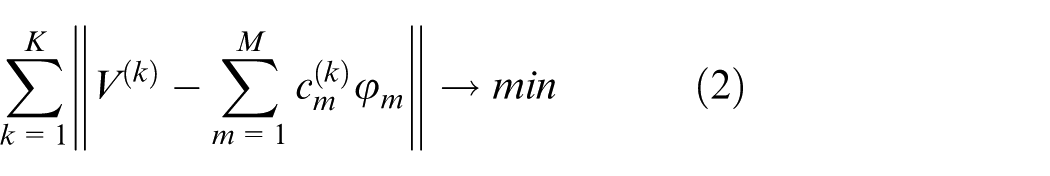
The condition shown in equation (2) is satisfied by solving the following eigenvalue problem.

Here,
In this study, the crank angle ranges from 70 °CA to 290 °CA, measured using PIV, was divided into four segments. POD analysis was performed in the ranges of 70–124 °CA, 126–180 °CA, 180–234 °CA, and 236–290 °CA, respectively. This enabled the evaluation of the temporal variation of the dominant flow structures by dividing the intake and compression strokes into early and late phases.
Streamline evaluation method
A streamline is a curve that is tangent to the velocity field at each point at a given instant in the flow. Assuming that the velocity components in the x and y directions are u and v, respectively, the streamline is expressed by the following equation.
Evaluation method of relevance index
Visual comparison of flow fields is useful, but it is inherently subjective and qualitative. In this study, the relevance index
30
is used to quantitatively evaluate the similarity of flow field structures. This method evaluates the similarity between two basic functions obtained from different samples by projecting one onto the other. The relevance index
By dividing by the norm, the values are normalized, and the relevance index value close to 1 indicates that the structures of the two flow fields are similar. However, due to the nature of the eigenvalue problem, the sign of the POD mode is mathematically arbitrary and does not carry physical meaning in terms of direction. Therefore, it is reasonable to consider the structures as identical if the spatial patterns match, even if the signs are opposite. Thus, in this study, the absolute value of the relevance index,
Evaluation method of energy contribution
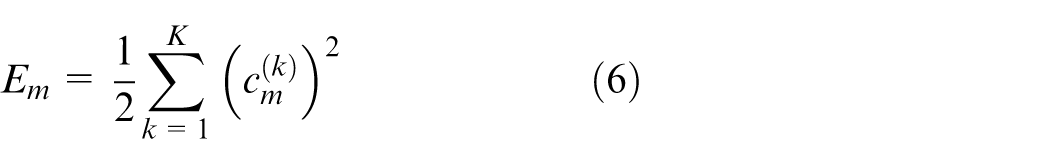
The kinetic energy
Results and discussion
Evaluation of the velocity vector and streamline maps of mode 1
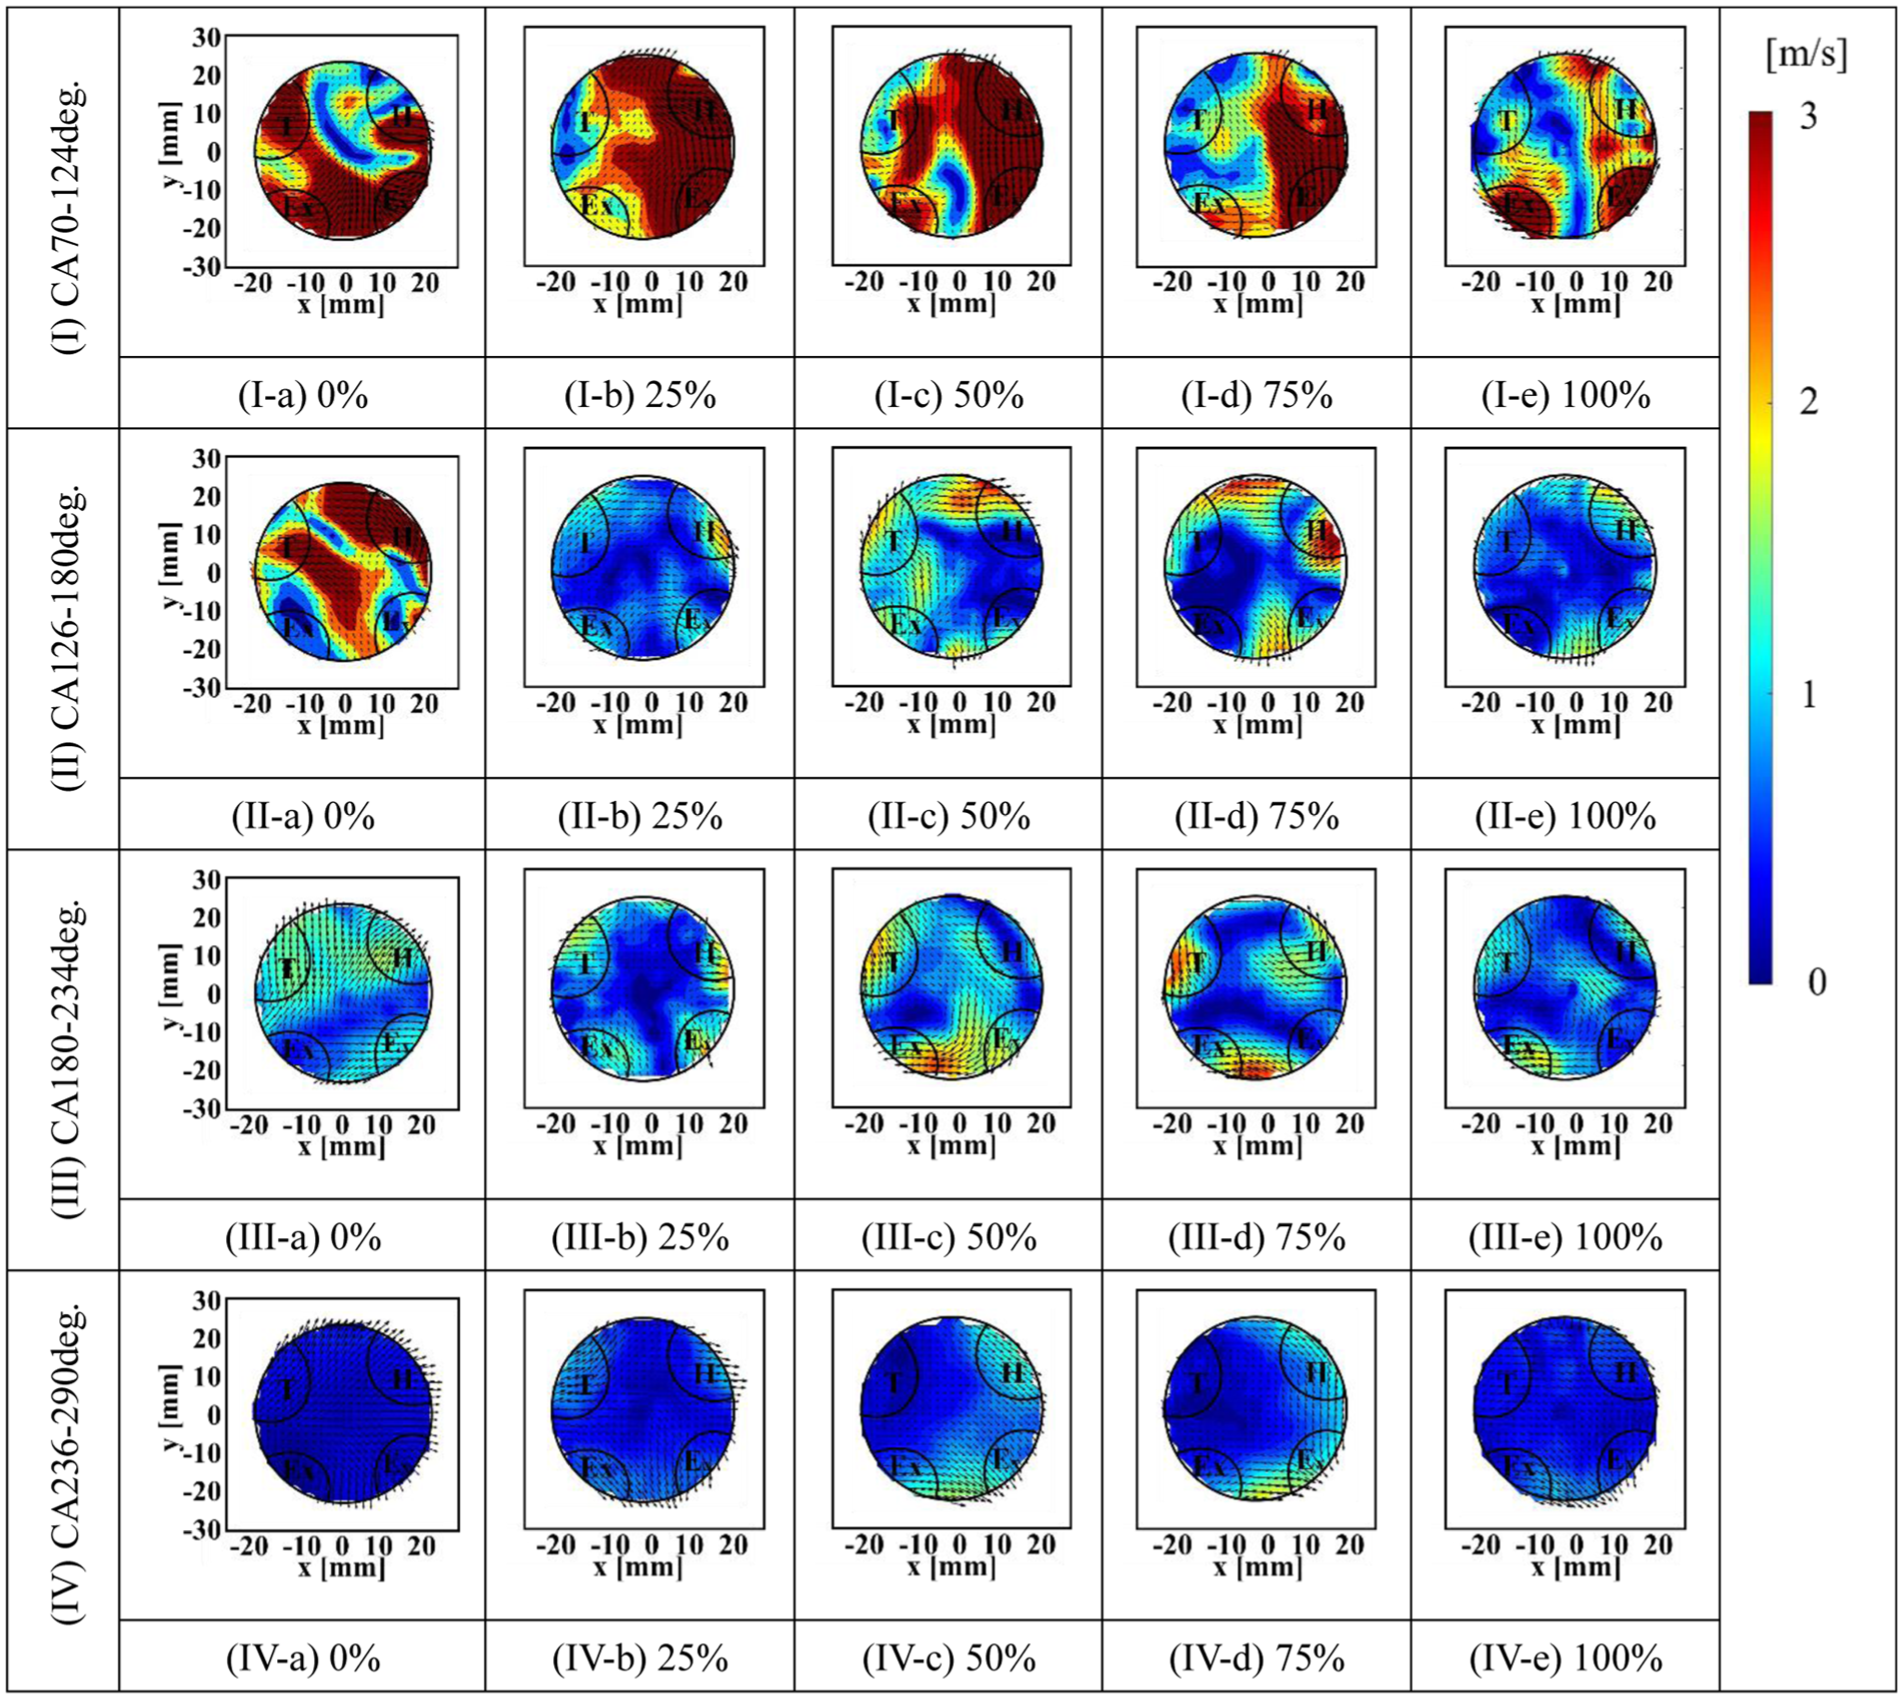
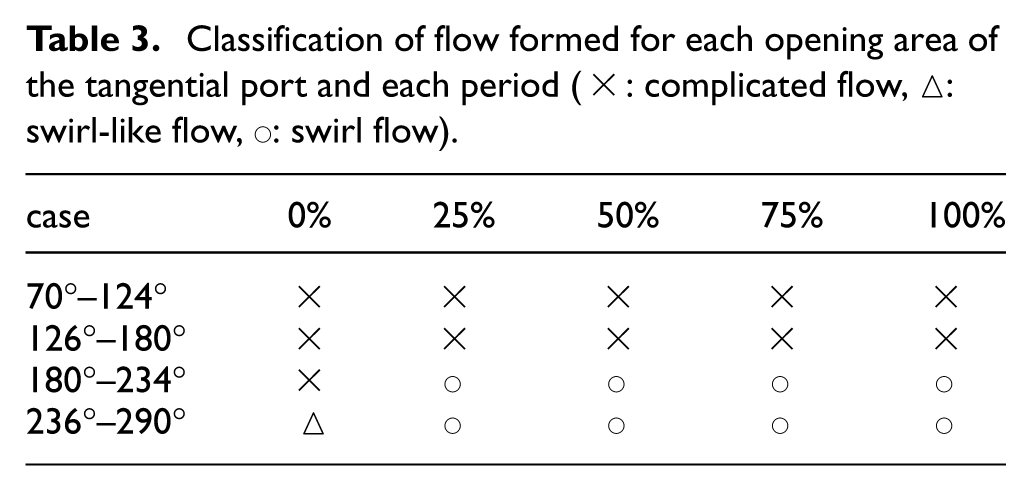
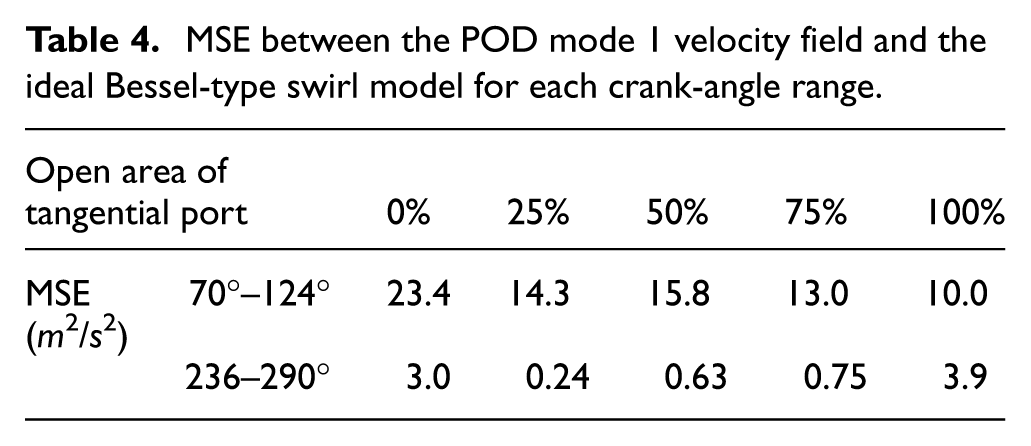
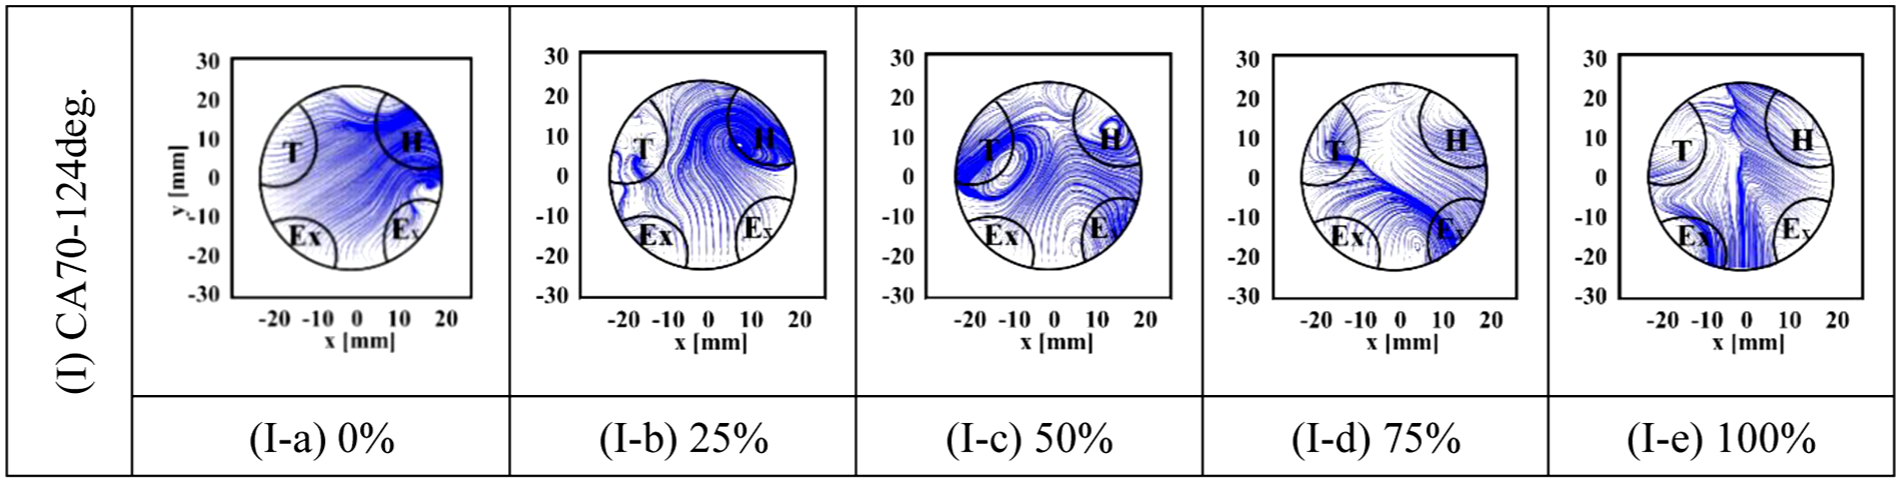
To investigate the effect of tangential port opening on the dominant in-cylinder flow during the intake and compression strokes, the velocity distribution inside the cylinder was measured using PIV, and POD analysis was performed. In the POD analysis, results for 28 modes corresponding to the number of analyzed crank angle positions were obtained. Previous studies have shown that the lower-order POD modes capture the primary structures of the flow and are crucial elements that account for the dominant kinetic energy.28–32 Therefore, this study focuses on mode 1 and mode 2 for evaluation. First, the velocity vector and streamline maps of mode 1 obtained from POD analysis are evaluated. Figure 5 shows the velocity vector of mode 1 for each port opening condition, and Figure 6 shows the corresponding streamline maps. Each of (I) through (IV) corresponds to the velocity vector diagrams for the following phases: (I) early intake stroke (70–124 °CA), (II) late intake stroke (126–180 °CA), (III) early compression stroke (180–234 °CA), and (IV) late compression stroke (236–290 °CA). (a) through (e) correspond to tangential port openings of 0%, 25%, 50%, 75%, and 100%, respectively. For example, the notation (I-a) indicates the diagram for the early intake stroke (70–124 °CA) with a 0% opening. The same notation is used in Figures 7 and 8. It should be noted that all planar views shown in Figures 5 –8 are illustrated from a top-down perspective of the cylinder. From Figure 5, it is observed that the in-cylinder flow velocity tends to increase overall from (I) early intake to (II) late intake. On the other hand, in (III) early compression and (IV) late compression, the flow velocity inside the cylinder tends to be somewhat lower compared to the late intake stroke. In the late compression stroke, under the 0% opening condition (IV-a), the velocity distribution in mode 1 is relatively uniform throughout, and no clear main flow direction or rotational structure is observed. On the other hand, under conditions with 25% or greater opening (IV-b) to (IV-e), regions with higher velocities along the cavity wall are continuously formed in a single direction, indicating the formation of a large-diameter swirl flow as the dominant flow pattern. From Figure 6, during the intake stroke as shown in (I) and (II), complex flow patterns, such as the flow collision from both intake ports, are observed regardless of the port opening, with no swirl formation. This flow pattern is referred to as “complicated flow,” following the authors’ previous research. 22 In the compression stroke, a large-diameter swirl flow is formed under conditions with 25% or greater opening in (III), and a well-defined swirl flow is maintained in (IV). Under 0% opening condition, the streamlines are straight in (III) but show slight curvature in (IV), indicating the formation of a swirl-like flow. These results suggest that when the tangential port opening is 25% or greater, swirl flow is formed during the compression stroke. Table 3 summarizes the classification of the flow patterns for each opening condition at each measurement phase. The flow structures of POD mode 1 shown in Table 3 were found to be consistent with the flow structures classified based on the ensemble-averaged flow in our previous study 22 under all conditions. This confirms that mode 1, which contains the largest portion of total energy, captures the mean flow structure during the swirl formation process. Furthermore, the velocity field of POD mode 1 was compared with that of an ideal Bessel vortex model, in which the swirl center and swirl ratio were matched,22,41 and the deviation was quantitatively evaluated using the mean square error (MSE). The results are presented in Table 4. As shown in the table, the MSE ranged from 10.0 to 23.4 m2/s2 during the early intake stroke, whereas it decreased to 0.24–3.9 m2/s2 during the late compression stroke. Therefore, it was quantitatively confirmed that the flow field approached an ideal swirl structure during the late compression stroke. It should be noted that the evaluation in this study is based on single-plane measurements taken 30 mm below the cylinder head and therefore does not directly represent the entire three-dimensional flow structure but rather compares the flow characteristics within the measurement plane.
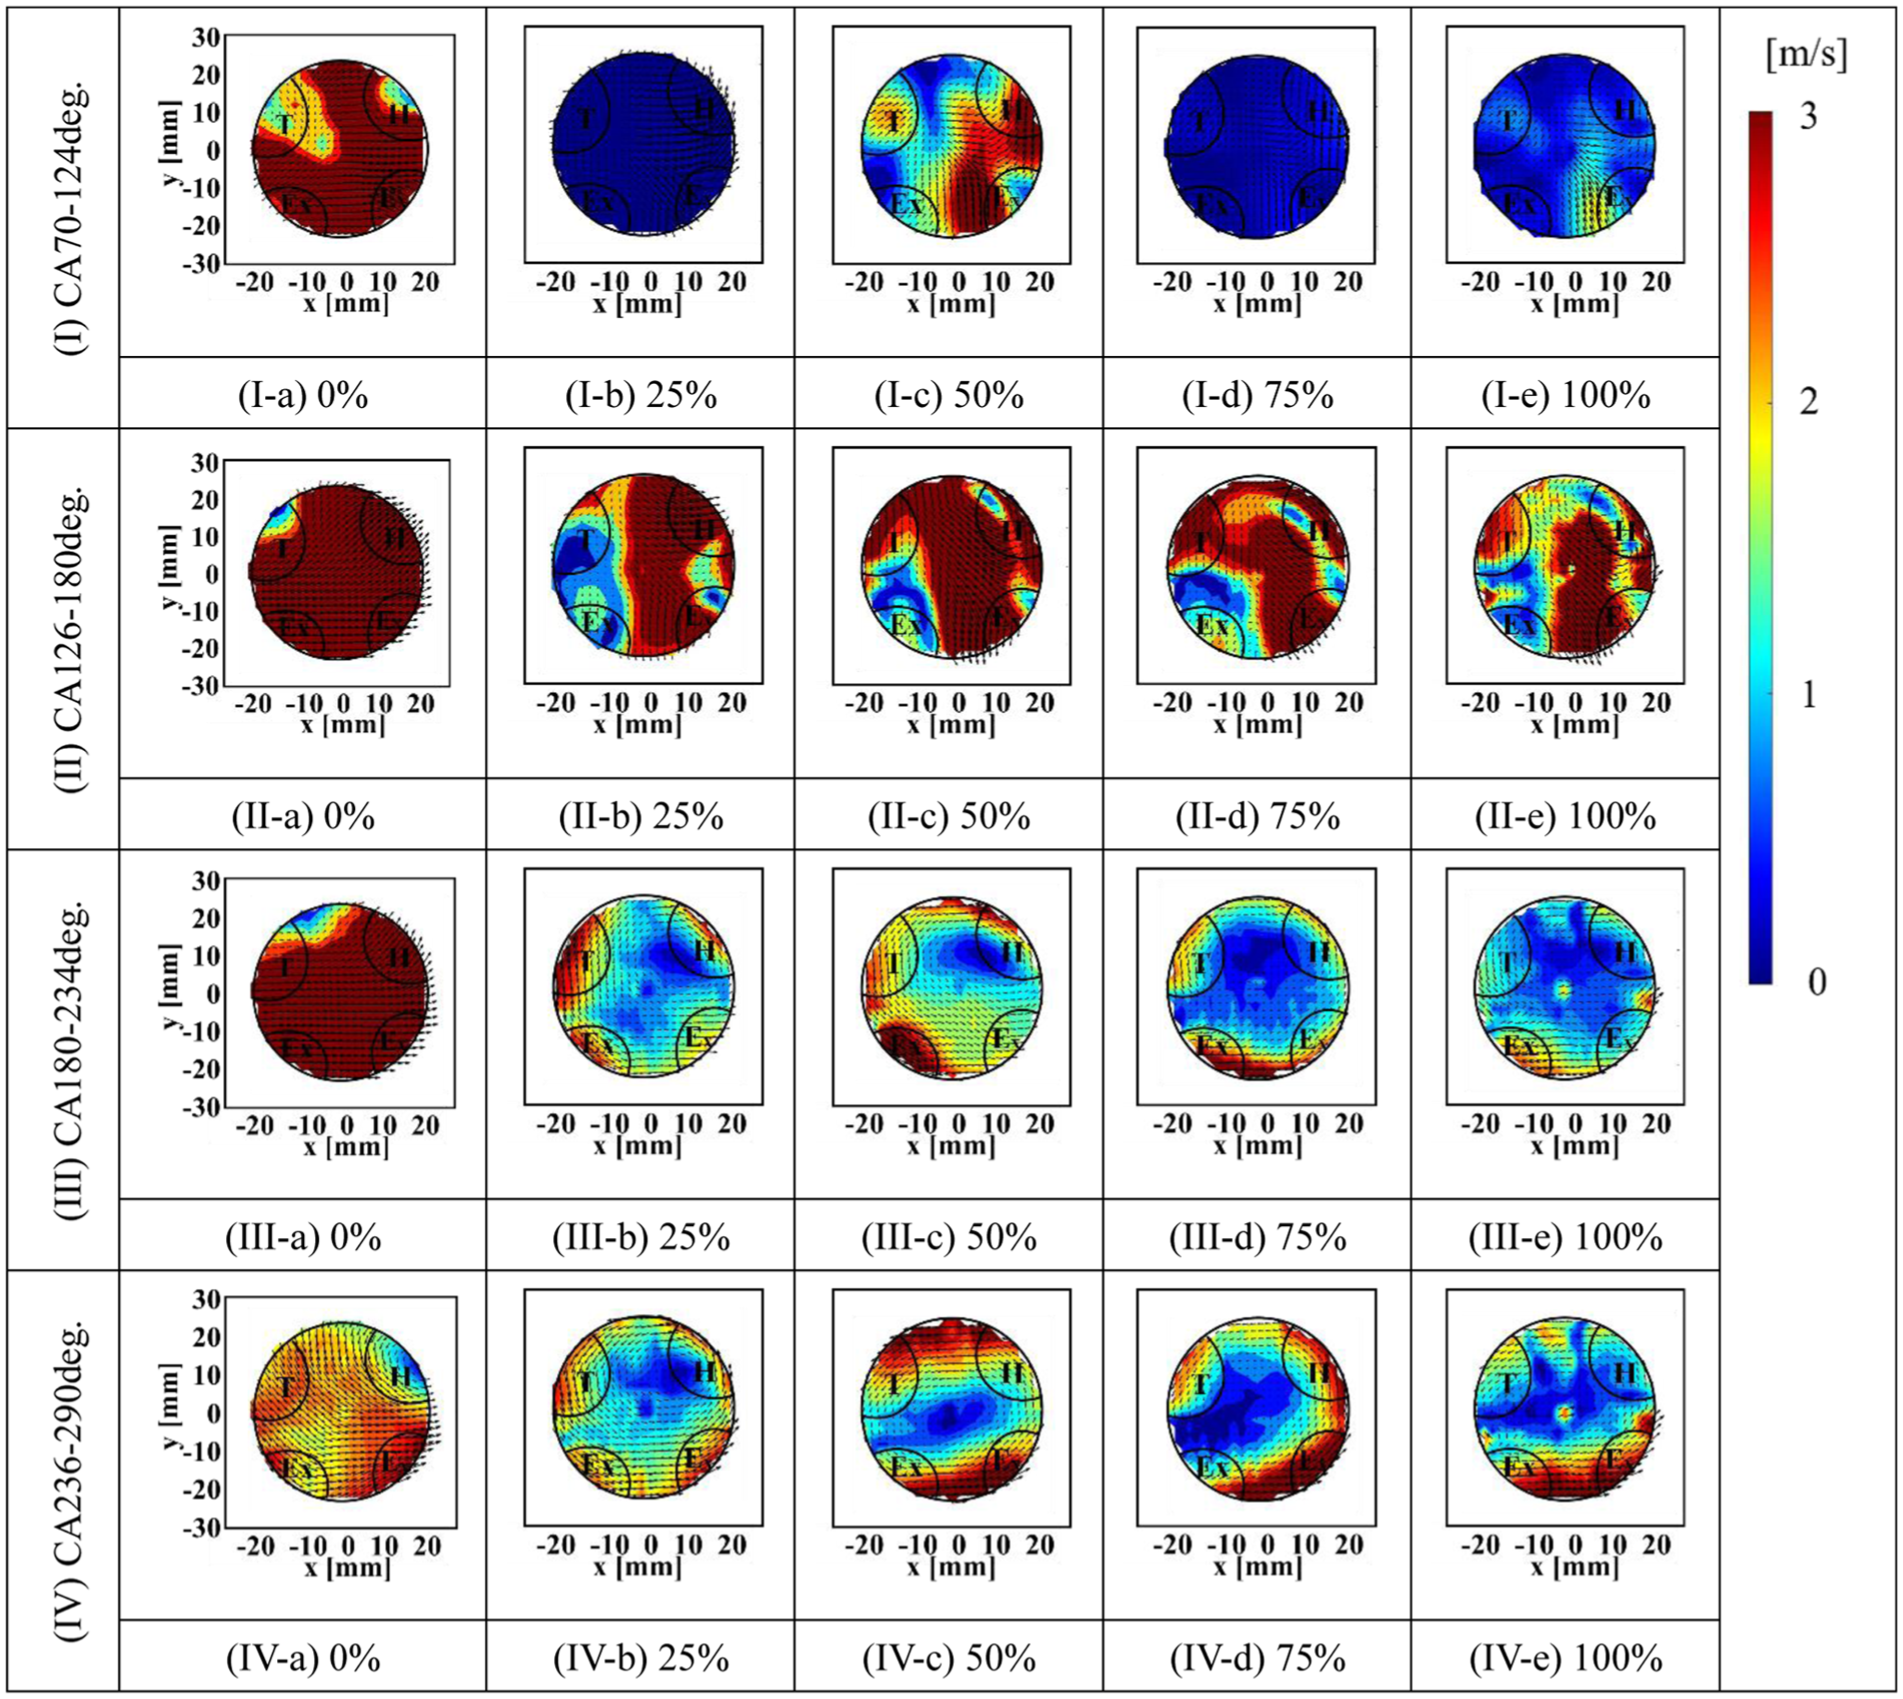
Velocity-vector map obtained from POD analysis for mode 1, showing crank angles from 70° to 124°, 126° to 180°, 180° to 234°, and 236° to 290° under conditions of helical port 100% and five different open areas of tangential port.
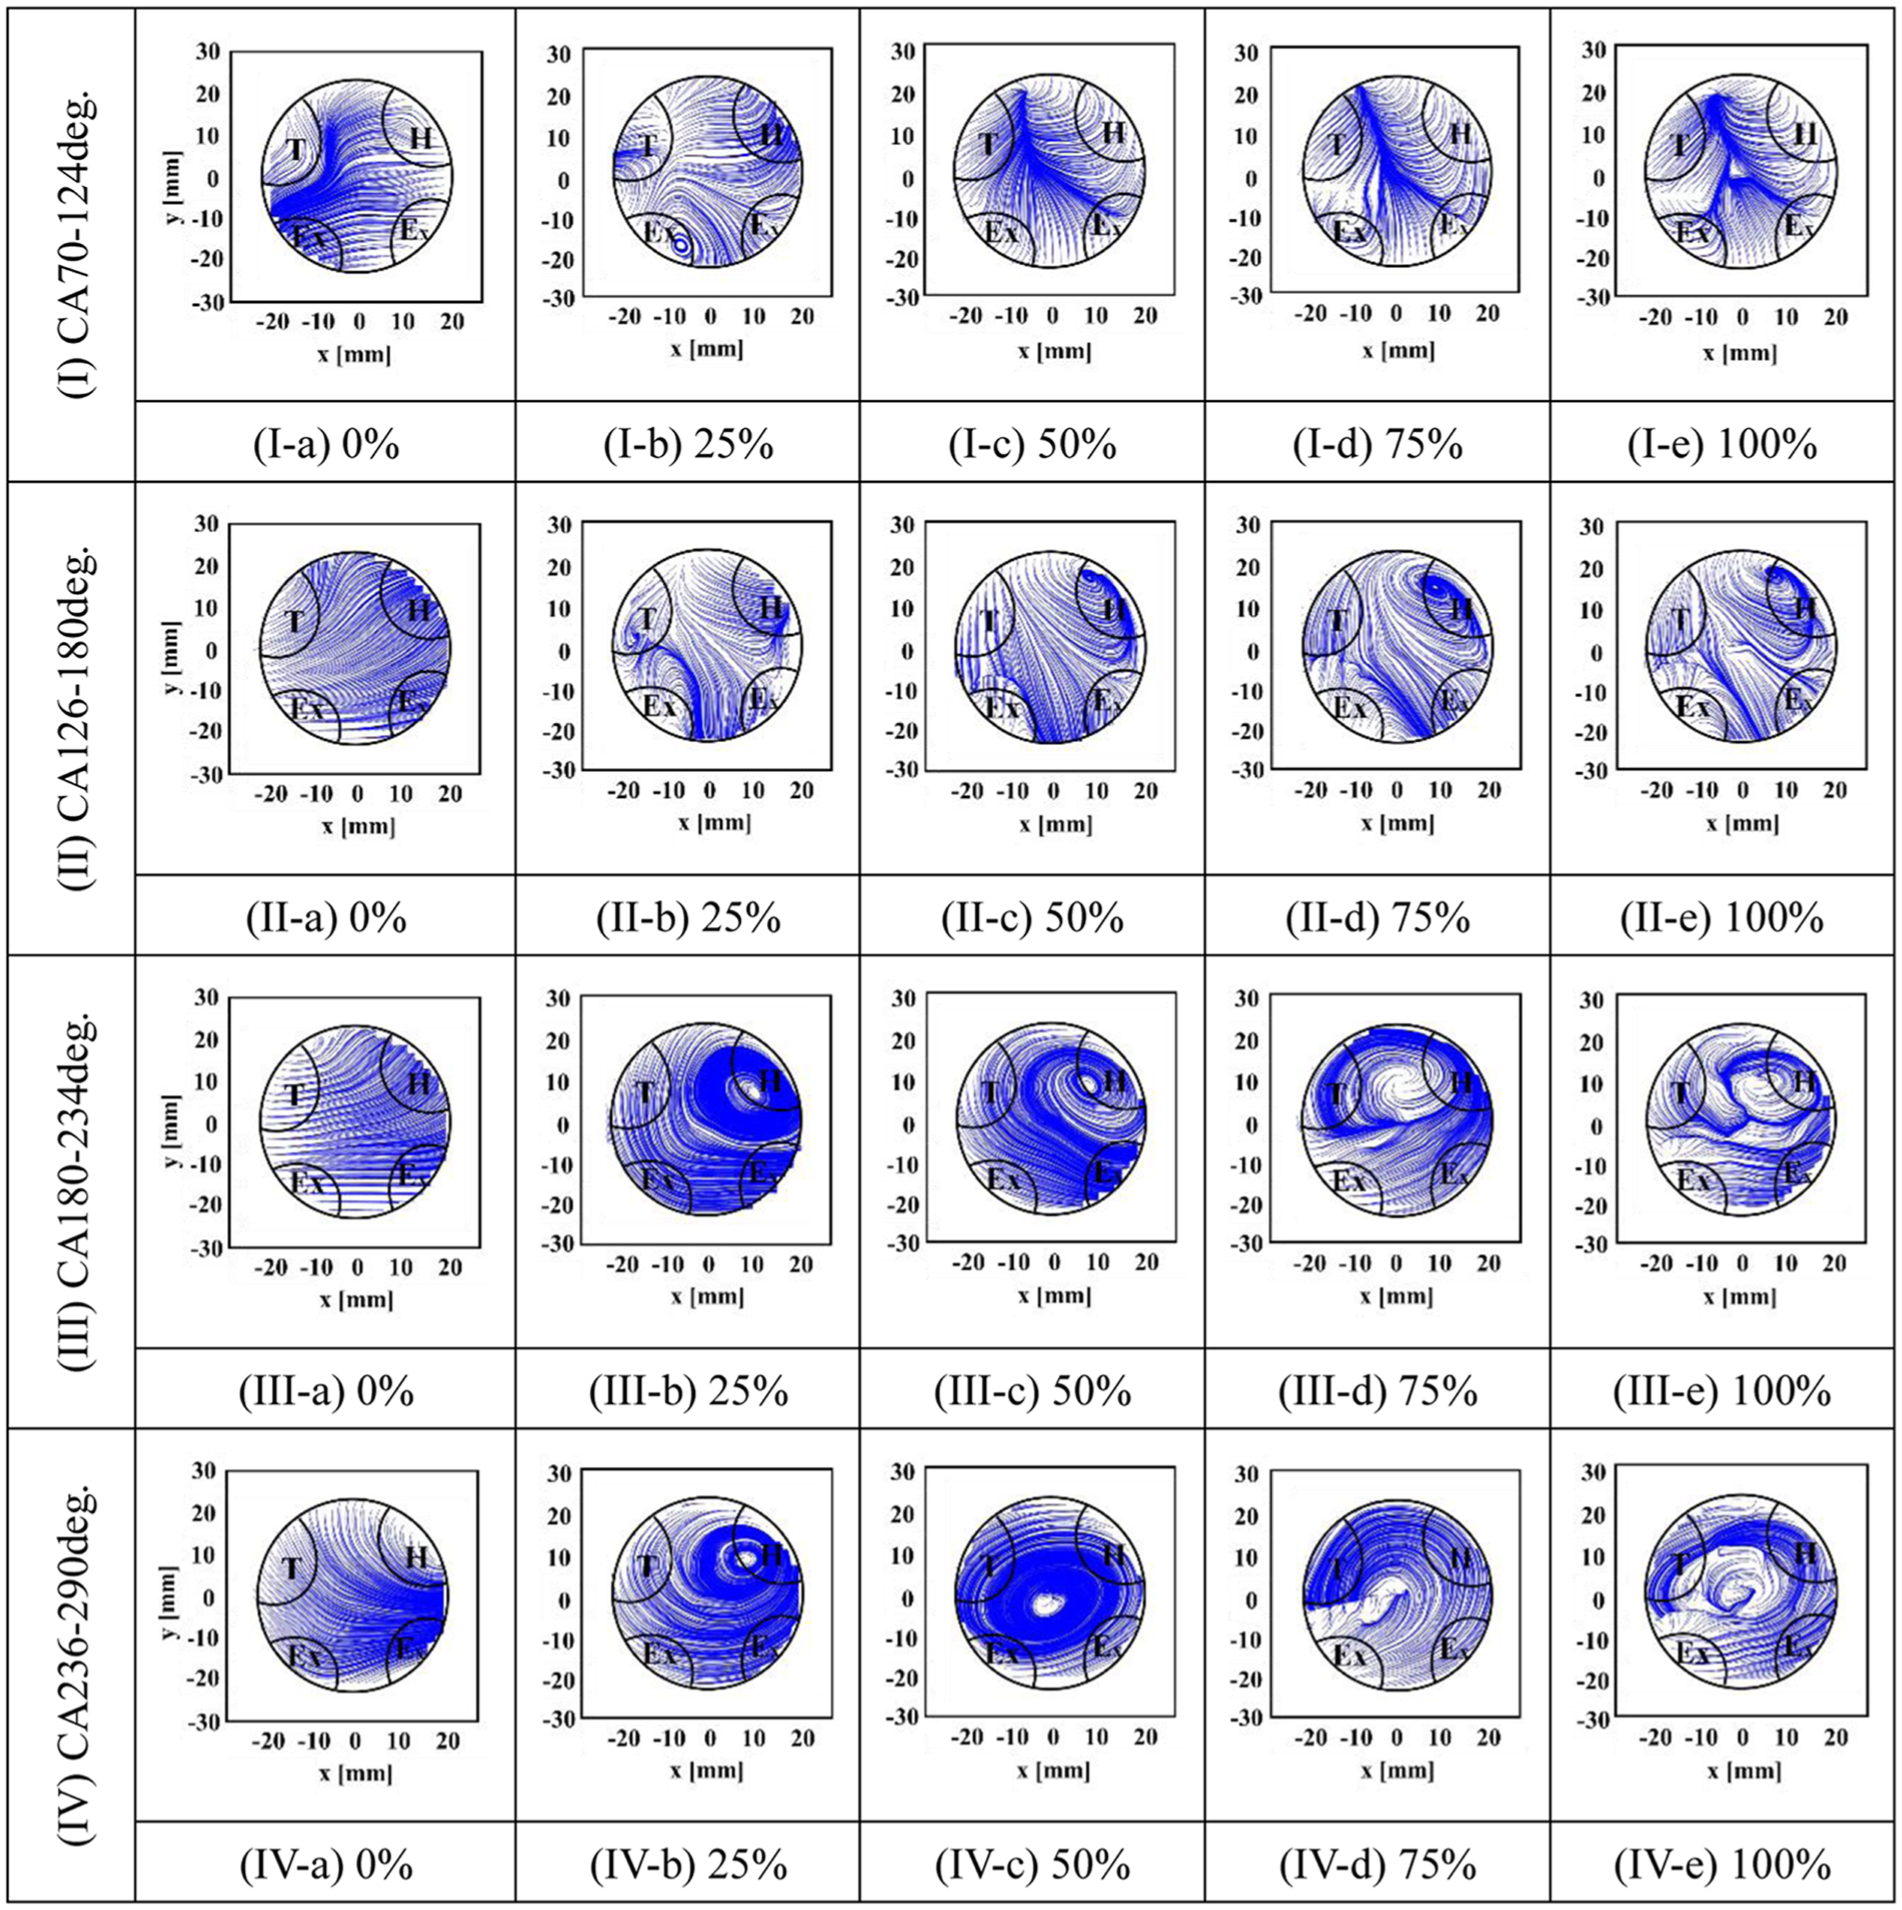
Streamline maps obtained from POD analysis for mode 1, showing crank angles from 70° to 124°, 126° to 180°, 180° to 234°, and 236° to 290° under conditions of helical port 100% and five different open areas of tangential port.
Velocity-vector map obtained from POD analysis for mode 2, showing crank angles from 70° to 124°, 126° to 180°, 180° to 234°, and 236° to 290° under conditions of helical port 100% and five different open areas of tangential port.
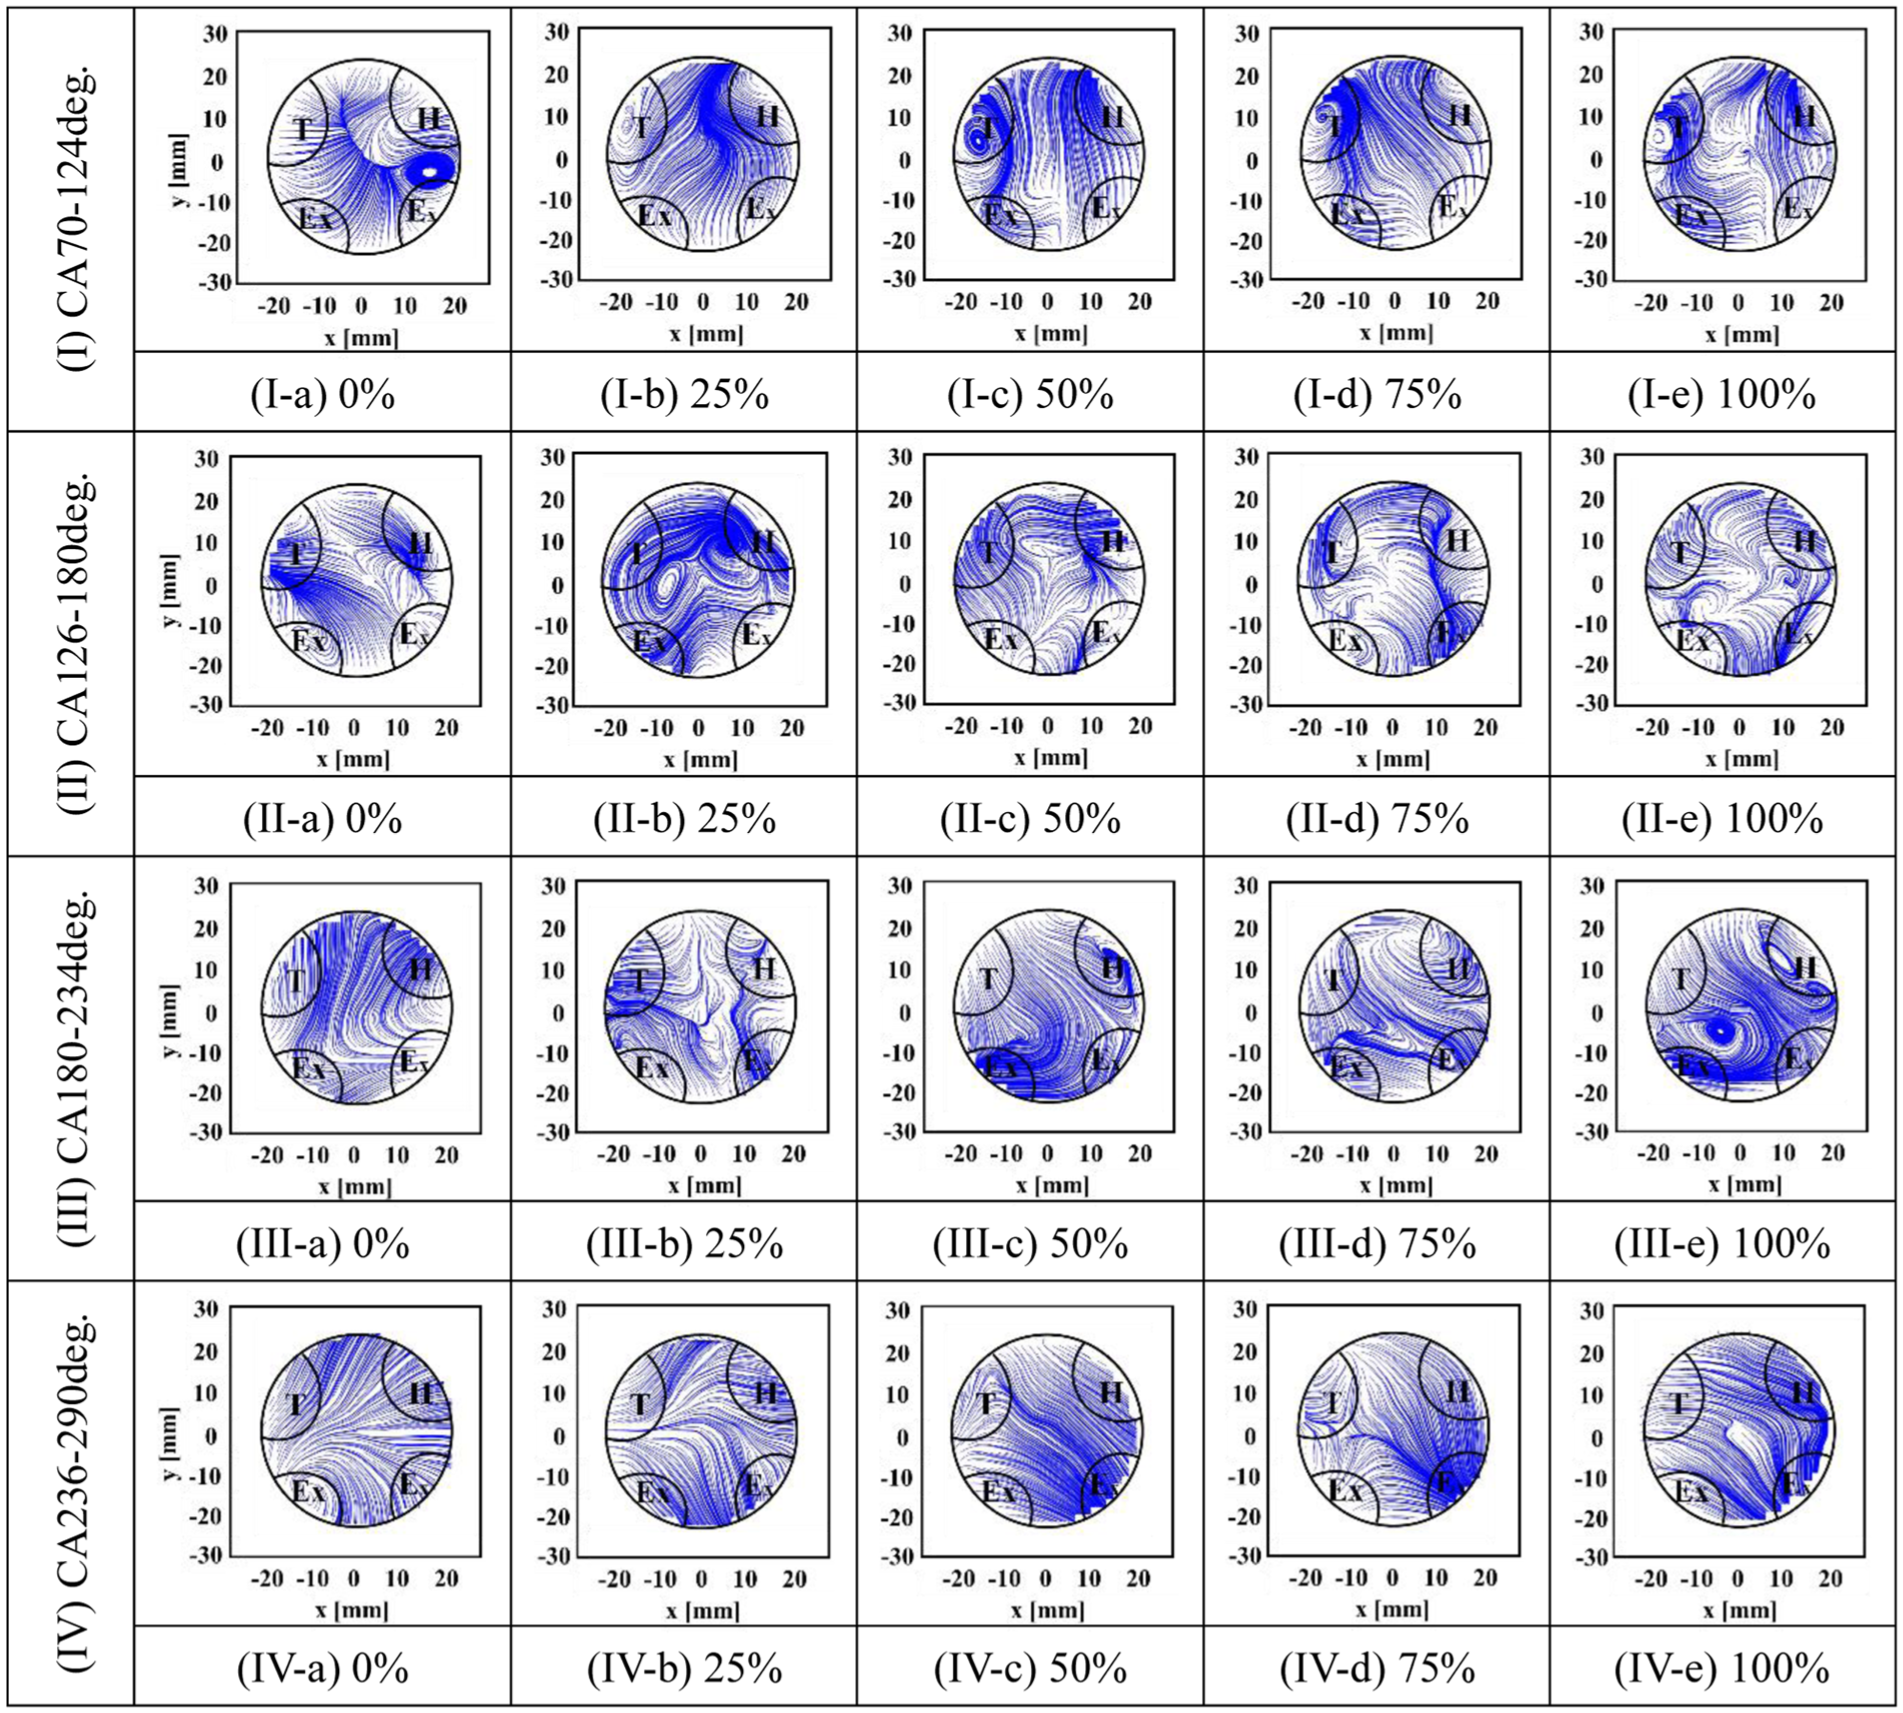
Streamline maps obtained from POD analysis for mode 2, showing crank angles from 70° to 124°, 126° to 180°, 180° to 234°, and 236° to 290° under conditions of helical port 100% and five different open areas of tangential port.
Classification of flow formed for each opening area of the tangential port and each period (×: complicated flow, △: swirl-like flow, ○: swirl flow).
MSE between the POD mode 1 velocity field and the ideal Bessel-type swirl model for each crank-angle range.
Evaluation of the relevance index between POD mode 1 and the mean flow
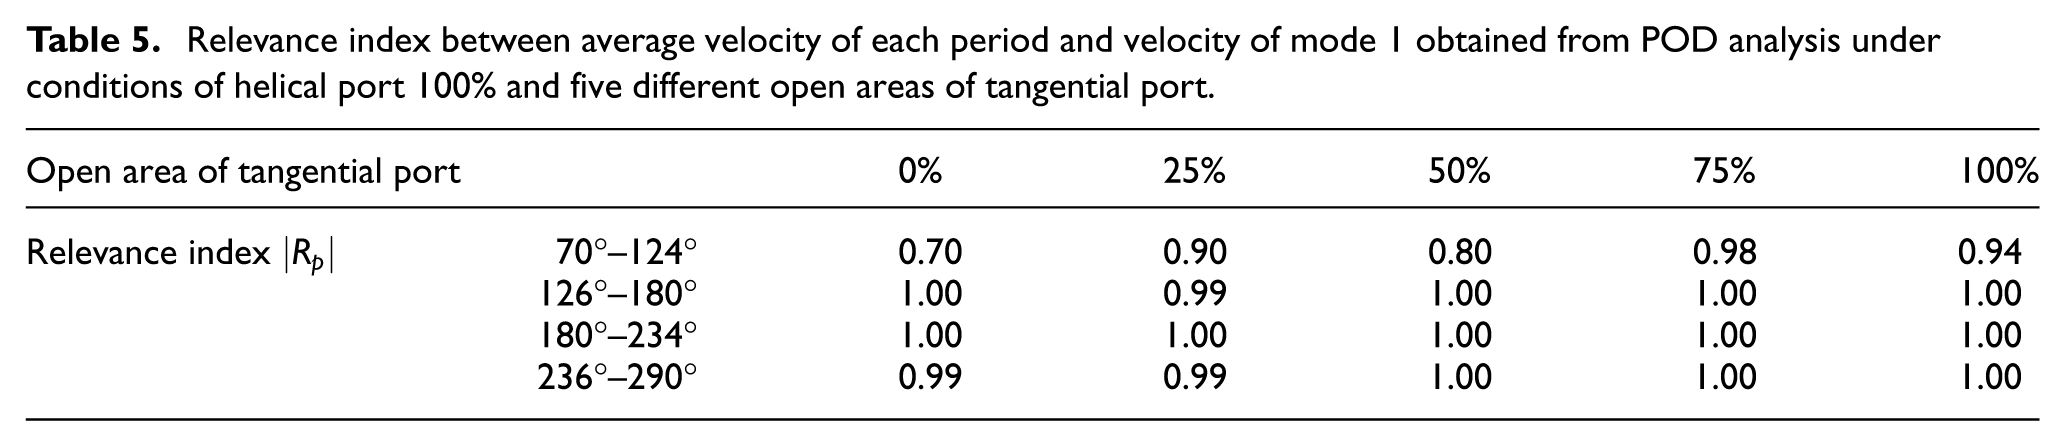
Table 5 shows the relevance index between the ensemble-averaged velocity vectors (mean flow) and the velocity vectors of POD mode 1 for each of the four divided periods from the intake to the compression stroke. As shown in Table 5, the relevance index during the late intake, early compression, and late compression strokes exceeded 0.99 for all port opening conditions, indicating an extremely high correlation between the mode 1 flow and the mean flow. During these periods, the dominant flow structure is clearly defined, and in particular, the high correlation observed in the late compression stroke is attributed to the stable formation of the in-cylinder swirl flow. In contrast, during the early intake stroke, the relevance index was lower than in the other periods under all conditions, but a certain level of correlation between the two flows was still observed. This suggests that during the early intake stroke, turbulent and complex flow motions are present, and unsteady structures that cannot be fully captured by the ensemble-averaged flow remain dominant features. Under the 50% port opening condition, the RI value was slightly lower than those under the adjacent opening conditions. However, the difference was small, and because the variance during this period was as low as 0.013, this variation is considered to result from experimental fluctuations rather than physical differences between the conditions.
Relevance index between average velocity of each period and velocity of mode 1 obtained from POD analysis under conditions of helical port 100% and five different open areas of tangential port.
Evaluation of the velocity vector and streamline maps of mode 2
In this section, the velocity vector and streamline maps of mode 2 obtained from POD analysis are evaluated. Figure 7 shows the velocity vector of mode 2 for each port opening condition, and Figure 8 shows the corresponding streamline maps. As in Figures 5 and 6, (I)–(IV) denote the early/late intake and compression strokes, while (a) to (e) correspond to tangential port openings of 0%–100%. From Figure 7, during the early intake stroke (I), high-velocity components are widely distributed overall, and particularly in the 25%–75% opening conditions (I-b)–(I-d), higher velocities are observed near the helical port. This indicates that the turbulent flow generated by collision and interference of flows from both intake ports inside the cylinder is represented in mode 2. On the other hand, in the compression stroke shown in (III) and (IV), the overall velocity inside the cylinder decreases, and the flow structure of mode 2 no longer exhibits distinct vortex structures. In the streamline maps presented in Figure 8, during the early intake stroke (I), complicated flows similar to those in mode 1 are observed, and no clear rotational structures are formed. This suggests that in mode 2, turbulent components with different phases and scales from those of the mean flow are dominant. During the intake stroke, the flow exhibits strong temporal fluctuations, and mode 2 captures turbulent features that deviate from the mean flow. To further clarify this characteristic, POD analysis was applied to the fluctuating velocity field, defined as (u′(k) = u(k) − 〈u〉), and the resulting streamline maps are presented in Figure 9. As shown in Figure 9, mode 1 of the fluctuating field tends to exhibit a streamline structure similar to that of mode 2 in the total velocity field (Figure 8), suggesting that mode 2 may partially extract the dominant fluctuating components of the flow. In contrast, under conditions (I-d) and (I-e), partial similarity was observed between mode 1 of the total velocity field (Figure 6) and the fluctuating field, indicating that the contribution of mode 1 is also included in the fluctuating components. During the early intake stroke, where turbulence is intensified due to the influence of the intake flow, mode 2 predominantly captures the essential features of the fluctuating structure, while mode 1 mainly represents the mean flow structure but may still contain a portion of the fluctuating components. In the late compression stroke, as seen in Figure 8 (IV-a)–(IV-e), the large-scale swirl structures are formed in mode 1, while only weak, localized asymmetric structures are observed in mode 2, suggesting that mode 2 plays a supplementary role, capturing fine-scale variations or disturbances in the swirl flow. Thus, while the contribution of mode 2 to swirl formation during the compression stroke is small, it captures unsteady flows and local turbulent structures during the intake stroke, revealing flow patterns that cannot be captured by mode 1. In the intake stroke, where the flow exhibits significant temporal and spatial fluctuations, along with structures different from the mean field, POD analysis is an effective method for understanding multi-scale structures.
Streamline maps of POD mode 1 obtained from the fluctuating velocity field during the early intake stroke.
Evaluation of the relevance index between POD mode 2 and turbulence intensity
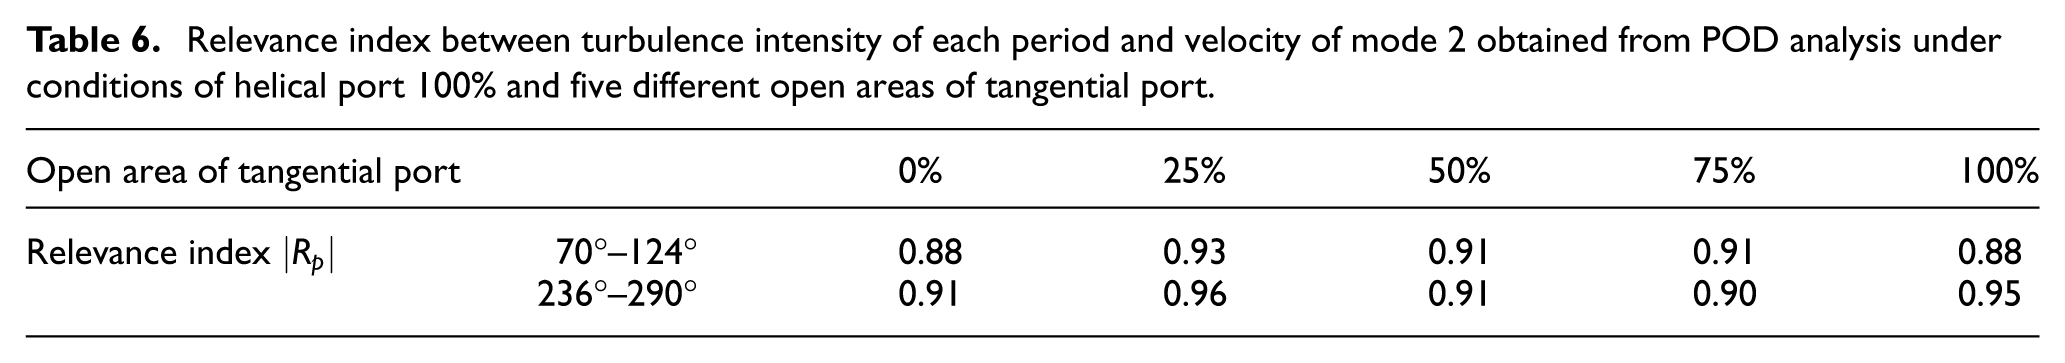
Table 6 shows the relevance index between turbulence intensity and the magnitude distribution of the velocity vectors of POD mode 2 during the early intake stroke and the late compression stroke. Here, the turbulence intensity is defined as a scalar field calculated by taking the root mean square of the difference between instantaneous velocity and the ensemble-averaged velocity. Although the velocity vectors in POD mode 2 contain directional information, the relevance index was calculated based on the spatial distribution of the vector norms to enable comparison with the turbulence intensity. According to the table, the relevance index between POD mode 2 and turbulence intensity ranges from 0.88 to 0.96 under all conditions, indicating a certain degree of correlation. This suggests that POD mode 2 represents structures related to turbulence intensity. On the other hand, since mode 2 may not adequately capture the complex, unsteady flow structures absent from the mean flow, it is necessary to include higher-order modes, starting from mode 3, in future studies to gain a more detailed and comprehensive understanding of these flow structures.
Relevance index between turbulence intensity of each period and velocity of mode 2 obtained from POD analysis under conditions of helical port 100% and five different open areas of tangential port.
Evaluation of Energy Contribution
Figure 10 shows the energy contribution of the higher-order POD modes, representing the proportion of kinetic energy of each mode relative to the total. From the figure, it can be said that in all phases, mode 1 consistently has the highest energy ratio, and as the mode number increases, the energy contribution decreases. Furthermore, comparing the early intake stroke and the late compression stroke, the variance of the energy contribution of mode 1 is 8.52 in (I) and 5.00 in (IV), indicating that in the late compression stroke, the energy contribution of mode 1 remains high across all opening conditions. In the early intake stroke, the proportion of mode 1 is relatively low, while that of mode 2 is relatively high. This suggests that the intake process leads to a significant amount of turbulence. In the late compression stroke, the contribution of mode 1 increases, while the higher order above mode 2 decreases. This indicates that turbulence diminishes during the compression stroke, and as shown in Figures 5 and 6, the swirl flow becomes the dominant flow structure. Under conditions with a larger tangential intake port opening, a higher energy fraction in mode 1 and a lower fraction in mode 2 were observed. This suggests that an increased port opening promotes the formation of a more stable swirl flow structure inside the cylinder, resulting in a concentration of kinetic energy in mode 1, which represents the dominant flow structure in the POD analysis. In contrast, under smaller opening conditions (0% and 25%), the in-cylinder flow becomes more complex, and local flow fluctuations and turbulence components increase, leading to a greater distribution of energy among higher-order modes such as mode 2. Consequently, when the tangential port opening is large and mode 1 is dominant, the in-cylinder swirl is stably maintained, which can be expected to enhance mixture homogeneity and promote flame propagation. Indeed, a previous study 10 reported that at moderate swirl ratios, the interaction between the swirl and the spray increases turbulence intensity and promotes soot oxidation in the later stage of combustion, thereby contributing to improved combustion efficiency and emission characteristics.
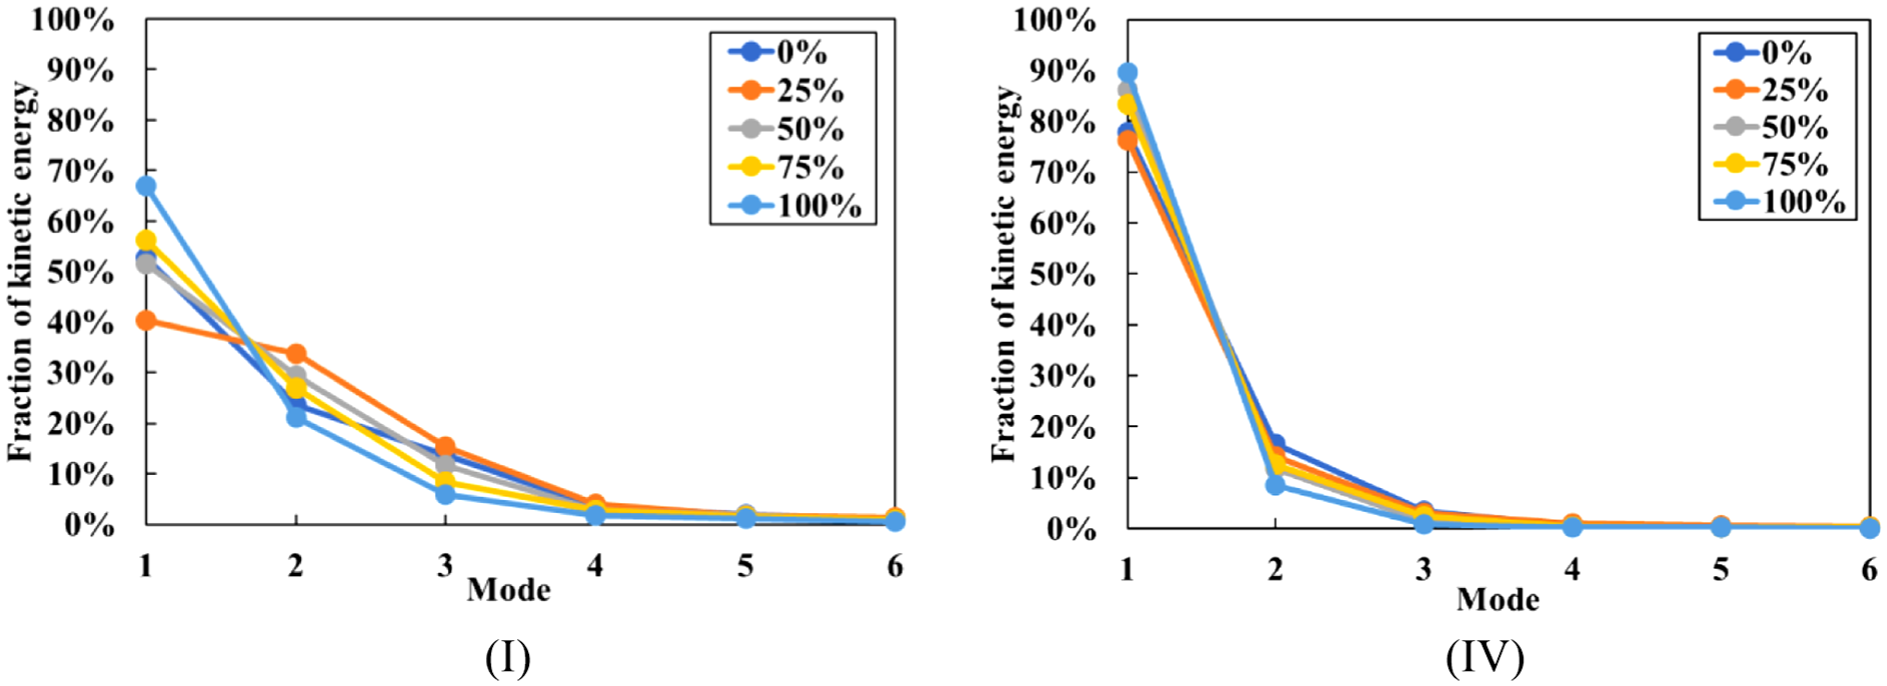
Fraction of kinetic energy of modes 1–6 obtained from POD analysis showing crank angles (I) 70°–124° and (IV) 236°–290° under conditions of helical port 100% and five different open areas of tangential port.
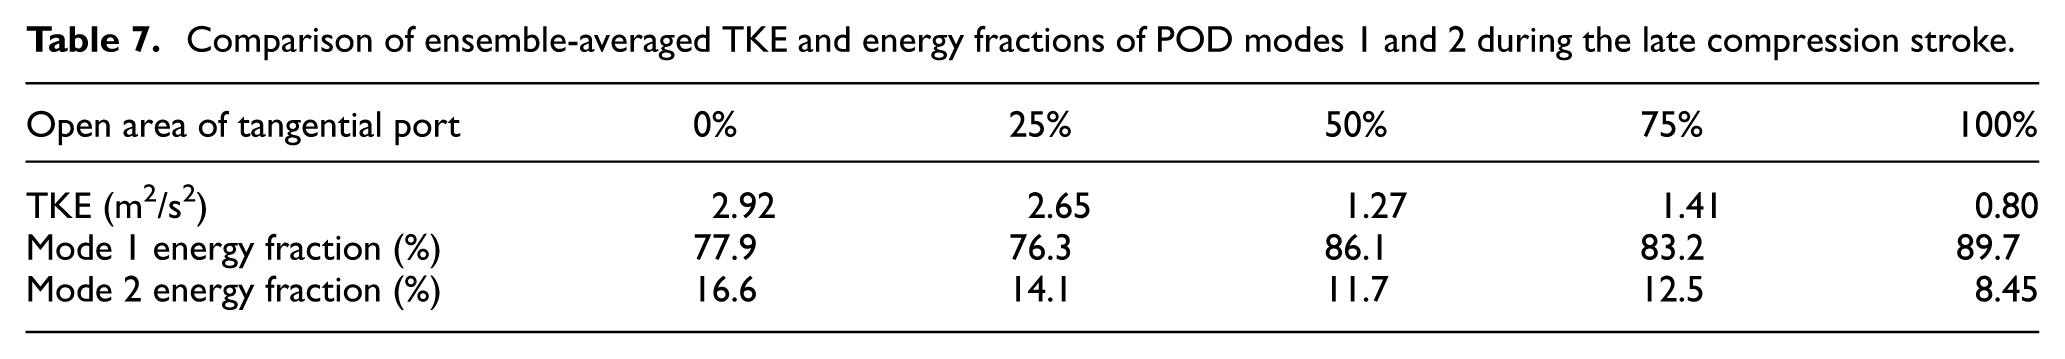
Table 7 compares the ensemble-averaged TKE, averaged over the crank angle range during the late compression stroke, with the energy fractions of POD modes 1 and 2. It was observed that conditions with a higher energy fraction in mode 2 tended to exhibit higher TKE values, whereas those with a higher fraction in mode 1 showed a tendency toward lower TKE. These results indicate that mode 2 effectively represents the intensity of in-cylinder turbulence, while mode 1 corresponds to the development of swirl flow. Therefore, the POD results obtained in this analysis are considered to appropriately reflect the key flow characteristics of swirl and turbulence that influence combustion.
Comparison of ensemble-averaged TKE and energy fractions of POD modes 1 and 2 during the late compression stroke.
Conclusion
The effect of tangential intake port opening on in-cylinder flow structures during the intake and compression strokes of a CI engine was investigated through a combination of PIV and POD. Planar velocity fields were measured using PIV under conditions in which the opening area was varied to 0%, 25%, 50%, 75%, and 100% by using different gaskets, and POD was applied in the crank angle direction using the obtained velocity data. From the evaluation of velocity vectors, streamlines, relevance index, and energy contribution, the following important findings were obtained.
The velocity vector and streamline maps of mode 1 were evaluated. It was confirmed that when the tangential port opening was 25% or more, swirl flow was formed during the compression stroke. On the other hand, it was shown that complicated flow structures were dominant during the intake stroke. These flow structures were consistent with the ensemble-averaged flow structures evaluated in our previous study. Furthermore, the relevance index between mode 1 and the ensemble-averaged flow was evaluated, and a very high correlation was observed during the late compression stroke, while a certain level of correlation was also confirmed during the intake stroke. From these results, it can be said that, particularly during the compression stroke, mode 1 almost completely captures the dominant structure of the mean flow.
The velocity vector and streamline maps of mode 2 were evaluated. During the intake stroke, complex disturbances thought to be caused by interference of flows from the intake ports were extracted. During the compression stroke, as the in-cylinder velocity decreased and structures different from the mean flow were observed, mode 2 was considered to play a supplementary and fine-structural role relative to the mean flow. Evaluation of the relevance index between the magnitude of the velocity vectors of mode 2 and turbulence intensity showed a certain level of correlation under all conditions, indicating that mode 2 captures structures related to turbulence intensity.
From the analysis of energy contribution, it was shown that in the early intake stroke, the energy distribution of mode 1 varied widely, and complicated flows represented by mode 2 and higher modes were dominant, whereas in the late compression stroke, the energy contribution of mode 1 was consistently high, indicating that a stable swirl structure was dominant. Furthermore, it was found that a larger tangential port opening results in a greater concentration of energy in mode 1, indicating enhanced stability of the in-cylinder swirl flow.
Based on these results, it was confirmed that POD is effective for capturing the temporal variation and dominant structures of in-cylinder flow, which is particularly useful as an analytical method for quantitatively evaluating unsteady flows. In future work, further analysis of higher-order modes from mode 3 onward is expected to provide a deeper understanding of additional flow structures and their physical significance. In addition, by conducting PIV measurements and analyses on multiple planes, we plan to further clarify the detailed three-dimensional flow structures.
Footnotes
Acknowledgements
The authors would like to thank Kohei Hamada and Tong Zhao for their technical support.
Author contributions
Conceptualization: M.I. and T.S.; data curation: M.I., H.U. and T.S.; formal analysis: M.I.; funding acquisition: M.I. and T.S.; investigation: M.I., E.Y., H.U., Y.Y., M.W., W.A. and T.S.; methodology: M.I. and T.S.; project administration: M.I. and T.S.; resources: M.I. and T.S.; software: H.U. and Y.Y.; supervision: M.I. and T.S.; validation: M.I., E.Y. and T.S.; visualization: M.I., E.Y. and T.S.; writing—original draft: M.I., E.Y. and H.U.; writing—review and editing: M.I., E.Y., H.U., M.W., W.A. and T.S. All authors have read and agreed to the published version of the manuscript.
Funding
The authors received no financial support for the research, authorship, and/or publication of this article.
Declaration of conflicting interests
The authors declared no potential conflicts of interest with respect to the research, authorship, and/or publication of this article.