
Abstract
Recent development of hydrogen (H2) internal combustion engine (ICE) technologies has demonstrated that they produce zero CO2 and ultra-low NOX emissions without aftertreatment. Therefore, H2 ICE is well suited as a sustainable zero-carbon thermal power unit towards the net-zero target in the future. Increasing the compression ratio (CR) in IC engines can improve the indicated thermal efficiency (ITE). However, in spark ignition (SI) engines using gasoline, the CR is typically limited to around 10:1 due to knocking combustion. Hydrogen, with its higher autoignition temperature and octane number, can be used with a higher CR. This study aims to experimentally assess hydrogen as a direct replacement for gasoline in highly boosted single-cylinder SI engines with different CRs by swapping engine pistons. Two sets of experimental testing have been conducted at various engine speeds. Starting from a lambda (λ) sweep test involved leaning out the combustion to reach the engine stability-operating limits. The second test involved conducting a load sweep test on every CR at various loads to get the engine’s maximum in-cylinder pressure limits. The results indicate that, under the synergistic restriction of the engine strength and the lean-burn limitation, there is a crucial trade-off between peak and maximum engine power with various CR. Specifically, a higher compression ratio (i.e. CR = 12.39) resulted in a 5% increase in ITE compared to CR = 9.27. However, the lower compression ratio increased the maximum engine torque by 3.50 bar of indicated mean effective Pressure (IMEP). In addition, although hydrogen can remain stable combustion across a broad range of lambda and operating loads, the NOX emissions increased with CR, due to the higher combustion temperature. These findings provide valuable insight into hydrogen engine applications and improve the understanding of SI hydrogen engine’s performance and development.
Introduction
Traditional hydrocarbon fuels, like gasoline and diesel, emit significant greenhouse gases (CO2) and pollutants (CO, HC, NOX). Consequently, strict emission regulations have been adopted, such as the USA’s Executive Order 14037, 1 aiming for 50% of new passenger and light-duty vehicles to be zero emissions by 2030, and the EU’s Regulation 2023/851, 2 allowing only zero-emissions vehicles from 2035.
Battery electric vehicles (BEVs) are increasingly adopted for passenger cars and some other light-duty vehicles. But they are still suffering from the limited range, refuelling time, cost and environmental concerns. 3 Whilst hydrogen Fuel Cell Electric Vehicles (FCEVs) can overcome such limitations, they need high hydrogen purity and they are extremely expensive and not sufficiently durable for extended operations. 4
Internal combustion engines adopted to use biofuels and alcohol-based fuels can reduce emissions from the existing vehicle but may not align with long-term zero emissions vehicle (ZEV) goals.5–8 Zero-carbon fuels like hydrogen (H2) and ammonia (NH3) present an alternative to petroleum-derived fuels, eliminating the production of hydrocarbons (HC), carbon monoxide (CO), and carbon dioxide (CO2) during combustion. 10 Production of hydrogen will be from renewable sources such as solar and wind.9–11 Additionally, hydrogen can be integrated into existing spark ignition (SI) engines with essential modifications, for example, the fuel injection system, intake system, and chamber design. And H2 can offer better air-fuel mixing due to its high molecular diffusion. Furthermore, hydrogen has higher flame speed and knock resistance compared with conventional petrol fuel. 12
Hydrogen engines can operate in an ultra-lean condition without additional ignition energy due to the high chemical reactivity (i.e. the high adiabatic flame speed and the wide flammability range), yielding low-temperature and less NOX combustion.13–15 Using hydrogen in SI engines is still a challenge. Specifically, its rapid combustion can lead to excessive pressure rise and peak cylinder pressure, potentially harming engine durability. 16 Hydrogen can lead to abnormal combustion issues, such as backfire, preignition and knock, particularly under stoichiometric conditions.17,18 Lean combustion can help prevent these issues, especially at air-fuel ratios above 2. 19 However, this approach can limit power output, making it less suitable for high-density power applications. Thus, in spite of a high Research Octane Number (RON) of hydrogen, hydrogen is also expected to show a significant sensitivity of compression ratio to achieve steady and high-efficiency combustion in SI engines.
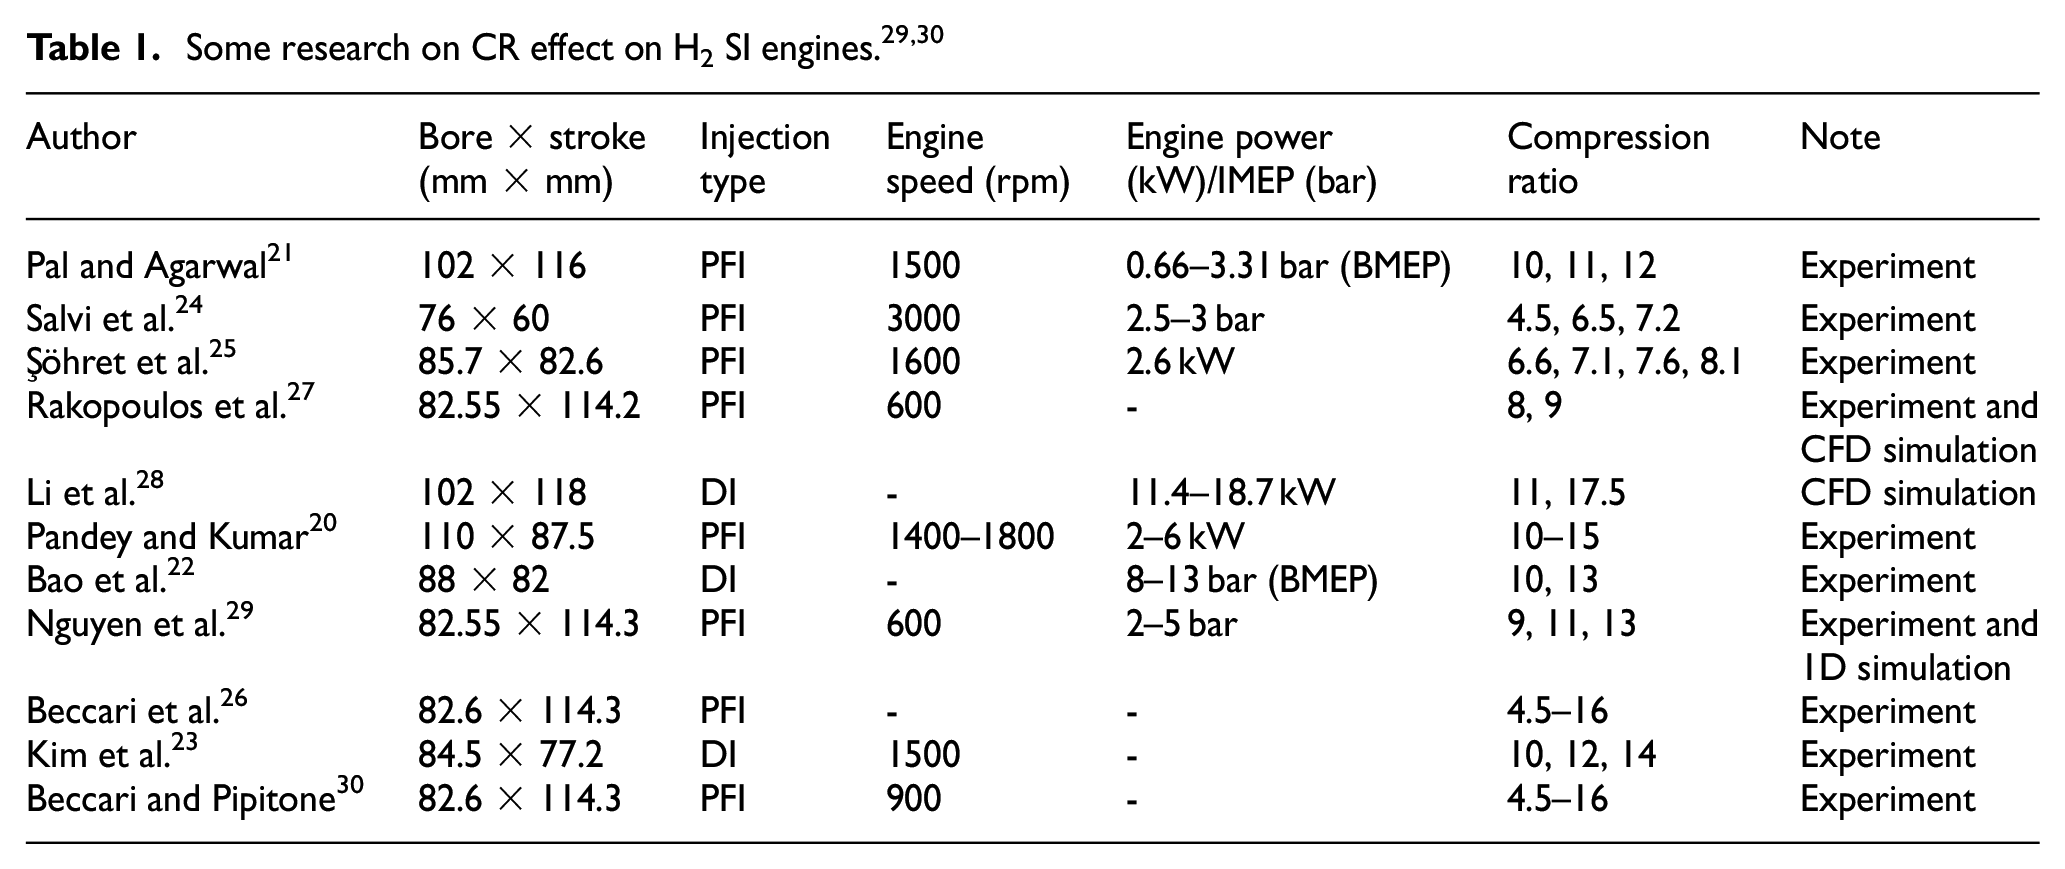
There have been some experiments and numerical studies focussing on the compression ratio (CR) effect on hydrogen. Pandey and Kumar 20 investigated how compression ratios affected the performance of a hydrogen port fuel injection engine. Their study found that using hydrogen with a high compression ratio (CR = 15) and a moderate equivalence ratio around 0.7 improves performance, resulting in higher brake power and BTE compared to gasoline. Additionally, with a high compression ratio (CR = 15) and an equivalence ratio of 0.9, the CA10 and CA10–CA90 values are minimised, leading to faster combustion and higher peak pressure. Pal and Agarwal 21 conducted an experiment on a laser-ignited H2 engine in low-load conditions with various CRs. They found that the engine performance enhanced with CR increasing, while the in-cylinder pressure and rising of pressure will increase for higher CR. The experiment from Bao et al. 22 shows a similar result, that the brake thermal efficiency has increased from 34% to nearly 41%, with the CR increased from 10 to 13. Kim et al. 23 examined the direct-injection H2 SI engine performance under 1500 rpm with CR 10–14. The results indicate that the thermal efficiency is increased with CR raising, while the spark timing should be retarded to avoid knocking and NOx emission. However, the experiments from Salvi et al. 24 indicate that using EGR is most suitable for higher CRs to reduce NOx, which can avoid the penalty reduction of power output by retarding spark timing. In addition, increasing the CR can reduce the backfire due to the lower residual gas fraction. A further experiment by Şöhret et al. 25 demonstrated that the brake exergy efficiency also increased with CR increasing. More detailed experiments in a hydrogen-fuelled Cooperative Fuel Research (CFR) engine were carried out by Beccari et al. 26 The results revealed that the ignition delay, that is, the spark timing to CA5, is decreased with CR increasing, while the rapid combustion duration, that is, CA5 to CA90, is increased with CR increasing. Consequently, the total combustion duration, that is, the spark timing to CA90, is decreased with CR increasing. However, the thermal efficiency showed an inverse trend, greatly reduced with higher CR, potentially due to increased heat loss at higher CR conditions. The simulation from Rakopoulos et al. 27 indicated that the heat loss in an H2 CFR engine increased with CR increasing from 8 to 9 under load-load conditions. Additionally, the knock-free minimum lambda (λ) of H2 may have a high sensitivity to CR. The knock-free minimum λ is increased from 1.3 to 2, with corresponding CR increasing from 4.75 to 14, based on Beccari et al. study. Similarly, the CFD simulation by Li et al. 28 also revealed that a higher CR can amplify the effect of the λ on knock. Table 1 lists some research on CR effect on H2 SI engines in the past 10 years.
According to the above review, research on the effect of CR in SI hydrogen engines remains limited. Most of the experiments were conducted at specific operating points, such as fixed engine speed and engine load or a limited operating range. This work aims to conduct a systematic experimental study in a direct-injection H2 light-duty SI engine under wide engine operating points with different compression ratios. In particular, the engine performance was tested with an engine load covering 4–16 bar under 1500, 2000, and 3000 rpm, and a lambda sweep was also investigated from λ = 1 to λ = 4. The comprehensive results, including performance maps and combustion characteristic analysis, will be presented with a wide range of engine speeds and lambda sweeps to clarify the impact of CR. The compression ratio will switch with a wide range, for example, from 9.27 to 12.39. The combustion stability, crucial in H2 combustion, will be examined, focussing on cycle-to-cycle variation and the misfire tendency. Furthermore, the emission performance, including NOX and H2 slip (which is the first time to be considered), will be investigated and result in maps with various CR conditions. In the following, the engine setup, experiment operating range, results and discussion, and conclusions will be sequentially presented in Sections 2–4.
Experimental setup
The operation of the test cell using hydrogen mandates a secure and enduring location for housing hydrogen bottles devoid of any potential hazards within the test cell. To address this prerequisite, the devised solution involved securely isolating and adequately ventilating the bottles outside the test cell within an enclosed area that lacks a ceiling and is encircled by fire shields.
Furthermore, it is prudent to station all supply line ancillaries, including pressure regulators, sensors, flow metres, and shutdown valves, external to the test cell. This approach effectively reduces the number of interconnections and extensively mitigates the risk of inadvertent leakage within the test cell.
Another necessary measure is the addition of an Atmosphere Explosible (ATEX) ventilation system to the test cell. This system, featuring a flexible hood, maximises the air recirculation. In addition, multiple hydrogen sensors are installed in the ceiling and on the engine, which are linked to an automated shutdown Programmable Logic Controller (PLC) system. This system facilitates an automated response mechanism through line interruption and subsequent nitrogen purging of the hydrogen supply line upon detecting hydrogen levels surpassing 2%. The automated shutdown PLC system within the test cell plays a crucial role in preventing potential intake backfire and hydrogen fire. It triggers the crankcase ventilation system to prevent hydrogen accumulation.
Engine setup
The diagram in Figure 1 illustrates the single-cylinder SI engine based on MAHLE Powertrains’ downsized SI engine design. The engine is set up to operate with central direct injection and port fuel injection of hydrogen or gasoline fuels. An adaptable electronic control unit (ECU) from MAHLE enables a seamless transition between hydrogen and gasoline operation with minimal adjustments to the control system. In the current experiment, a direct outwardly-opening hydrogen injector from Phinia (DI-CHG10) was utilised, allowing hydrogen injection ranging from 10 to 40 bar. Also, this testing platform supported multiple injection positions as it could adopt PFI and DI; however, in this study, the DI was only used to demonstrate the impact of the CR sweep with full elimination of the backfire phenomena. The crankcase ventilation system has been modified to address potential hydrogen-related risks by implementing a forced ventilation system with a hydrogen sensor in the feedback loop. If the hydrogen concentration exceeds 2%, the system will automatically reduce the hydrogen supply, as depicted in Figure 1.
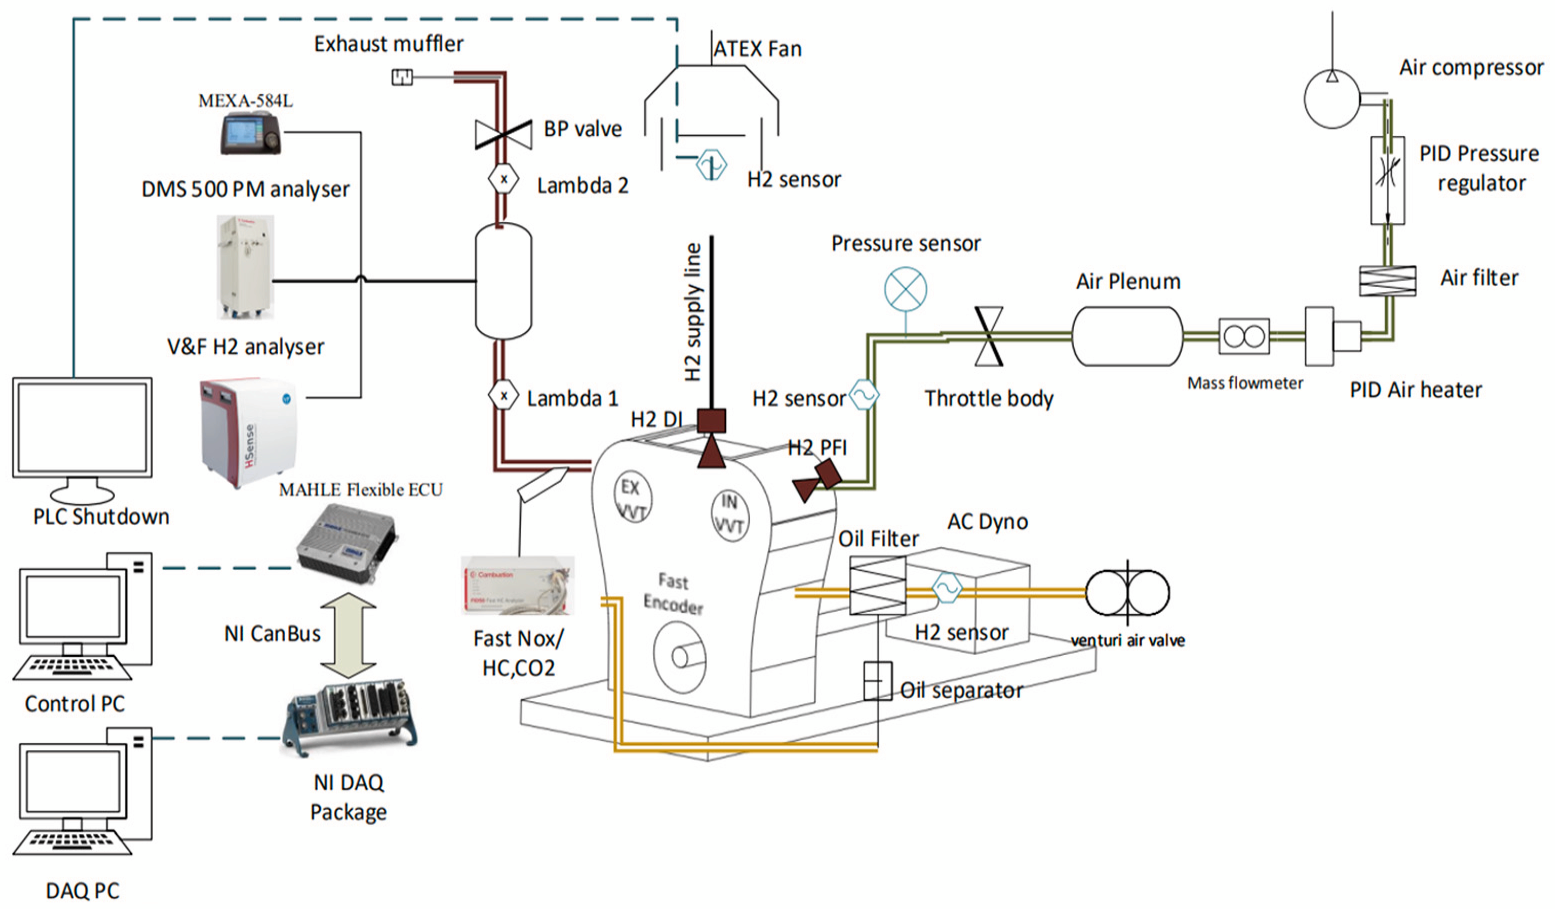
Test cell diagram. 31
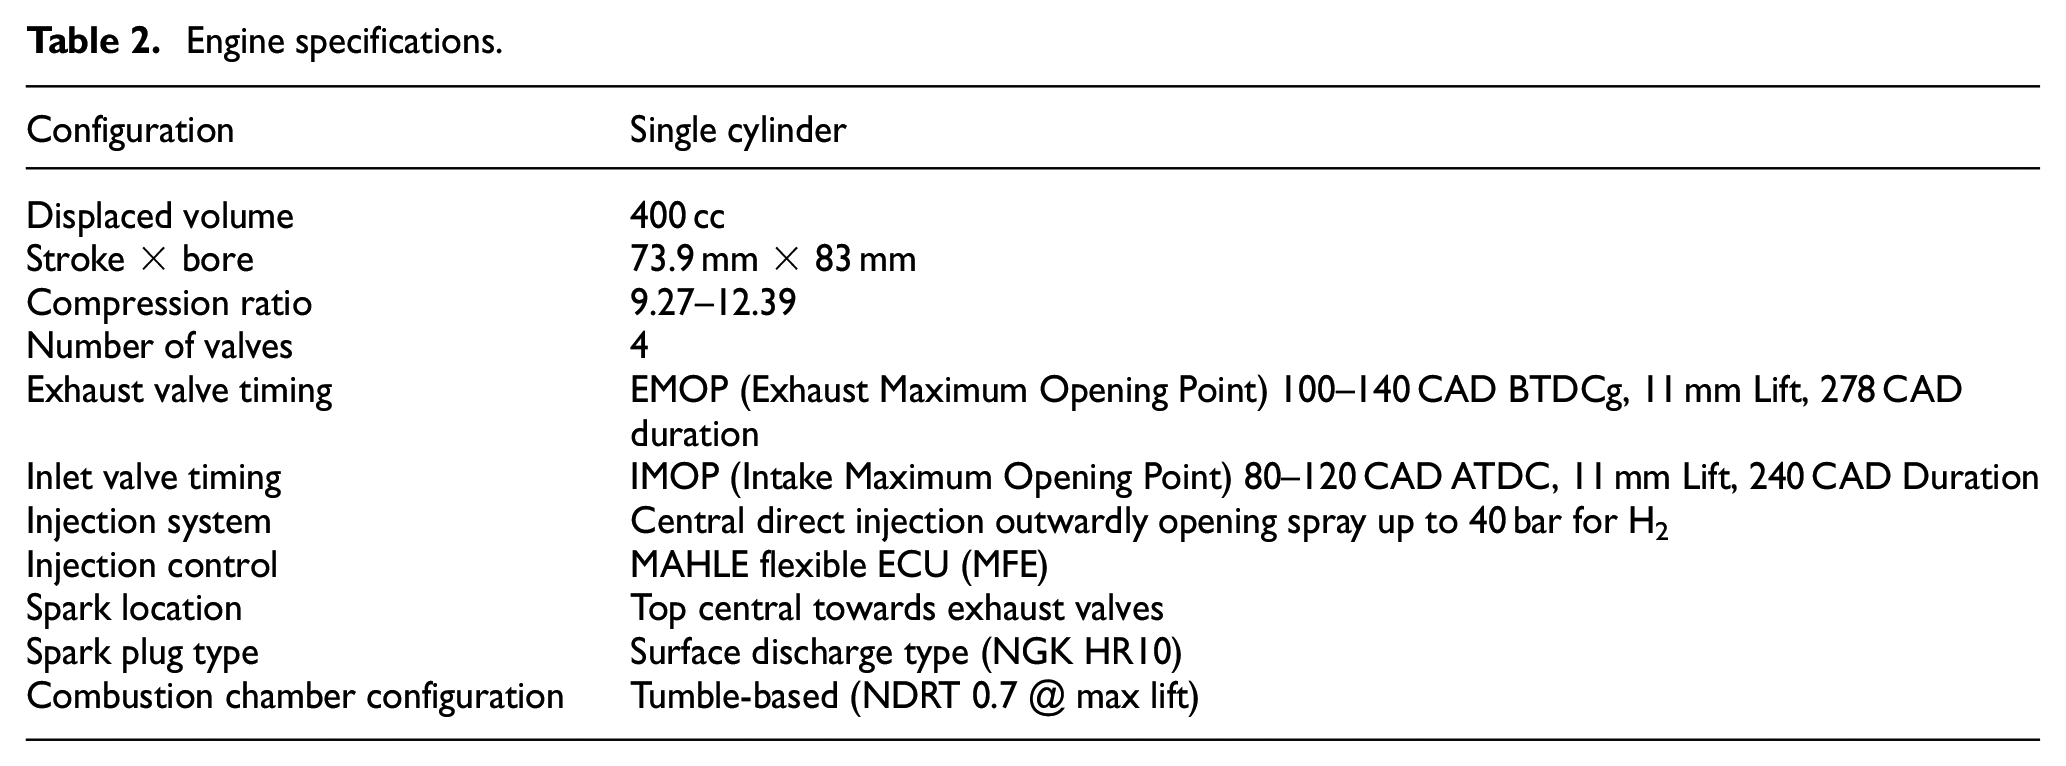
The single-cylinder engine is equipped with fully variable valve timing for both the intake and exhaust cams, providing a high level of precision to determine the optimal overlap configuration for each injection system. Furthermore, the ECU allows for adjusting the injection angle and Pressure, offering the ability to modify the start or end of the injection process as needed with utmost precision. The engine also features a self-contained boosting system with a maximum boost pressure of 4 bar gauge and an external proportional integral derivative (PID) heating element to regulate intake pressure and temperature accurately. The main engine specifications can be found in Table 2.
Engine specifications.
Hydrogen supply system
The hydrogen supply system starts from the cylinders in an isolated area outside the lab. Subsequently, hydrogen flows through a pressure regulator, reducing the hydrogen pressure from the high-pressure cylinder to a nominal pressure of 40 bar. Following this, it passes through a pressure sensor and a safety solenoid before reaching the hydrogen flowmeter. In the subsequent stage, another pressure regulator further reduces the Pressure within the 2–30 bar range, enhancing precision. The strategic placement of the hydrogen flowmeter upstream of the second pressure regulator aims to mitigate potential pressure drops induced by the flowmeter, thus safeguarding the final Pressure delivered to the injector. The secondary supply panel is equipped with an additional pressure sensor and a safety solenoid valve, which play a crucial role in isolating the hydrogen fuel line and reducing the likelihood of H2 slips in the event of hydrogen leakage, as having multiple isolation solenoid valves minimises the amount of the total hydrogen during a leakage event and reduces the hazard of the fire, thereby ensuring the system’s reliability. Upon ingress into the test cell, the hydrogen line is encased within an additional tube that upholds a vacuum to prevent hydrogen leakage into the external environment. Furthermore, the entire tube incorporates a pressure sensor that activates an automatic nitrogen purge, thereby ensuring comprehensive isolation of the hydrogen line. This configuration is visually depicted in the accompanying Figure 2.
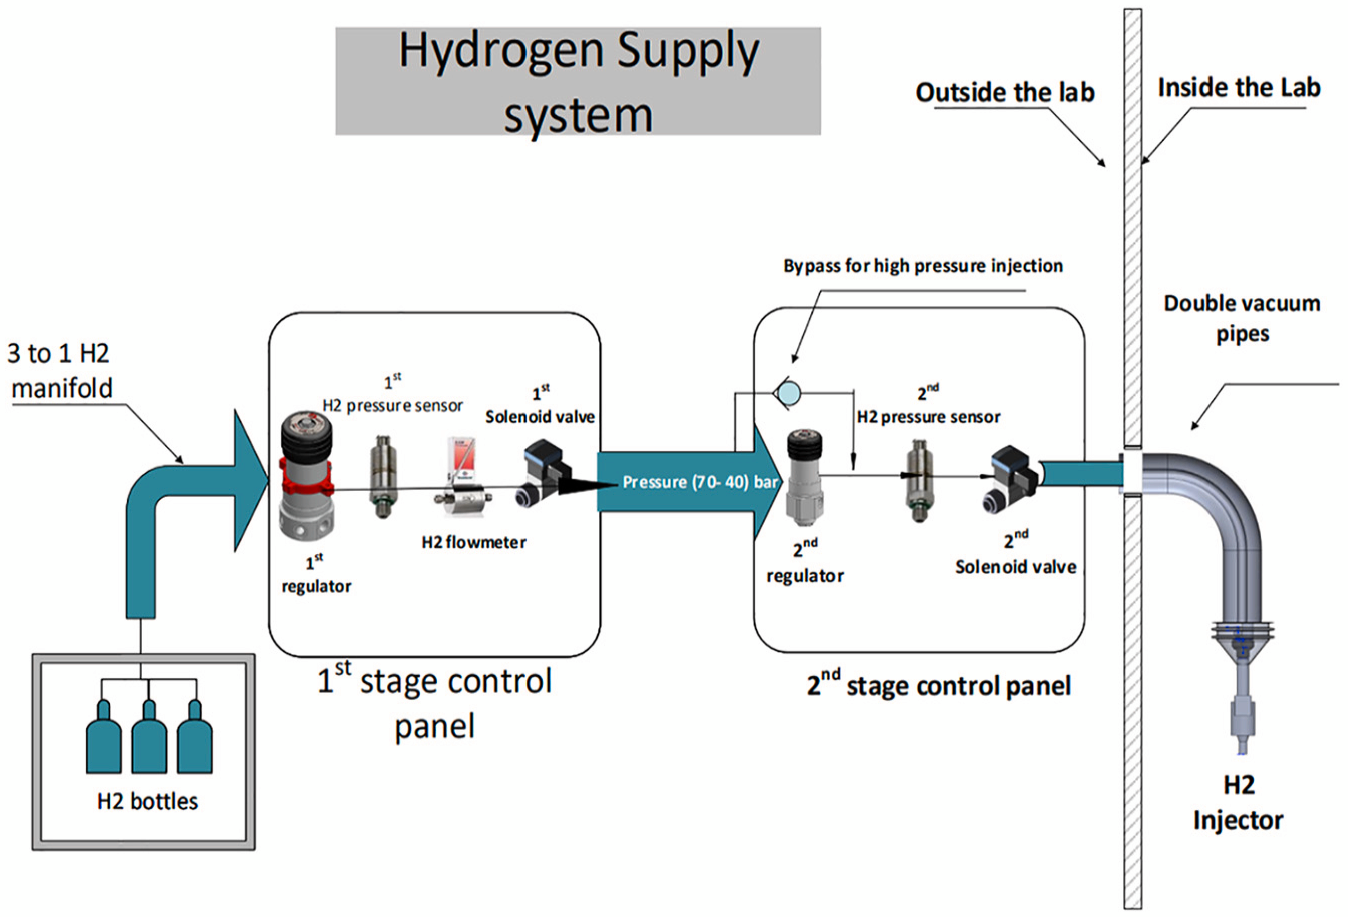
H2 supply line. 32
Emission analysers
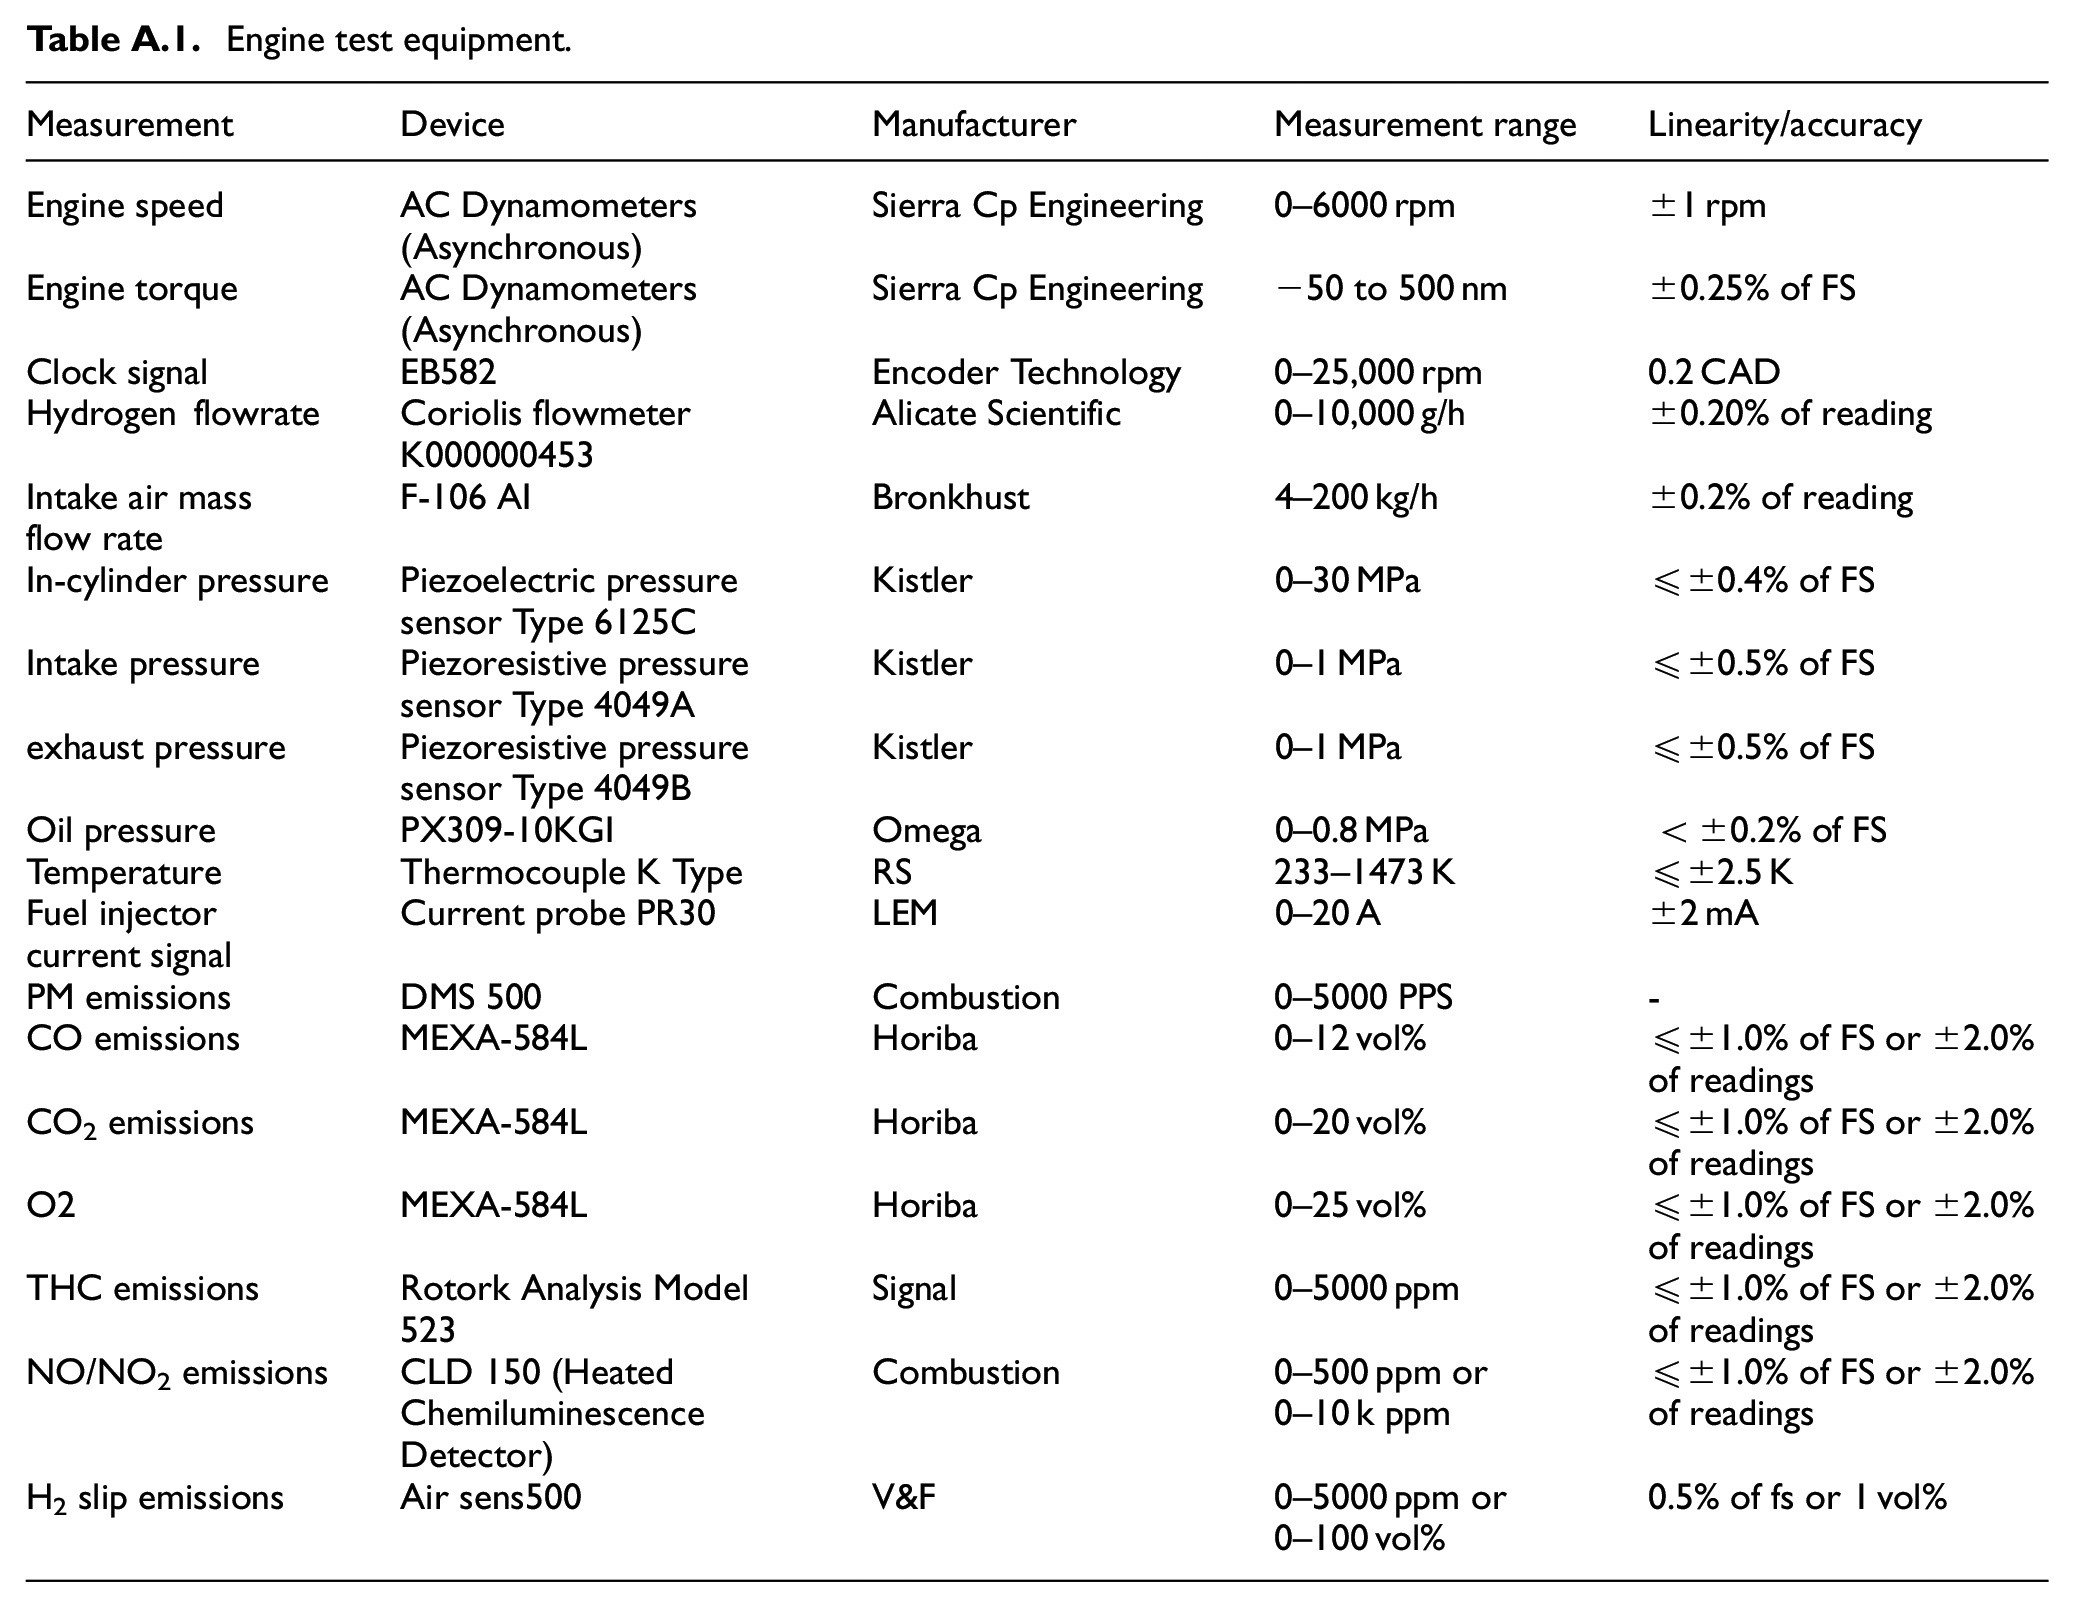
Monitoring engine-out emissions to comprehend engine emission patterns using various efficient tools is imperative. The steady-state CO/CO2 and oxygen (O2) were measured by a HORIBA (MEXA-584L). Combustion DMS 500 measures particulate matter (PM) emissions, providing fast readouts of the number and size of the particles on a cycle-by-cycle basis. Additionally, a Rotork Analysis model 523 flame ionisation detection (FID) analyser is employed to analyse steady-state unburnt hydrogen carbon (uHC) emissions. A fast NOx emission analyser is installed at the back of the exhaust valves with a 1.2-m sampling pipe to minimise the delay of NO and NO2 measurements. Finally, the exhaust pipe is connected to the V&F emission analyser to measure the concentration of H2 in the exhaust gas (H2 slip) Further details on the equipment list are shown in Appendix Table A1.
DAQ system
A bespoke data acquisition (DAQ) system monitored and recorded 138 signals. Depending on the sensor priority and reading value, it was configured to apply a specific sampling rate for each signal. The instantaneous in-cylinder transducer (centrally mounted), intake pressure sensor (45° mounted to the intake port with 13 cm offset from the intake valves), and exhaust pressure sensor (16 cm offset from the exhaust valves and water cold) were recorded in the crank domain with a resolution of 0.25 sample/CAD, while other temperature sensors can operate in the regular time domain. To accommodate this, a hybrid selection of NI cards, including fast and standard USB NI cards, was chosen for their ability to auto-synchronise in the NI-based combustion analysis software by Valieteck. Furthermore, the NI to CANBus communication card handles signal transfers from the ECU.
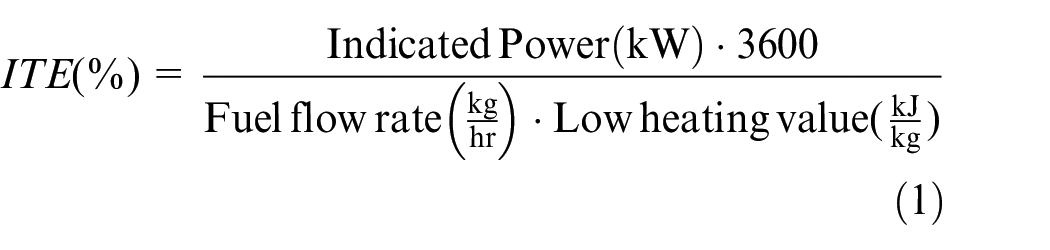
The real-time thermal efficiency is calculated by multiplying the fuel’s lower heating value by the hydrogen flow rate and dividing by the indicated power, determined from the in-cylinder pressure sensors and IMEP, as shown in equation (1).
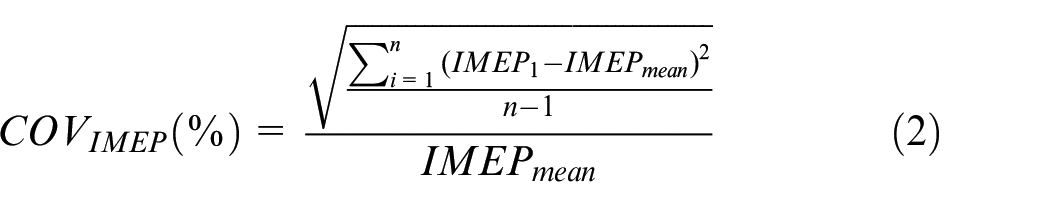
The presence of combustion cyclic variability within an internal combustion engine results in periodic fluctuations in the engine’s torque production and emissions. The assessment of combustion cyclic variability frequently involves using the coefficient of variation of indicated mean effective Pressure (COVIMEP) as a metric to evaluate the stability of combustion, as per equation (2).
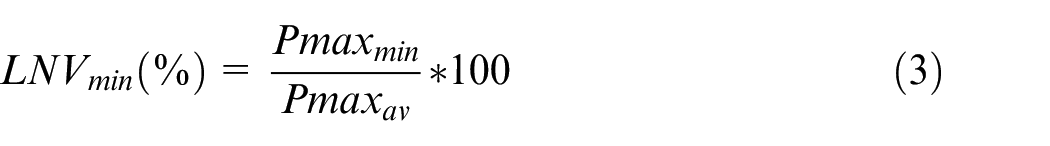
The lower net value (LNV) is a parameter for identifying partial combustion or misfiring instances, the main causes of cyclic variation. The LNVmin value is calculated based on the peak pressure over the 300 cycles to show the load stability over the steady-state conditions, as shown in equation (3).
The DAQ system utilises the Bandpass, Rectify, Integrate, Compare (BRIC) methodology to ensure precise detection of engine knocking, as articulated in equation (4). This method involves carefully configuring calibration windows, which are critical for minimising both electrical noise and mechanical vibrations that could distort the signal. Users must define appropriate cutoff frequencies for the second-order Butterworth Infinite Impulse Response (IIR) bandpass filter to facilitate effective filtering. This filter allows the fundamental frequencies associated with engine knocking to pass through while rejecting unwanted background noise. The design of the Butterworth filter ensures a maximally flat frequency response in the passband, providing an optimal balance between sensitivity to knocking frequencies and suppression of adjacent frequency components. By applying this systematic approach, the DAQ system achieves enhanced accuracy in identifying incidences of engine knock, which is vital for performance monitoring and engine protection. Additionally, users must input a threshold value to determine when the unprocessed knock intensity is classified as knocking. The threshold is set to 4 bar, and the cutoff frequencies for the bandpass filter are 5 kHz.

Test methodology
The experimental testing consisted of running the single-cylinder direct injection H2 engine with three pistons to achieve three different compression ratios. Every CR uses exactly similar central direct injection at three different engine speeds (1500, 2000, and 3000 rpm), engine loads, and different lambda settings. The outcomes of the experiments are plotted as a 2-D map of performance and emission data for a comprehensive analysis of each CR. As shown in Figure 3, the engine’s CR was adjusted by modifying the piston bowl volume, leading to target CR = 9.27, 11.65, and 12.39. Specifically, the clearance volume was altered through changes to the piston bowl design, where a larger bowl volume leads to a greater clearance volume, ultimately yielding a lower CR.
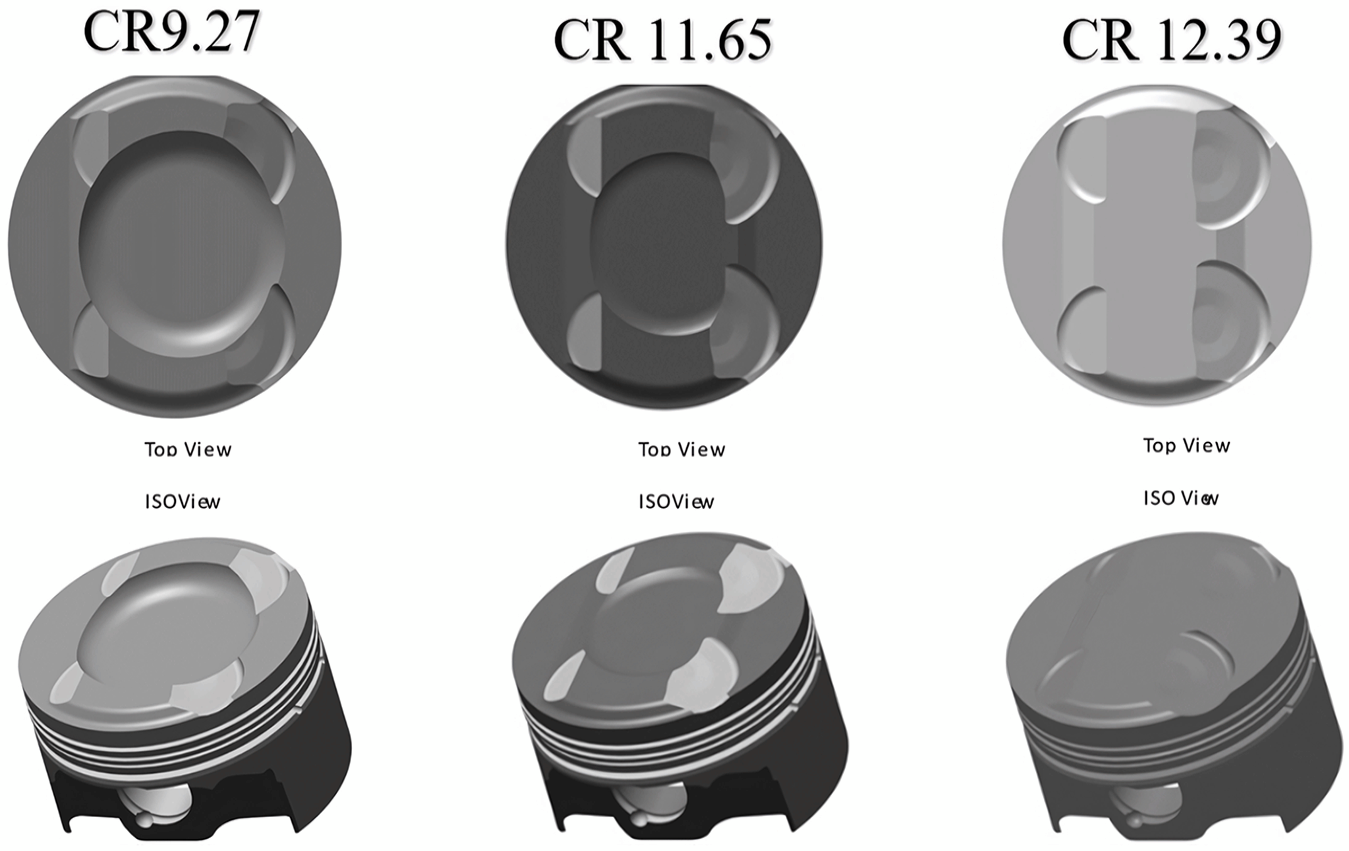
3D model of the pistons used for achieving different CR.
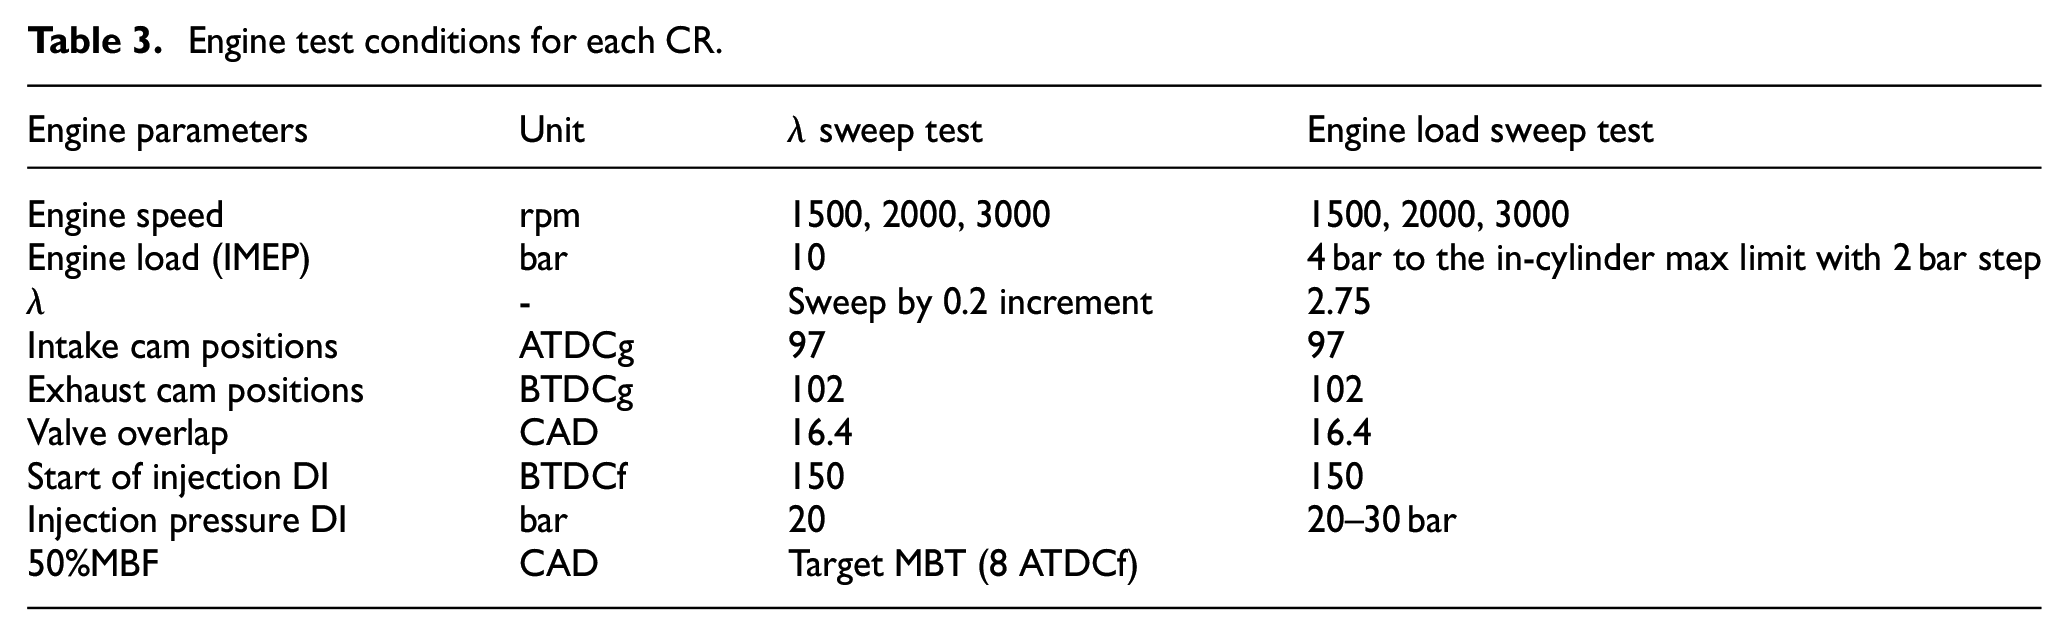
Table 3 summarises the engine test conditions for each CR with two main investigated experiments, that is, λ sweep and engine load sweep tests. The first experiment (λ sweep) investigated the effect of a wide range of λ values from near stoichiometric to maximum lean-burn limits. It was conducted at a fixed engine load of 10 bar net IMEP with the fixed intake and exhaust cam positions of 97 CAD ATDCg and 102 CAD BTDCg, respectively, to simulate the lambda sweep at mid-load with fixed cam timing to avoid any valve overlap and hence scavenging effect. The second experiment (engine load sweep) was conducted for a range of engine loads from IMEP = 4 bar to the maximum engine operation point for each CR at λ = 2.75, which represents the low engine-out NOX region, with the fixed intake and exhaust cam positions of 97 CAD ATDCg and 102 CAD BTDCg, respectively. Also, all testing points were captured at the MBT by targeting 50%MBF at 8° ATDCf as shown in both Appendix Figures A1 and A2 for both tests.
Engine test conditions for each CR.
The intake temperature was fixed at 38°C using an inline air heater with PID control to reduce the tolerance to 0.3°C for accurate control. The oil and water coolant temperatures were set at 90°C with external heaters, and PID correlates with a 3°C variation.
The DI injection pressure and timing were fixed at 20 bar injection and 150 CAD BTDCf for λ sweep experiments. Nevertheless, due to combustion stability control, the injection pressure was reduced to 10 bar for engine loads below 8 bar IMEP in the engine load sweep test. The limits of the highest average in-cylinder Pressure and maximum pressure rise rate (Rmax) were set to 120 bar and 6 bar/CAD, respectively. On the other hand, a COVIMEP of 3% was used as the limit for stable engine operation. The combustion phasing (50% MFB) was set between 8 and 10 CAD ATDCf for optimal combustion timing.
The λ values were measured by two wide-band relative air-fuel ratio sensors in the exhaust line, calibrated with measurements from the Horiba emission analyser. Additionally, the measured lambda value was checked against the calculated lambda based on the measured air flow rate to the hydrogen mass flow rate with the hydrogen slip subtracted.
Figure 4 shows the test points captured for both tests with different CRs, as the lambda sweep test has been covering the lambda from stoichiometric combustion to the maximum lean operation up to lambda 4. The maximum and the minimum CRs have completed the full lambda sweep in the near stoichiometric combustion as there was no benefit running near stoichiometric and due to the higher H2O emission that was produced at this point based on the previous study. 33 This greatly affected the emissions analysers; the lambda test was restricted from 1.65 to 1.5. In the load sweep test, the load was swept based on the net IMEP from 4 bar to maximum load with maintaining MBT and stopped at the Pmax engine limitation of 120 bar while the CR load sweep ran up to the Pmax. It’s worth noting that the other engine limitations, such as Rmax and Engine knock, were also monitored to show the indications of CR sweep at higher load.
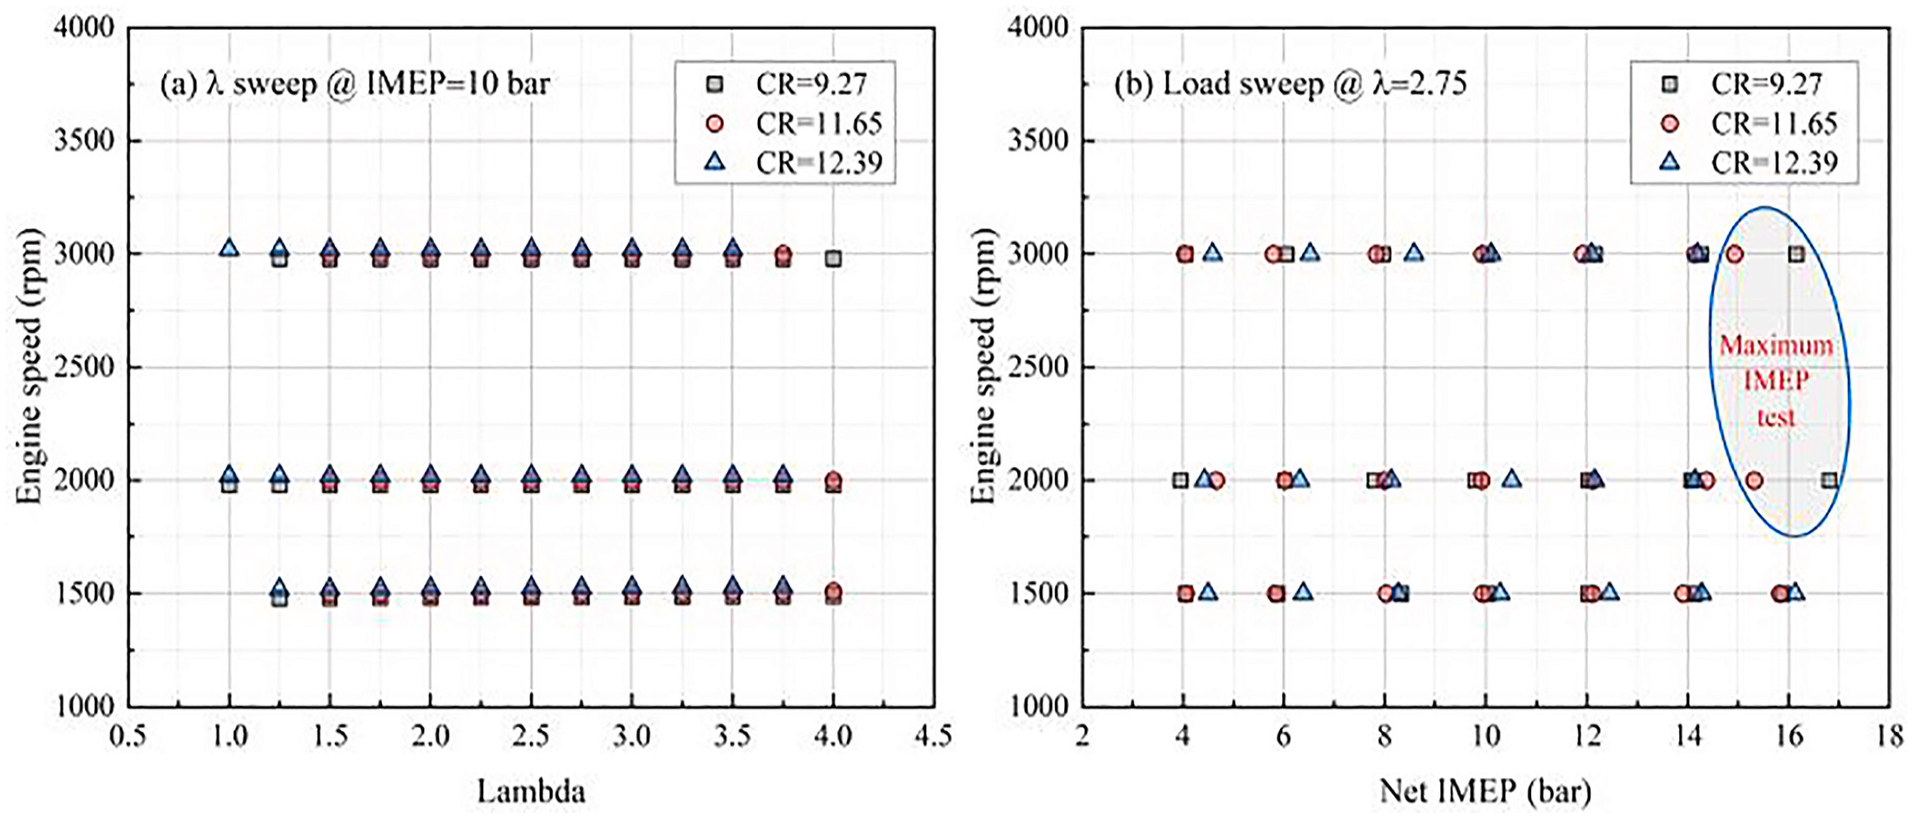
Test point map for lambda and load sweep tests.
Results and discussions
The results section is divided into two parts. The first part evaluates the performance of direct H2 injection under mid-engine load across various compression ratios (CRs), engine speeds, and lambda. The second part examines engine load sweeps for each CR at a fixed lambda of 2.75.
Investigation of the compression ratio sweep at different lambda values at a mid-engine load of 10 bar IMEP
The load was precisely fixed at 10 bar IMEP to represent the mid-load with a maximum variation of 0.2 bar. To keep the test consistent while swapping the pistons, the lambda sweep test used the same boundary conditions to assess the CR sweep effect without influencing other combustion parameters. The spark timing was set to the minimum spark advance for best torque (MBT) by fixing the 50% MFB at 8° ATDCf in all cases other than the near stoichiometric engine operation when spark retardation was required to maintain Rmax under 6 bar/CAD.
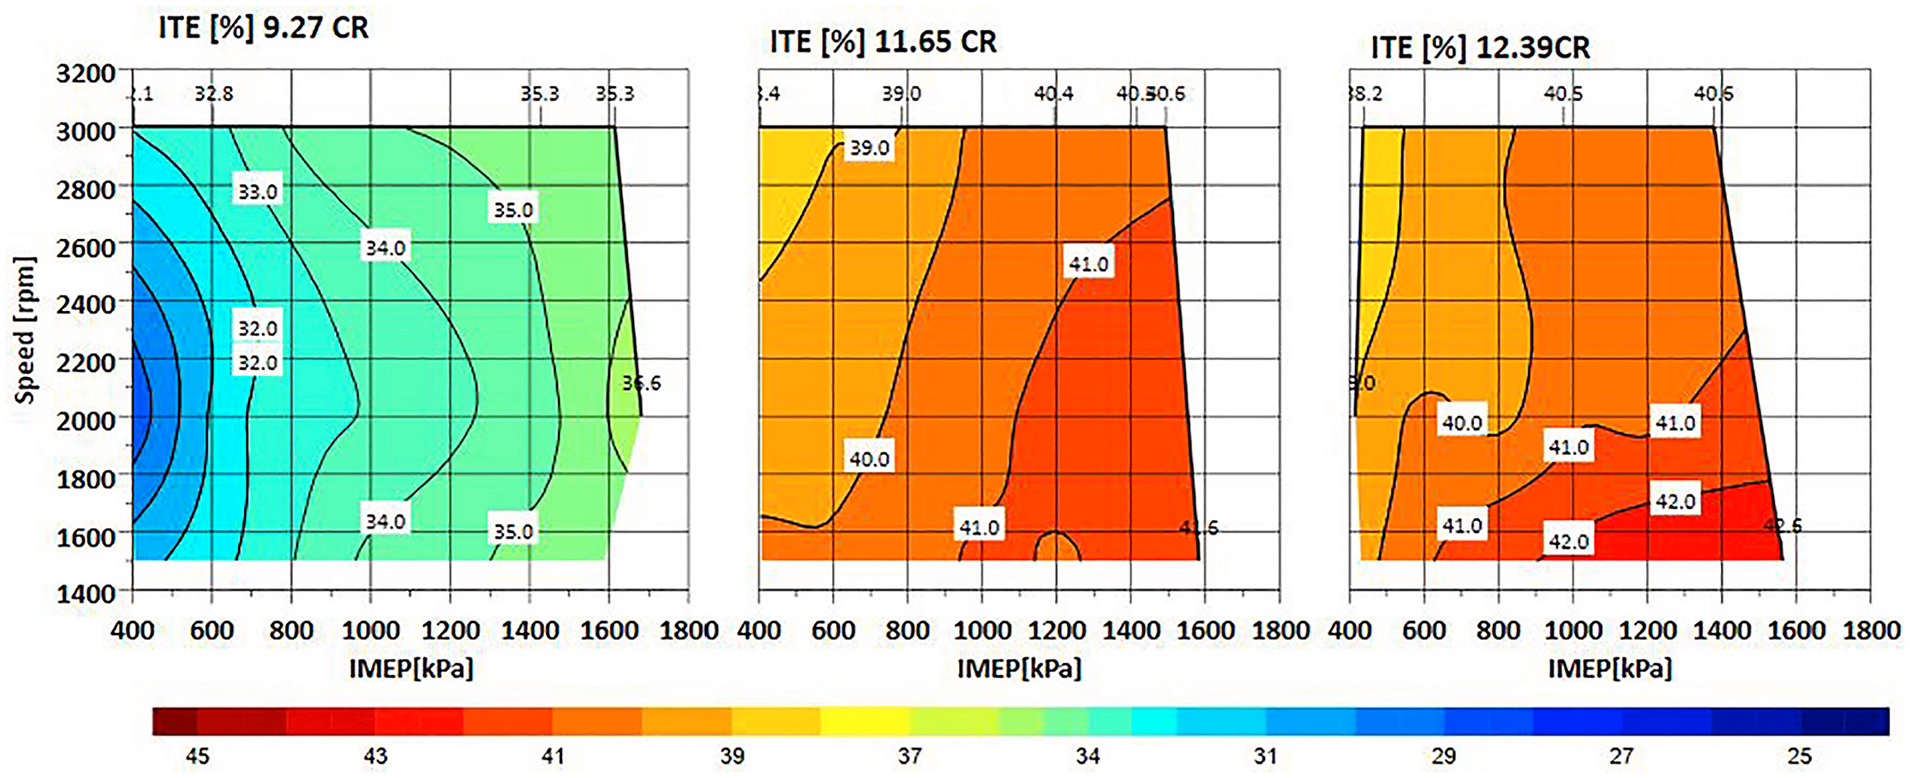
Figure 5 presents the overall Indicated Thermal Efficiency (ITE) of all three compression ratios at different lambdas and engine speeds. The figure shows the ability of the H2 engine to operate with the extra lean mixture and near the stoichiometric combustion at all three CRs. For all CRs, the ITE increases with the increased lambda due to lean-burn combustion and higher intake pressure as lean combustion lowers combustion temperatures, reduces heat losses through the cylinder walls, and decreases NOx emissions. It also increases the specific heat ratio, boosting thermodynamic efficiency during the expansion stroke while higher Intake Pressure raising intake pressure increases air density, allowing more oxygen into the cylinder. This leads to higher engine power output and better fuel efficiency while enhancing turbulence and combustion speed. These factors improve ITE by optimising fuel use and reducing energy losses. While a sudden drop in the ITE with near and at stoichiometric mixture combustion is caused by the retarded spark timing and combustion duration, as shown in Figures 6 and 7, respectively, to avoid an excessive rate of pressure rise. The higher compression ratio leads to the highest ITE of 44.6% at lambda 3.8 at a speed of 1500 rpm as Engine speed significantly influences indicated thermal efficiency (ITE) through several factors such as combustion quality as higher speeds decreased combustion duration, potentially enhancing efficiency if combustion is complete. However, excessive speeds may cause incomplete combustion, lowering ITE. The impact of heat losses is significant, with lower speeds resulting in greater heat losses per cycle due to prolonged heat transfer to cylinder walls, whereas higher speeds reduce this effect. While very low speeds have lower pumping losses, these increase with speed due to higher intake and exhaust resistance. The optimal speed for maximising ITE typically lies between the inefficiencies associated with low speeds (increased heat loss) and high speeds (incomplete combustion). In comparison, the lower CR achieves 37.8% under the same load and speed conditions. The results in Figure 4 also highlighted that the gain of the higher ITE between lambda 2.5 and 4 is limited to a moderate amount of 1%–2% only, but it is accompanied by much higher in-cylinder peak pressure, as shown in Figure 6 and higher pumping mean effective Pressure as shown in Figure 7 as more air boosting is needed to achieve this extreme high relative air-fuel ratio (AFR).
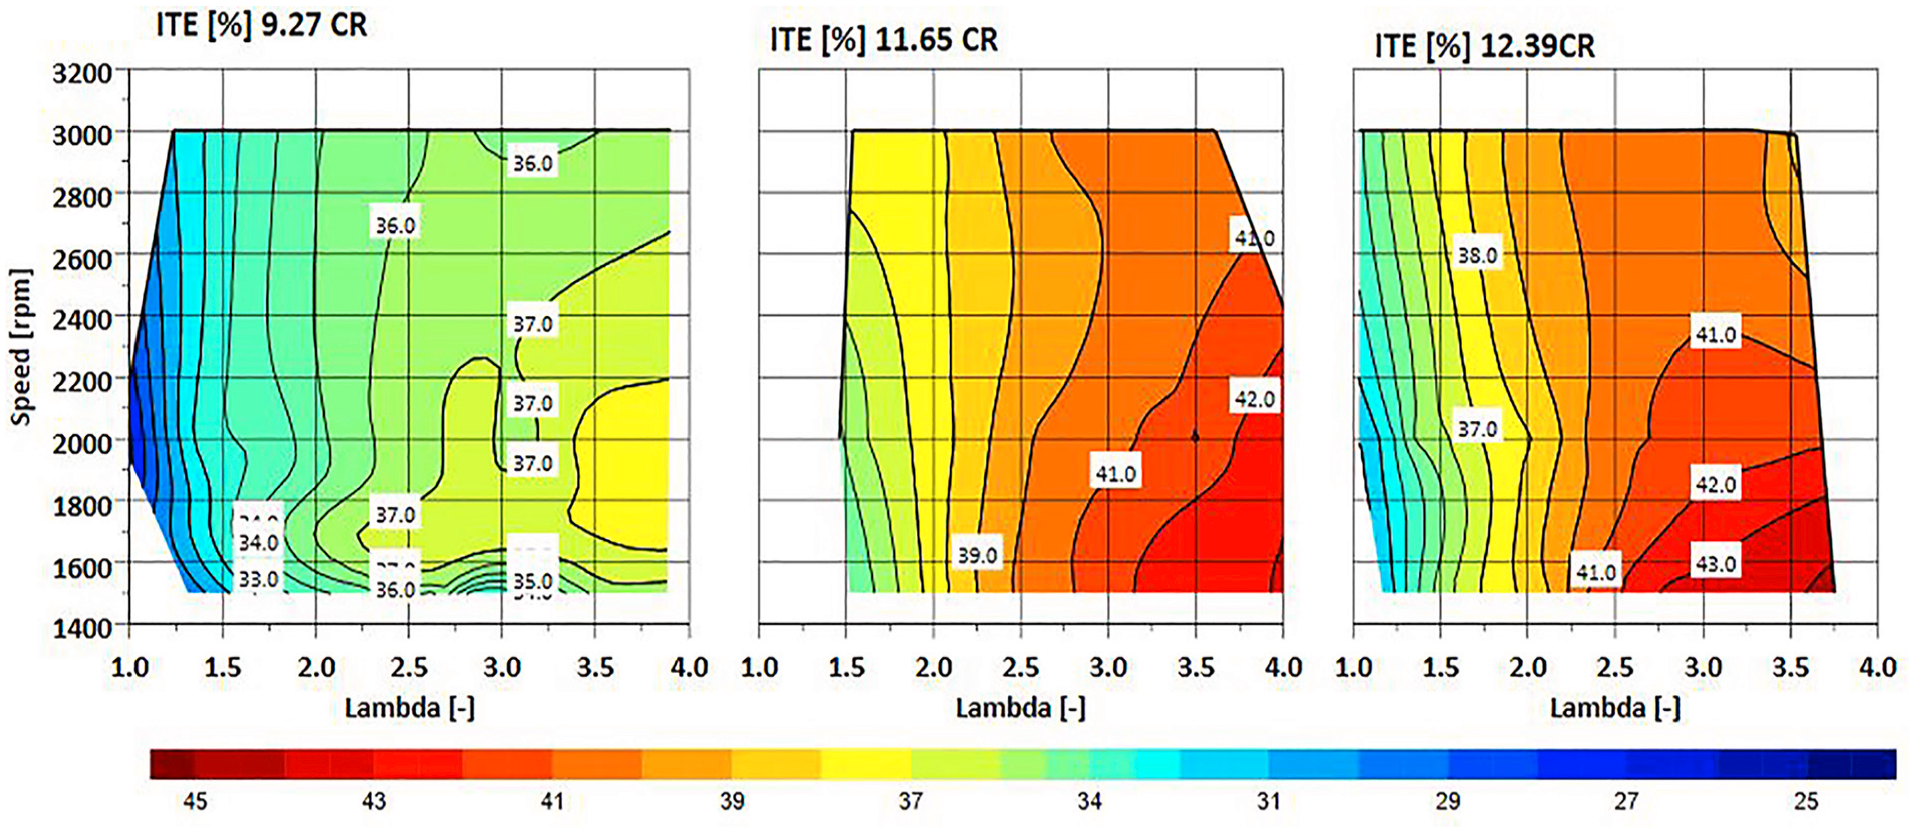
The indicated thermal efficiency of the 12.39, 11.65, and 9.27 CRs versus the engine speeds and lambda at the fixed load of IMEP = 10 bar.
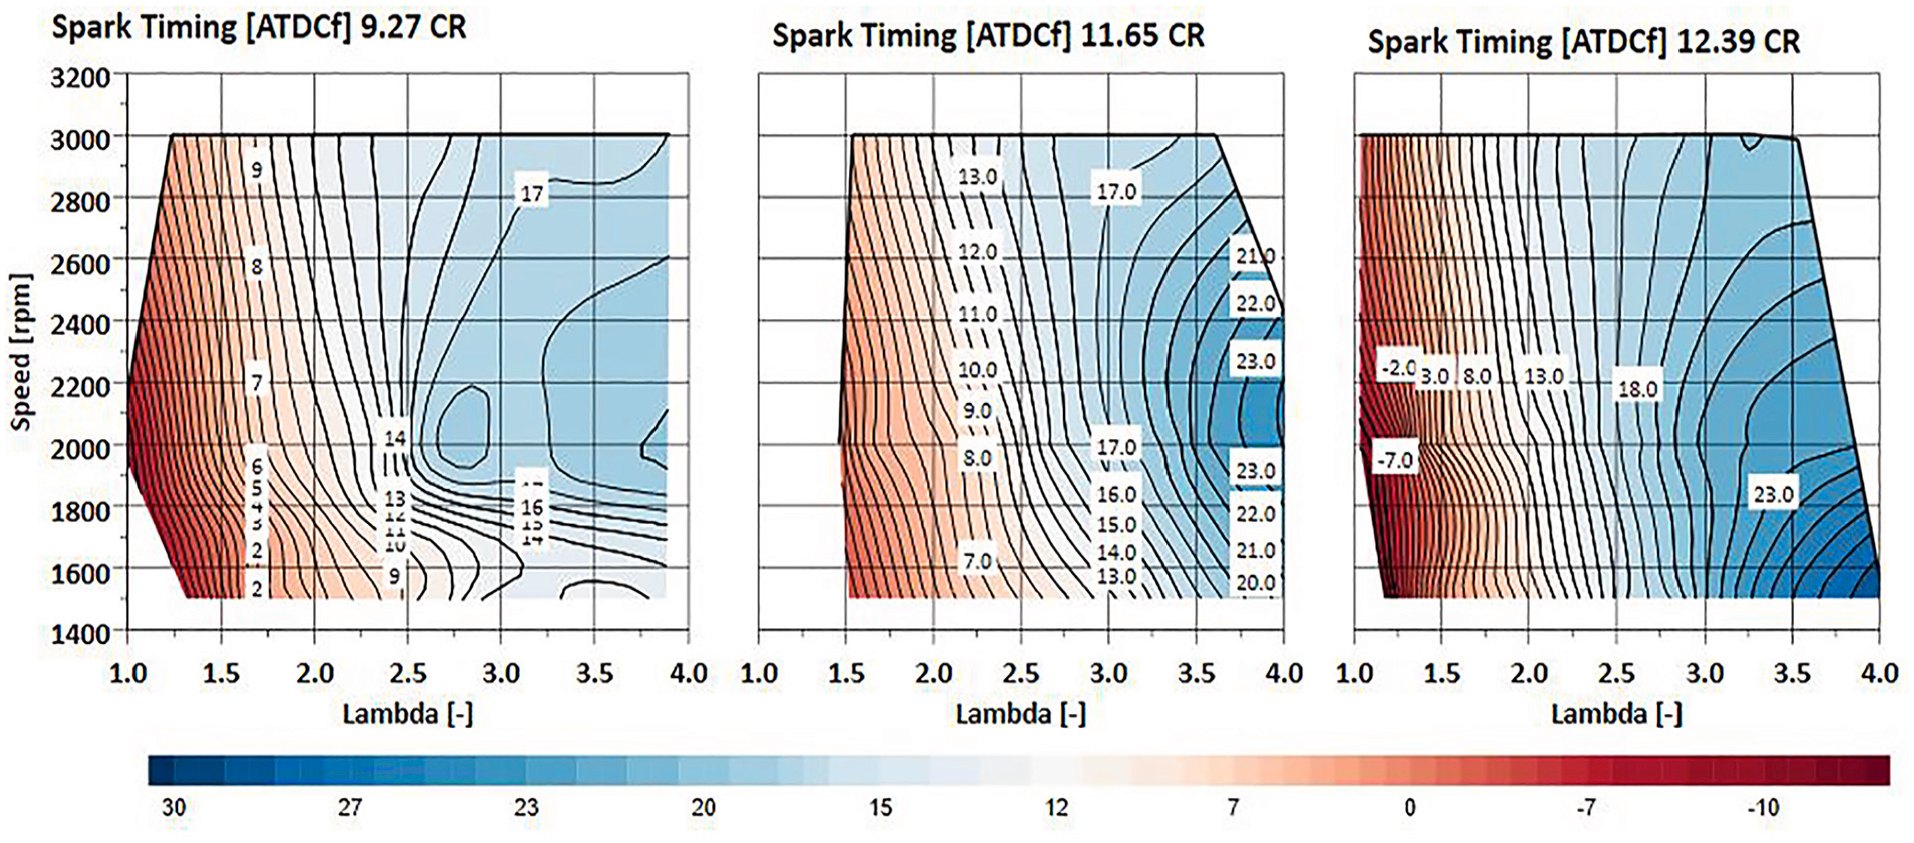
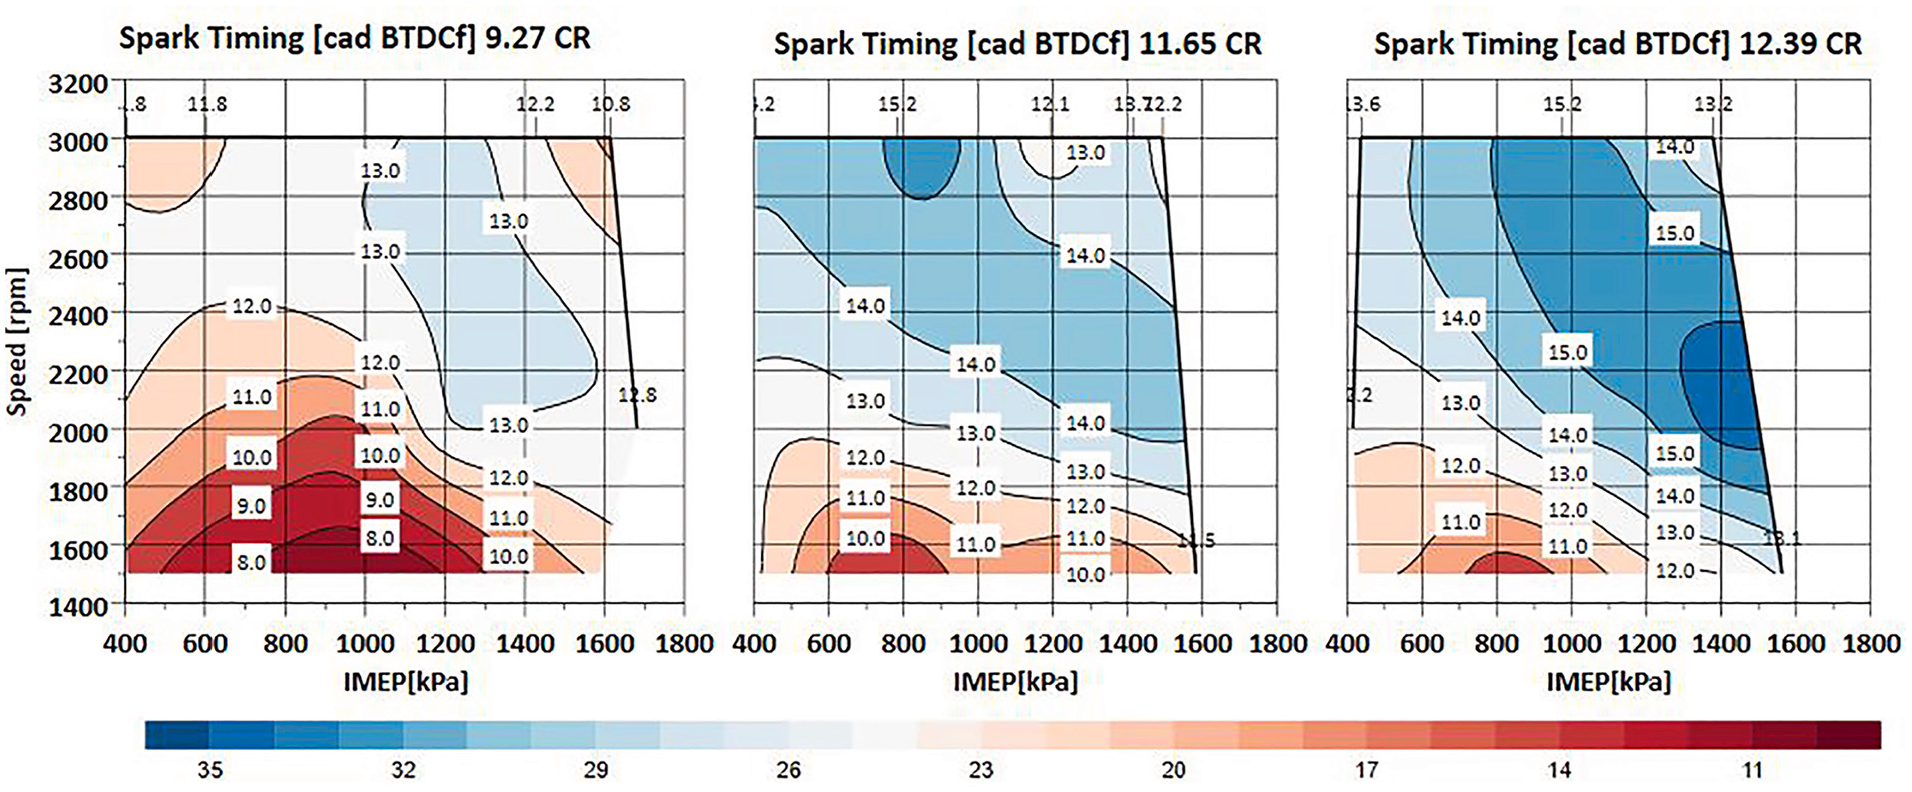
The spark timing [BTDCf] of the 12.39, 11.65, and 9.27 CRs versus the engine speeds and lambda at the fixed load of IMEP = 10 bar.
Combustion phasing of 12.39, 11.65, and 9.27 CRs at 2000 rpm and IMEP = 10 bar with various lambda values.
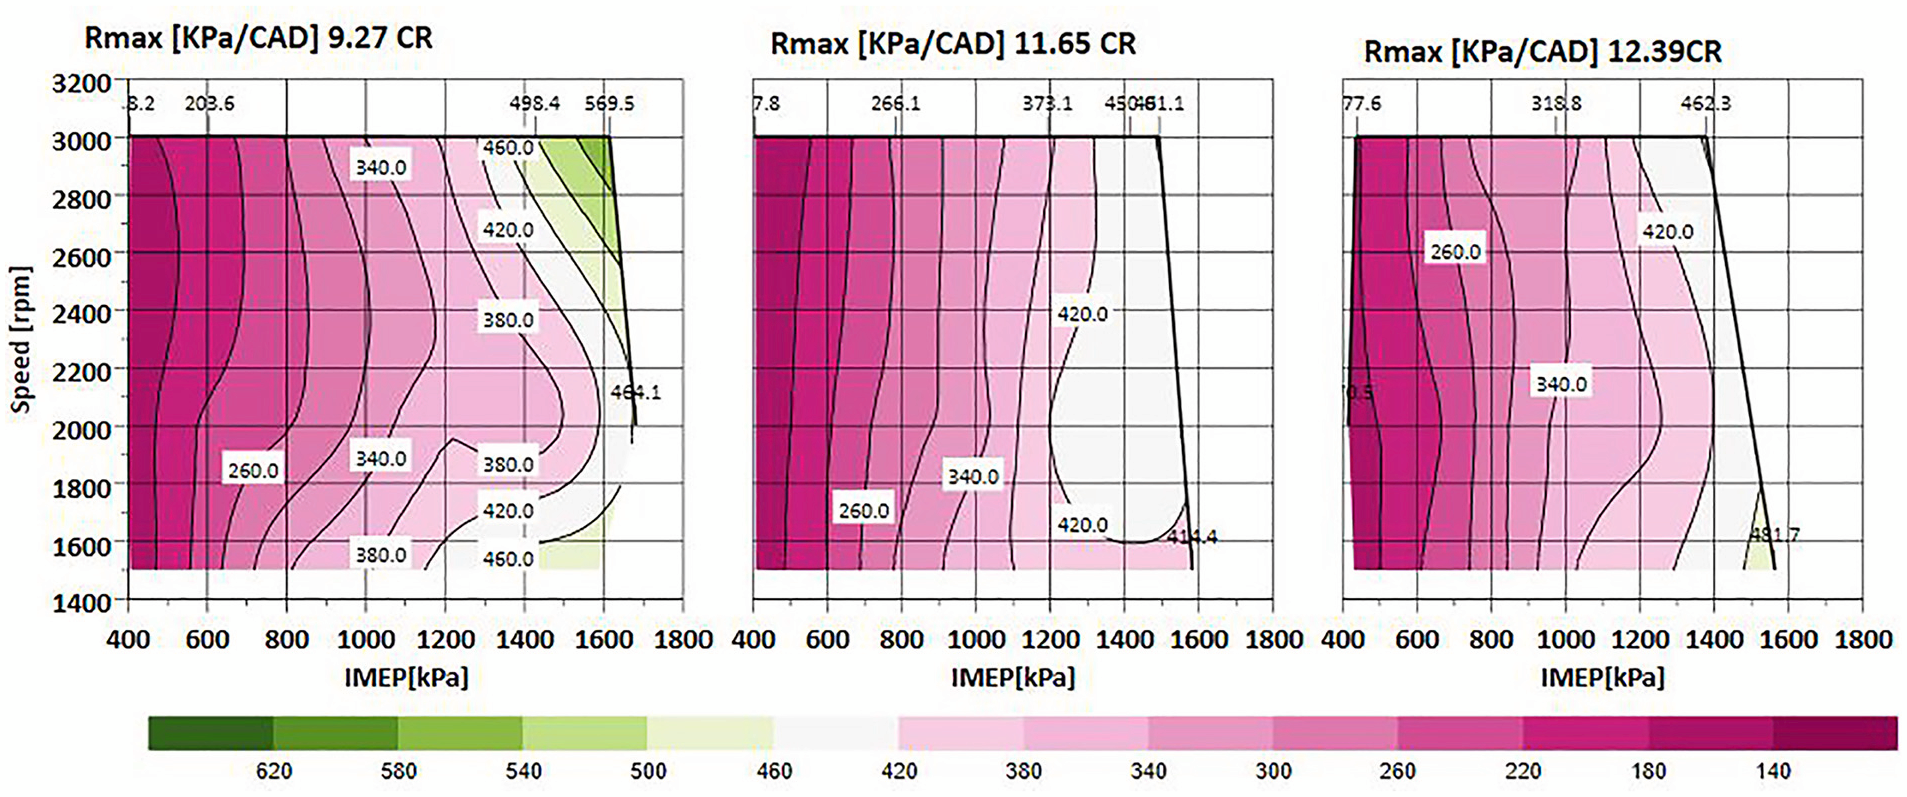
Figure 8 shows the pressure rise rate (Rmax) over the wide lambda and speed map for the three CRs, which is facilitating the ITE as closer the engine operations move to the stoichiometric combustion, the Rmax gradually increases, forcing the operator to the spark retarding, which results in lower ITE; it is also worth mentioning that no any abnormal combustion event recorded at the stoichiometric combustion for the lower and the higher CRs unlike using PFI where the backfire restricting the engine map to near lambda 1.5, the DI system is allowing to operate to the stoichiometric with no real benefits as the Rmax forcing for spark retardation which dropping the ITE.
R max of the 12.39, 11.65, and 9.27 CRs versus the engine speeds and lambda at the fixed load of IMEP = 10 bar.
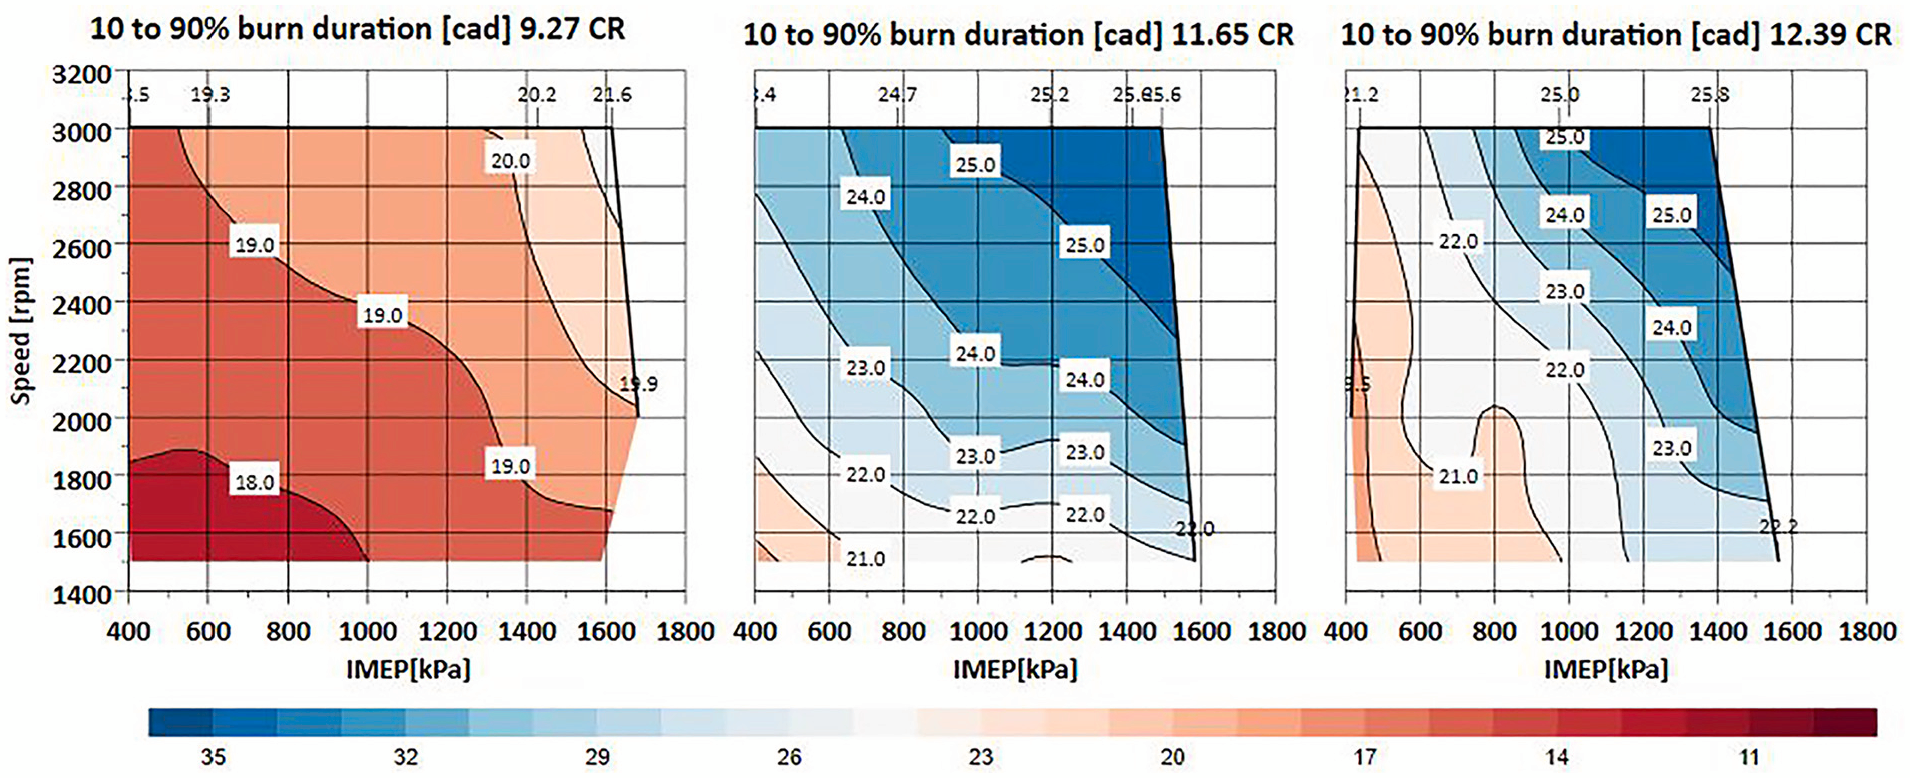
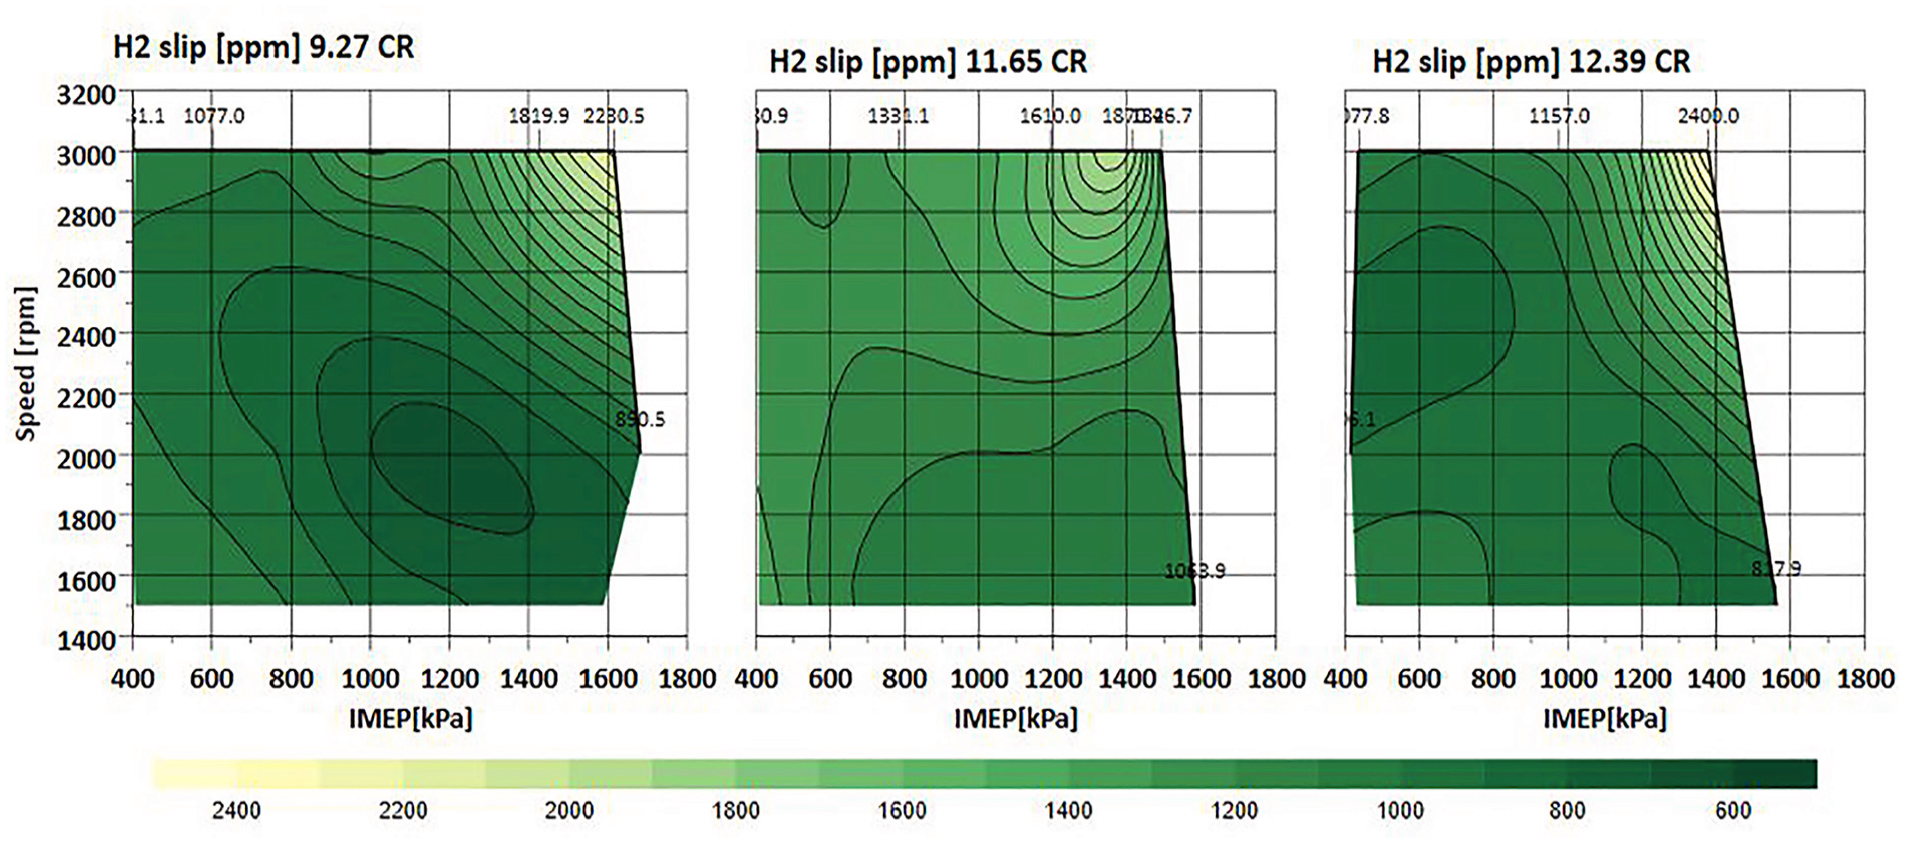
Figure 9 illustrates the total burn duration, for example, 10%–90% burn duration, of each CR at varying engine speeds and relative air-to-fuel ratios. These findings have practical implications for the design and operation of internal combustion engines. The data shows that longer burn durations are associated with leaner operations and higher engine speeds, possibly due to the increased flame travel distance relative to piston movement at higher speeds. This means that the piston moves faster at higher engine speeds, requiring the flame front to travel a greater distance across the combustion chamber to combust the air-fuel mixture within the available time fully. Additionally, higher engine speeds increase turbulence and charge motion in the intake air and fuel mixture. The results also show that leaner mixture combustion results in longer burn duration as the excess air slows the flame speed in the combustion chamber. Also, at engine speed, the burn duration trends are showing slower burn for the same CR; this might be a result of the longer injection PWM as the start of the injection is fixed at 150 BTDCf, which means at higher engine speed, the end of the injection is delayed by 7°–8° at the same load which results from less time for hydrogen homogenous mixing as Figure 10 suggested with higher hydrogen slip at higher engine speeds. Finally, the 12.39 CR piston produces a slightly longer burn duration at the same speed compared to 9.27 CR, which reflects on the ITE, as shown previously in Figure 5.
About 10%–90% burn duration of the 12.39, 11.65, and 9.27 CRs versus the engine speeds and lambda at the fixed load of IMEP = 10 bar.
H2 slip [ppm] of the 12.39, 11.65, and 9.27 CRs versus the engine speeds and lambda at the fixed load of IMEP = 10 bar.
To analyse the factors influencing combustion burn duration and highlight the overall trend, Figures 11 and 12 illustrate the burn duration from 10%–50% to 50%–90%. Figure 11 depicts the first half of the combustion burn duration for the three compression ratios. The general pattern aligns with longer burn durations observed at higher engine speeds and lean lambda operations. These findings suggest that factors affecting the burn duration between 10% and 50% remain consistent across different CRs, such as Ignition Timing, Air-Fuel Mixture Quality and Turbulence and Charge Motion. By directly comparing the 12.39 and 9.27 CRs, we observe that a lower CR results in a faster burn by one crank degree, influenced solely by the compression ratio.
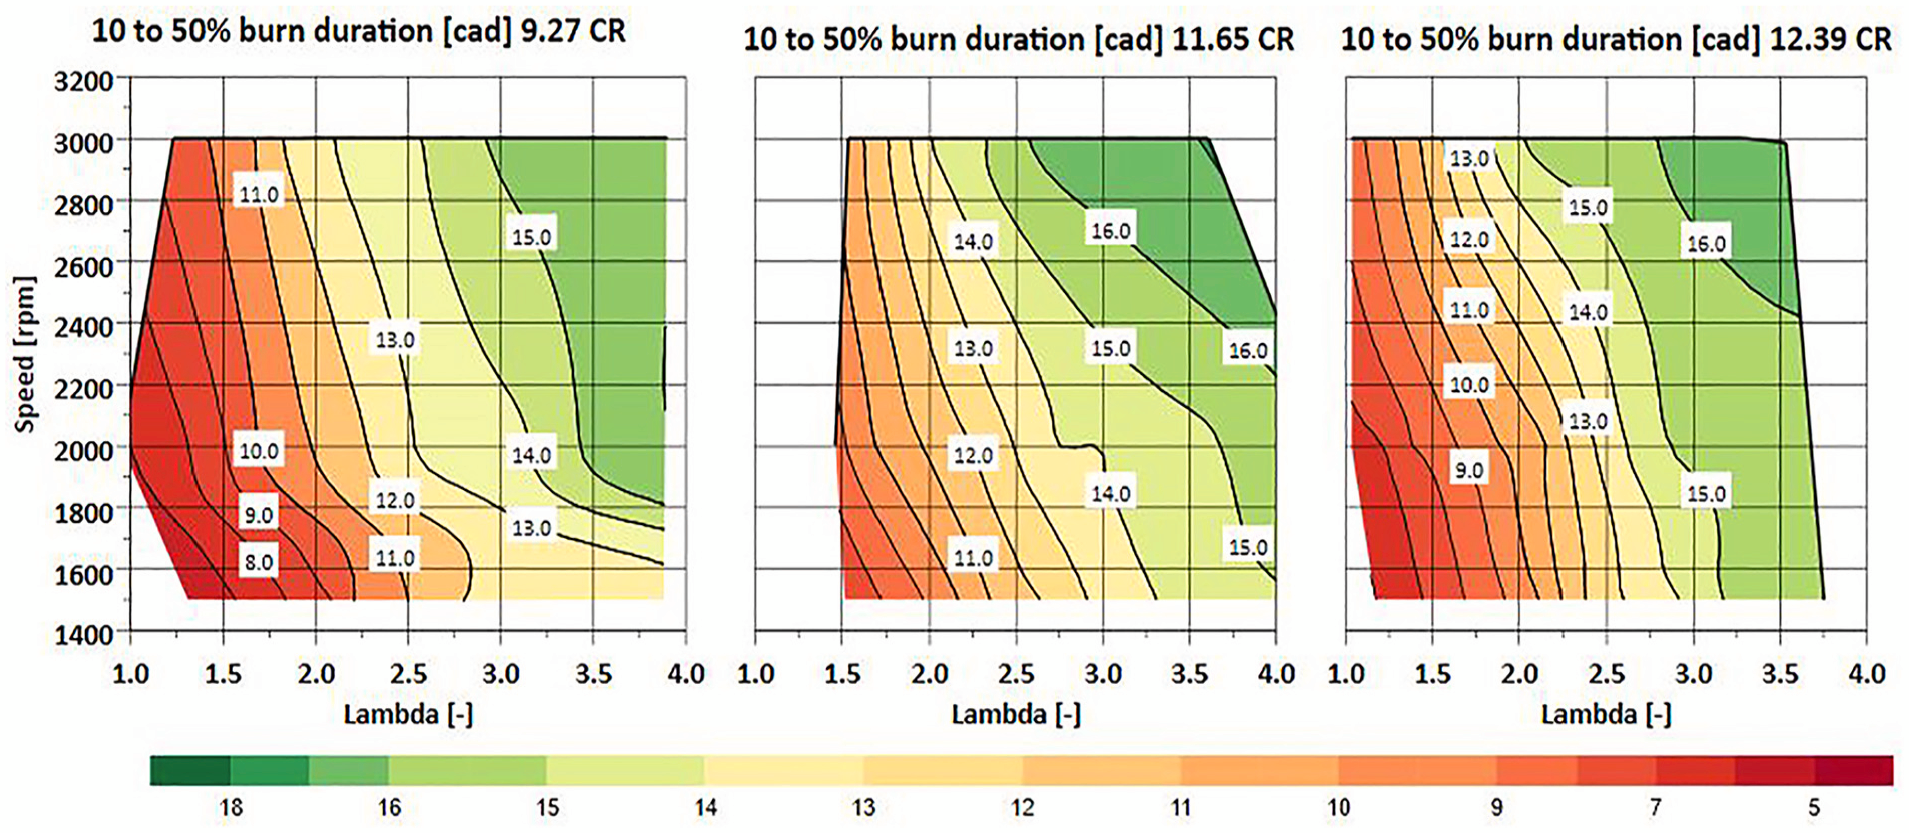
About 10%–50% burn duration of the 12.39, 11.65, and 9.27 CRs versus the engine speeds and lambda at the fixed load of IMEP = 10 bar.
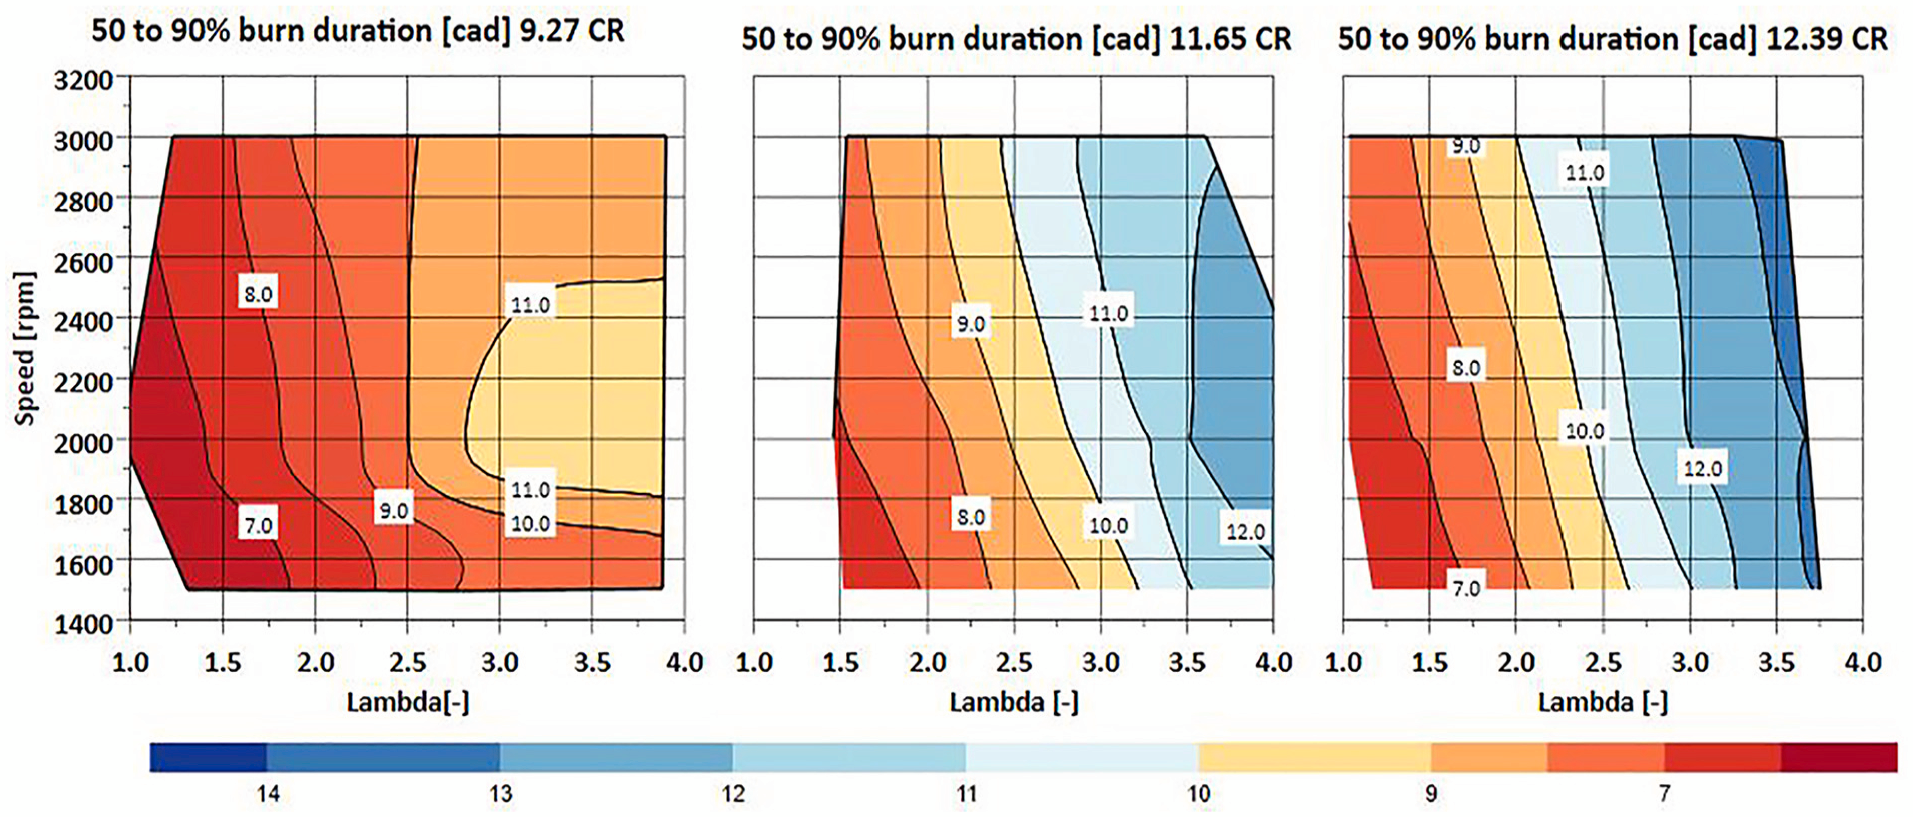
About 50%–90% burn duration of the 12.39, 11.65, and 9.27 CRs versus the engine speeds and lambda at the fixed load of IMEP = 10 bar.
Figure 12 shows the duration of the 50%–90% burn phase, highlighting a trend between compression ratios of 11.65 and 12.39. Leaner fuel mixtures and lower engine speeds lead to longer burn durations, with CR = 12.39 lasting 0.8 crank degrees longer. In contrast, CR = 9.27 has a faster burn duration. The only variable that changed was the piston design, while the engine head, intake ports and combustion chamber geometry remained the same. The differences in burn duration and reduced flame speed may result from lower turbulence and altered mixture distribution due to the deep bowl piston design. Additionally, flame quenching can occur as the flame approaches the cylinder walls and piston surface, leading to heat loss.
Figure 6 showcases the data that underlines the meticulous optimisation of spark timing, engine speeds and lambda for the three compression ratios. This optimisation is a careful process, ensuring that the 50% Mass Burn Fraction (MBF) occurs near 8° ATDCf to maintain engine operation at the MBT. As the flame speed slows down with an equated AFR, the spark timing is advanced with precision to achieve higher ITE, as seen in Figure 5.
To clarify the detailed effect of CRs on the hydrogen combustion process, Figure 6 illustrates the in-cylinder Pressure, apparent heat release rate (AHRR) and pressure rise rate of different CR under 2000 rpm and IMEP = 10 bar conditions. All the results represented the ensemble average of 300 cycles. AHRR was computed using the first law of thermodynamics:
Here,
Figure 13 showcases each compression ratio’s peak in-cylinder Pressure (Pmax) across a broad range of engine speeds and lambda values. The data indicates that leaner operating conditions result in higher Pmax due to increased boost pressure to provide the extra air required. At a higher compression ratio of 12.39, the engine achieved IMEP = 10 bar at 1500 rpm and λ = 3.8, with a Pmax of approximately 100 bar. This Pmax is nearly close to the engine’s Pmax limitation of 120 bar, posing an additional challenge in attaining higher engine loads with higher CR. By comparison, a Pmax approximately 20 bar lower is achieved at a lower CR of 9.27 at the same engine load, speed and lambda. Furthermore, under the same IMEP and lambda conditions, the intake pressure and H2 injection mass per cycle decrease with increasing CR, which yields a lower peak of AHRR under higher CR conditions.
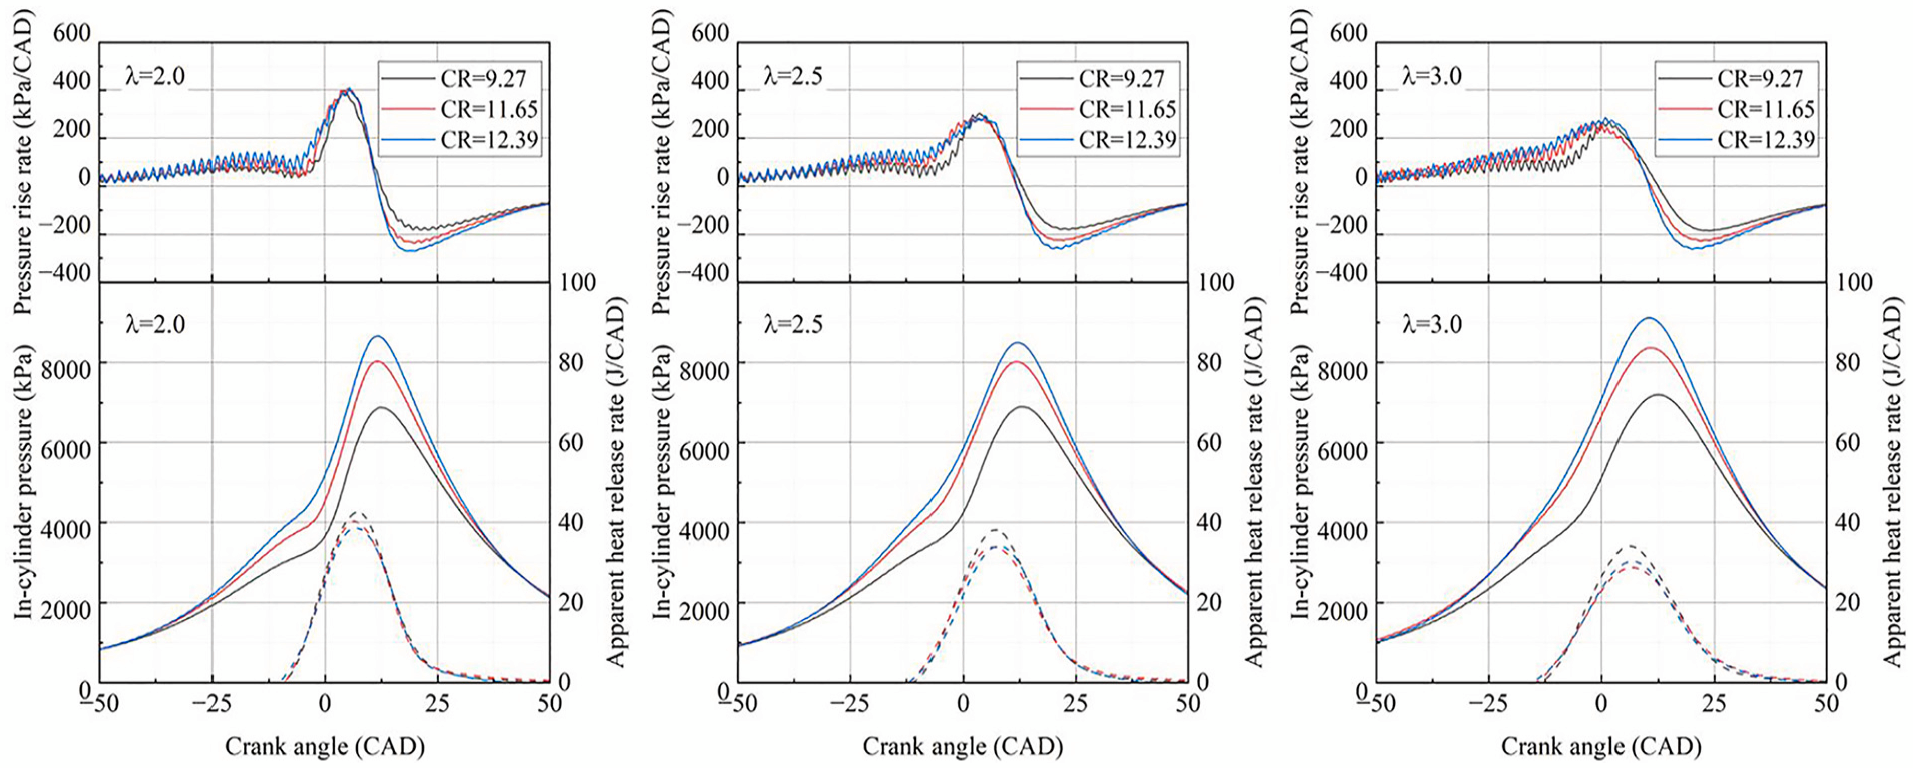
The in-cylinder pressure, heat release rate and pressure rise rate of 12.39, 11.65, and 9.27 CRs at 2000 rpm and IMEP = 10 bar with various lambda values.
Figure 7 further shows the combustion phasing across different CR and lambda conditions. Specifically, the combustion duration shows an ‘increase-decrease’ trend with CR increase when lambda is below 2.5, with CR = 11.65 leading to the longest combustion duration; while under the ultra-lean conditions, that is, lambda greater than 2.5, both the ignition delay and combustion duration are prolonged with CR increase. Regarding such phenomena, the reasonable explanation is that the H2 flame speed is synergically influenced by in-cylinder Pressure, temperature, as well as flame instability. On the one hand, an elevated CR can enhance the in-cylinder temperature, yielding a fast combustion speed. On the other hand, the flame speed will be reduced under elevated pressure conditions.34–36 Some DNS work on H2 combustion indicated that ambient Pressure increased the probability density of the negative curvature value along the flame front caused by thermodiffusion instability, which may lead to local flame extinction and inhibit flame propagation. 37 Additionally, the flame quenched near the piston wall under ultra-lean conditions serves as another latent reason contributing to prolonged combustion duration with CR increase. Since the flame instability is complicated for H2 under high thermal conditions, we believe that further fundamental optical studies will be helpful to clarify the phenomenon and the underlying physical mechanism.
It is important to note that adopting a High-Pressure Direct Injection (H2DI) system has an impact on engine performance. It eliminates intake backfire, typically during lower lambda operations when using port fuel injection (PFI) systems. The H2DI system enables the engine to operate close to stoichiometric combustion. However, the Rmax increases rapidly with decreasing lambda towards stoichiometric due to the faster burn characteristics and hydrogen combustion properties. This necessitates the operator to retard the spark timing to approximately 15° ATDCf, resulting in a significant drop in ITE.
Figures 7 and 13 reveal the trade-off between peak pressure (Pmax) and Rmax with the CRs, underscoring the significant impact of this trade-off on engine tuning and design considerations and the gravity of this consideration on the engine’s overall performance.
Figure 14 depicts a map showing the pumping mean effective Pressure (PMEP), which is the amount of work done by the piston on the gases within the cylinder during the intake and exhaust strokes of an engine cycle and can be represented by equation (6).

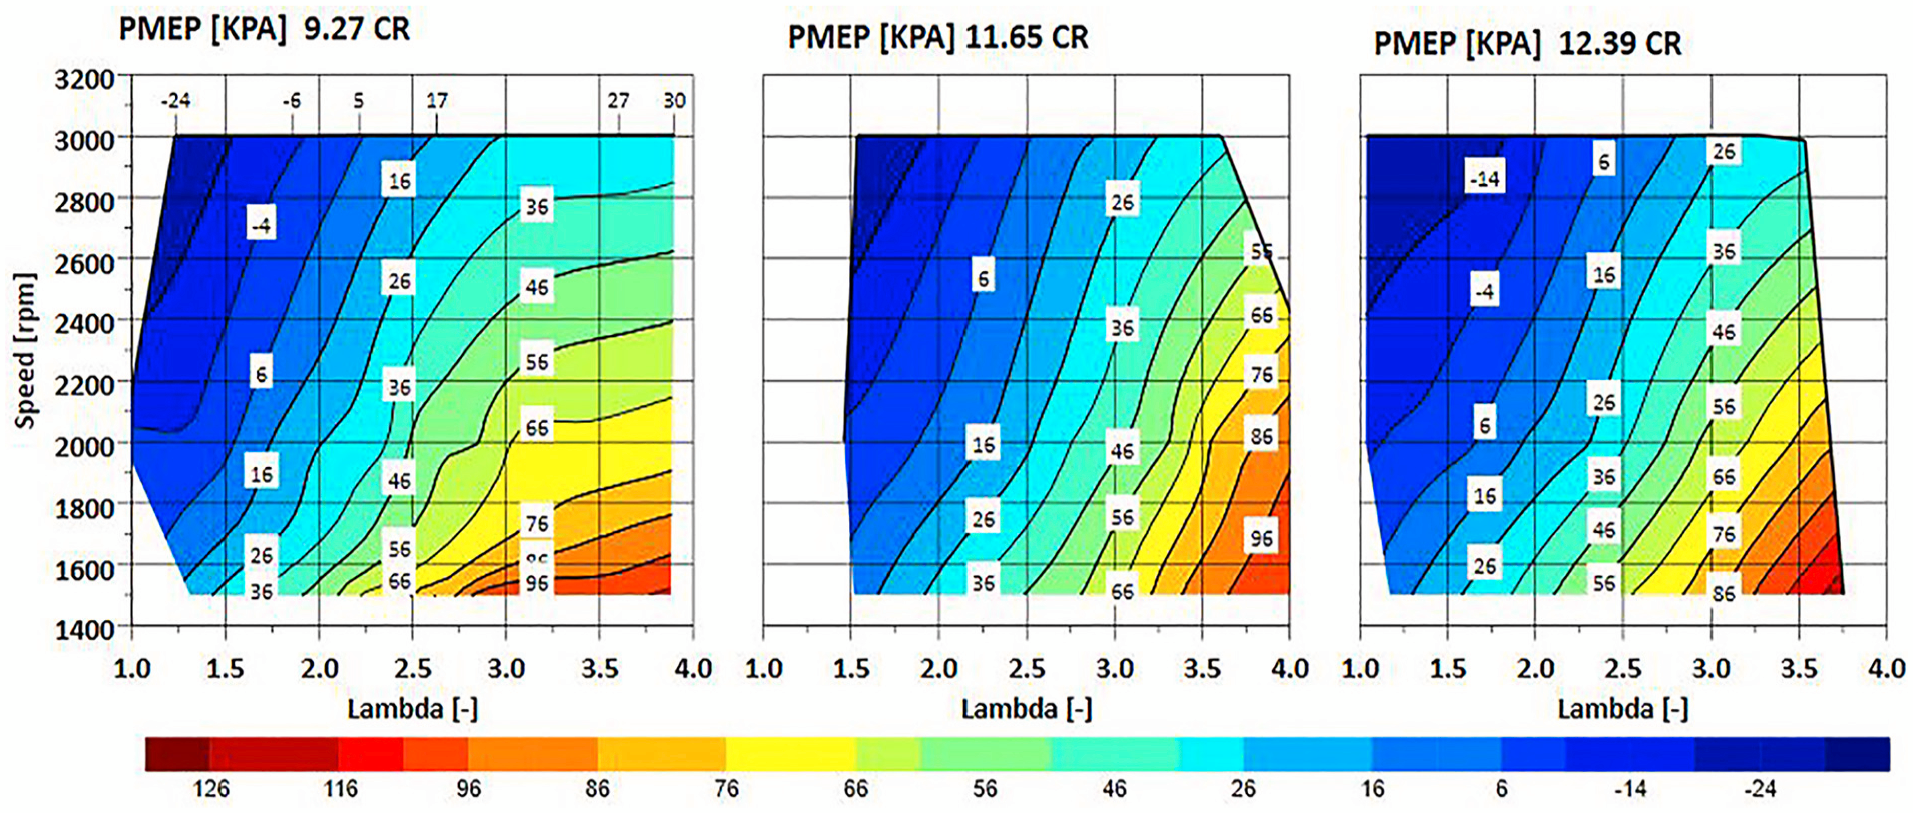
Pumping mean effective Pressure (PMEP) [kPA] of the 12.39, 11.65, and 9.27 CRs versus the engine speeds and lambda at the fixed load of IMEP = 10 bar.
The PMEP data emphasises the additional requirement of leaner operations for more significant boosting to attain a higher relative AFR by turbocharging or/and supercharging. Increased intake pressures raise resistance during the stroke, making it more difficult to draw in air. Supercharged air can also elevate exhaust backpressure, resulting in greater pumping losses. Furthermore, the reduced exhaust gas velocity at lower speeds may lead to higher exhaust backpressure, further exacerbating pumping losses.
Figure 15 illustrates the coefficient of variation of IMEP (COVIMEP) at various speeds and Lambda values. The data indicate that hydrogen combustion exhibits remarkable stability across a wide range of lambda values and engine speeds, with COVIMEP consistently below 0.8% within the lambda range of 1.5–3. This suggests superior stability compared to gasoline, the fuel for which the engine was originally designed and optimised. Moreover, it’s crucial to note that as the engine is pushed towards leaner operations, there is a noticeable increase in COVIMEP, reaching at least 3.5% with very lean mixtures due to partial burn or misfiring events, as evidenced by the hydrogen slip data captured from the exhaust, as shown in Figure 16. Also, a partial burn event was captured at a higher engine speed of 11.65 CR, resulting from a damaged spark plug due to the combustion characteristics of the hydrogen.
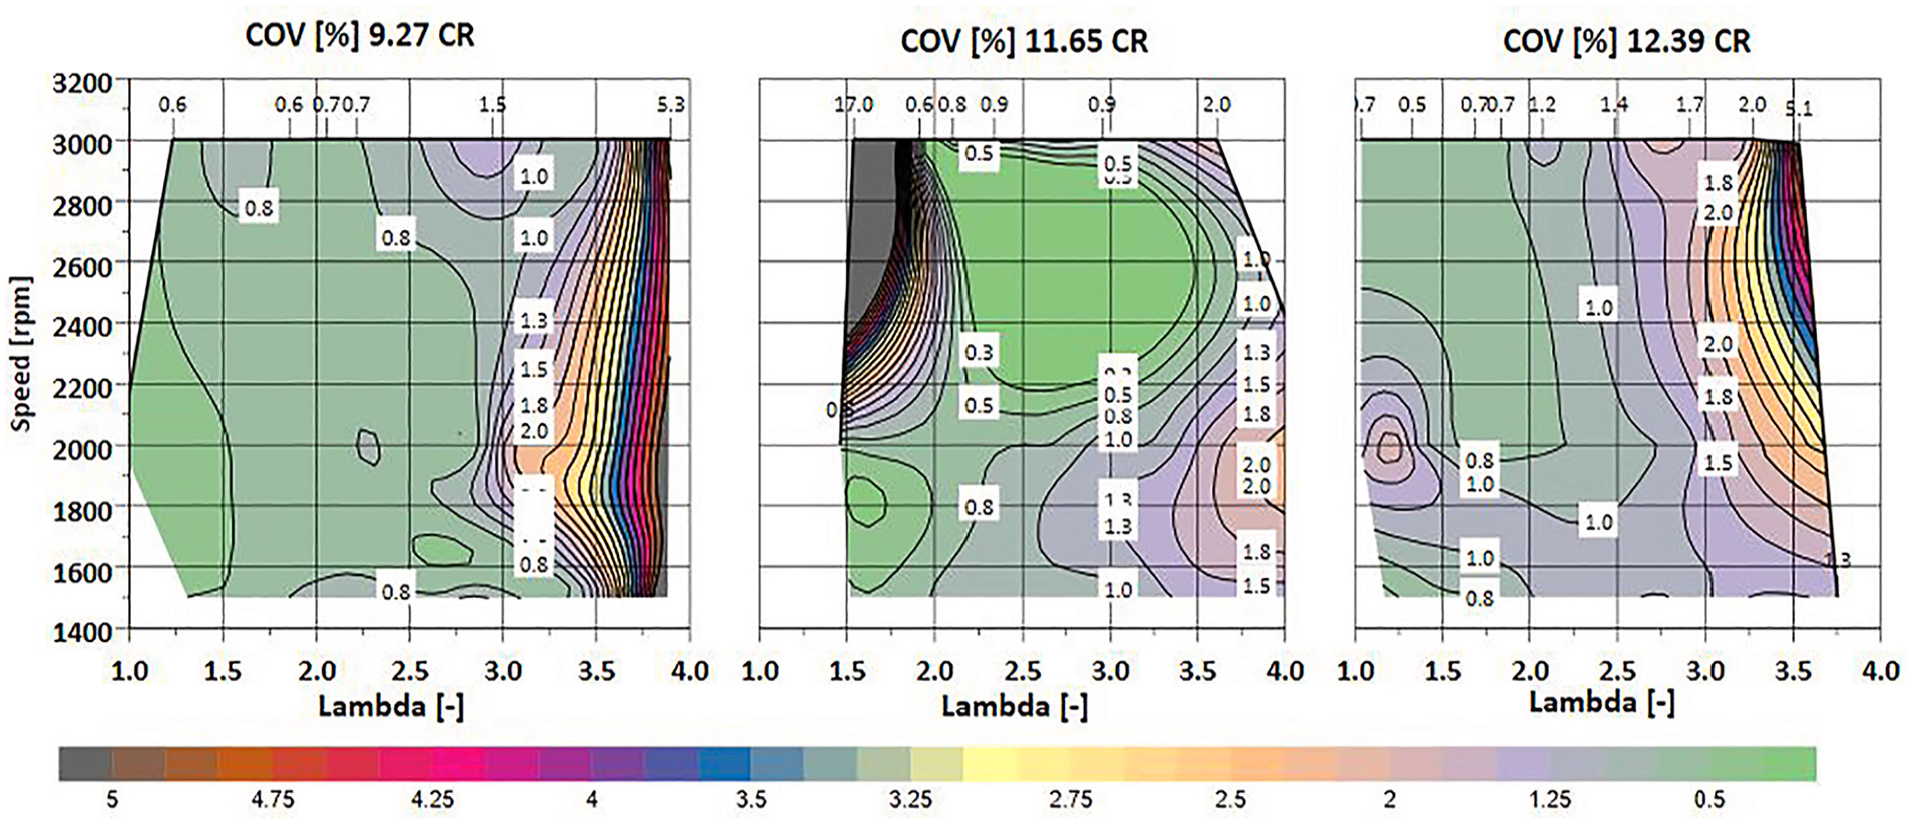
COVIMEP [%] of the 12.39, 11.65, and 9.27 CRs versus the engine speeds and lambda at the fixed load of IMEP = 10 bar.
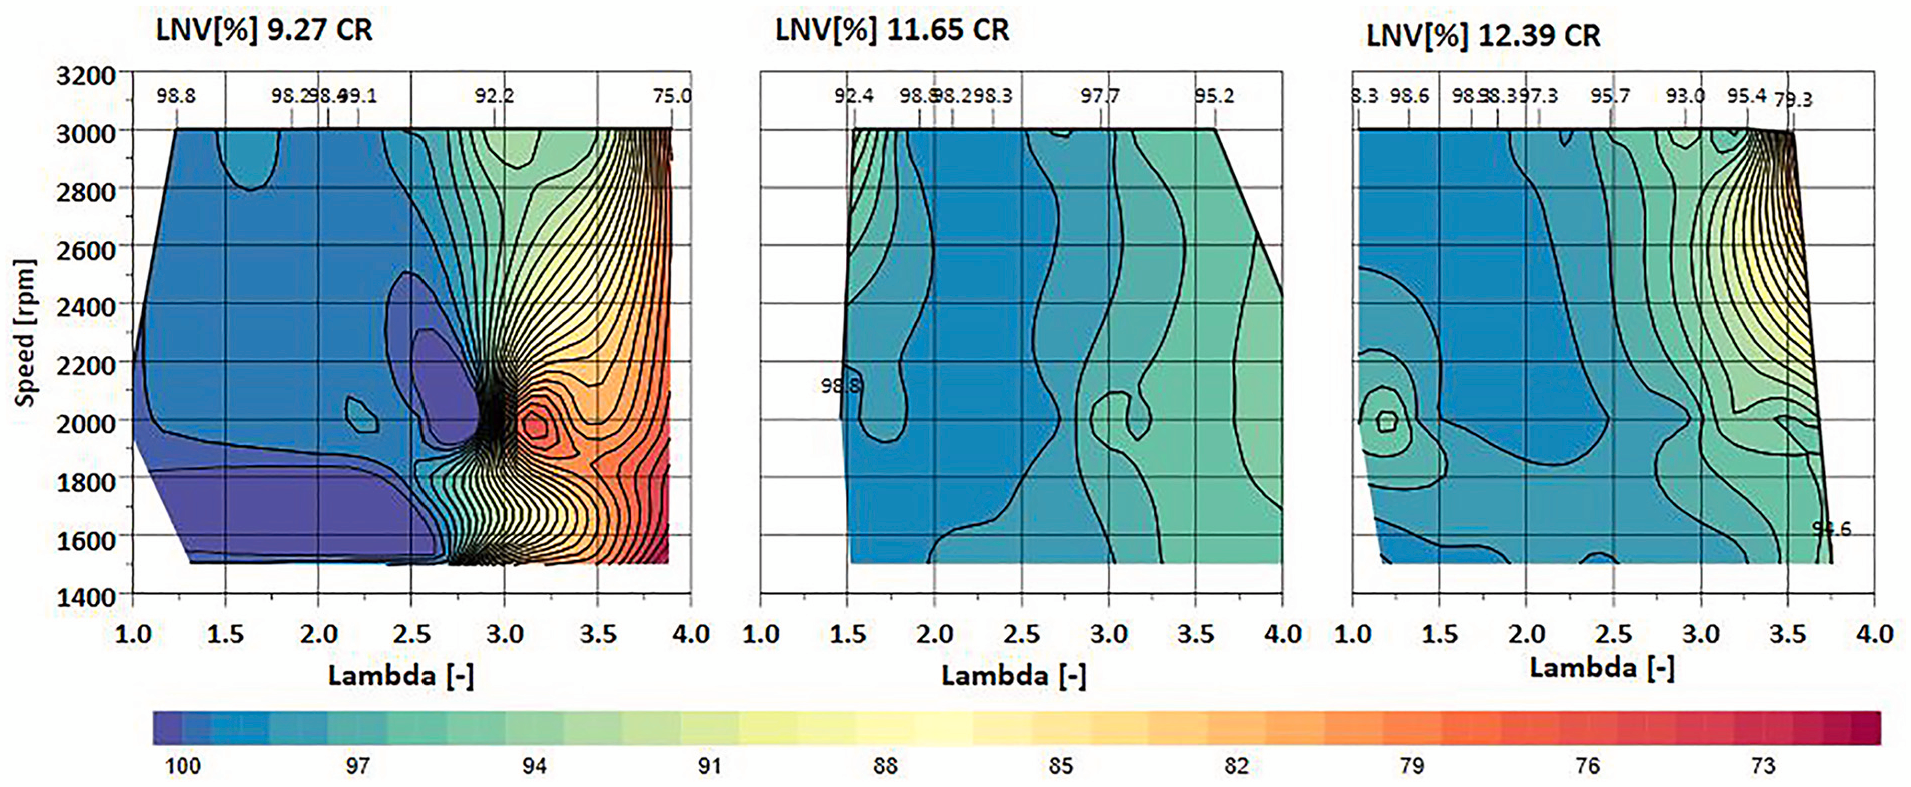
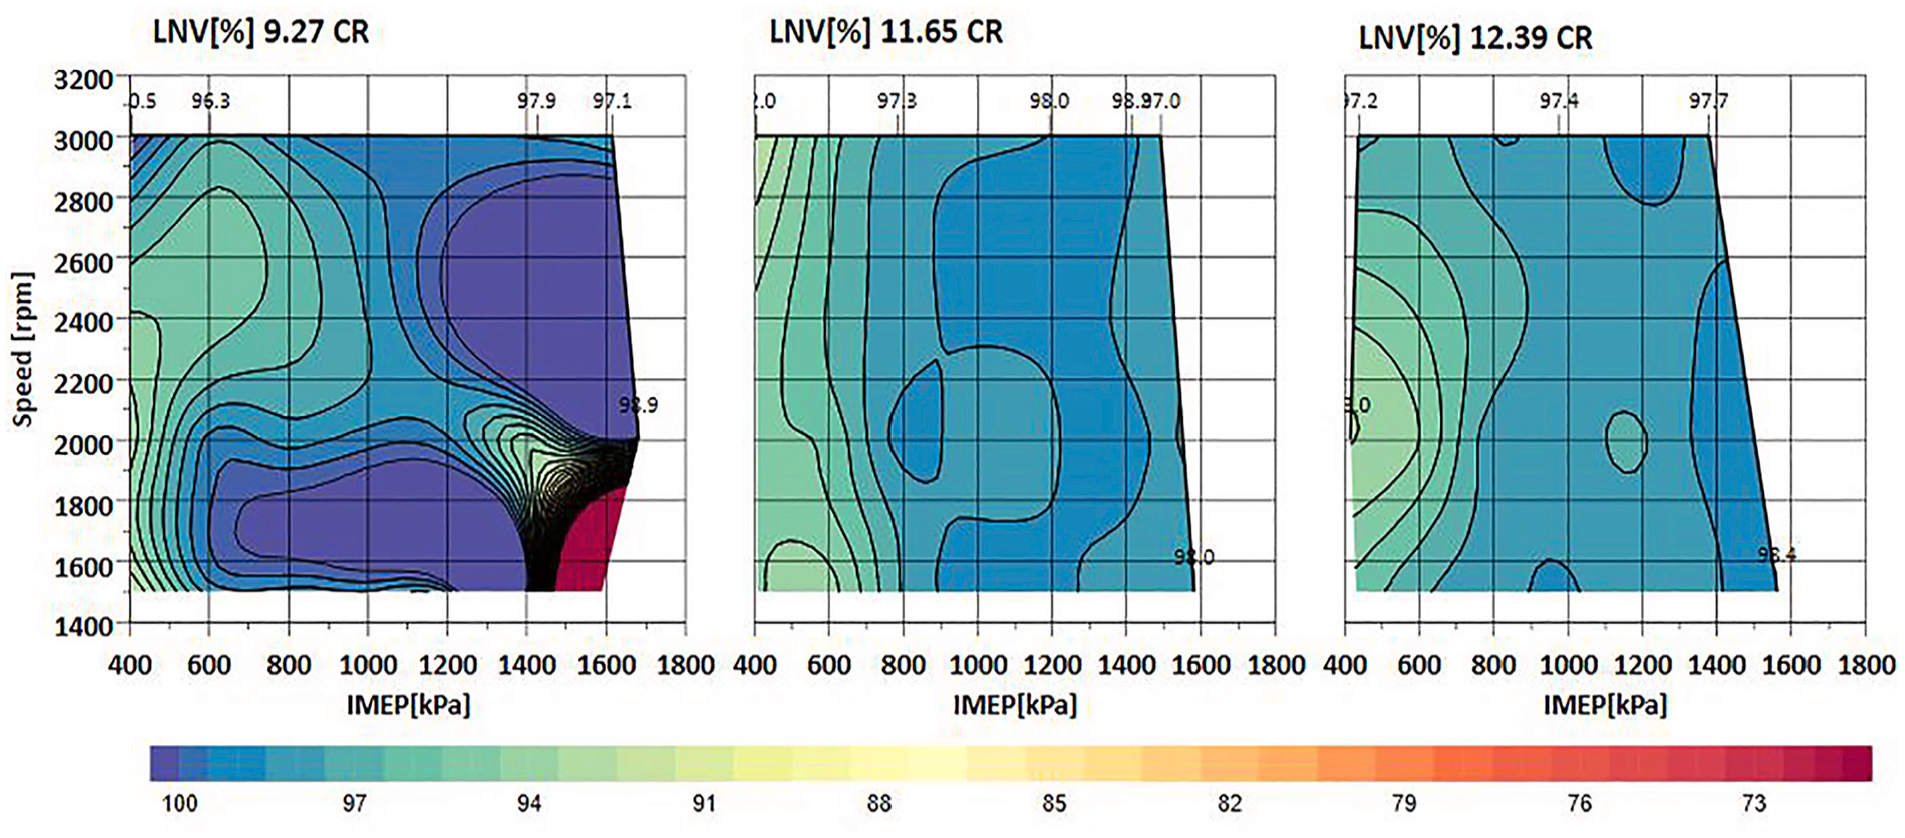
L = NV [%] of the 12.39, 11.65, and 9.27 CRs versus the engine speeds and lambda at the fixed load of IMEP = 10 bar.
Figure 16 shows the other parameter to assess the engine stability with 100% hydrogen fuels: the lower net value (LNV), which is particularly useful for identifying misfire events. The data shows a very stable trend with the same effects as the engine goes leaner; the LNV start dropping down. During the engine experiments, it was found that the spark plug was subject to more frequent damage than the gasoline engine operations, particularly at higher engine speeds, resulting in misfires, for example, at 3000 rpm and 1.5 lambda in 11.65 CR. In such cases, the LNV was able to identify misfires and hence ensure that the defect in the spark plug could be detected and rectified by changing the spark plug for consistent results.
Hydrogen combustion engines are distinguished by their almost negligible CO, CO2, and HC emissions, as evidenced by the near-zero readings on steady-state emissions analysers. They are well within the measurement tolerance of 0%–0.25%. The emissions from hydrogen combustion can be categorised into three main components: water (H2O), unburned hydrogen in the exhaust (H2 slip), and NOx. Figure 16 illustrates the hydrogen slip in the exhaust stays under 1000 ppm across a wide range of lambda and engine speeds. Additionally, it is important to note that the rapid increase in hydrogen slip at lean limits indicates the emergence of higher partial burns, as indicated by results in Figure 16.
Figure 17 illustrates the NOX engine-out emissions for the three compression ratios, revealing a consistent pattern across all ratios. Peak NOX emissions occur between lambda 1.5–1.4, with a subsequent reduction near stoichiometric levels due to spark retardation and hence lower peak combustion temperature.
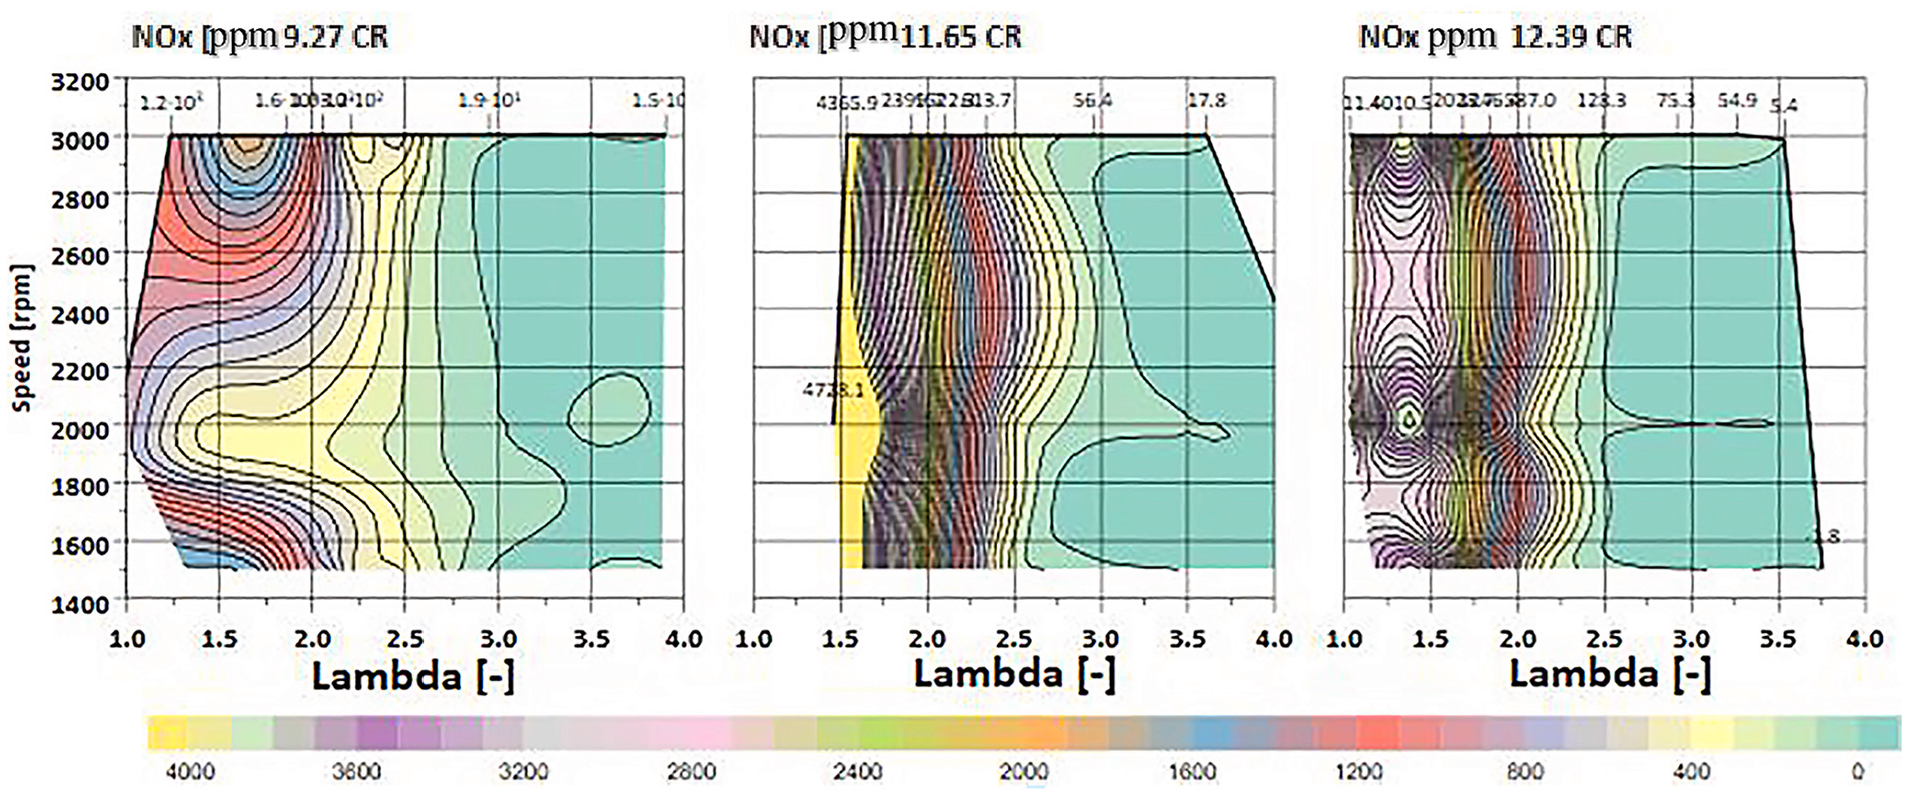
NOx of the 12.39, 11.65, and 9.27 CRs versus the engine speeds and lambda at the fixed load of IMEP = 10 bar.
Additionally, it is noteworthy that NOX emissions drop to negligible levels, below 50 ppm, as the air-fuel mixture leans out from lambda 2.75 towards maximum lean operation. When comparing the three compression ratios at specific lambda and speed, it becomes evident that higher compression ratios lead to increased NOX emissions because of high combustion gas temperature.
Regarding the CO/CO2/HC, the steady-state emissions analysers have not captured any values, which suggests that the maximum values were under the resolutions of the steady-state emissions analysers as its near-zero carbon emissions as the downsized single-cylinder engine comes with tight engine clearance, which minimising the carbon emissions from the lubricant at the steady-state operating points. Finally, it is worth mentioning that the knock parameter was steady over the wide map with values under 0.2 over the three CRs; these findings show great potential for hydrogen to adopt higher CRs, unlike carbon-based fuels. However, another factor affects the operating maps as Rmax restricts the operation near the stoichiometric, which requires high boosting. Also, in the next section, the descriptions of the peak load will be discussed with different CRs.
Investigation of the compression ratio sweep at a fixed lambda of 2.75
In Figure 18, the indicated thermal efficiency (ITE) of three compression ratios (CRs) is depicted at various engine speeds during a full load sweep from 4 bar IMEP up to the maximum load limited by the peak in-cylinder Pressure of 120 bar. It shows that the lower CR of 9.27 can achieve higher loads compared to the higher CR of 12.39. However, the overall ITE data reveals that lower CRs exhibit lower ITE across the map.
ITE of the 12.39, 11.65, and 9.27 CRs versus the engine speeds and load at the fixed lambda of 2.75.
Further analysis of CRs 12.39 and 11.65 trends reveals a high degree of similarity in achieving maximum ITE of 42.6% and 41.5%, respectively, at the same load and speed of 15.6 bar IMEP and 1500 rpm. At the lower CR of 9.27 with a higher maximum output, the maximum ITE was achieved at a slightly higher engine speed of 2000 rpm and a higher load of 16.5 bar. The lower ITE at part load conditions is caused by the increased pumping losses, which is particularly noticeable at the 4 bar IMEP load. Additionally, the lower compression ratio experiences a rapid drop at peak load at 1500 rpm engine speed due to the failure of the ignition system to maintain stable sparking, as indicated by the higher engine COVIMEP in Figure 19, under much higher gas pressure and air to fuel ratio.
R max of the 12.39, 11.65, and 9.27 CRs versus the engine speeds and load at the fixed lambda of 2.75.
Figure 20 shows the spark timing pattern for the three CRs. The data shows a similar trend for both 11.65 and 12.39 CRs. With higher engine speeds and loads, the burn duration increases, which allows more spark advance as more pressurised air is inducted into the combustion chamber. Also, the spark timing shows a trend around lower engine speed and the mid-engine load as the spark timing retarded sharply around the operation points, which might be the effect of higher boosting air with the longer travel distance for the lower CR.
Spark timing of the 12.39, 11.65, and 9.27 CRs versus the engine speeds and load at the fixed lambda of 2.75.
In Figure 21, the data illustrates the burn duration ranging from 10% to 90% for all three CRs under varying loads and speeds. It is evident that the burn duration patterns exhibit similarity, indicating that higher engine speeds at higher loads lead to longer burn durations. Factors such as reduced time available for combustion, increased turbulence and potential mixture heterogeneity are likely to influence these trends. Upon comparison, higher compression ratios result in longer burn durations at the same engine speed and load compared to lower compression ratios. This finding has significant implications for the engine’s indicated thermal efficiency (ITE), making it a point of interest for further research and development.
About 10%–90% Burn duration of the 12.39, 11.65, and 9.27 CRs versus the engine speeds and load at the fixed lambda of 2.75.
Figure 22 presents values of the peak in-cylinder Pressure corresponding to varying compression ratios across the engine and load maps. The data clearly illustrates a decline in the peak in-cylinder Pressure with reduced compression ratios. Specifically, a lower compression ratio of 9.27 results in a commensurately lower peak in-cylinder pressure, enhancing the engine’s capacity to accommodate higher loads. This reiterates the key point about the relationship between compression ratios and peak in-cylinder Pressure. Conversely, higher compression ratios precipitate an earlier manifestation of the peak in-cylinder Pressure. Also, the higher CR riches higher Pmax limit without recording any abnormal knock intensity as the knock parameter was reading steady values of 0.3 and almost has similar trends for other CR. This changes the previous consideration with adopting her CR in gasoline and shows a great potential to maintain operating at MBT at the peak load with higher CR, which results in higher ITE with no knock recording.
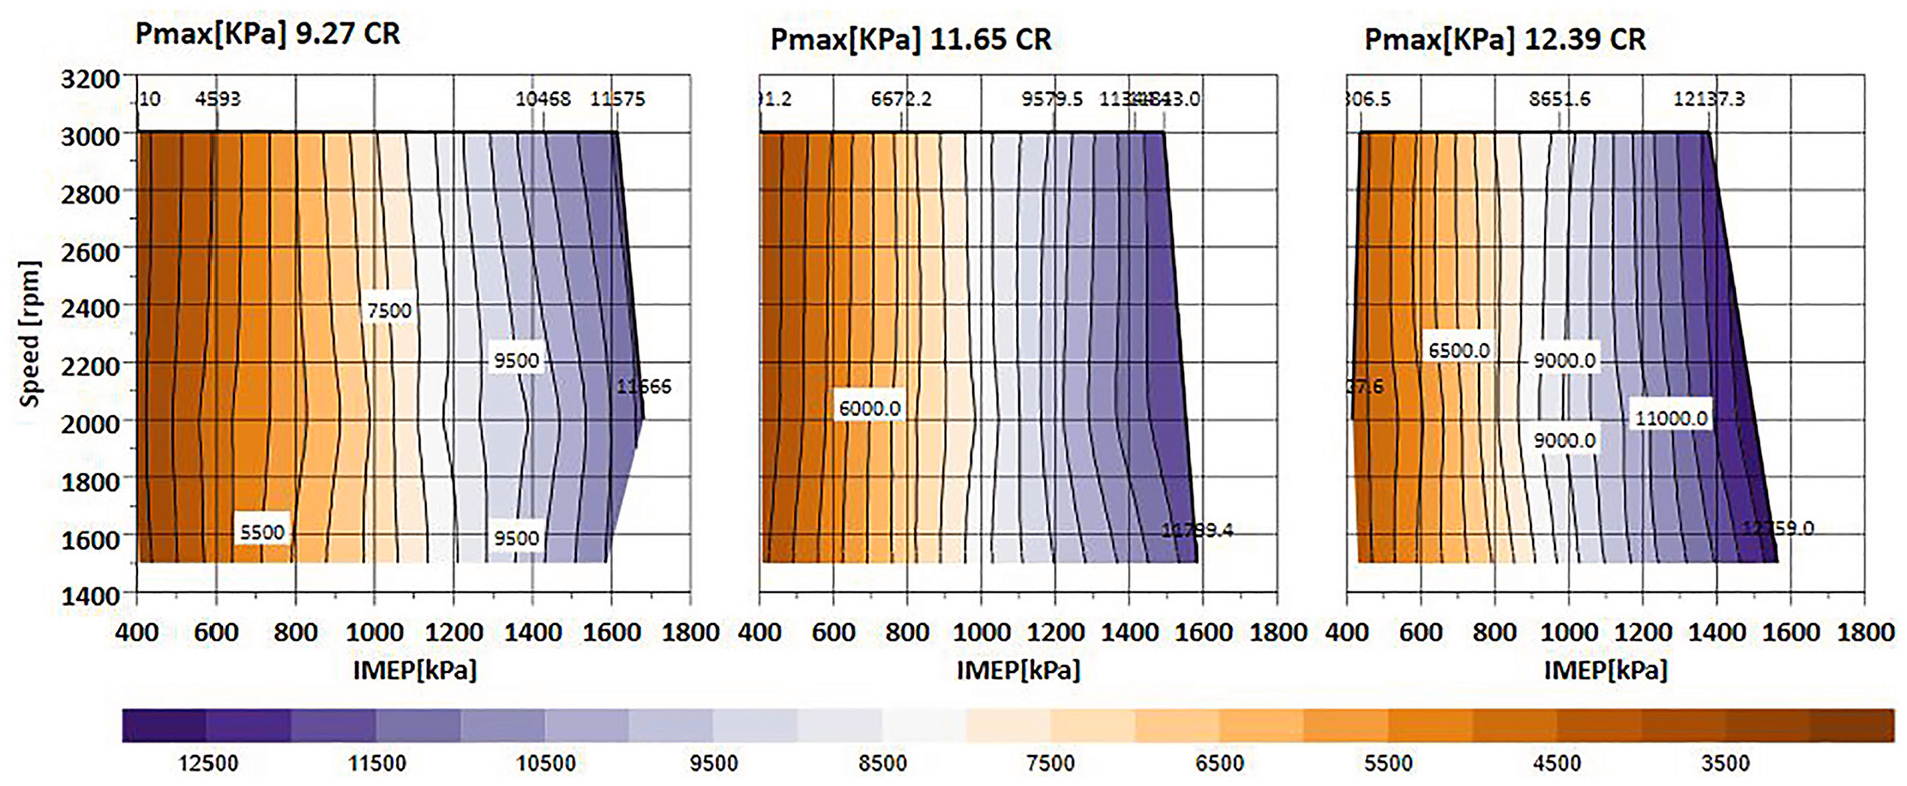
P max of the 12.39, 11.65, and 9.27 CRs versus the engine speeds and load at the fixed lambda of 2.75.
Figure 19 highlights another important limitation for the hydrogen ICE at high load operations: the Rmax of each compression ratio with different speeds and loads. As the whole load sweep tests were conducted at a constant lambda of 2.75, the Rmax was increased up to 5.5 bar/CAD, which is near the engine design limitation. This shows that even with the adoption of lower lambda at the peak load and retarding the spark, the Rmax limitation will not allow the lower compression ratio to extend the engine peak load any further. This observation shows that even with the trade-off between ITE and Peak engine load with CRs sweep, it’s very important to confirm the Rmax limits to ensure the engine adopting 100% can operate in the maximum ITE with the maximum desired load range.
Figure 23 shows the intake air pressure of the three CRs over the engine speed and load map. The data illustrate that the lower CR requires higher boosted air to achieve the same load compared to the higher CR, which explains the lower ITE as more fuel is added to maintain the same lambda value. The higher boosting intake pressure also explains the higher PMEP, per Figure 7. Taking 10 bar IMEP as a reference point, 9.27 CR requires 1.60 bar boosting air in comparison to 1.40 bar for CR = 11.65 and 140 for CR = 12.39. Also, the figure shows that for lower CR operation at 2000 rpm and peak load for CR = 9.27, the intake boosting pressure needs to be increased to 2.37 bar, which would require a combination of supercharger and turbocharger or a two-stage turbocharger.
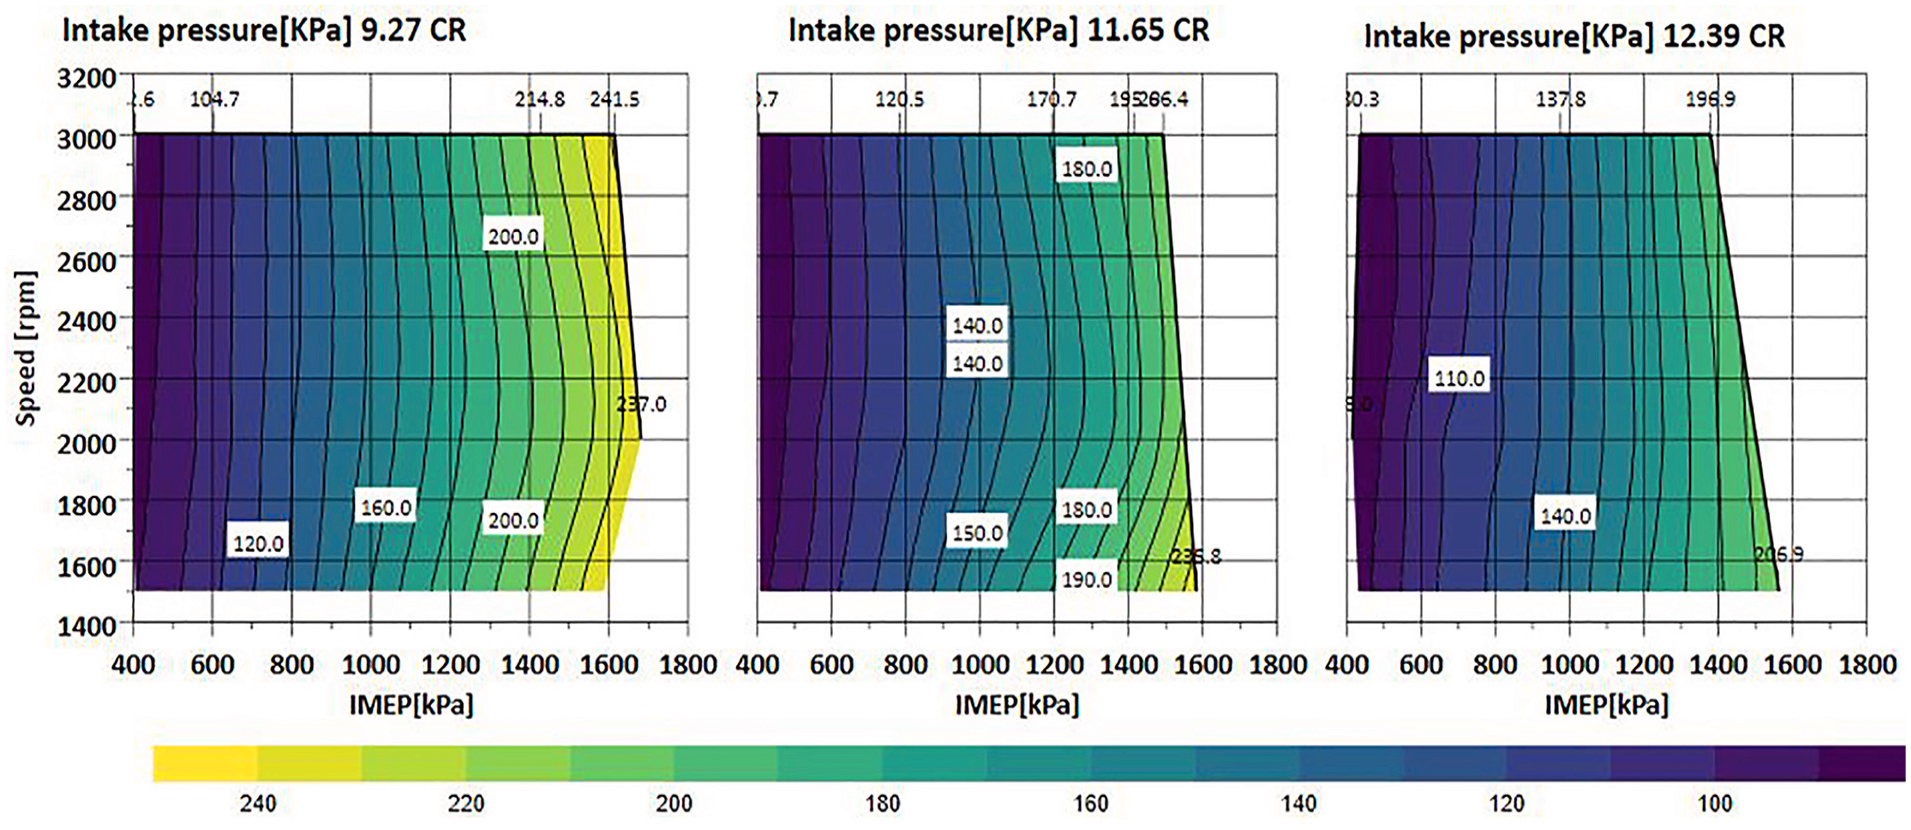
Intake pressure of the 12.39, 11.65, and 9.27 CRs versus the engine speeds and load at the fixed lambda of 2.75.
The data presented in Figure 24 illustrates the combustion stability, measured by COVIMEP, across the speed and load map of each CR. The findings indicate consistently stable combustion across all three CRs, attributed to hydrogen’s enhanced combustion efficiency and stability compared to alternative liquid fuels. Additionally, it is noted that the COVIMEP increases near the low-load region across the three CRs due to the fixed hydrogen injection pressure of 20 bar, leading to a reduction in the injection’s pulse width modulation (PWM) to under 0.6 ms. This critical injection timing causes hydrogen injection fluctuations due to the limited dynamic range of the hydrogen injector.
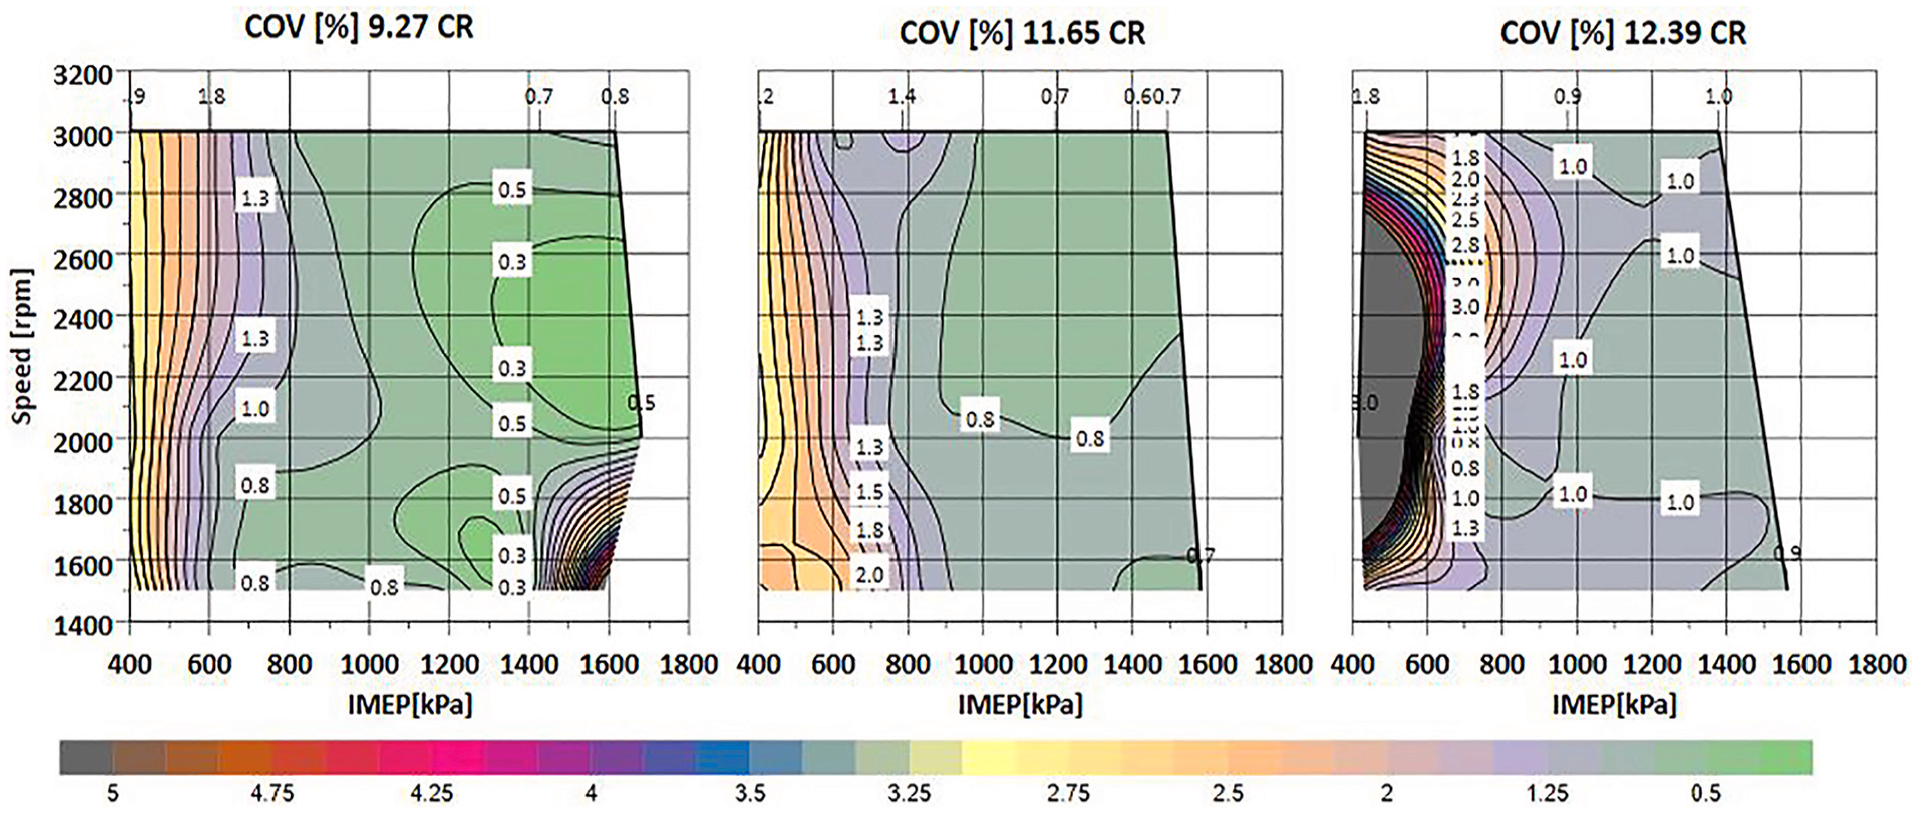
COVIMEP of the 12.39, 11.65, and 9.27 CRs versus the engine speeds and load at the fixed lambda of 2.75.
Moreover, at the lower CR of 9.27, the COVIMEP sharply decreases at maximum engine load and low engine speed due to an ignition system failure under extreme intake boosting Pressure.
Figure 25 presents the LNV results over the load and speed map. The data reveals a consistent trend similar to the COVIMEP, demonstrating highly stable combustion across a wide range of engine load-speed combinations, with an average lower net value of 95%. It is observed that at the point of ignition system failure, there is a sudden decrease in the LNV attributed to the occurrence of partial burn cycles.
LNV of the 12.39, 11.65, and 9.27 CRs versus the engine speeds and load at the fixed lambda of 2.75.
In Figure 26, the data depicts the relationship between hydrogen slip in the exhaust and engine speed and load variations. It demonstrates that hydrogen slip tends to increase in areas of high engine load and speed, reflecting a decrease in combustion efficiency due to reduced time for each cycle to complete a full combination, particularly at higher engine speeds where valve overlap remains constant across the testing map. Moreover, the NOx Engine-out emissions remained steady as the lambda was fixed over the wider load sweep at 2.7, which maintains the NOx constant below 100 ppm over the whole load sweep Also, the heat release rate (HRR) data shown in the Appendix A3 shows constant variations with the load, which suggests the lambda control accuracy over the load sweep.
H2 slip of the 12.39, 11.65, and 9.27 CRs versus the engine speeds and load at the fixed lambda of 2.75.
Conclusion
This study conducted a systematic experiment on a light-duty (400 cc) H2 SI engine equipped with a direct outwardly-opening hydrogen injector. The research has comprehensively assessed the compression ratio effect on the performance, combustion and emissions across a wide range of lambda sweep (from near stoichiometric to maximum lean-burn limits) and load sweep (from 4 bar to the maximum engine operation point) for CR = 9.27, 11.65, and 12.39. The study has provided two sets of results on multiple engine speeds, providing a wider operation map for fully understanding the CR impact on the whole engine operating range. The main findings are summarised in the following points:
The hydrogen internal combustion engine (ICE) demonstrates superior adaptability to a broad spectrum of compression ratios (CRs) while efficiently operating on extremely lean fuel-air mixtures. It surpasses the performance of conventional carbon-based fuels, exhibiting exceptional engine stability characterised by a coefficient of variation of indicated mean effective pressure (COVIMEP) averaging below 1%. Furthermore, this engine maintains higher efficiencies across a lambda range of 1–4. The explored variations in CRs also introduce novel boundaries and constraints unique to hydrogen combustion, with no knocking observed throughout the extensive lambda and load maps analysed with the adoption of the BRIC knock.
Compared to carbon-based fuels, internal combustion engines (ICE) operating on hydrogen exhibit notably improved thermal efficiency at elevated compression ratios (CR). Specifically, the indicated thermal efficiency (ITE) at a CR of 12.39 is 5.2% greater than that at 9.27. Moreover, successful combustion stabilisation has been observed at these higher compression ratios, underscoring both hydrogen-fuelled engines’ safety and efficiency potential.
SI engines do not knock under lean operating conditions to minimise NOx emissions. This characteristic enables the potential for optimising indicated thermal efficiency (ITE), with Pmax as the primary constraint. Consequently, internal combustion engines (ICE) based on a diesel architecture can achieve ITE levels approaching those of diesel engines by implementing higher compression ratios.
The CRs sweep reveals a crucial trade-off between higher ITE and Peak IMEP engine load operation. When operated with at Lambda 2.75, the decrease in CR from 12.39 to 9.27 extends the maximum load from 15.75 to 16.75 bar but at the expense of ITE from 42.5% to 36.6%, demonstrating the delicate balance required for achieving optimal engine performance.
The research indicates that hydrogen ICE yields zero carbon emissions under all compression ratios (CR). However, nitrogen oxide (NOx) emissions significantly depend on the lambda value. Implementing a lean burn operation strategy alongside Selective Catalytic Reduction (SCR) after treatment can reduce NOx emissions to nearly 0 ppm.
The study introduces another layer of challenges that must be considered when selecting the optimum CR, such as the Pmax of the higher compression ratio, which will restrict the peak engine loads. However, adopting lower compression ratios introduces another limitation, as the Rmax will be near the limit due to the hydrogen burn characteristics and the extra boosting system, which increases the chance of ignition system failure.
Footnotes
Appendix 1: Uncertainty in measurements
Engine test equipment.
| Measurement | Device | Manufacturer | Measurement range | Linearity/accuracy |
|---|---|---|---|---|
| Engine speed | AC Dynamometers (Asynchronous) | Sierra Cp Engineering | 0–6000 rpm | ±1 rpm |
| Engine torque | AC Dynamometers (Asynchronous) | Sierra Cp Engineering | −50 to 500 nm | ±0.25% of FS |
| Clock signal | EB582 | Encoder Technology | 0–25,000 rpm | 0.2 CAD |
| Hydrogen flowrate | Coriolis flowmeter K000000453 | Alicate Scientific | 0–10,000 g/h | ±0.20% of reading |
| Intake air mass flow rate | F-106 AI | Bronkhust | 4–200 kg/h | ±0.2% of reading |
| In-cylinder pressure | Piezoelectric pressure sensor Type 6125C | Kistler | 0–30 MPa | ≤±0.4% of FS |
| Intake pressure | Piezoresistive pressure sensor Type 4049A | Kistler | 0–1 MPa | ≤±0.5% of FS |
| exhaust pressure | Piezoresistive pressure sensor Type 4049B | Kistler | 0–1 MPa | ≤±0.5% of FS |
| Oil pressure | PX309-10KGI | Omega | 0–0.8 MPa | <±0.2% of FS |
| Temperature | Thermocouple K Type | RS | 233–1473 K | ≤±2.5 K |
| Fuel injector current signal | Current probe PR30 | LEM | 0–20 A | ±2 mA |
| PM emissions | DMS 500 | Combustion | 0–5000 PPS | - |
| CO emissions | MEXA-584L | Horiba | 0–12 vol% | ≤±1.0% of FS or ±2.0% of readings |
| CO2 emissions | MEXA-584L | Horiba | 0–20 vol% | ≤±1.0% of FS or ±2.0% of readings |
| O2 | MEXA-584L | Horiba | 0–25 vol% | ≤±1.0% of FS or ±2.0% of readings |
| THC emissions | Rotork Analysis Model 523 | Signal | 0–5000 ppm | ≤±1.0% of FS or ±2.0% of readings |
| NO/NO2 emissions | CLD 150 (Heated Chemiluminescence Detector) | Combustion | 0–500 ppm or 0–10 k ppm | ≤±1.0% of FS or ±2.0% of readings |
| H2 slip emissions | Air sens500 | V&F | 0–5000 ppm or 0–100 vol% | 0.5% of fs or 1 vol% |
Appendix 2: 50% Mass burn fraction for lambda and load sweep tests and total heat release
Declaration of conflicting interests
The author(s) declared no potential conflicts of interest with respect to the research, authorship, and/or publication of this article.
Funding
The author(s) received no financial support for the research, authorship, and/or publication of this article.