
Abstract
The sensors abnormalities, faults, failure detection and diagnosis for marine engines are considered crucial for ensuring the engine safe and smooth operation. The development of such system(s) is typically based on the manufacturers experience on sensors and actuators faults and failure events. This study aims to introduce a novel methodology for the sensors diagnostics and health management in marine dual fuel engines by employing a combination of thermodynamic, functional control and data-driven models. The concept of an Engine Diagnostics System (EDS) is developed to provide intelligent engine monitoring, advanced sensors’ faults detection as well as timely and profound corrective actions. This system employs a neural networks (NN) Data-Driven (DD) model along with appropriate logic controls. The DD model is set up based on the derived steady state data from a thermodynamic model of high fidelity and is capable of real-time prediction of the engine health condition behaviour. The concept of a novel Unified Digital System (UDS) is proposed that combines the engine’s existing control and diagnostic systems with the EDS. The functionality of the UDS system is validated by employing a digital twin of the considered marine dual fuel engine by investigating scenarios for assessing the engine performance that entail abnormalities in the engine’s speed and boost pressure sensors. The simulation results demonstrate that the developed UDS is capable of sufficiently capturing the engine’s sensors abnormalities and applying appropriate corrective actions to restore the engine operation in its original state. This study benefits the development future systems facilitating the engines condition assessment and self-correction of the engine sensors’ abnormalities, which will be required for smart and autonomous shipping.
Keywords
Introduction
Background
It is widely acknowledged that a new era of forthcoming technological developments has commenced in the maritime industry driven by the fourth Industrial revolution (industry 4.0) and its associated digital technologies. Several state-of-the-art technologies have been identified as the top drivers for the commercial shipping in a short to medium-scale time frame. These include fuel-efficient propulsion and powering technologies, smart and autonomous ships, advanced materials, big data analytics, robotics, sensors and communications. 1 All are linked to or influenced directly (or indirectly) by digital and communication technologies. On a modern ship, most of the installed machinery and systems are already monitored and controlled by supervisory control and monitoring systems. These systems transfer data from sensors to processing units that control electrical, mechanical, hydraulic systems components and actuators. Future developments in the shipping industry are mainly driven by artificial intelligence (AI) practices involving big data analytics and machine learning (ML) techniques, as described by Meier et al. 1 and Vuollet et al. 2 In essence, industry 4.0 leads the technological developments towards automation and data exchange in manufacturing technologies and processes, which include cyber-physical systems (CPS), the internet of things (IoT), industrial internet of things (IIOT), cloud computing, cognitive computing and artificial intelligence.
The implementation of AI capabilities has shed new light in the development of cyber-physical systems and the detailed modelling of the ship power plant by employing Digital Twins (DT).1,3,4 Pertinent examples are already shown in other industries, such as automotive and aviation, demonstrating considerable benefits in the modelled systems performance and safety. The shipping industry is also expected to adopt this trend. As processing algorithms are capable of swift data processing and machine learning algorithms gain greater levels of intelligence, the ship industry stakeholders investing in AI technologies are expected to achieve competitive advantages. Obtaining valuable information from data can assist to the effective asset performance management. Mathematical models in conjunction with big data technologies, including machine learning techniques, allow for the benchmarking of generated data sets. Machine learning systems and their algorithms are capable of churning through distinct data points from operations history, to reveal key relationships between variables that can be used to predict future trends in the asset performance. 5
There are numerous AI applications in the maritime industry. Some indicative applications are the following: (a) the ability to optimise voyages in real-time; (b) the predictive vessel management and maintenance; (c) the real time engine monitoring and performance optimisation; and (d) the engine components faults or failure detection and diagnosis. Whilst the voyage management has rapidly gained interest by the maritime industry, the remaining engine-oriented applications have only recently started gaining attention; but they are yet to be adopted by the marine engine manufacturers and operators. However, a potential AI tools integration to the existing engine control and safety systems of marine engines could bring the following benefits: (a) engine condition assessment and performance optimisation; (b) timely diagnosis of engine faults and proposal of recommended actions; (c) advanced sensors diagnostics; (d) identification of deviations from the engine healthy state; (e) in-cylinder processes analysis, and; (f) effective analysis of engine monitored parameters.1,2
Marine engine faults detection
The engine safety system(s) are considered crucial for ensuring the engine smooth operation, especially in the case of the dual fuel (DF) engines, where gas-related hazards are present. The development of such system(s) is based on the manufacturers vast experience on faults and failure detection and diagnosis in combination with Failure Mode and Effects Analysis (FMEA). 6 Therefore, faults or failure detection of the marine engines’ components (engine parts, actuators, sensors etc.) forms a main area of interest for a considerable number of studies as analysed below.
Jung et al. 7 used a data-driven model to compare the performance of classification algorithms for fault detection of fuel systems components (valves, pumps, injectors etc.) and fault isolation and demonstrated each method advantages and disadvantages. Chai et al. 8 examined the effect of fault diagnosis on a marine engine, by using a comprehensive similarity method considering the faults of high pressure pumps wear, carbon formation of the fuel injector, breakage of piston ring and exhaust valves leakage, where it was concluded that the fault diagnosis method of integrated similarity is capable of achieving higher rate diagnosis. Perera9,10 investigated the sensor faults detection for the sensors used in ships energy efficiency analysis (shaft speed, fuel consumption etc.) and proposed a two-detection levels approach to identify faults in a shipboard data acquisition system. The first fault detection level filtered the sensor values and if the sensor signals were not within a predefined range the sensor was deemed faulty. The in-range faults were detected by the second fault detection level by considering localised models where the respective data points were clustered by Gaussian mixture models with an expectation maximisation algorithm. Ntonas et al. 11 developed a framework for turbomachinery and heat exchanger components fault simulation for predicting both turbocharger and diesel engine performance and operability by developing a marine four-stroke diesel engine simulation model validated against measured data.
Xi et al. 12 examined the marine diesel engines faults detection by employing a machine learning classifier and proposed an improved methodology to avoid the human factors in the independent component analysis for vibration-source extraction. Experiments were performed for five different faults related to the inlet valve, the exhaust valve, the connecting rod, the piston pin and the piston ring. The experimental data were acquired for a commercial diesel engine and were used to evaluate the performance of the proposed method. Moreover, Kowalski et al. 13 developed a fully automatic machine learning-based system for fault diagnosis of marine four-stroke diesel engines, by monitoring engine sensors signals, and used them as an input for a pattern classification algorithm. Real-life datasets from actual engine operation were used addressing various faults (inlet and the exhaust valves leakage, uncalibrated fuel injector, fuel injection delay, etc.) and a normal operation mode for comparison and error-correcting output from the developed system. The development and implementation of intelligent diagnostic methods using machine learning algorithms were also investigated by Tsaganos et al. 14 focusing on the effective detection and diagnosis of sensors faults, such as shaft speed, pressures, temperatures etc., for two-stroke slow-speed marine diesel engines. The proposed algorithm was experimentally evaluated concluding that it demonstrated superiority against the existing algorithms due to its predictive performance accuracy. Meier et al. 1 investigated a marine two-stroke DF engine using ML tools to improve the engine maintenance planning and costs associated. Zymaris et al. 15 employed a software for the condition assessment of a ship propulsion plant.
Li et al. 16 elaborated on the combustion-related faults detection of a marine diesel engine using the instantaneous angular speed. The authors performed numerical simulations for a six-cylinder engine along with instantaneous angular speed data measurements for evaluation purposes and concluded that the proposed fault detection method can offer improved detection capability with high accuracy. Zhao et al. 17 investigated the fault tracking control issues in ship propulsion systems and proposed a simple adaptive fault-tolerant Proportional–Integral (PI) tracking control scheme using an adaptive tuning law to adjust the controller gains during operation. Simulations runs were performed on a case study ship propulsion system to demonstrate the effectiveness and advantages of the proposed control strategy. Jiang et al. 18 examined the valve clearance fault detection based on the vibration signals measured on the engine cylinder heads and the feature extraction approach. Experiments were conducted for validation purposes on a 12-cylinder engine test rig and the results showed that the feature extraction approach is capable of accurately identifying the impact of the valve closing. Hountalas and Kouremenos 19 presented a method for marine two-stroke diesel engine fault diagnosis by processing measured engine data using a simulation model and demonstrated the application of the method for the case of the engine operation with high cylinder exhaust gas temperatures and low power output. Pagán Rubio et al. 20 and Vera-García et al. 21 employed a faulty simulator based on thermodynamic modelling to investigate the improvements of a failure database used for a four-stroke high-speed marine diesel engine. This database was assembled by considering FMEA, as well as an analysis of the symptoms obtained in an engine failure simulator. The FMEA was performed following the methodology of Reliability-Centred Maintenance (RCM), whilst the engine response against failures was obtained from a failure simulator based on a thermodynamic one-dimensional model, which was adjusted and validated with experimental data.
A survey on diagnosis methods for automotive engines is presented in Mohammadpour et al. 22 Yu et al. 23 investigated the dynamic fault detection and isolation for automotive engines by employing neural network models. Tse and Tse 24 focused on the diagnosis of the combustion-related faults (defective spark plug, oil leakage, defective valves, cylinder wear) in automotive engines by the use of low-cost sensors for the instantaneous angular speed method. It was concluded that this method could clearly reveal the differences between normal and abnormal engine combustion process and is capable of generating quality fault diagnostic results comparable with those obtained using expensive and conventional pressure sensors. Furthermore, Ng et al. 25 presented a novel open-source simulation software for evaluating residuals and fault diagnosis methods of a turbocharged sparkle-ignited automotive engine. Jafarian et al. 26 employed a statistical approach to classify an automotive engine operation state and experimentally validated the fault diagnosis, including the misfire and valve clearance faults, using the vibration data captured by sensors.
The following key findings were identified from the preceding literature review:
– Engine components faults and failure detection have been thoroughly covered by a number of research studies, some of which considered the applicability of AI techniques. These studies mainly investigated various faults detection approaches on marine diesel engines, with primarily interest on two-stroke engines.
– AI and ML tools in the maritime industry are mostly oriented towards the engine components faults diagnosis focusing on the maintenance planning.
– Sensors abnormalities and their impact on the engine faults and failure diagnosis have not been investigated for marine DF engines. The term ‘sensor abnormalities’ in this study is used to describe the inaccurate or erroneous sensor measurement(s) that may be attributed to uncalibrated (drift, offset and gain), fouled (unmaintained) or actually faulty (defective) sensors.
– Applications of AI and ML tools for marine DF engines are not reported in the pertinent literature.
Research aim
This study aims to present a novel methodology to develop and test the concept of the Unified Digital System (UDS) for diagnostics and health management, which include the engine actuators/sensors abnormalities detection and correction. The proposed UDS system is validated for the case of a large marine DF engine by employing an engine digital twin of high fidelity. The presented methodology combines the thermodynamic and functional control approaches along with a data-driven model. A number of case studies introducing abnormalities in the engine speed and boost pressure sensors are employed to investigate the corrective response effects demonstrating the effectiveness of the proposed UDS concept. A method to implement actions to correct the identified sensors abnormalities is also developed resulting in the recovery of the engine response to the reference (healthy) state. This study is based on a modified version of an existing marine DF engine digital twin (DT) developed for simulating the engine steady state and transient operations in the GT-ISE software.3,27
The novelty of this study stems from the use of the engine digital twin in conjunction with state-of-the-art methods and tools including a data-driven (DD) model to detect and correct the engine sensors abnormalities. The proposed concept of the engine UDS is also novel and when implemented is expected to improve the status of the current engine safety systems. Moreover, this study results analysis lead to the better understanding of the involved engine phenomena, underlying critical engine operating parameters and revealing the combined effects of engine sensors abnormalities to the engine response.
Methodology
This study employs the digital twin (DT) of a marine DF engine developed in authors’ previous studies implemented in the GT-ISE software.3,27 This DT is further expanded to accommodate the model of the proposed UDS that is capable of performing the engine sensors and actuators abnormalities detection, diagnosis and corrective actions implementation. The UDS model along with the considered engine DT are employed for the demonstration and validation of the proposed UDS and its subsystems functionalities. These systems’ development referred to this study does not imply the development of an industrial system including hardware and software, as this is considered out of the scope of the present study. The engine mechanical components (valves, fuel injectors, etc.) faults and/or failure detection and diagnosis are also not considered under the scope of this study. Lastly, the engine sensors and data acquisition system dynamics are not modelled in this study.
The followed methodology involves the combination and utilisation of state-of-the-art tools and diagnosis methods, and constitutes from a background phase (phase 0) and four other phases (1−4). This methodology flowchart (illustrating phases and steps) is presented in Figure 1.
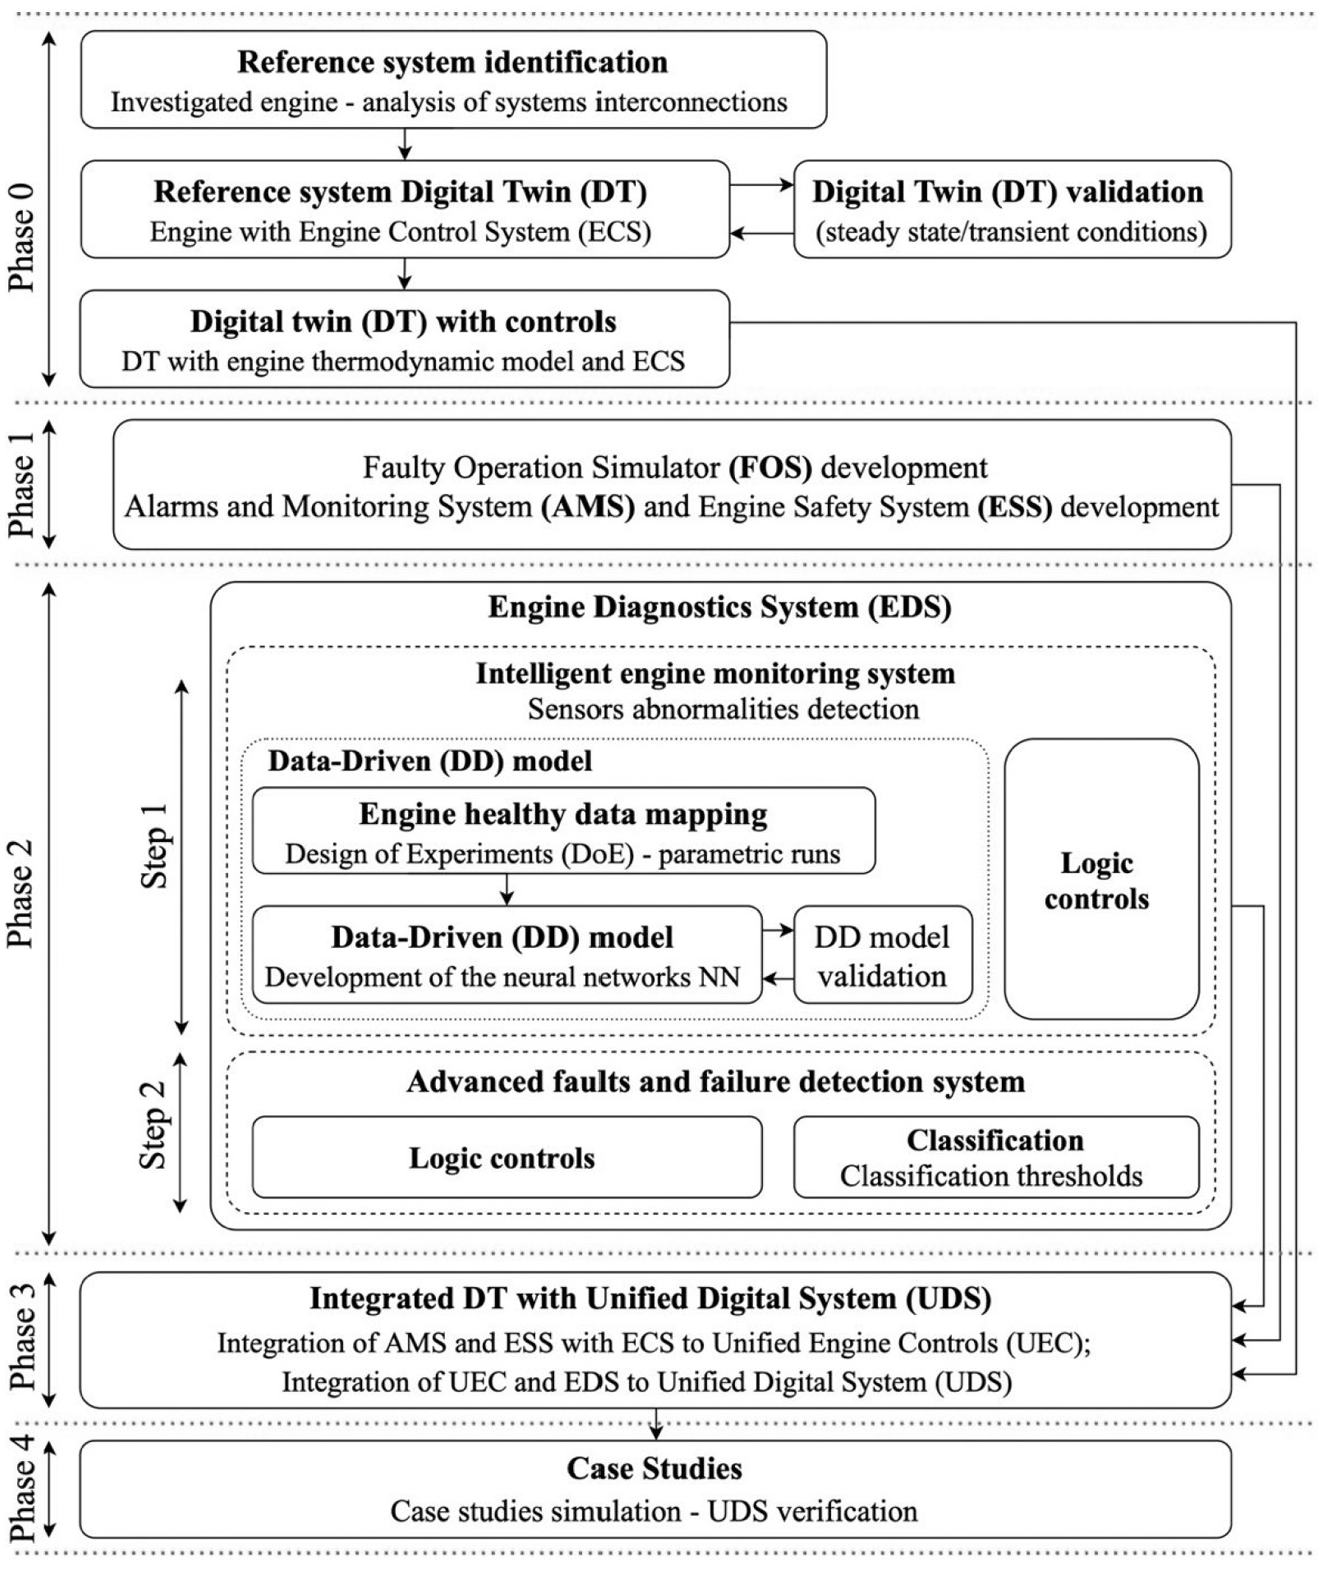
Methodology layout.
Phase 0 entails the identification of the reference system (considered engine) under investigation and the customisation of the validated DT, which consists of the engine thermodynamic model as well as the control functional model (engine control system (ECS)). This DT was adopted from previous authors’ studies3,27 and lays the foundations to proceed with the next phase.
Phase 1 focuses on the development of systems that extend the existing ECS functionality to accommodate defined/specific sensor abnormalities and to monitor the engine parameters, as well as to raise and log engine alarms. In specific, the faulty operation simulator (FOS) model is developed in the GT-ISE for representing the investigated sensor abnormalities, which handles/modifies the sensor(s) signals (measurements). The alarms and monitoring system (AMS) and the engine safety system (ESS) models are also developed in the GT-ISE. The AMS monitors a number of engine performance parameters and raises appropriate alarms, when the defined thresholds are surpassed. The ESS includes the gas fuel safety related controls.
Phase 2 includes the development and testing of an engine diagnostics system (EDS) aiming to address: (a) the sensors abnormalities/faults detection and diagnosis; and (b) the actuators faults and failure detection. This phase consists of the following two discrete steps: (a) development of the intelligent engine monitoring system, and; (b) development of the advanced faults and failure detection system. The former employs a data-driven (DD) model to identify the sensors abnormalities, whereas the latter introduces a new set of actuators and sensors faults and failure detection logical expressions and conditions to incorporate the engine intelligent monitoring that extends the engine’s manufacturer detection and diagnosis methods. The data-driven model of the intelligent engine monitoring system employs neural networks (NNs) that are trained to represent a number of the engine operational parameters under engine healthy conditions, and has a very low computational effort (real-time). The data set employed for the NNs training and validation is generated by using the engine digital twin in GT-ISE to perform parametric runs via the design of experiments (DoE) tool provided by GT-ISE. The developed DD model is used to predict the healthy (expected) operational parameters values that are compared with the actual values of these parameters to identify any sensors’ abnormalities.
Phase 3 focuses on the integration of the existing DT (phase 0) with the proposed systems. In specific the existing ECS is grouped with AMS and ESS to form the Unified Engine Controls (UEC), which in-turn is integrated with the EDS (phase 2) into one single system; namely the Unified Digital System (UDS). This integration goal is to establish a unique digital ‘core’ (with all the control systems interconnected), that monitors the engine performance and is capable of detecting and correcting any sensors abnormalities, faults or failures.
Lastly, Phase 4 includes the validation of the functionalities of the developed UDS (phase 3) by employing the engine DT for a number of case studies considering abnormalities of the engine’s speed and boost pressure sensors.
Employed systems description
Investigated engine
The reference system selected for investigation in the present study is the Wärtsilä 9L50DF. 28 This is a marine four-stroke DF engine, equipped with one turbocharger (T/C) unit, able to operate in following two modes: gas (DF) and diesel (DI) mode. Due to the DF concept, the engine exhibits fuel flexibility, whereas the lean combustion mixture principle that the engine operates, results in low emissions in combination with high efficiency and reliability. Therefore, this engine is considered an attractive solution for electric power generation and ship propulsion. 29 The engine geometrical and operational specifications are reported in the manufacturer product guide 28 and the main engine characteristics are illustrated in Table 1.
Engine main characteristics.
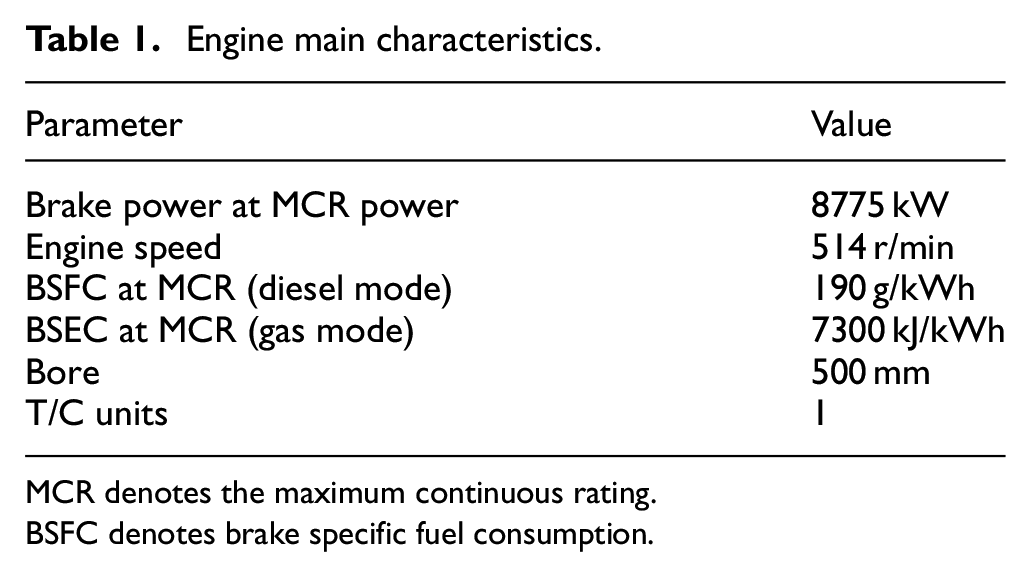
MCR denotes the maximum continuous rating.
BSFC denotes brake specific fuel consumption.
Existing engine Digital Twin (DT)
The DT of the Wärtsilä 9L50DF engine (phase 0) consists of the engine thermodynamic model representing the main engine, and the engine control functional model (Engine Controls System (ECS)) representing the engine control systems. Both the engine thermodynamic model and the ECS functional control structure and functionalities are reported in previous publications of the authors3,27 and therefore, will not repeated herein.
Proposed systems
Unified Engine Controls (UEC) system
As shown in Figure 2, the Unified Engine Controls (UEC) system is derived by the integration of the Engine Control System (ECS) (developed in Stoumpos et al. 3 ) with the Alarms and Monitoring System (AMS) and the Engine Safety System (ESS), the models of which are developed during Phase 1 of this study.
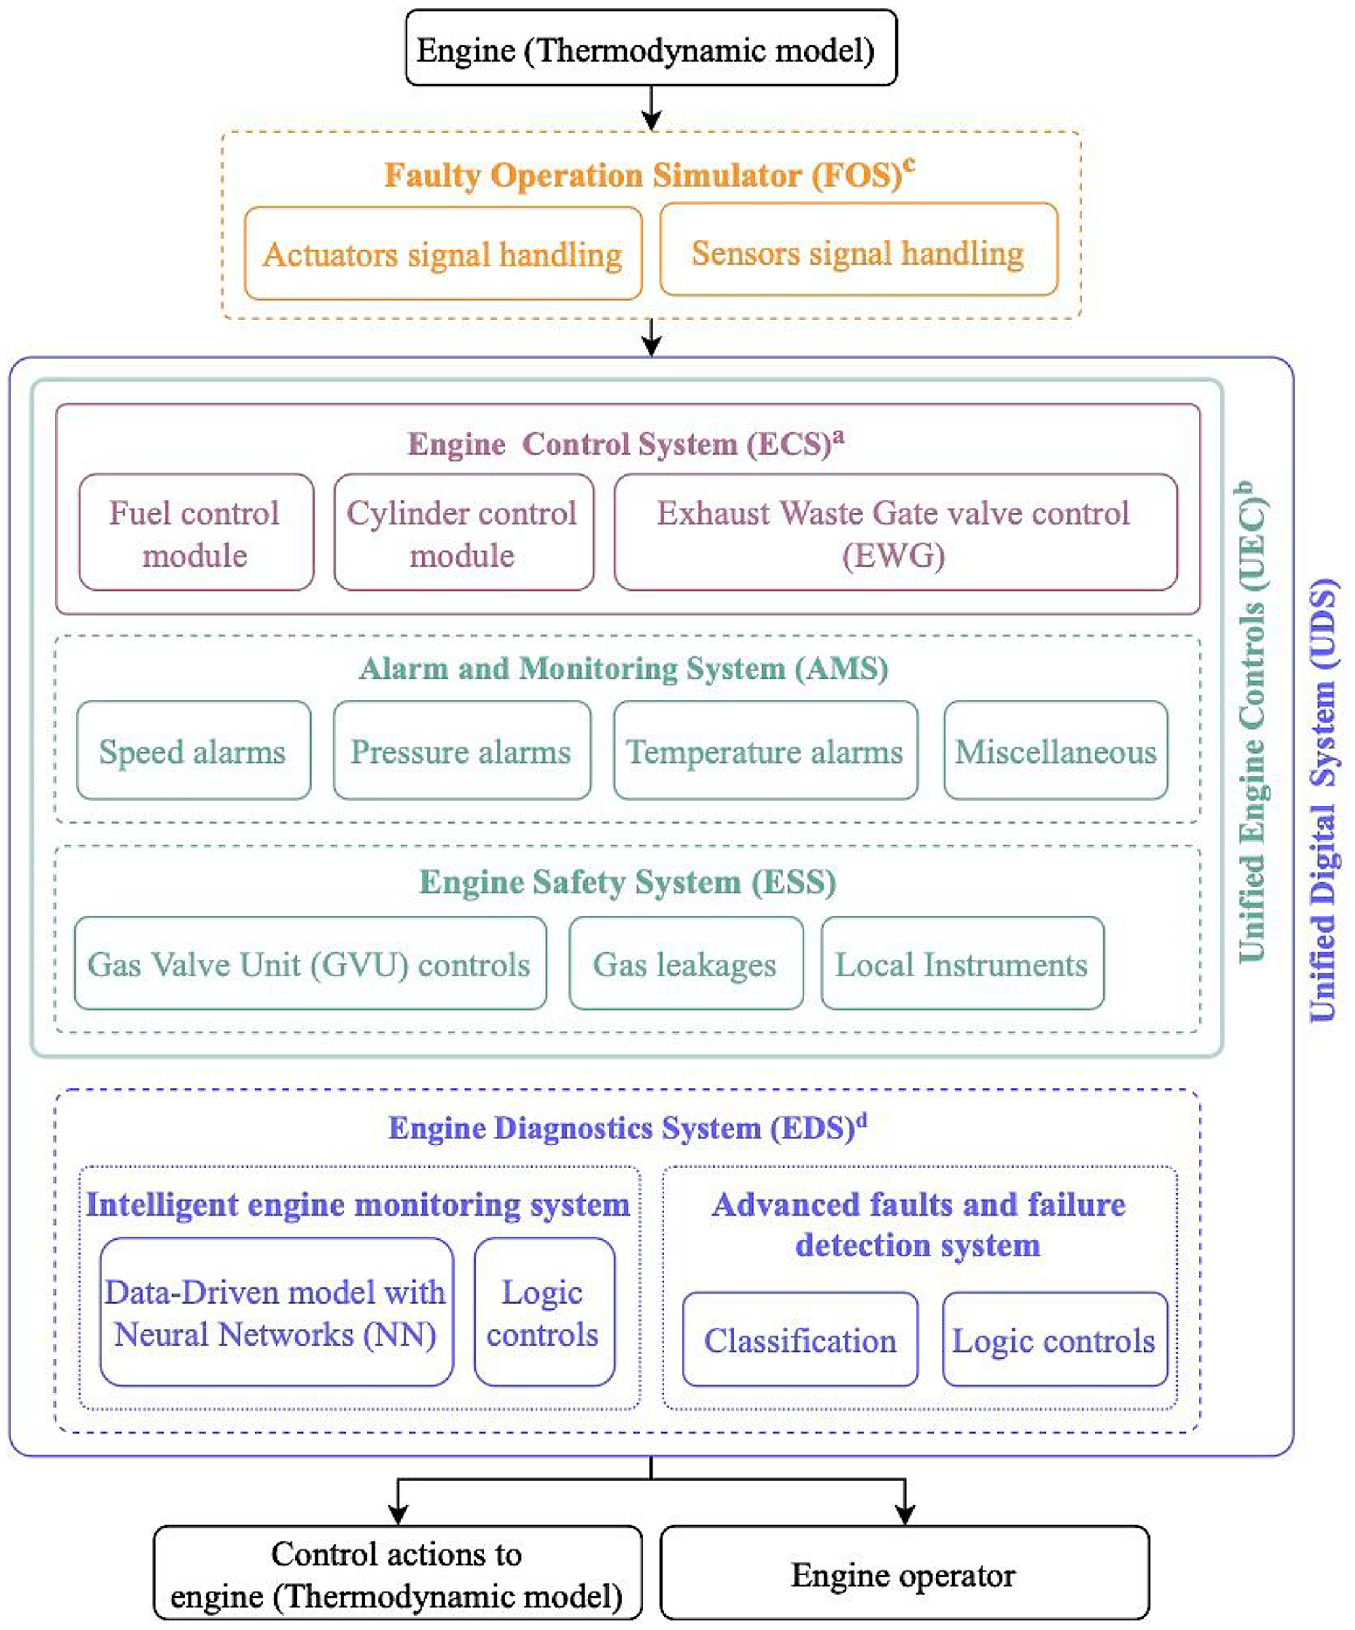
Unified Digital System (UDS) structure flowchart: (a) existing engine control system (ECS), (b) proposed Unified engine controls (UEC) system, (c) proposed faulty operation simulator (FOS), and (d) proposed engine diagnostics system (EDS).
The Alarms and Monitoring System (AMS) consists of the logic controls that monitor a number of engine critical operating parameters (engine speed, boost and exhaust gas pressure and temperature) and trigger respective alarms, should the actual values exceed the manufacturer thresholds. In this respect, the AMS is employed to monitor the engine parameters and log the raised alarm events, thus identifying potential safety implications during engine operation.
Furthermore, the Engine Safety System (ESS) is responsible for monitoring the operation of the Gas Valve Unit (GVU), and consequently, the gas (fuel) pressure in the gas (fuel) manifold. The installed engine sensors for gas leakage as well as the ECS and AMS are interconnected with the ESS in order to exchange information and ensure that the engine operates in a smooth and expected manner.
Faulty Operation Simulator (FOS)
The FOS is established to enable a number of simulations under faulty actuators conditions (e.g. Exhaust waste gate (EWG), GVU) or abnormalities to the engine pressure, temperature and speed sensors. In this respect, the FOS interacts between the engine components (actuators or sensors) and the ECS, and handles the actuators/sensors and ECS feedback signals accordingly. The FOS functions are modelled by employing the following two discrete modules: (a) the sensors’ signals handling; and (b) the actuators’ signals handling. The former employs ‘delay’, ‘gain’ and ‘offset’ signal handling elements to simulate the sensors faults and/or measurements bias, whereas the latter employs ‘delay’ and ‘hold’ signal handling elements to simulate the actuators delays or null/non-responsive conditions on the actuators, respectively. The type of faults, the components under faulty operation as well as the magnitude, timing and duration of these faults are defined by the user.
Engine Diagnostics System (EDS)
The EDS is an innovative diagnostics system that offers intelligent engine monitoring as well as advanced faults and failure detection, irrespectively of the engine load and operating mode. To achieve this, the following EDS structure is conceived. Initially, the intelligent engine monitoring system employs a data-driven model of the neural networks (NNs) type to predict with high accuracy a number of key operational parameters corresponding to the engine healthy operation for a range of boundary conditions (detailed description follows in the next section). This enables the expected (healthy) values for these monitored operating parameters predicted by the DD model to be compared via logic controls against the actual parameters values acquired from the engine sensors.
The sensors/actuators failure detection model (employed by the manufacturer) is further expanded, by utilising logic controls (logic expressions), in order to incorporate the intelligent monitoring capabilities, which in turn allows for the classification of any sensors abnormalities. In that sense, the output of the intelligent monitoring system is used to classify sensor faults/abnormalities, and furthermore, to provide more accurate (advanced) faults and failures detection and diagnosis based on the engine performance. In-depth discussion on the modelling approach, methods and tools employed for the development of EDS is included in the next section.
Unified Digital System (UDS)
The proposed UDS is formed by integrating the UEC (incorporating ECS, AMS and ESS) with the FOS and the EDS as illustrated in Figure 2. The UDS integration phase is mainly associated with the establishment of interconnections between these systems (UEC, FOS, EDS) for exchanging information, such as input data from the engine (e.g. sensors measurements) and the individual systems output (e.g. alarm events, fuel control actions, EWG control actions, etc.). Hence, the UDS provides as output the collective response (including corrective actions) from all the control functional systems to the engine.
Modelling methods and tools
Existing engine Digital Twin (DT)
The engine model employed in this study was realised in the GT-ISE software, 30 which provides the tools, libraries and functionalities to address the inherent complexity of the engine modelling. The 0D/1D (zero-dimensional/one-dimensional) engine model of the investigated engine was previously developed for steady state conditions as described in Stoumpos et al. 27 and transient conditions as reported in Stoumpos et al. 3 The detailed description of the model is reported in the previous publications of the authors3,27 and therefore it will not be repeated herein.
Faulty Operation Simulator (FOS) and Unified Engine Controls (UEC) system
All the functional processes of the FOS and AMS models are mainly achieved by using logic controls that apply logic expressions to generate definite events; for example, raise an alarm on an event of engine overspeed above the manufacturer alarm threshold.
On the other hand, the ESS functional control model is not limited to logic controls. The Gas Valve Unit (GVU) is modelled by considering a pre-set maximum pressure (6 bar) gas supply from the GVU to the gas (fuel) manifold, and a controlled valve regulating the gas (fuel) manifold pressure to the pre-set value for each load in the gas mode. In this respect, the GVU module is developed to control the gas fuel pressure in the gas (fuel) manifold. 28 To achieve this, the GVU control module is modelled to monitor the gas (fuel) manifold pressure (based on the gas (fuel) manifold pressure sensor) and regulate the GVU valve position accordingly to achieve the targeted gas (fuel) manifold pressure, as a function of engine load. The developed GVU control module consists of a proportional-integral (PI) controller, tuned by using the Ziegler-Nichols method according to the guidelines provided in Leigh 31 and Graf. 32 The gas (fuel) manifold pressure data for the discrete engine loads in the gas mode operation is reported in the engine project guide. 28 It must be mentioned that the gas feeding system is not considered under the scope of this study.
Engine Diagnostics System (EDS)
Amongst the main novel capabilities of the developed EDS is the intelligent engine monitoring, which aims at identifying and evaluating the sensors abnormalities. The EDS employs a real-time data-driven (DD) model, capable of predicting the engine ‘healthy’ operating parameters as well as the logic controls that will allow for the data processing and analysis.
Intelligent engine monitoring system – Data-driven model
For the development of the DD model, the existing digital twin (DT) is used to provide the ‘reference’ or ‘healthy’ engine operating parameters for any possible combination of boundary conditions and engine operating conditions. In this respect, a large number of simulation runs for combinations of all the possible engine operating conditions are being performed a-priori. For the simulation runs design, the Design of Experiments (DoE) tool, which is integrated in the GT-ISE software, is employed. The digital twin simulations were performed for the engine steady state conditions in the gas and diesel modes at 25%, 50%, 75%, 85% and 100% loads considering the following engine operating parameters (factors) varying within the ranges provided in Table 2: (a) the ambient temperature; (b) the diesel fuel lower heating value (LHV); (c) the gas fuel LHV; (d) the GVU gas pressure; and (e) the air cooler (A/C) coolant temperature. The ‘full factorial’ DoE method is employed, 33 in order to impose the minimum and maximum values, as well as the number of levels for each parameter (factor).
DoE variable engine operating parameters.
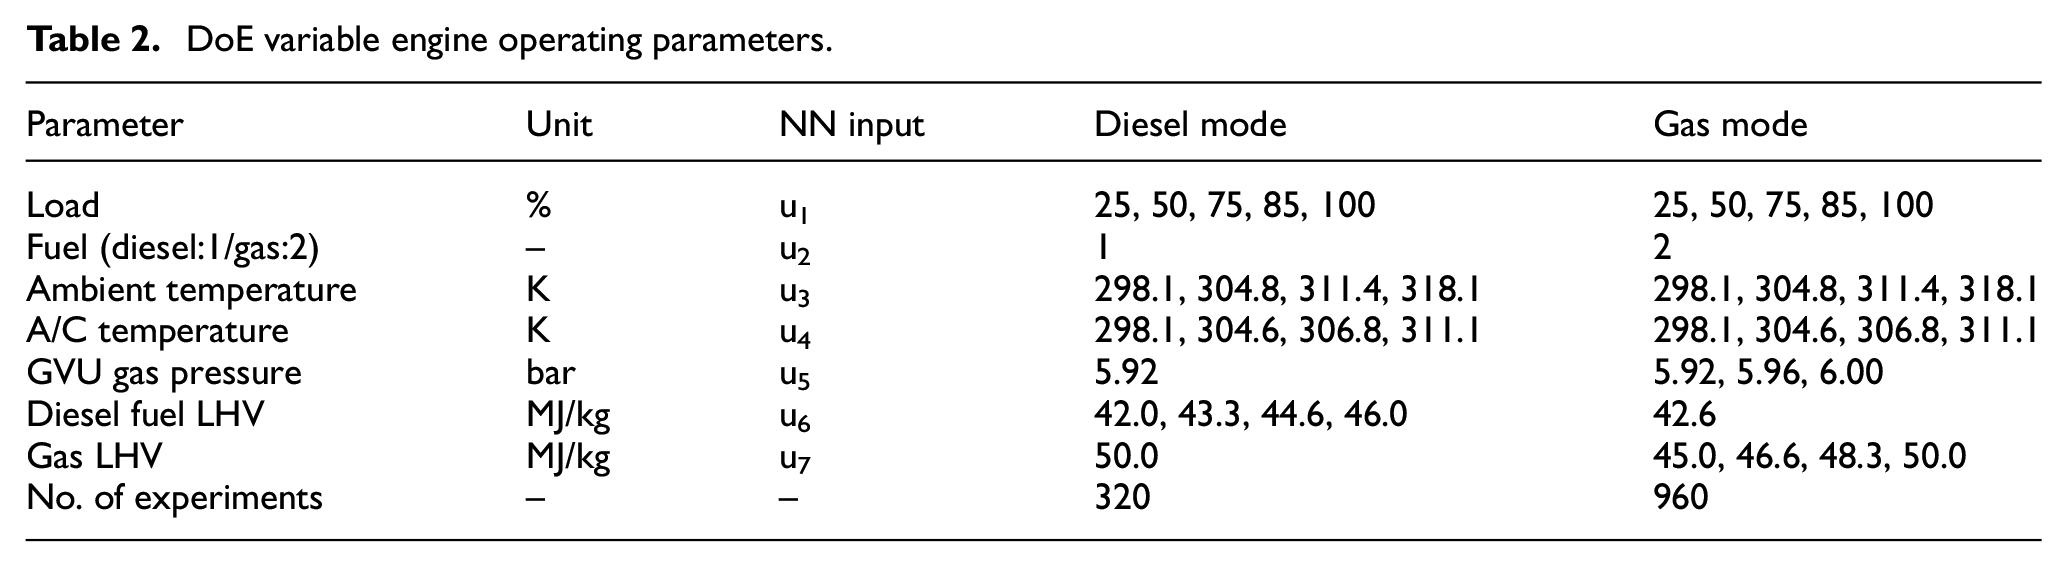
The upper and lower limits of the considered varying engine operating parameters were estimated based on authors’ previous experience. For the simulation runs in the diesel mode, gas fuel is not used, thus the GVU gas pressure and the gas lower heating value were disregarded. Similarly, the simulation runs for the gas mode did not consider the diesel fuel lower heating value.
The engine operating parameters recorded during the DoE simulation include: (a) the diesel fuel rack position; (b) the average maximum cylinder pressure; (c) the charge air inlet manifold pressure; (d) the charge air inlet manifold temperature; (e) the charge air mass flow rate; (f) the T/C speed; (g) the exhaust gas temperature at turbine inlet; (h) the exhaust gas temperature at turbine outlet; (i) the exhaust gas pressure upstream turbine; (j) the exhaust waste gate valve opening; (k) the gas injection duration; (l) the gas (fuel) manifold pressure; (m) the air−fuel equivalence ratio; (n) the NOx emissions; (o) the CO2 emissions; (p) the engine brake efficiency; (q) the BSFC (diesel mode); (r) the brake mean effective pressure, and; (s) the engine brake power. Parameters from (o) to (s) are interdepended and only the brake power is used for the identification and correction of the sensor faults discussed in the following sections. Parameters (a) to (l) are monitored by using single sensors, whereas parameters (m) to (s) are calculated by using acquired data from various sensors.
The mapping of these engine operating parameters is conducted with the aim to populate the available operational data from the DoE simulations and use them to train a set of Neural Networks (NNs) (one NN for each parameter). In this respect, these NNs form the data-driven (DD) model, which is used to predict with adequate accuracy, the engine ‘reference’ operating parameters corresponding to the engine ‘healthy’ operation. The preceding metrics (a) through (s) are also defined as the operational parameters are monitored by the EDS during the engine actual operation. For training the NNs, the 90% of the populated data (DoE simulation results) is used, whereas a random 10% of the data is reserved for NNs validation.
The NNs training was examined by employing the following methods: (a) global polynomial; (b) self-organising local linear; (c) self-organising local non-linear; and (d) feedforward. 34 By calculating and comparing the minimum errors between the employed training methods, the feedforward method was identified as the most accurate method for the NNs training.
The two-layer and three-layer feedforward layouts were examined (one input and one output layers/ two input and one output layers, respectively). The three-layer feedforward layout was proven to be more accurate for predicting the EDS monitored parameters, therefore it was selected for the NNs training carried out in this study. The input parameters of the developed NNs are presented in Table 2 whereas the selected settings are provided in Table 3.
Feedforward method settings for NNs training.
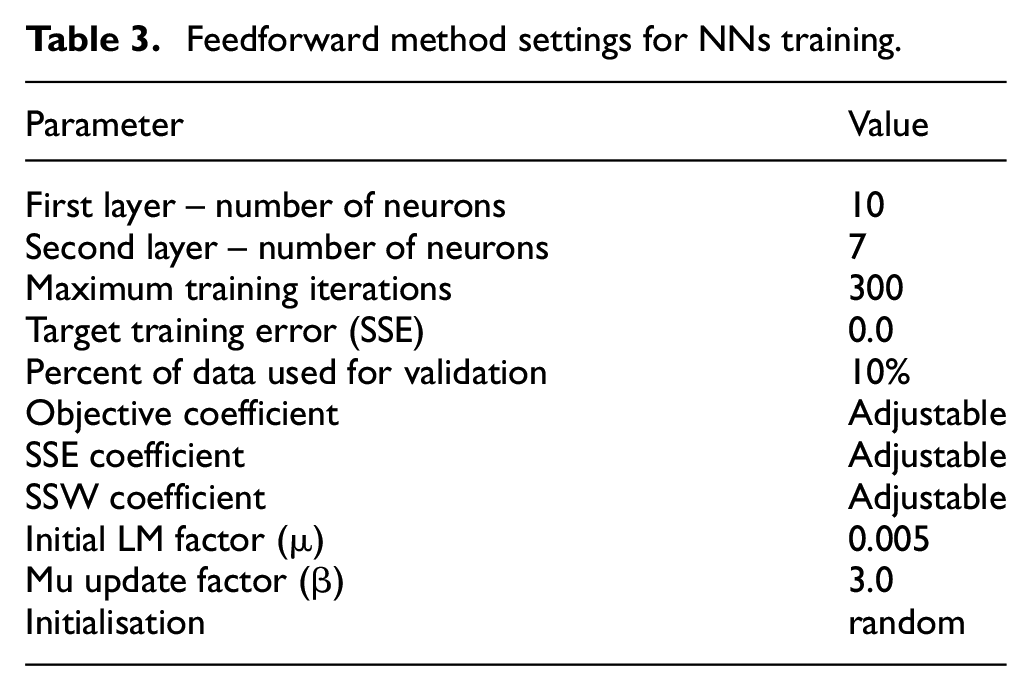
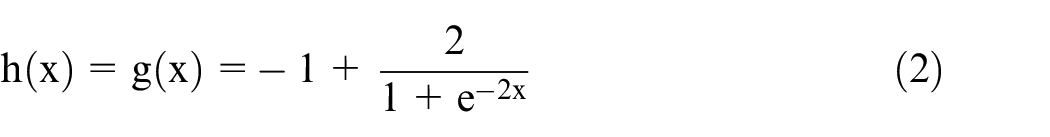
Based on the preceding analysis, the developed DD model consists of NNs with two hidden layers and one output layer. The NNs output, y, is calculated by employing the following equation:

where h and g denote the activation functions of the first and second layer, respectively; v and a are the weights and biases of the first hidden layer; z and b are the weights and biases of the second hidden layer; w and c are the weights and biases of the output layer; and u denotes the NNs input.
The activation functions of the first hidden, the second hidden and the output layers (h and g) are calculated according to the following equations:
The feedforward method calculates the weights and biases of the Neural Network by employing the Levenberg-Marquardt optimisation method35,36 in order to minimise the following objective function:

where SSE denotes the sum of square errors and SSW the sum of square weights.
The objective function weights k1 and k2 can be dynamically calculated using the Bayesian regularisation algorithm 36 or set as constant values. In this study, the k1 and k2 values are dynamically calculated.
The number of the neurons for the first and second hidden layer were determined considering the suggestions provided in the software manual 34 and by a trial and error process. After training the NNs, those that produced the most promising output were saved. The basis of determining a promising network is the comparison of the DT parameter values (training data) to the output of the NNs (simulated data). The employed feedforward neural networks flowchart is presented in Figure 3.
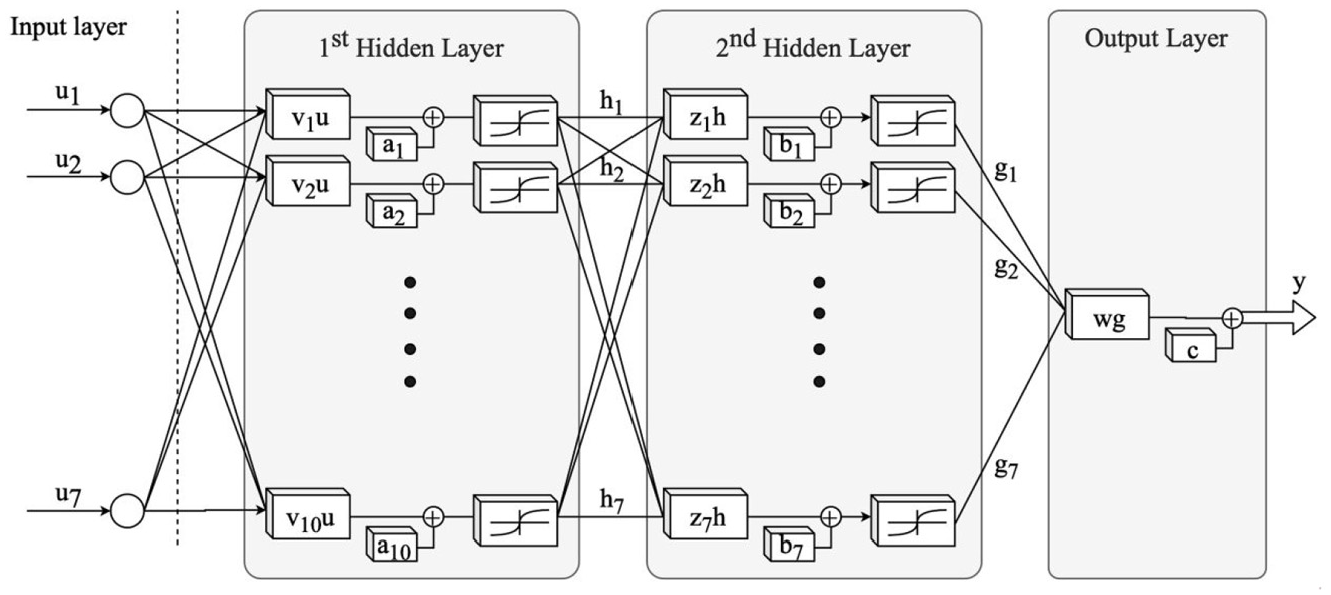
Feedforward neural network.
Intelligent engine monitoring system approach – logic controls and classification
This subsection describes the approach employed for the development of the intelligent engine monitoring system that identifies and classifies the sensors abnormalities.
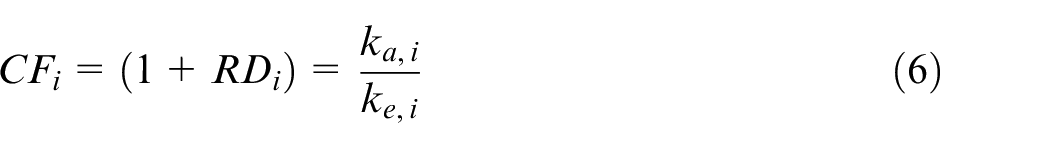
The EDS is fed with the engine operational parameters measurements, as these are initially generated by the digital twin (the data are acquired from the particular sensors included in the developed digital twin in GT-ISE) and subsequently provided to the FOS. The acquired operating parameters measurements (from the DT) are compared in the EDS logic control with the ‘reference’ data, which are derived by simultaneously running the developed DD model. This allows for the data processing and analysis in order to identify discrepancies between expected ‘healthy’ and ‘actual’ behaviour of the EDS monitored operating parameters. Any deviation, between the digital twin measurements and the DD model values (at the same operating conditions) of the EDS monitored parameters is calculated and classified based on the EDS sensors measurements thresholds, according to the classification zones provided in Figure 4. The error clarification factor is estimated by employing the following equation:
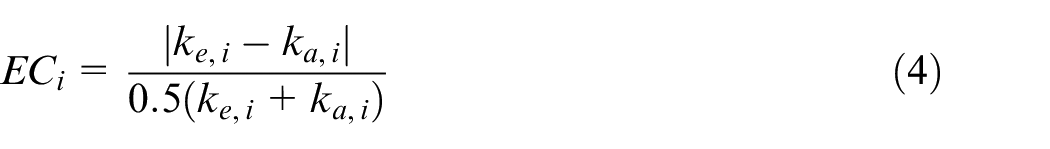
where i denotes the sensors and monitored performance parameters, ECi denotes the error clarification factor, whereas ke,i and ka,i denote the values of the expected and actual key operational parameters, respectively.
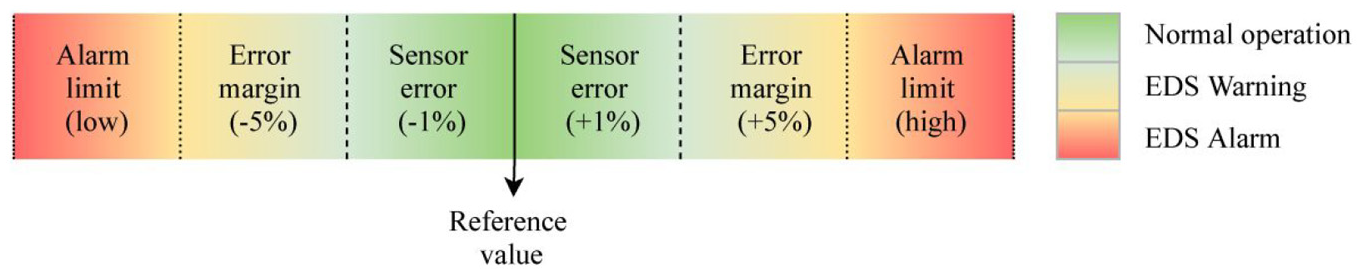
EDS sensors measurements thresholds.
It must be noted that the ‘sensor error’ region (normal operation) accounts for the deviations between the DD model and DT, where the engine operation is considered ‘healthy’. The ‘error margin’ (EDS Warning) and ‘alarm limits’ (EDS Alarm) regions/zones were selected based on the pertinent literature37,38 and are indicative for all sensors. In an actual implementation, a customisation of these zones is expected for each sensor type based on actual sensors data (errors). Each monitored parameter and the calculated error from its ‘reference’ value are then forwarded to the EDS advanced sensors faults and failure detection to facilitate the engine diagnostics. It must be mentioned that the thresholds presented in Figure 4 are user-defined in the developed EDS model.
Advanced sensors faults/failure detection
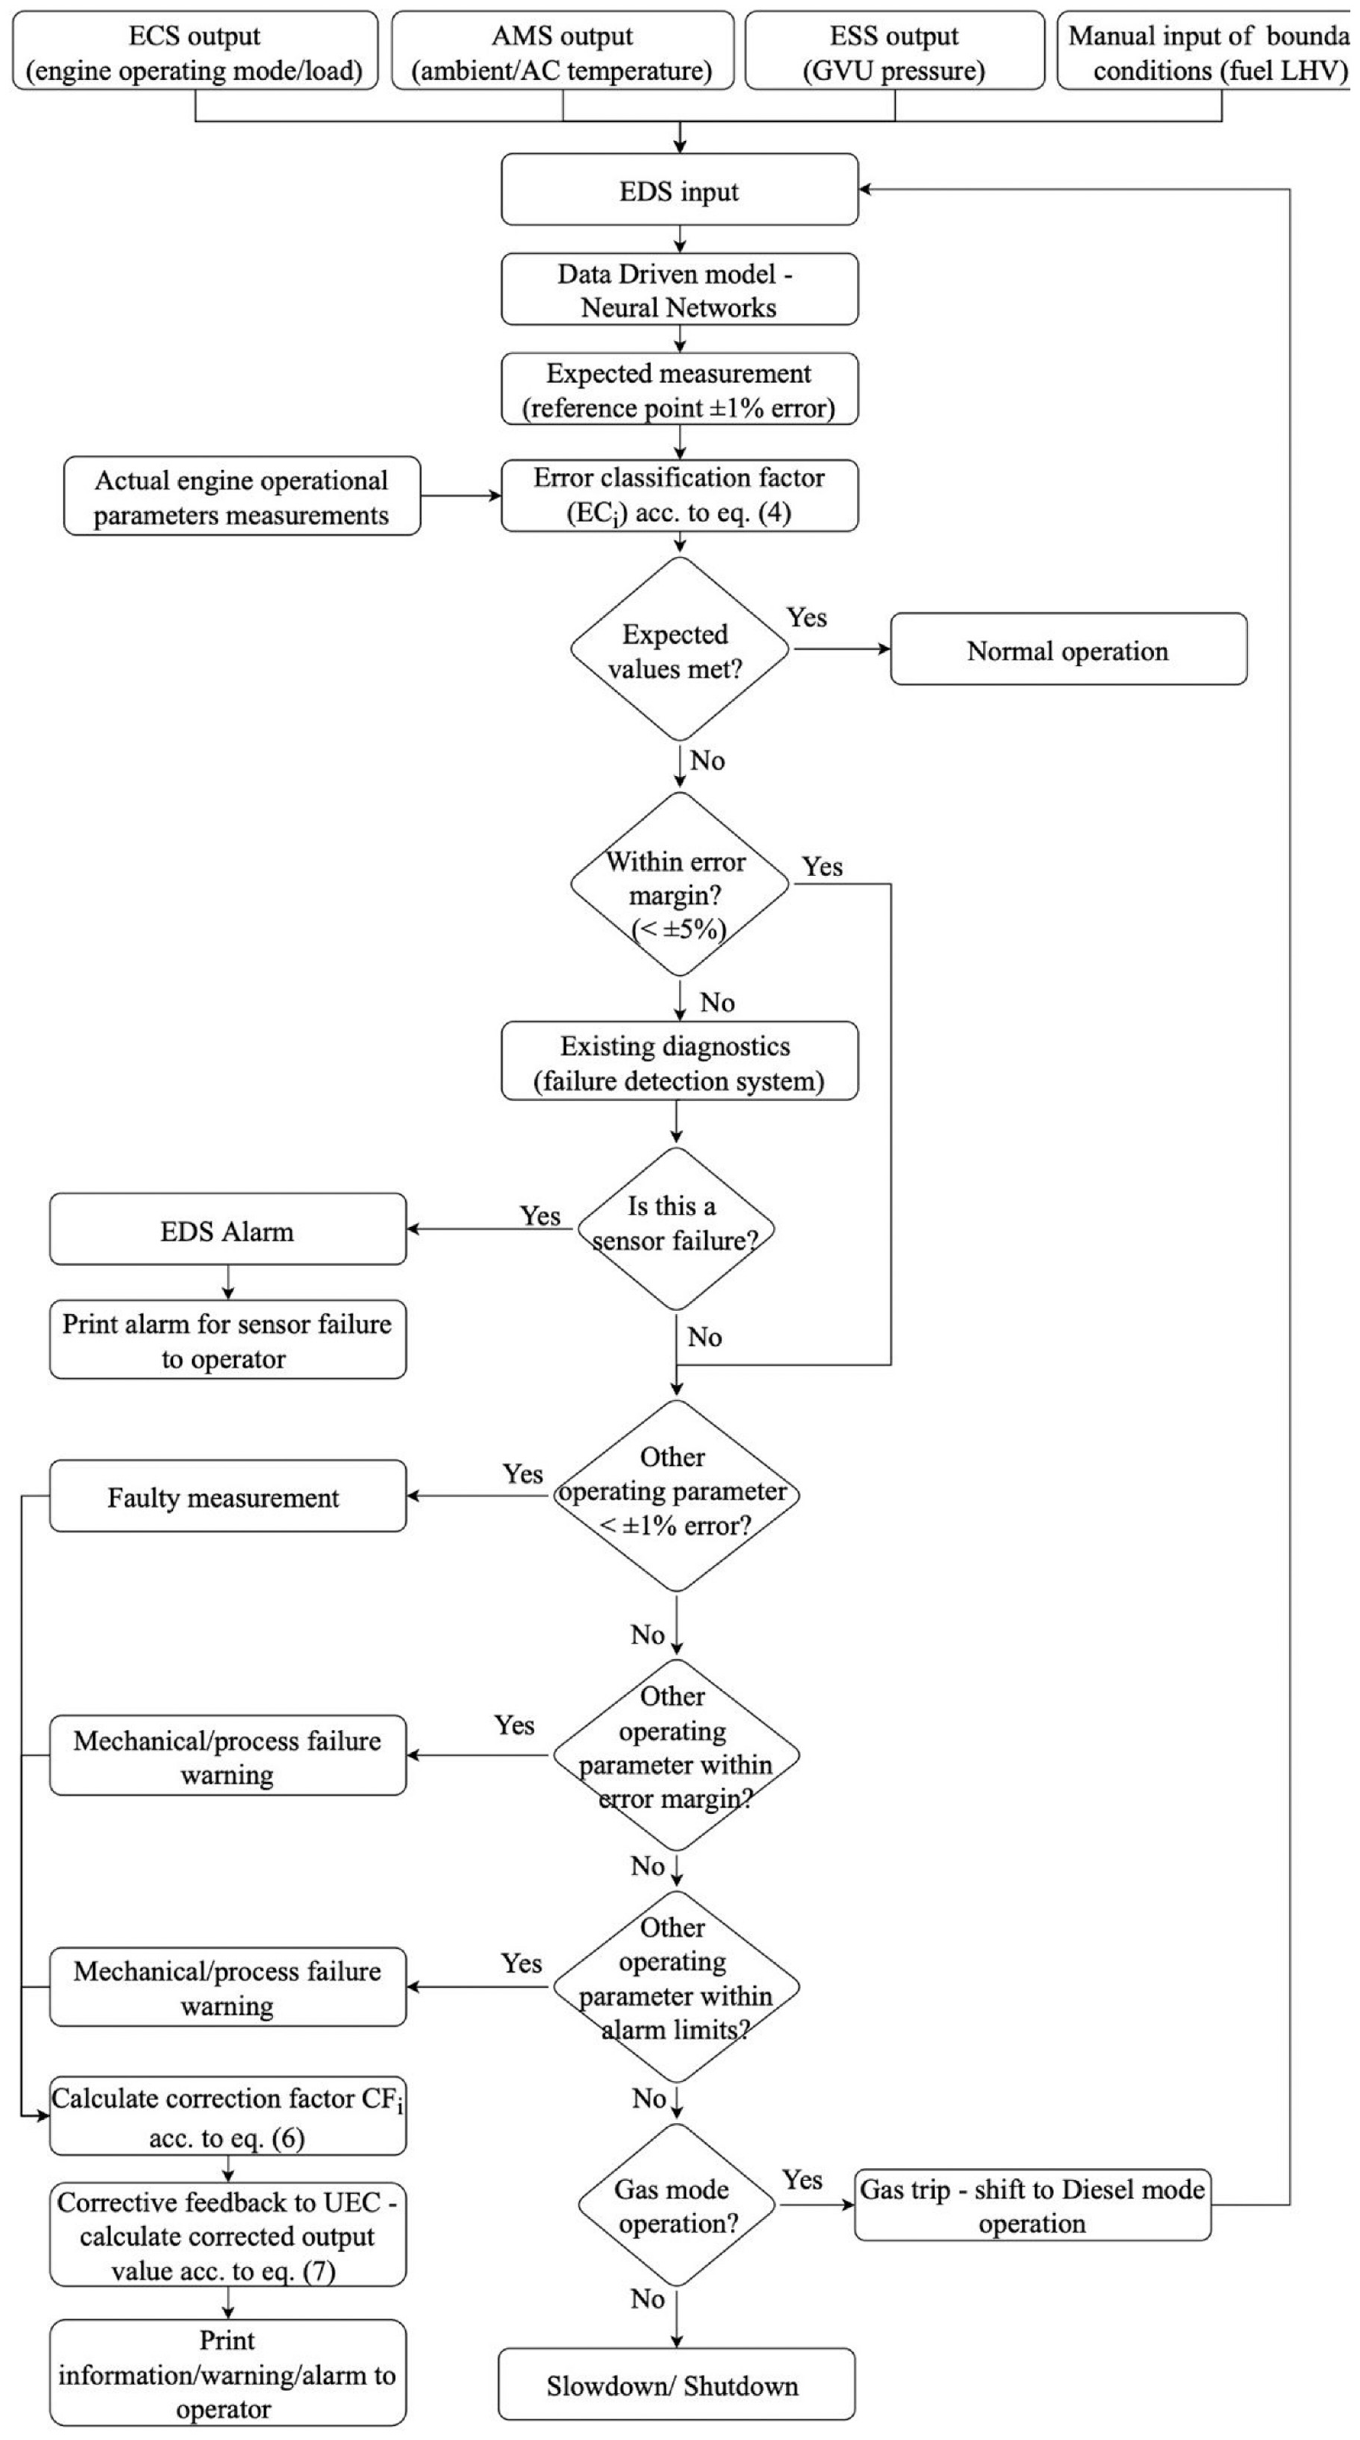
Whilst the failure detection strategy currently adopted by the engine manufacturers (that follows the flowchart shown in Figure 5) can adequately diagnose sensors and actuators failure, the engine performance evaluation is based on testing measurements data 37 assuming that the sensors operate in ‘healthy’ conditions. In this respect, the sensors (measurements) abnormalities are disregarded. The proposed advanced faults and failure detection system is developed by employing the strategy followed by the engine manufacturers, and further enhancing it to accommodate the sensors (measurements) abnormalities identification.
Existing engine diagnostics (failure detection system).
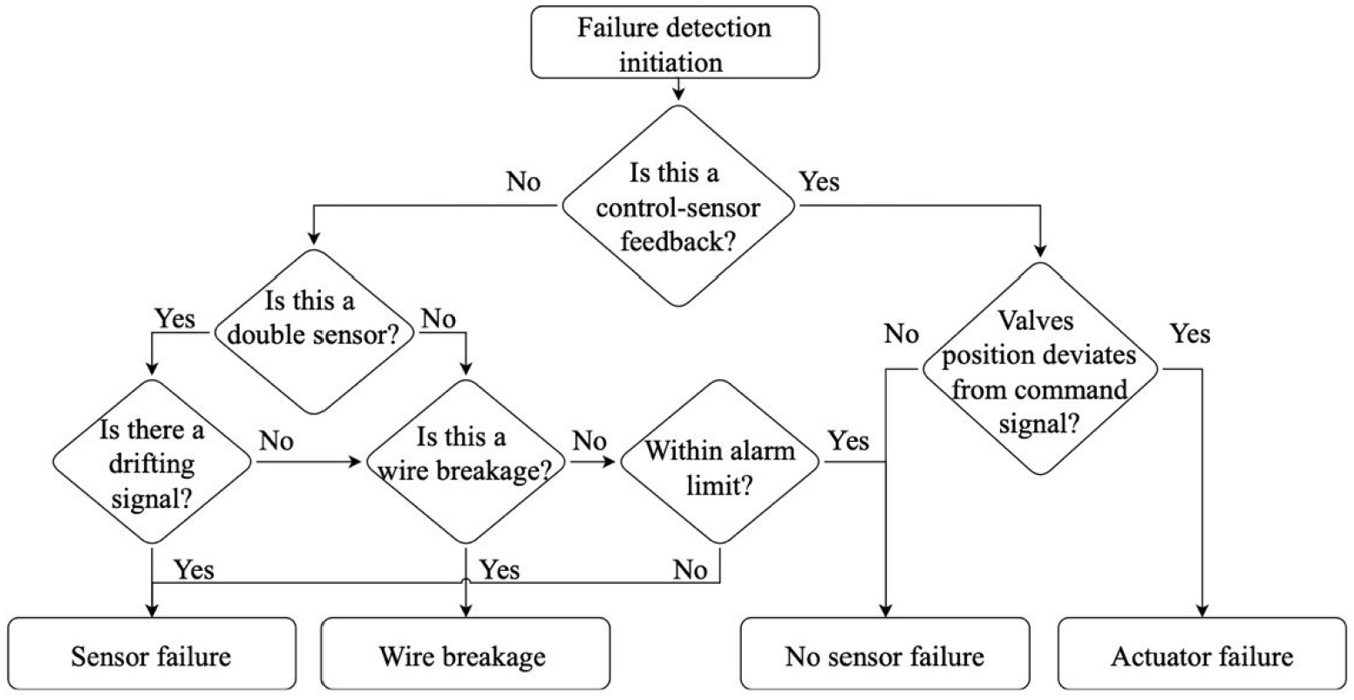
In principle, the EDS is primarily able to separate a sensor failure from a sensor fault or abnormal operation. By employing the EDS functional events sequence, the flowchart of which is presented in Figure 6, the EDS can identify the engine operating parameters deviating from their reference values, for the given boundary conditions (load, ambient temperature, A/C temperature, GVU gas pressure, and diesel/gas LHV). Moreover, the errors associated with these monitored parameters are provided by the intelligent engine monitoring system.
EDS events sequence flowchart.
Therefore, by considering both: (a) the number of EDS monitored parameters deviating from their ‘reference’ value; and (b) the sensor measurement error of each operational parameter, the EDS can separate a faulty or uncalibrated sensor from an actual engine mechanical failure. For example, the case where an EDS monitored operational parameter deviates from its ‘reference’ (healthy) value whilst the other parameters remain within ±1% error indicates that the respective provided sensor measurement is faulty or uncalibrated. Likewise, the case where all the monitored parameters demonstrate deviations of ±5% and above indicates with high likelihood an engine mechanical failure.
However, there a number of cases where most of the engine operational parameters can be affected by a single faulty sensor measurement. These are mainly cases linked to sensors that have a major impact on the ECS control logic, such as the speed and the boost pressure sensors. For this reason, the EDS developed herein considers the so-called ‘expert knowledge’, which correlates a number of key monitored operational parameters deviation with specific sensors abnormalities or faults. This ‘expert knowledge’ is usually gained based on observations over multiple engine running hours that is reflected by the manufacturers on the mapping tables interconnecting a number of observed issues with potential root causes.
In such cases, where the diagnosis outcome is not definite (a sensor measurement affects most of the engine operational parameters monitored), the EDS (via the intelligent engine monitoring system) monitors all the key operating parameters and calculates the deviation between the ‘expected’ and the ‘actual’ value for each monitored parameter. Subsequently, the EDS employs the ‘expert knowledge’ to identify the most probable sensor responsible for these deviations, or in other words, which sensor abnormalities could directly affect the key engine operating parameters. In this respect, the UDS correlates an observed deviation of a specific operating parameter to a sensor based on the ‘expert knowledge’. Hence, the EDS utilises the calculated deviation value for those key engine operating parameters and accordingly applies a correction factor to the sensor signal/measurement.
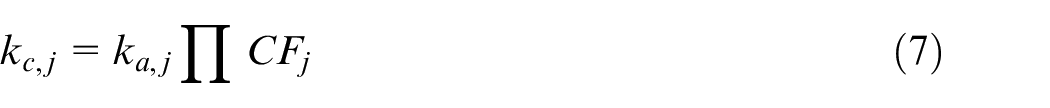
For each sensor and for each key affected parameter the relative difference RD is calculated by using the following equation:
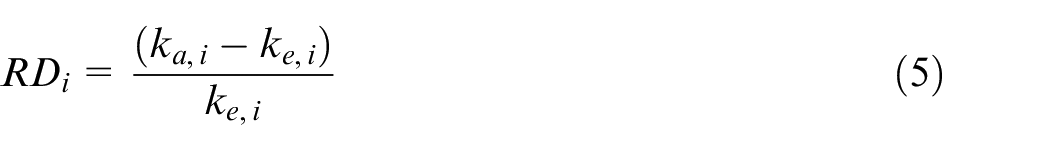
The correction factor CF for each sensor is calculated by using the relative differences for the sensors and monitored parameters, which are applied sequentially to correct the sensors signal value.
The corrected output value kc for each identified faulty sensor is calculated according to the following equation:
At this stage, the EDS re-evaluates all the monitored key operating parameters (i.e. re-calculates the parameters deviation from their ‘reference’ (expected) values) to validate the corrective action (correction factor) to the sensor signal.
Furthermore, for the cases where EDS detects abnormalities or faults in more than one sensor, a similar approach is employed, however, the corrective actions are applied sequentially. In this way, the sensors abnormalities or faults are treated separately, and therefore, the corrective actions impact on the engine response is more efficiently captured. Further discussion on the EDS corrective actions is reported for the investigated case studies. Lastly, the EDS also informs the operator (with a warning message in GT-ISE environment) to appropriately maintain the faulty/uncalibrated sensor.
Results and discussion
Models validation/verification
Engine thermodynamic model
The engine thermodynamic model validation was performed for a number of steady state operating points (25%, 50%, 75% and 100% load) as presented in Stoumpos et al., 27 as well as in transient operation scenarios, as presented in Stoumpos et al. 3 and Theotokatos et al. 39 The generated performance and emissions parameters were compared with the respective data experimentally obtained from the engine shop tests and the available data published in the literature. The maximum percentage error identified after the comparison between the measured and the predicted parameters was found below 3.5% for the steady state simulations (with the highest values corresponding to the exhaust gas temperature). For the transient simulations, the derived errors were found below 2.5% for the majority of the measured parameters apart from the boost pressure, for which deviations between 5% and 10% were obtained. However, as these maximum errors were obtained during the transition period and for only a short time, it can be deduced that the developed model accuracy is sufficient. As all the engine components and processes were accurately modelled, the prediction of the engine performance parameters is deemed satisfactory.
Data-driven model
As described in the previous section, 90% of the generated data from DoE simulation runs is used for the NNs training, whereas 10% of the data is used for validation purposes. The DD model accuracy was verified by comparing its results with the developed digital twin results at steady state conditions for 25%, 50%, 75%, 85% and 100% loads. Indicatively, the comparison of the digital twin parameters (observed data) and the DD model output (predicted values) for the NOx emissions at the diesel and gas operating modes are presented in Figure 7.
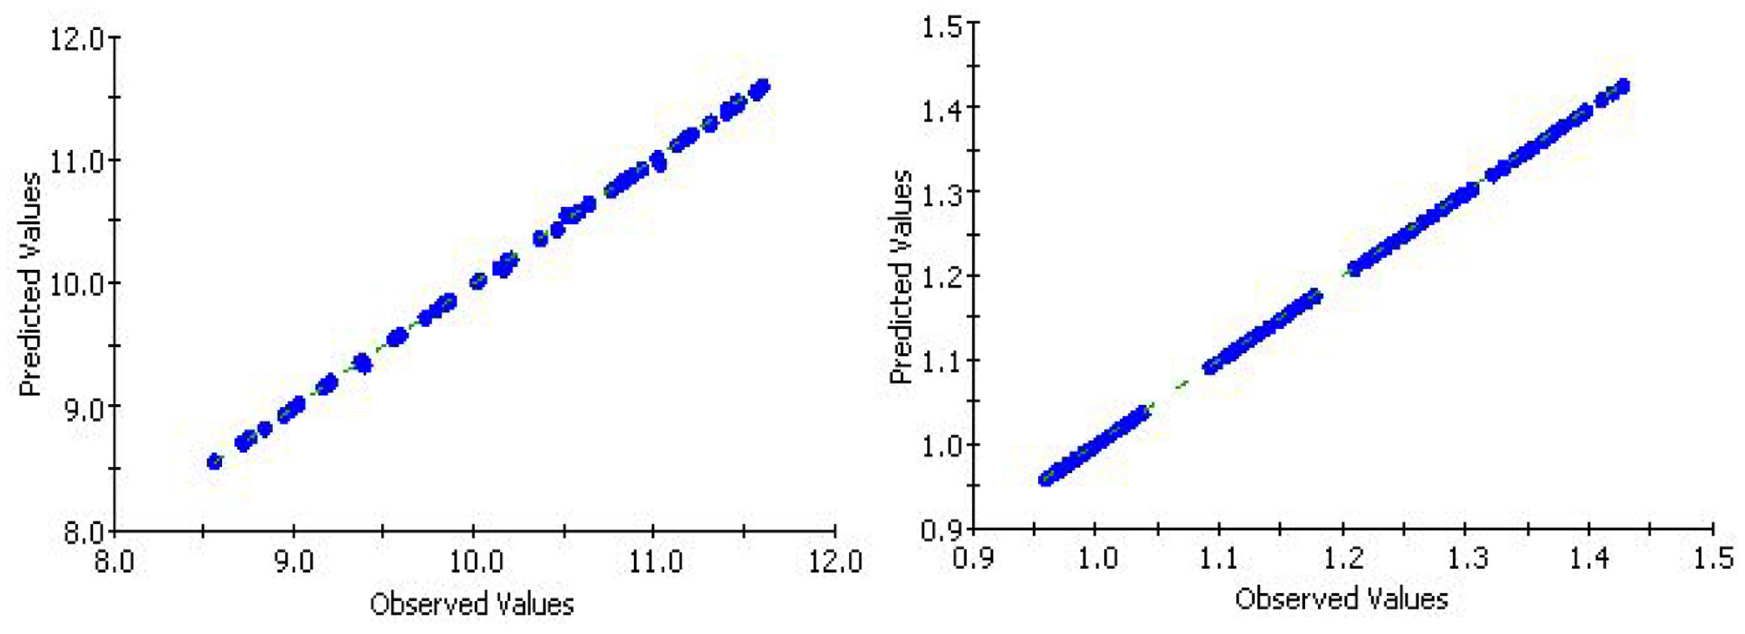
Example of the DD model predictions (predicted values) and the digital twin parameters (observed values) for the NOx emissions in g/kWh for the diesel (left) and gas (right) modes at 100% load.
The percentage errors between the DT and the DD model predicted engine performance and emissions parameters for the engine operation at steady state conditions were found to be below 1.1%, with the calculated average absolute error being lower than 1%. Moreover, additional simulation runs were performed for 80% load in diesel and gas mode, in order to confirm the accuracy of the DD model at the intermediate loads, demonstrating similar deviations. In specific, the percentage error for the DD model predicted engine performance parameters were below 1%, whereas the NOx emissions error was below 2%. Lastly, as it can be inferred from Figure 8, the DD model demonstrates the expected continuity between the discrete load points (design grid) for the intermediate engine loads. Therefore, it can be inferred that the DD model can be used to accurately predict the monitored parameters at steady state conditions, providing the required fidelity to the EDS calculations. It must be mentioned that the operating parameters prediction under engine transient conditions (load or fuel mode change) is not considered, as the DD model is not used under these conditions.
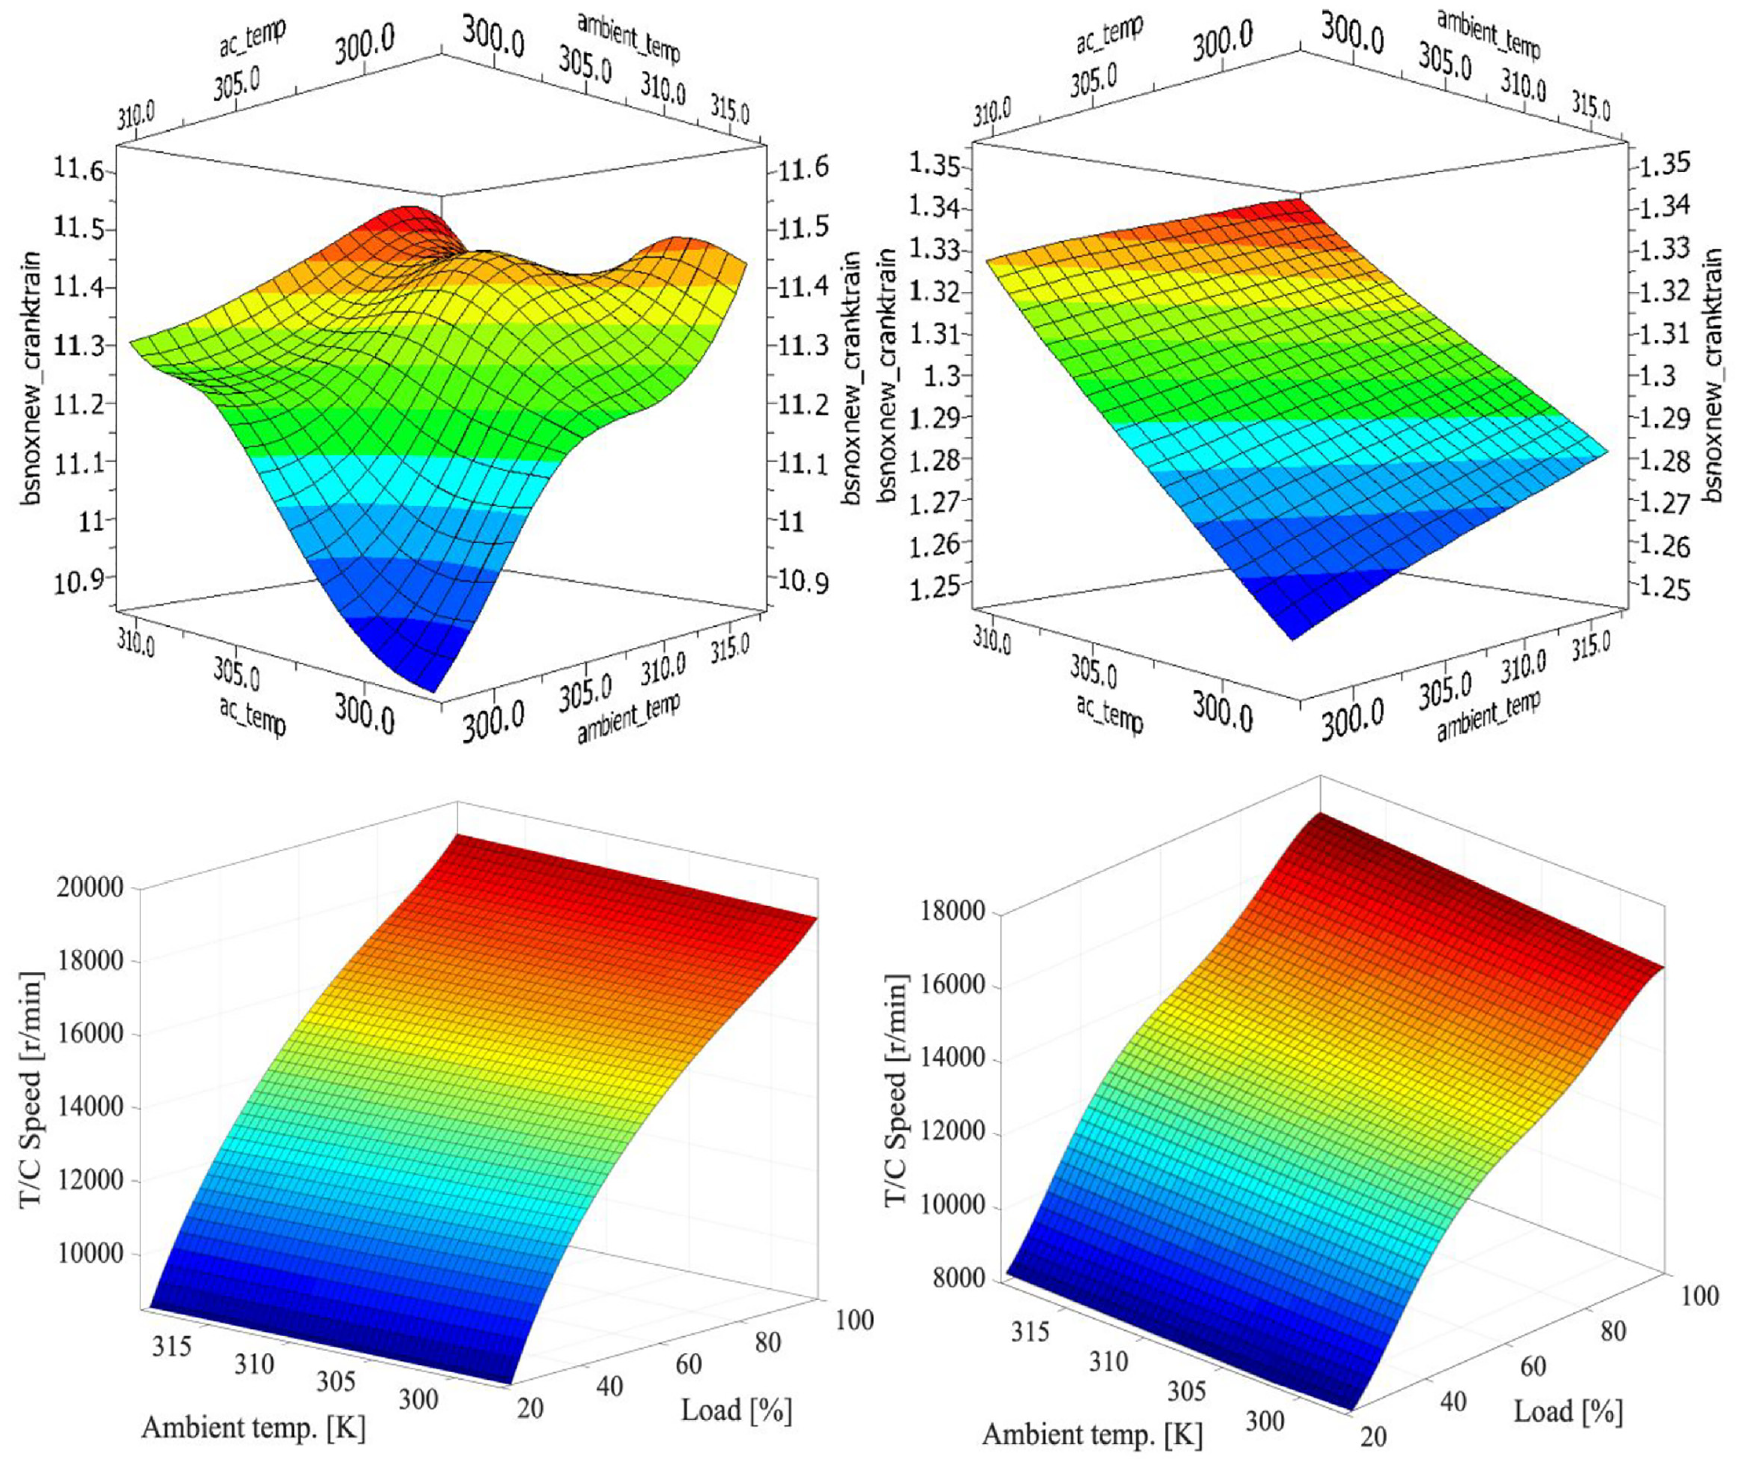
Response surfaces produced by using the DD models for the NOx emissions and T/C speed; diesel mode (left); gas mode (right).
Cases studies description
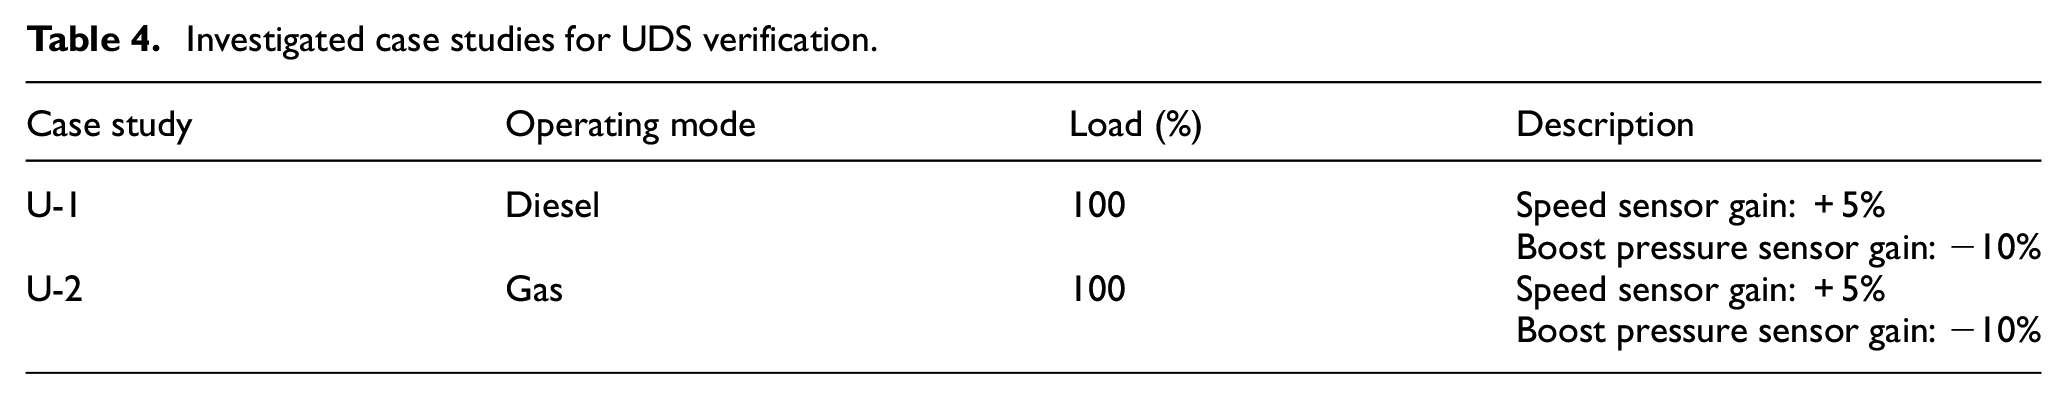
The UDS functionality and novel capabilities are verified via the assessment of the generated results for the investigated case studies U-1 and U-2, presented in Table 4 and illustrated in Figure 9. The UDS implementation in these simulation case studies aims to demonstrate the benefits from the UDS system application as described below. The case studies U-1 and U-2 investigate the engine response considering abnormal measurements from the engine shaft speed and boost pressure sensors in the diesel and gas operating modes, respectively. These case studies (U-1 and U-2) are investigated by performing simulation runs with the integrated DT (initial DT integrated with the developed UDS system model), which constitutes a virtual representation of the actual engine system. The case study U-2 was designed to stress-test the developed UDS, which must respond to the complex interaction between the boost pressure and the EWG valve in the gas mode. However, it must be noted that simultaneous multiple sensors failing is extremely unlikely in actual cases.
Investigated case studies for UDS verification.
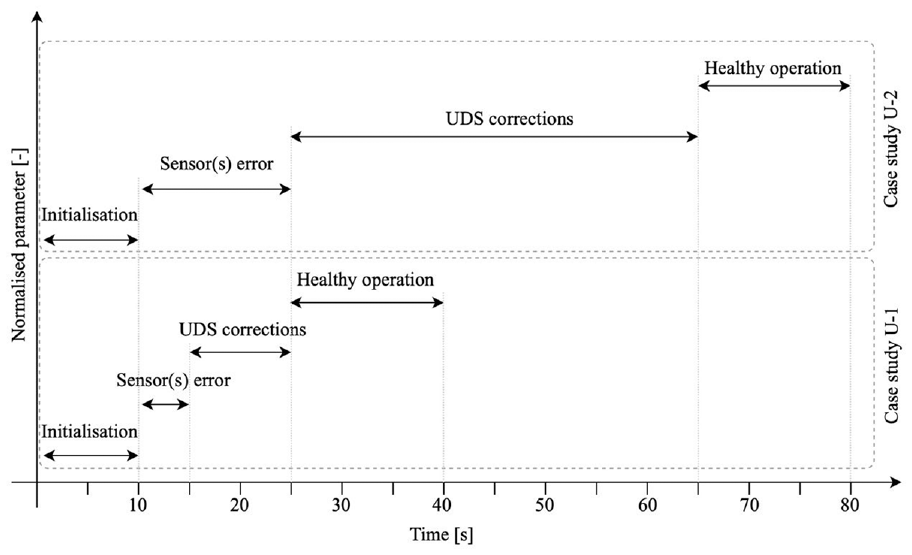
UDS verification cases overview in engine transient conditions operation.
Furthermore, the following assumptions are made for the case studies U-1 and U-2. Firstly, it is assumed that the electric load control system can adjust the number of electric power consumers to match the DF engine generation set electric power output. Nevertheless, considering a ship power plant includes a number of generator sets, in case of power deficit, the load difference is expected to be covered by another gen-set. Secondly, it is assumed that the engine brake power is calculated by using the measured electrical power and the electric generator efficiency.
The U-1 and U-2 simulation case studies overview is presented in Figure 9. For both case studies, an initialisation phase is established, where the engine operates faults-free, followed by the introduction the faulty sensors status by FOS, that provide faulty measurements (engine speed and boost pressure) in the ECS (as part of the UDS) at the 10th s. At this stage, the faulty sensors impact to the actual engine operational parameters is evaluated via the EDS intelligent engine monitoring system and the UDS initiates the engine diagnostics in the EDS advanced faults/failure detection system. Upon the engine operation with faulty sensors reaching steady state conditions, the UDS proceeds with a set of consecutive corrective actions (described below) and informs the operator with a warning information message. Once the corrective response phase is completed, the UDS monitors the engine response to identify any engine operational parameters deviations against the ‘healthy’ data. When all the EDS monitored operating parameters exhibit deviations (from their respective reference values predicted by the data-driven NN model) less than 1% (or greater than −1%), the UDS ultimately confirms the sensors faults and generates an information message to the operator. In this respect, the engine ‘healthy’ performance is ensured, and any safety implications are mitigated.
It must be mentioned that the term ‘actual’ used in the case studies results below denotes the actual engine operational parameters values (as these are calculated by the EDS), considering the faulty sensors operation (sensor measurements abnormalities). On the other hand, the ‘predicted’ term signifies the predicted engine operational parameters values (as these are generated by the DT) not considering the sensors measurements abnormalities. The need to differentiate the two sensor signals with these conditions is based on the sensors feedback of the engine control system. In a theoretical scenario where at a given time the engine speed sensor provides an abnormal speed measurement, the ECS, and specifically the ECS PID fuel controllers, will adjust their output (i.e. the diesel rack position or the gas injection duration depending on the operating mode) based on the speed measurement input in order to achieve the targeted (nominal) speed. In this scenario, the speed sensor will feed the ECS with a ‘corrected’ speed measurement, which is actually faulty as this does not include the abnormalities (drift/offset/gain) of that signal/measurement. Therefore, there are two speed measurements in this case; the first being the one that the sensor detects and feeds to the ECS and the second being the actual engine speed. The former is the faulty sensor measurement characterised as ‘predicted’, whereas the latter is the ‘actual’ measurement that the sensor should have read.
Case studies results
The results for the case studies U-1 and U-2 are presented in Figures 10 and 11, respectively. Both case studies focus on the representation and investigation of the engine operation in the diesel/gas mode assuming that after the 10th s, the faulty speed sensor measurement is increased by 5%, whereas the faulty boost pressure sensor provides measurements decreased by 10% (both from their respective values at healthy conditions). The top graphs in Figures 10 and 11 illustrate the faulty (predicted) engine speed and boost pressure signals from the sensors fed back to the ECS versus the actual values of these parameters over time, whereas the two bottom graphs present the actual engine brake power, T/C speed, EWG opening and air–fuel equivalence ratio. It must be mentioned that when both the speed and boost pressure sensors are faulty and the UDS system is not employed, the engine response is according to the variations presented in Figures 10 and 11 between the 10th and 15th s in the diesel mode and 10th and 25th in the gas mode, respectively.
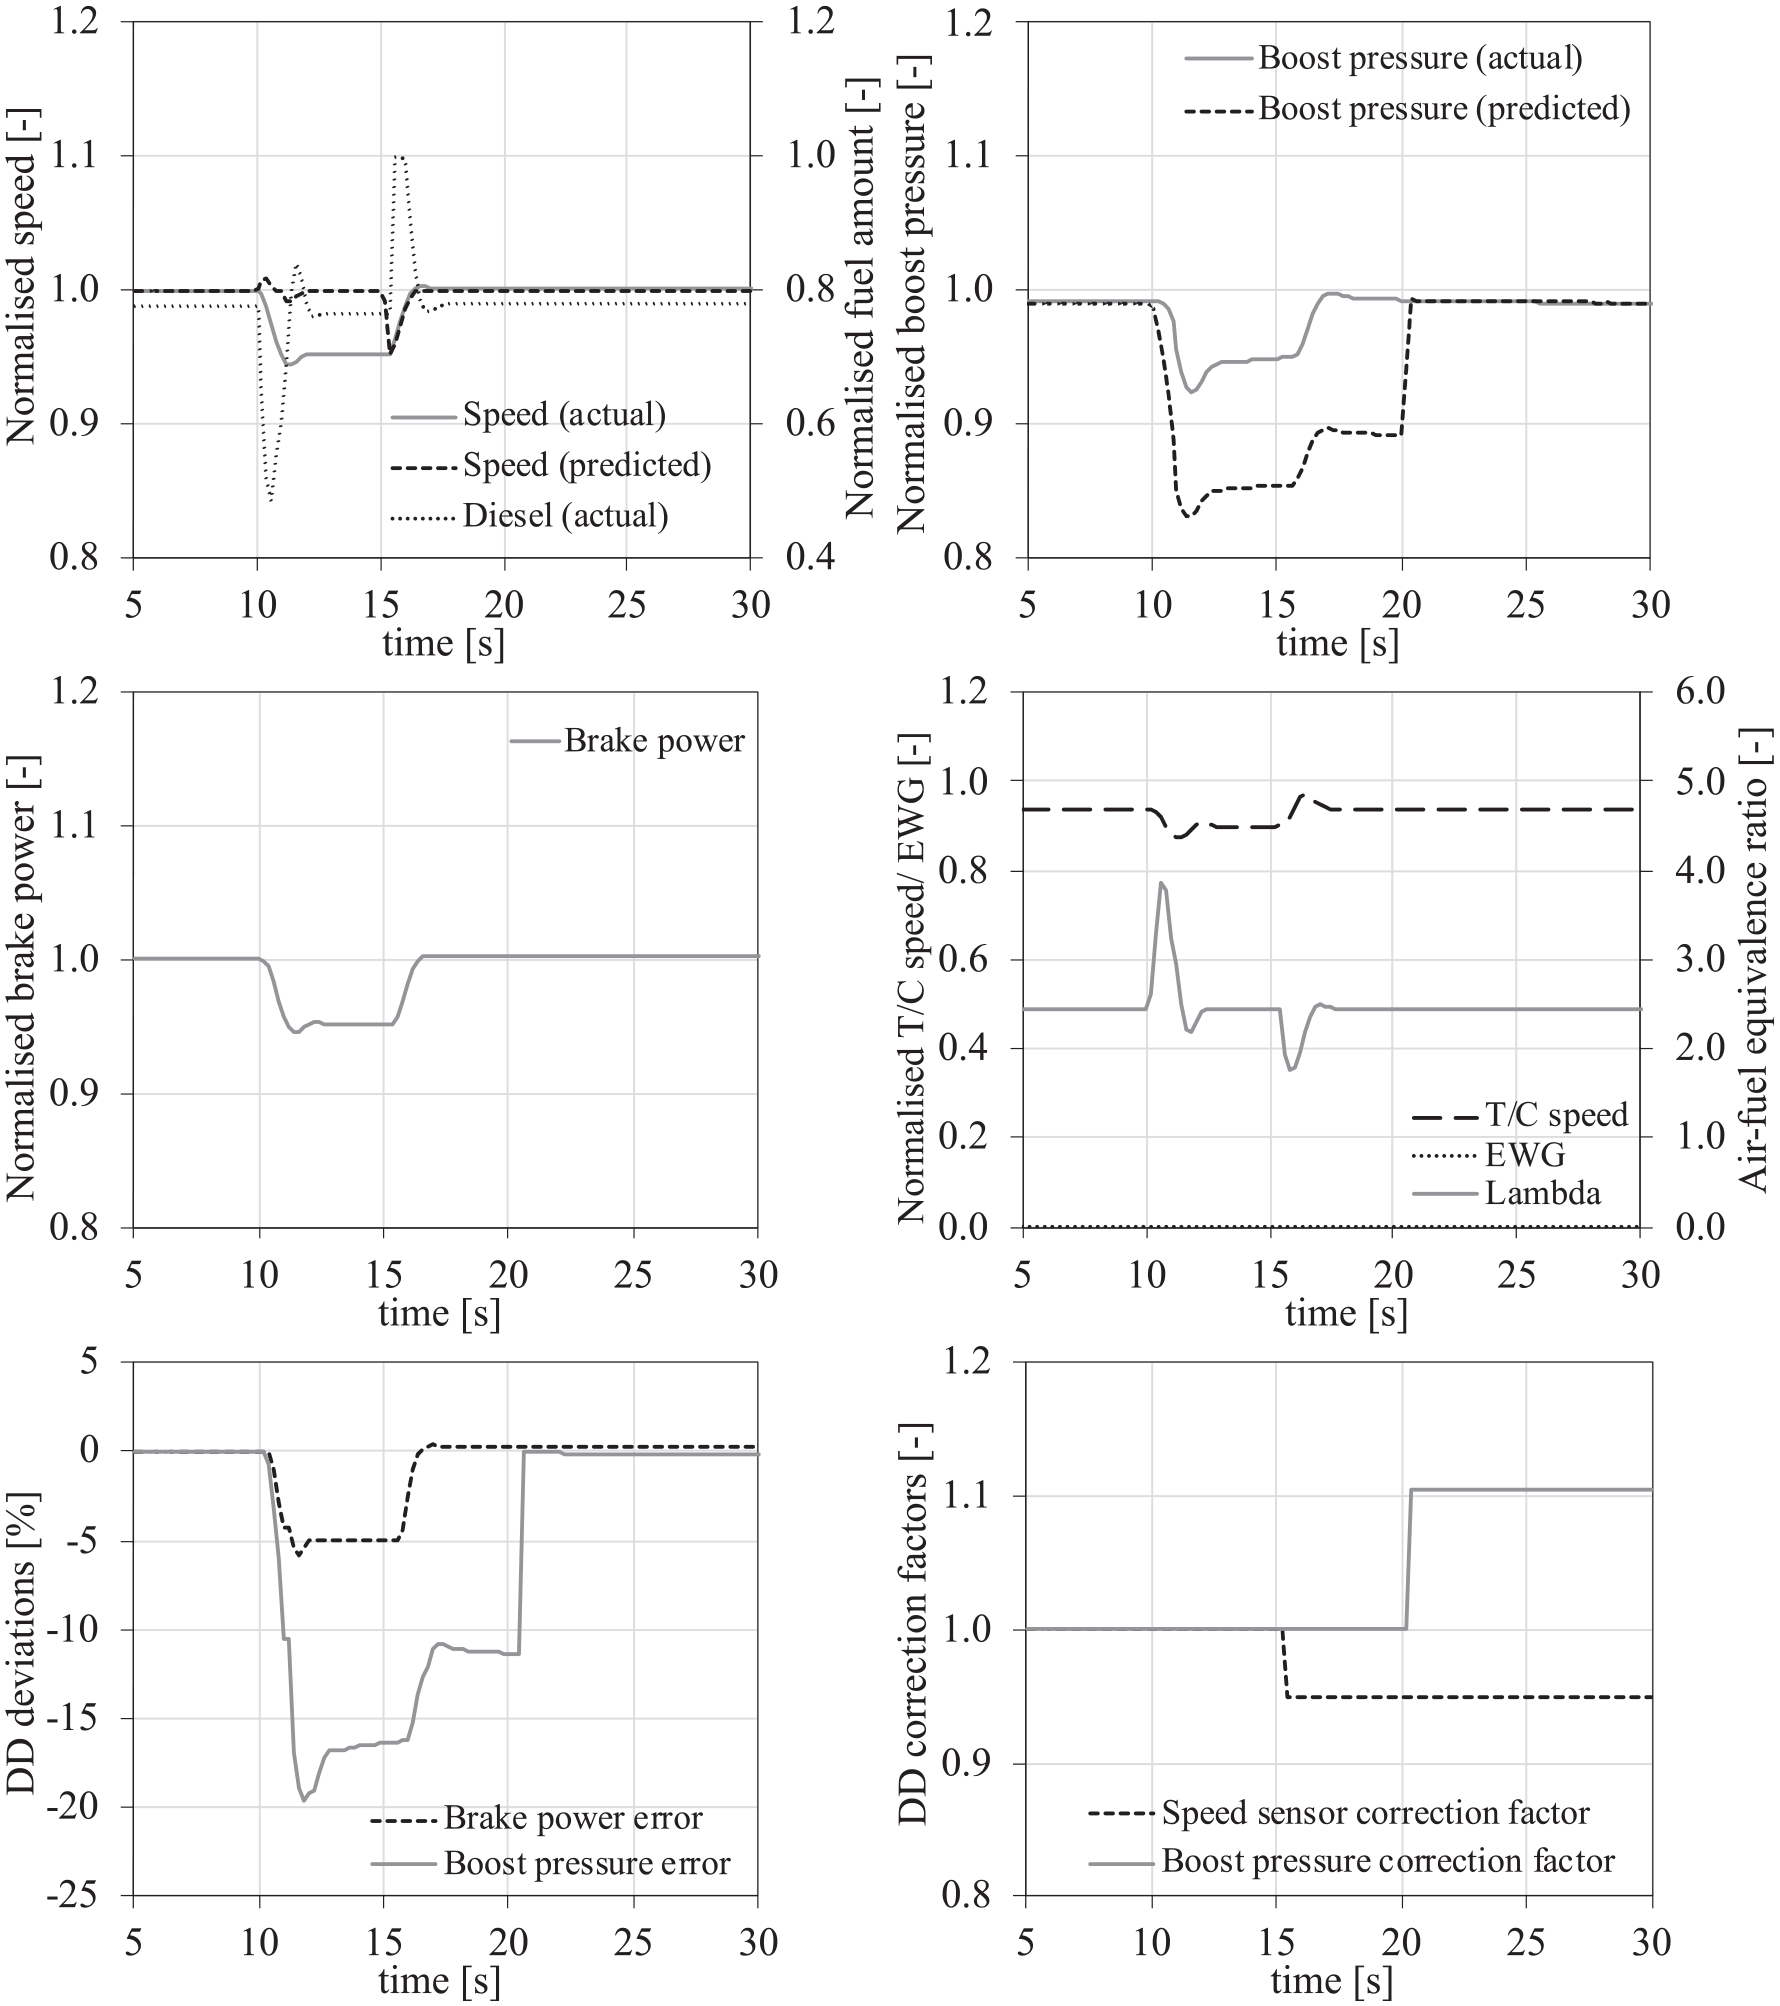
Case study U-1 results; actual and predicted engine response parameters in the diesel mode with faulty speed and boost pressure measurements.
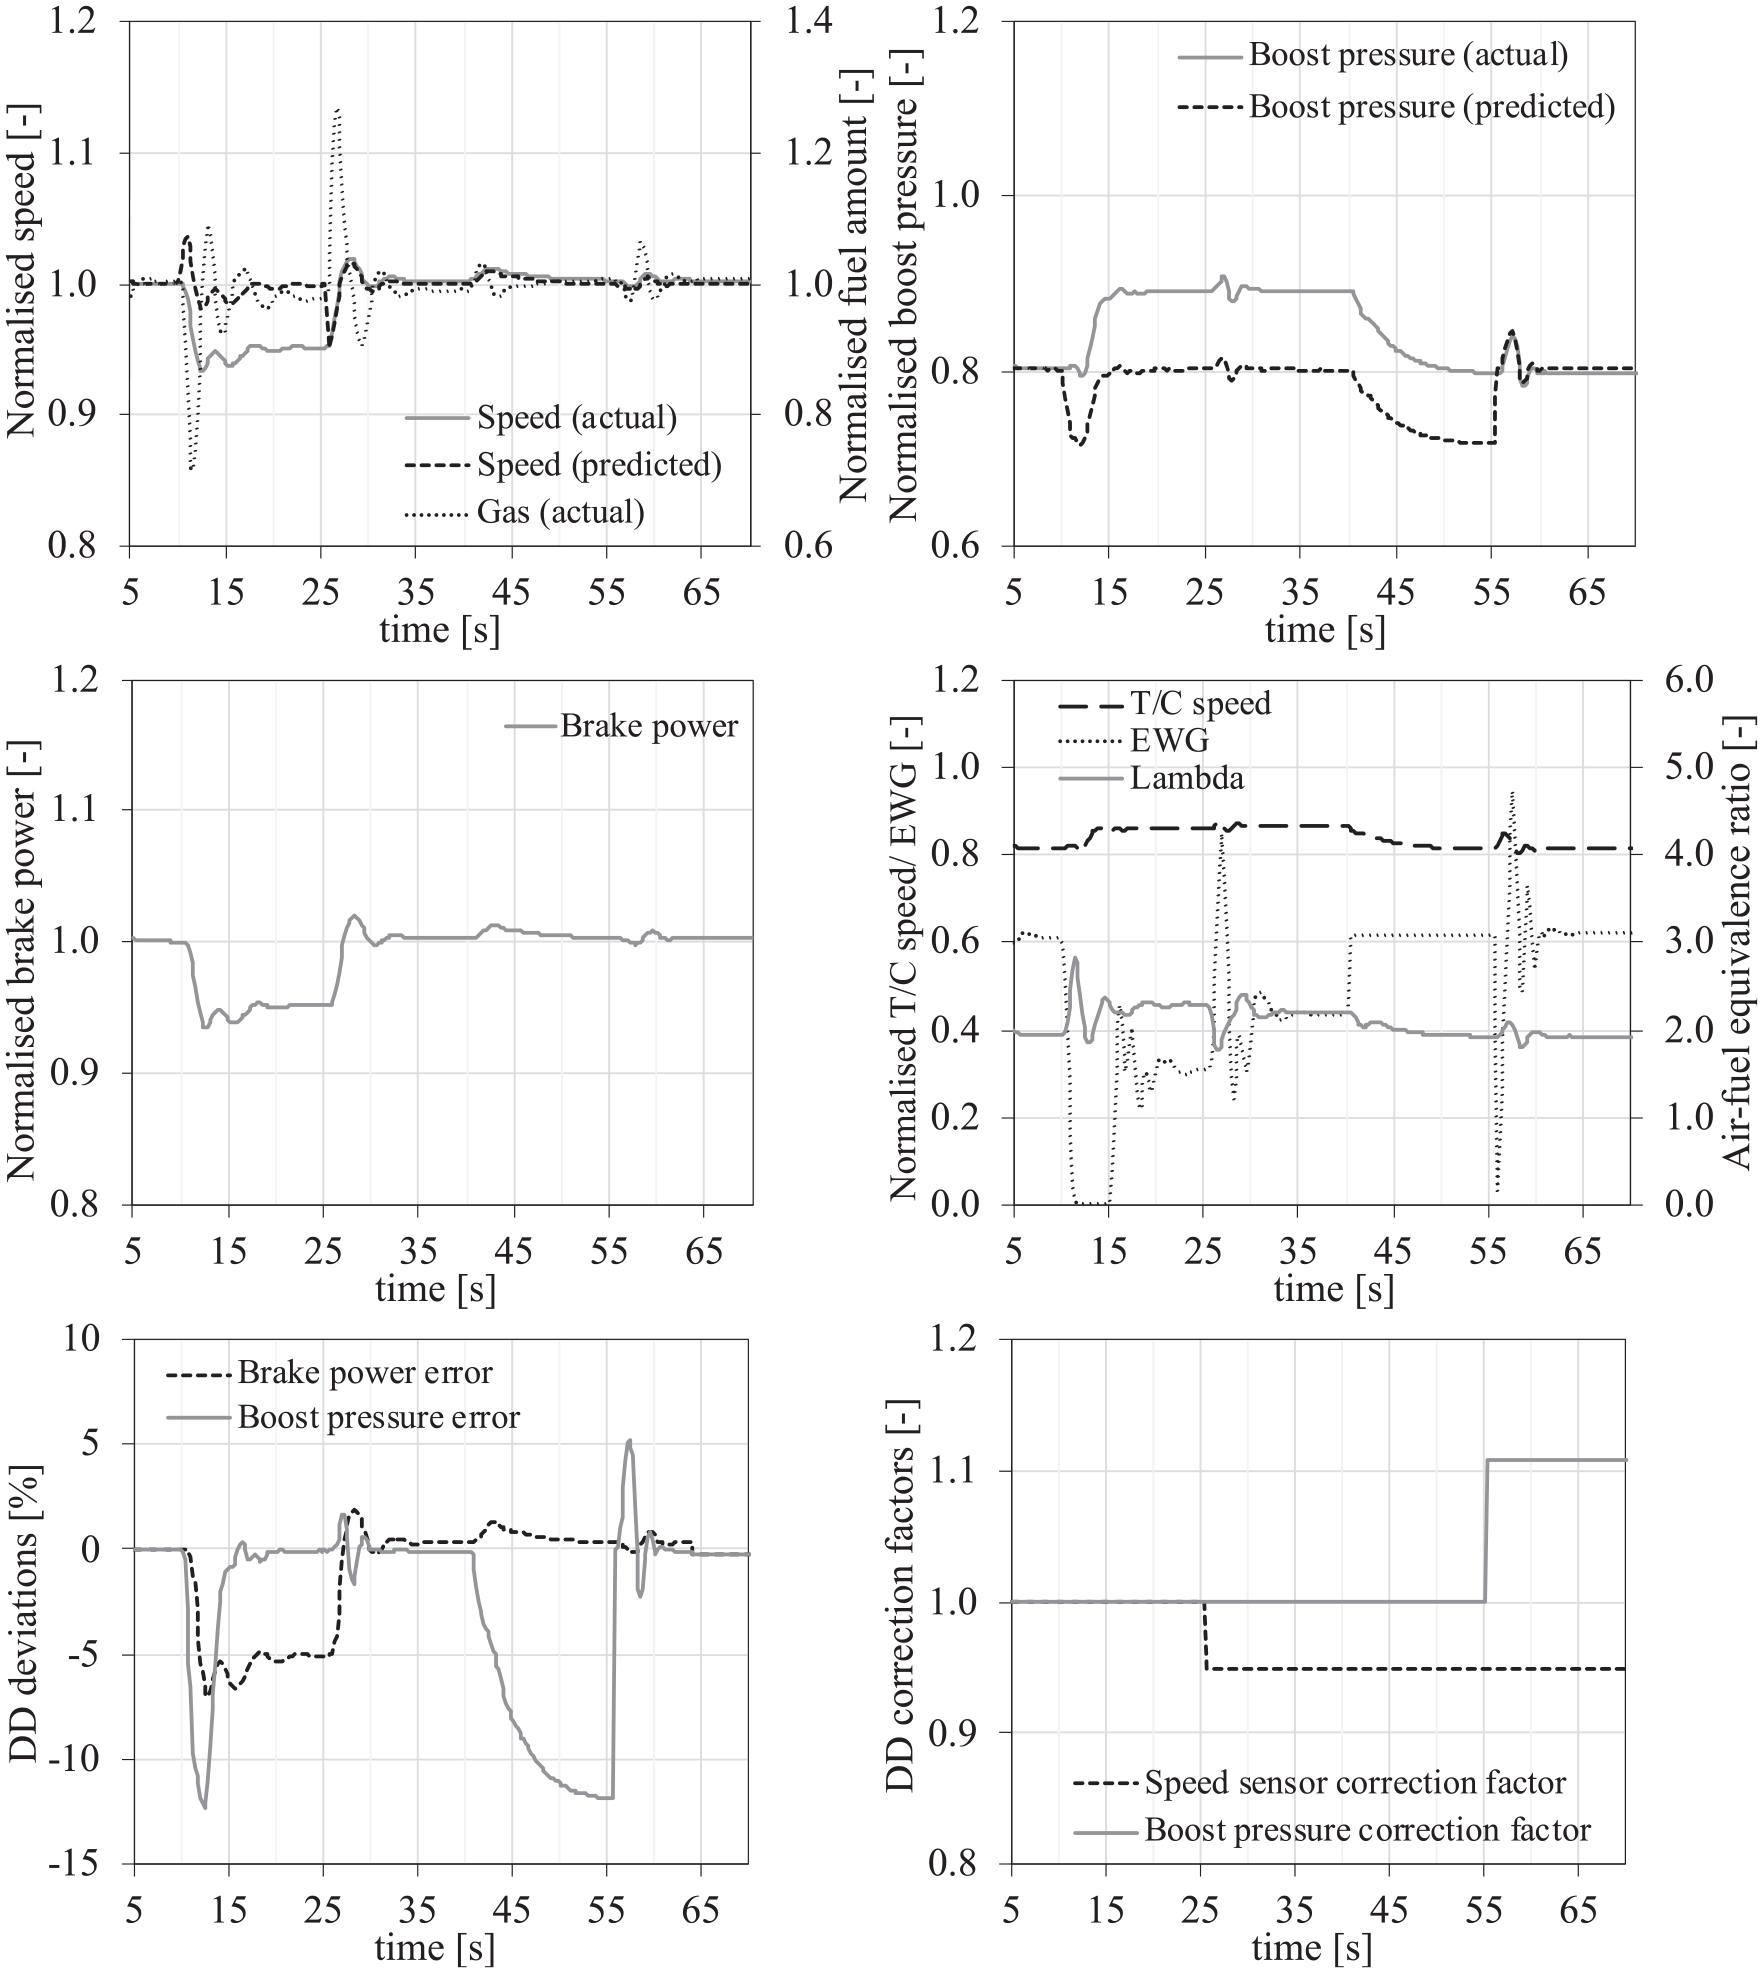
Case study U-2 results; actual and predicted engine response parameters in the gas mode with faulty speed and boost pressure measurements.
In specific for case study U-1, the faulty speed sensor signal fed in the ECS (as part of the UDS) (providing input to the diesel PID controller) after the 10th s results in a decrease of the diesel fuel injected amount into the engine cylinders. This, in turn, has a direct impact on the delivered engine brake power as the engine actually operates in a reduced speed (5%) for the period between the 10th and the 15th s (before the UDS apply corrective actions). The fuel control is based on the faulty speed sensor input. In the diesel mode operation, the boost pressure sensor is only used for monitoring purposes; although the boost pressure sensor is interconnected with the EWG controller, it is only in gas mode operation that can affect the engine response, as discussed for case study U-2 results later in this section. Nevertheless, the reduced diesel fuel injected amount (as an effect of the faulty speed sensor measurement) also has a negative impact to the boost pressure (resulting in a 17% maximum drop from its initial value) exhibiting a 13% error from the actual boost pressure value obtained at the 11th s, which is attributed to the T/C speed reduction. With regard to the air–fuel equivalence ratio, the instantaneous diesel fuel injected amount drop in combination with the T/C lag and the delayed boost pressure decrease, lead to lambda fluctuations between the 10th and 11th s ranging from 2.2 to 3.9. However, the fluctuations noted in the diesel fuel amount and the air–fuel equivalence ratio in the region of 10th to 12th s, occur due to the introduction of sensors faults during the simulation. It must be noted that these fluctuations may cause potential safety implications, including the T/C compressor surge effect as well as misfiring issues due to high air–fuel equivalence ratio.
Focusing on the UDS response in the case study U-1, it is divided into two sequential actions, which include the signals correction factors calculation and implementation; first for the speed sensor implemented at the 15th s; and second for the boost pressure sensor implemented at the 20th s. Considering that any deviations in the speed sensor measurements are reflected in the delivered engine brake power (due to ECS response adjusting the injected fuel amount), the latter parameter was used to quantify the speed sensor measurement error. This was achieved by comparing the actual brake power against its reference (expected) value derived from the DD model employed in the EDS system. As shown in Figure 10, the UDS successfully identified the speed sensor error and implemented the calculated correction factor to the speed signal fed to the ECS (diesel PID controller), thus recovering the actual engine speed to the nominal levels. This can also be confirmed by the recovery of the engine brake power observed between 15th and 17th s.
Likewise, for the boost pressure sensor correction, the boost pressure demonstrates a 3% rise between 15th and 17th s, aligning with the observed T/C speed increase. The air–fuel equivalence ratio drop noted at the 16th s is attributed to the fast diesel rack response and the T/C lag. Although a quick corrective action was implemented, the diesel engine governor limiter would not engage as the engine operates at a high load. In cases of engine operation at low loads it is expected that the governor limiter will engage constraining fast increases of the rack position (and associated diesel fuel amount). Following the first UDS corrective response, the UDS was also capable of evaluating the remaining EDS monitored signals and identify only a boost pressure sensor signal error (10%) in the period between 17th to 20th s. Therefore, a second corrective action on the boost pressure sensor signal was imposed by the UDS at the 20th s, leading to the actual measurement prediction with adequate accuracy.
Moving to the investigated case study U-2, the faulty speed sensor measurement fed in the ECS (gas fuel PID controller) results in a response of the gas admission valve (GAV) to reduce the gas fuel injection duration, and thus, the injected gas fuel amount at each cylinder inlet port. This, in turn, has a negative impact on the delivered engine brake power from the 10th to the 25th s, exhibiting its maximum reduction by 4.8% from its initial value at 25th s when the UDS orders a corrective action, as shown in Figure 11. It can be observed that the engine operates in a lower speed compared with its nominal value in the period between the 10th and 25th s, due to the imposed speed sensor fault. With regard to the boost pressure, the observed engine response differentiates from the response of the case study U-1, as the EWG in gas mode is open and is adjusted by the ECS respective PID controller. In this sense, the process under investigation becomes more complex. In specific, the boost pressure sensor output is fed in the EWG controller in order to adjust the EWG valve opening. The latter has an immediate effect on the exhaust gas amount entering the T/C turbine, and hence the T/C speed. Therefore, the EWG controller reacts on the faulty boost pressure drop at the 10th s and orders a decrease of the EWG valve opening. This eventually leads to the EWG valve closure at the 11th s, to achieve the targeted boost pressure (the targeted boost pressure values for the engine discrete load are stored in the EWG PID controller in a form of a lookup table; for intermediate loads linear interpolation is performed). However, as the boost pressure recovers at the 15th s, the EWG controller readjusts the EWG opening, obtaining convergence to a steady opening value at around the 22nd s (which is 49% lower than its reference value). It must be noted that in the period between the 15th and 25th s the actual boost pressure exhibits a 10.9% increase from its reference (predicted by DD model) value. The effects of the EWG controller and the EWG valve opening are also noted in the T/C speed variation; a 5.4% increase from the reference T/C speed value is observed for the period 15th s to 25th s. In addition, the air–fuel equivalence ratio increases from 2 to 2.3 at 20th s, which is attributed to the lower gas fuel amount and (actual) boost pressure increase, the latter resulting in the charge air flow increase. This lambda range is associated with potential misfiring issues.
The first UDS correction action on the speed sensor measurement is implemented in the period between the 25th and 40th s (as discussed below), resulting in the accurate prediction (from the UDS) of the actual engine speed, which in turn leads to the engine brake power recovery to the reference value. Minor fluctuations are observed in both the engine speed power, which are attributed to the actions of the ECS system PID controllers. The boost pressure and the T/C speed are slightly affected by the gas fuel amount change due to the speed sensor correction, whereas the EWG valve opening demonstrates a 28% deviation (decrease) from its reference value. The air–fuel equivalence ratio is reduced to 2.2.
Furthermore, the second UDS correction action (described below) is related to the EWG valve opening and is introduced in the time period from the 40th to 55th s. As it is observed, the EWG valve opening by the UDS has a direct effect on the boost pressure, the T/C speed and the air–fuel equivalence ratio. At the end of this period, the reference values of these parameters are obtained.
Lastly, the third UDS correction action is implemented on the boost pressure sensor measurements in the period from the 55th to 70th s, resulting in the recovery of the engine response to its ‘expected/healthy’ conditions. The oscillations observed in the EWG valve during this time period are justified below. It must be noted that similarly to case study U-1, the fluctuations noted in the gas fuel amount and air–fuel equivalence ratio in the region of 10th to 25th s, occur due to the introduction of sensors faults during the simulation, which may correspond on pertinent safety implications.
With regard to the UDS corrective response in the case study U-2, it is divided into three sequential actions; (a) speed sensor signal correction factor implementation; (b) EWG imposed valve opening; and (c) boost pressure sensor correction factor implementation. The first action takes place at the 25th s, the second at the 40th s and the third at the 55th s. Similarly to the case study U-1, considering that any deviations in the speed sensor are reflected in the delivered engine brake power (due to the injected fuel amount variations); the brake power deviation was used to quantify the speed sensor measurement error. This was achieved by comparing the actual brake power against its reference (expected) value estimated by employing the DD model of the EDS system.
As shown in Figure 11, the UDS was capable of successfully identifying the speed sensor error (via the brake power calculated deviation from its reference value) and implementing the calculated correction factor to the speed signal fed to the ECS (gas fuel PID controller), hence recovering the actual engine speed to its ‘healthy’ conditions. This can also be confirmed by the engine brake power recovery observed between 25th and 35th s. The second UDS corrective action is related to the EWG valve operation and it is implemented based on the following approach. In order to accurately define the boost pressure sensor error, the EWG valve is driven to its reference value opening identified from the DD model of the EDS for the specific load, operating mode and boundary conditions. The imposed EWG valve opening is expected to result to a (faulty) boost pressure measurement drop, as illustrated in Figure 11, revealing the boost pressure sensor measurement error (calculated in the UDS based on its expected ‘reference’ value estimated from the DD model). At the same time, the UDS evaluates the remaining EDS monitored operating parameters of the engine, and once deviations below 1% in all parameters are obtained, the UDS triggers the third corrective action. The latter includes the implementation of the calculated correction factor to the boost sensor measurement fed in the ECS as well as the activation of the EWG valve controller adjusting the EWG valve opening based on the corrected boost pressure signal. During the reactivation of the EWG controller, oscillations in the EWG valve opening are observed with minor impact on the boost pressure, however the controller is able to reach steady state conditions after 5 s.
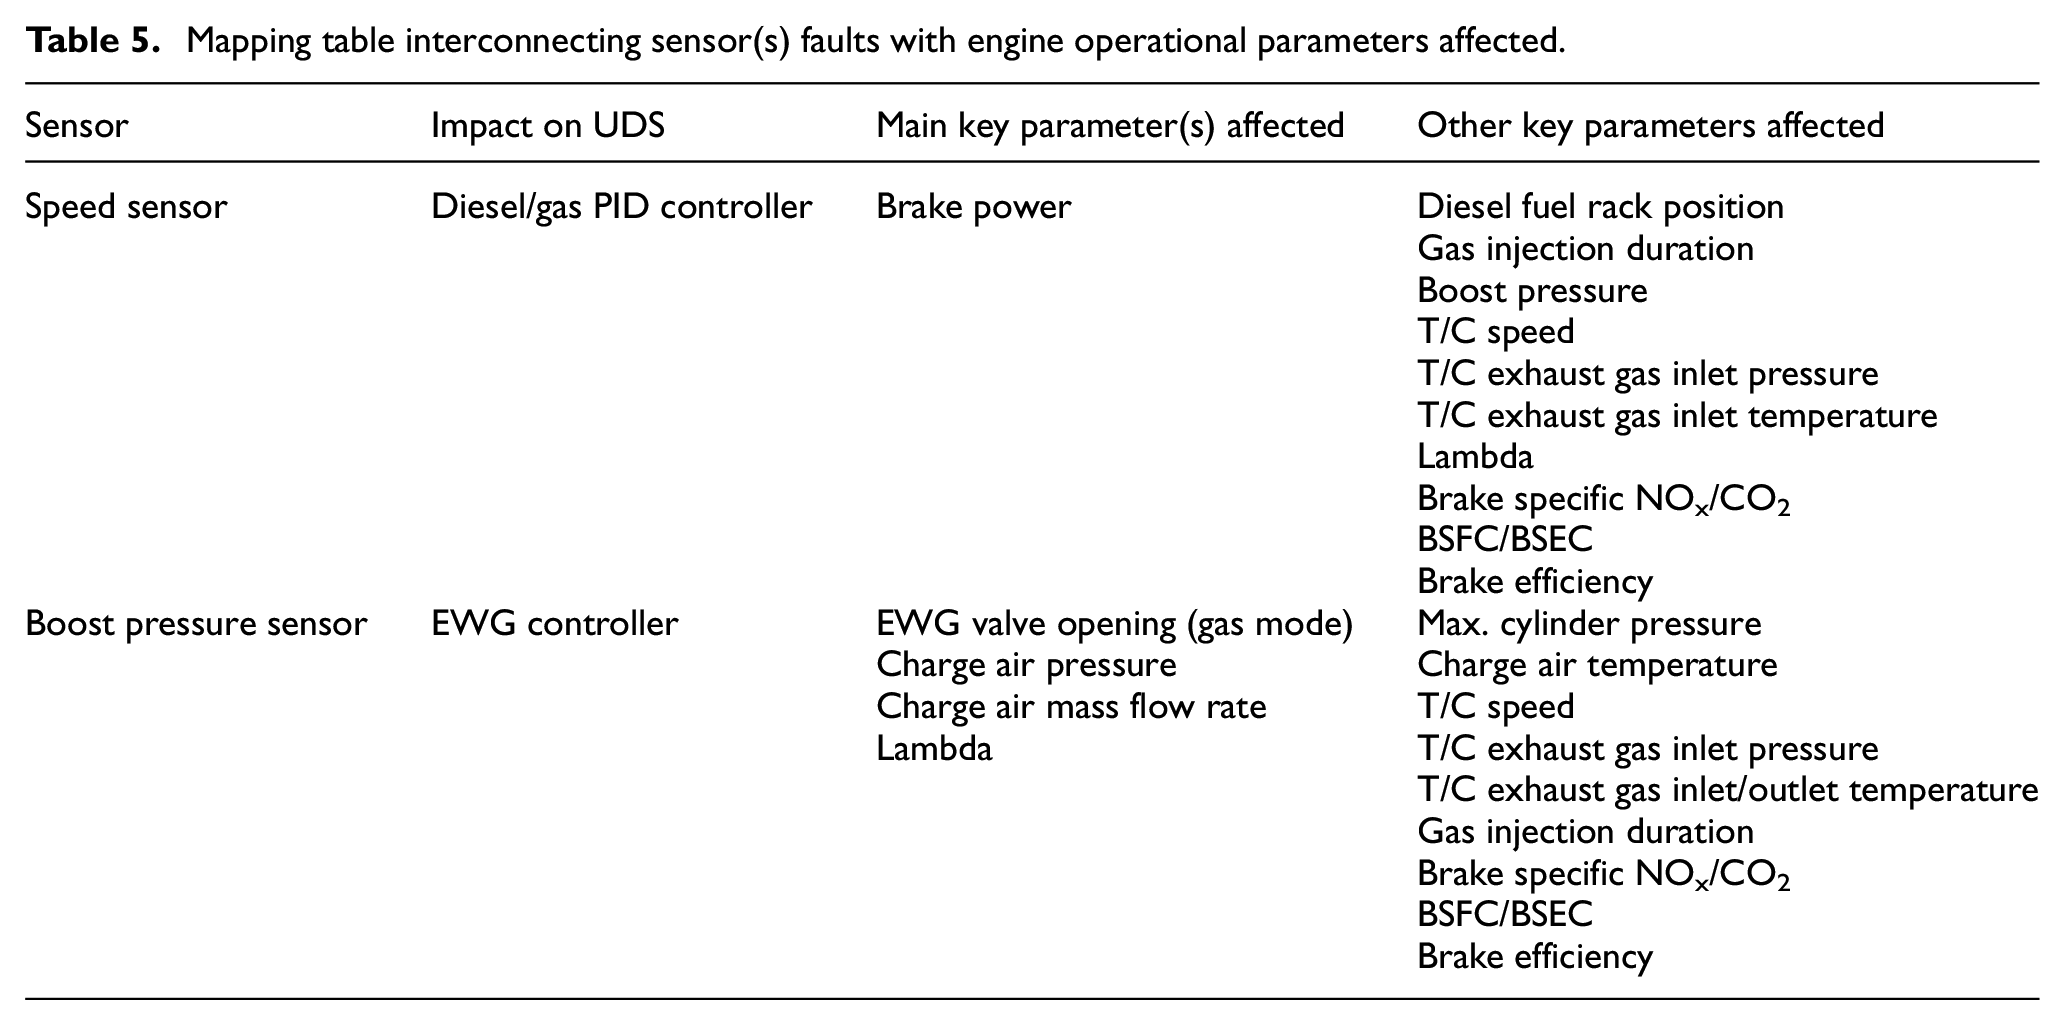
The sensors faults effects on the engine response, as revealed from the investigated case studies (U-1 and U-2) results analysis and the UDS process development are summarised in a concise mapping presented in Table 5, where the sensor faulty measurements are interconnected to the affected engine operating parameters. Likewise, the engine manufacturers based on their vast experience, usually interconnect the engine components faults (e.g. fuel injectors, exhaust valves, cylinders O-rings and liners, bearings etc.) with a number of engine operating parameters. The manufacturers assessment on the components’ faults and their potential effects on the engine operational parameters is commonly included in the engine maintenance manual as part of the troubleshooting, however, this process is not considered under the scope of the present study. Furthermore, it must be noted that the manufacturer’s engine diagnostics system is capable of identifying faults related to the valves’ actuators (e.g. EWG valve, GVU valve) and GAVs, therefore these items are disregarded from this research.
Mapping table interconnecting sensor(s) faults with engine operational parameters affected.
Conclusions
This study developed a methodology for the sensors abnormalities detection and correction based on a Data-Driven (DD) model employing Neural Networks (NN) in combination with advanced logic controls and classification processes that integrate the existing sensors and actuators faults and failure diagnostic approach. This methodology led to the development of the engine Unified Digital System (UDS) concept that is capable of detecting, diagnosing and auto-correcting sensor abnormalities as well as detecting and diagnosing sensors and actuators faults and failures. The UCS system functionality was tested by employing a Digital Twin (DT) of a large marine DF engine for the case studies of two engine sensors faulty operational scenarios, according to which the speed and the boost pressure sensors were assumed to be in abnormal conditions. These scenarios were investigated for both the diesel and gas operating modes at 100% load. The key findings from this study are summarised as follows.
Both the speed and boost pressure sensors have a profound effect on the engine control system (ECS) response due to the fact that these sensors provide input to the fuel and the exhaust waste gate (EWG) control modules, respectively. For both the investigated case studies, the speed sensor abnormal measurement (considered to provide 5% higher speed than the actual) was associated with an immediate negative effect on the engine brake power due to reduced actual engine speed. The boost pressure sensor abnormal measurement (considered to provide 10% lower pressure than the actual) was not found to have a considerable impact to the engine response due to the fact that the EWG is deactivated (remains closed) in the diesel mode. However, in the investigated gas mode operation, the boost pressure sensors abnormal measurements considerably affected the EWG control output (EWG valve opening), and thus, the engine response and its operational parameters.
The developed UDS managed to successfully capture the abnormal engine operation and detect the faulty sensors measurements in both the diesel and gas operating modes. Furthermore, the UDS implemented sequential corrective actions for addressing the speed and boost pressure sensors abnormal measurements were verified, as the engine operating parameters were recovered to their ‘reference’ values.
The novel output of this study includes the development and implementation of the Unified Digital System (UDS) for the detection and correction of engine actuators/sensors abnormalities, which employs a state-of-the-art data-driven (DD) model based on neural networks (NN), in combination with classification processes and logic controls. The integrated DT incorporating the developed EDS and the existing engine controls into a novel UDS, all thoroughly presented and discussed in this study, paves a unique way towards innovative DT-based investigations for enhancing the safety marine DF engines.
The expected benefits from the UDS potential application on marine engines are the following: (a) provision of high-level intelligent engine monitoring real-time capabilities in terms of sensors abnormal measurements identification, as well as advanced faults and failure detection that can mitigate potential safety implications to the engine operation; (b) elimination of redundant sensors and an extra layer of assurance for the personnel supervised sensors; (c) automated virtual calibration of the uncalibrated or faulty sensors via the UDS corrective response until maintenance actions are implemented; (d) improved maintenance costs based on the advance sensors and actuators faults and failure detection leading to reduced down-time due to failures.
The limitations of this study are as follows. The developed UDS capabilities are limited to the sensors and actuators faults/failures and measurement abnormalities detection, whereas the engine mechanical components failures and degradation were not considered. The proposed approach can be further extended to include identification of engine components mechanical failures and degradation as well as the modelling of the engine sensor and data acquisition dynamics. This study serves as a proof of concept and experimental validation is considered as a future research.
Footnotes
Appendix
Acknowledgements
The authors greatly acknowledge the funding from DNV GL AS and RCCL for the Maritime Safety Research Centre establishment and operation. The opinions expressed herein are those of the authors and should not be construed to reflect the views of DNV GL AS and RCCL. Gamma Technologies support is also greatly acknowledged by the authors.
Author contributions
Conceptualization, S.S., G.T.; methodology, S.S., G.T.; software, S.S.; validation, S.S., G.T.; formal analysis, S.S., G.T..; writing—original draft preparation, S.S., G.T.; writing— review and editing, S.S. G.T.,; visualization, S.S.; supervision, G.T.; project administration, G.T. All authors have read and agreed to the published version of the manuscript.
Declaration of conflicting interests
The author(s) declared no potential conflicts of interest with respect to the research, authorship, and/or publication of this article.
Funding
The author(s) received no financial support for the research, authorship, and/or publication of this article.