
Abstract
This manuscript discusses the operation of an electrically driven fan for a hybrid-electric propulsion system for BAe-146 aircraft. The thrust requirement is fed into an integrated cycle and aerodynamic design tool for the sizing of a ducted fan as one of the main propulsors, podded under the wing as a replacement for a turbofan engine. The electric motor design is initiated with the torque and speed requirements and with the dimensional constraints arising from the driven fan geometry. The fan operation and aerodynamic design are derived by changing the fan pressure ratio and hub-to-tip ratio to obtain a 2-D design space. Surface-mounted permanent magnet electric motor designs are mapped on the 2-D fan design space. The design and operational flexibility of the system is investigated through three scenarios. In the first scenario, the aircraft rate of climb is changed to downsize the electric motor. In the second scenario, the electric motor rated frequency is changed to increase the power density and in the third scenario the electric motor current density is changed for the same purpose. The investigated three scenarios provide design and operational guidelines for reducing the weight of the electric motor for a direct drive application.
Introduction
The commitment of the aerospace industry and the regulatory bodies to reduce the environmental impact of air transport, while increasing the standards of travel, have led to a renewed focus on various key enabling technologies. 1 Electrification of the aircraft propulsion is one major area that drives current designs to highly integrated aircraft and propulsion systems which are deemed necessary in order to maximise synergies. Varying electrical power with respect to thermal power in hybrid systems can reduce emissions proportionally to the degree of the electrification. The major challenges of these architectures are the need for high power and energy density sub-systems, integrated compact design, and the certification complexity. An intermediate step towards highly-integrated, fully-electric aircraft can be retrofitted aircraft, utilising hybrid-electric propulsion.
Currently there are various developments with power ranges in the kW to MW scales. A large-scale example is the E-FanX based on the BAe-146 short-haul, 100-passenger platform. The E-FanX was a demonstrator programme of Rolls-Royce, Airbus and Siemens. The programme targetted to replace one of the four turbofans of a BAe-146-100 with a series-hybrid system where the fan receives mechanical power solely from a 2 MW electric motor. The motor electric source was a separate turboshaft-driven generator and a battery pack. Because this was an experimental aircraft, there were no passengers, and the turboshaft-driven generator was placed in the cabin. Rather than proving a reduction in the fuel burn and emissions, this programme intended to demonstrate the capability of the largest flying electrical system and establish a roadmap for technology maturation. 2
Although retrofits are easier to certify as they rely on current aircraft, they are limited by the MTOM of the aircraft. Despite the need for a more complex certification process, highly integrated aircraft and propulsion system designs have the potential to maximise the effective use of hybridisation, setting the MTOM as a variable rather than a constraint and benefit from the key enablers like boundary layer ingestion (BLI), high aspect ratio wings and distributed propulsion.3–5 Several examples are the STARC-ABL, CENTRELINE propulsive fuselage aircrafts, SUGAR truss braced wing aircraft, and DRAGON distributed propulsion aircraft.6–9
This manuscript is based on the BAe-146 aircraft and focuses on the integrated design of an electrically driven fan through a parametric approach, as a wing-mounted main propulsor for a retrofit (Figure 1(a)). The key objective of this study is the generation of performance and operability guidelines, which could also be applicable to BLI fans (Figure 1(b)), by establishing an integrated fan and electric motor design methodology. For that reason, the study is limited to the sizing and operation of the EDP rather than retrofitting the whole aircraft platform for a hybrid-electric propulsion system.
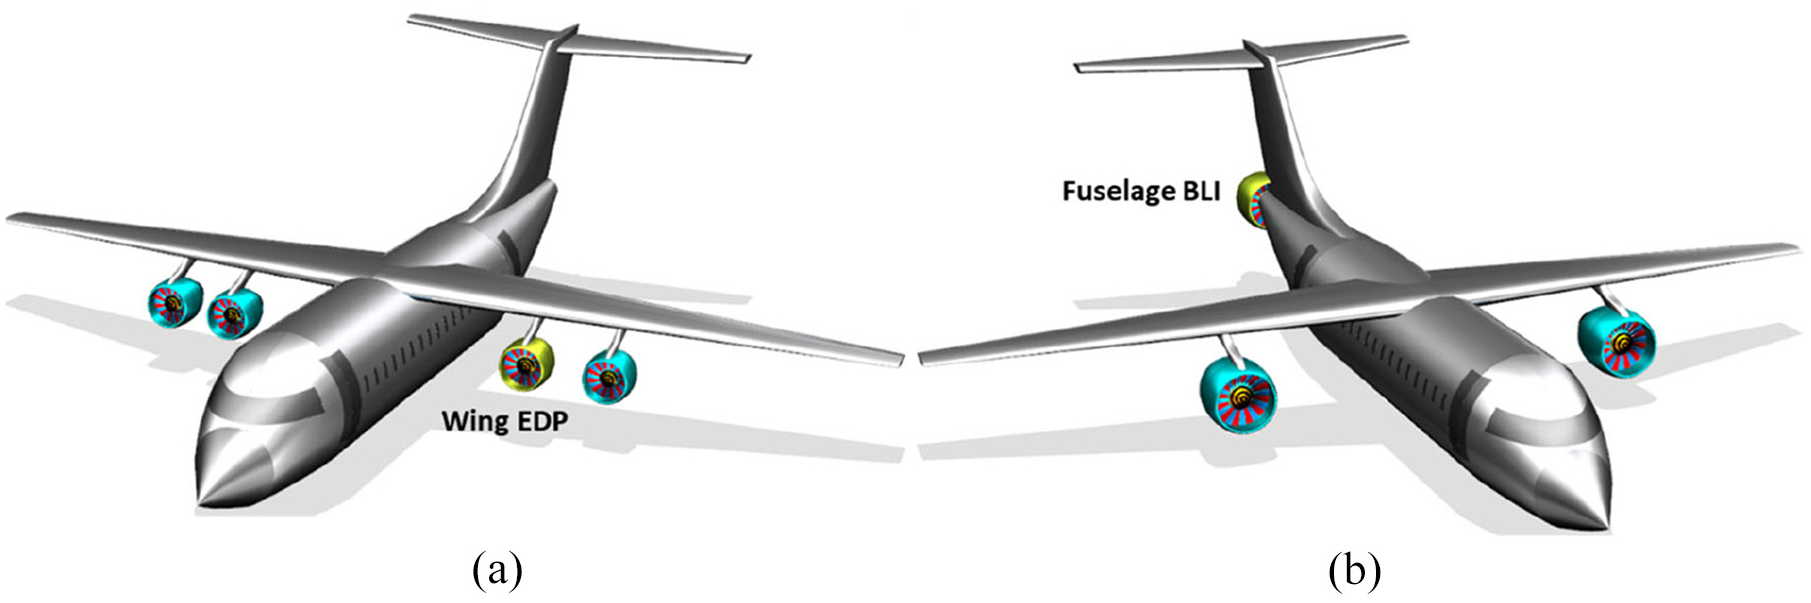
Electrically driven propulsor arrangement (aircraft figure inspired from BAe-146): (a) Wing EDP, (b) Fuselage BLI.
Aircraft performance and EDP design
Aircraft performance
To reproduce the payload-range chart of the aircraft, a total energy model is used. 10 The work done by the forces acting on the aircraft are related to each other according to equation (1). In the equation, the thrust acts parallel to the aircraft velocity vector. The first term of the right-hand side is associated with the altitude gain and the second term is associated with the acceleration. The aircraft maximum thrust, and the thrust specific fuel consumption are defined as a function of Mach number, altitude and by-pass ratio, as given by Young and Howe.11,12
Aircraft MTOM is taken as 42 tons, where the operating empty mass including the crew and the catering is 23.8 tons. The climb speed is scheduled up to FL60 and then a 250 kt calibrated air speed (CAS) with Mach 0.6 limitation is used till cruise. The cruise speed is Mach 0.66 at FL300. The reserves include 5% trip fuel, 150 nm diversion to an alternate airport and 30 min hold at FL15. 13
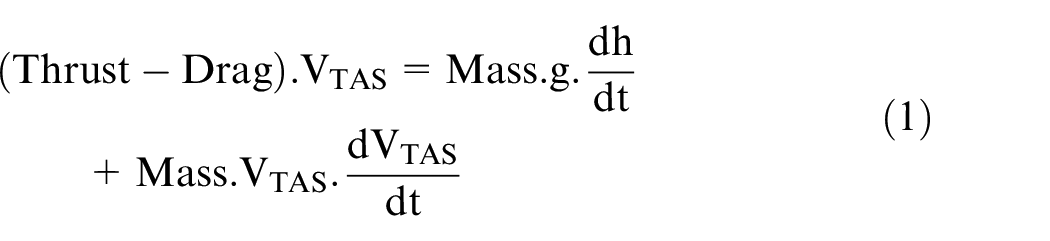
The aircraft payload-range chart is reproduced and compared against the technical data published by the manufacturer (Figure 2(a)). 9 To calculate the extended range using two pannier tanks, which are located on the top of the aircraft body, the additional fuel capacity of each tank is taken as 468 kg with a total structural tank mass of 146.5 kg.14–16 Taking each passenger as 95 kg (passenger, luggage, and belongings), a 100-passenger payload is selected as the reference condition to carry out the EDP study. The reference case thrust variation is given in Figure 2(b) as a function of altitude.
(a) Payload-range diagram, (b) Thrust variation.
Fan operation and aerodynamic design
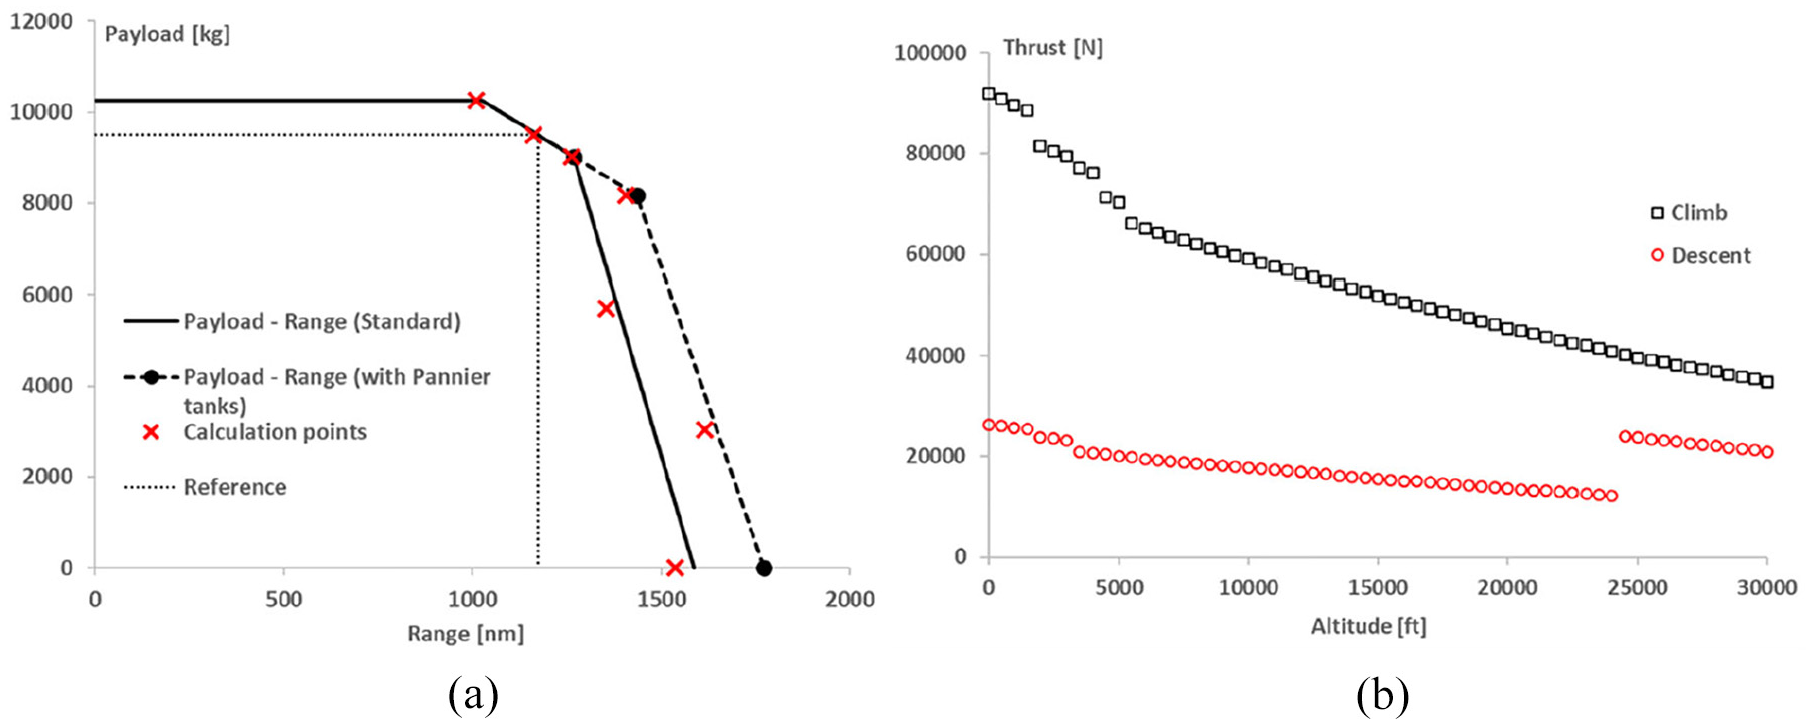
Design strategies may involve different thrust splits, altitude and constant power operation. In this work, the EDP case study is developed to replace one of the four turbofans, with a 25% thrust split at all flight phases. The fan aerodynamic design point is 8.75 kN at 30,000 ft altitude with Mach 0.7 flight speed. The fan flow coefficient and the work coefficient are set to 0.55 and 0.40, respectively. The design space is generated with an assumed rotor efficiency of 0.9. Rotor hub-to-tip ratios (Rh/Rt) are swept from 0.3 to 0.6 to obtain a parametric fan design space. These dimensions are described in Figure 3. The axial fan/compressor sizing methodology given by Rogers et al. was used in generating the design space. 17
Parametric fan design space for ϕ = 0.55, ψ = 0.40.
The flow coefficient (Φ) is the ratio of fan inlet axial velocity (Vax) to the circumferential speed (U) and the work coefficient (Ψ) is the ratio of fan total temperature rise to the square of circumferential velocity. A high work coefficient indicates higher flow turning at a given speed and pressure rise. High flow coefficient indicates high axial velocity at a given speed and mass flow rate. The above-mentioned values are typical in fan/compressor design and similar coefficients for electric fan designs have been reported in literature.18,19
In Figure 3, the fan pressure ratio (FPR) is plotted against the rotational speed. The horizontal isolines of the FPR also indicate power. The specific thrust is inversely proportional to the FPR and the lower value indicates high propulsive efficiency. In other words, at high pressure ratio the thrust is obtained by accelerating less amount of air at a higher pressure. Vice versa, at low pressure ratio the thrust is obtained by accelerating a large amount of air at lower pressure. The power is a function of the product of FPR and the mass flow rate and the first parameter has a higher effect than the second. Thus, with increasing FPR, the power increases for the same amount of thrust.
The horizontal axis reflects a change in rotational speed and also indicates the associated change in fan diameter. A fan diameter increase is related to two factors. The first factor is the movement on the vertical axis. With increasing mass flow rate and decreasing FPR, the fan diameter increases as a result of the high mass flow. The second factor for the diameter increase is related to the movement on the horizontal axis. A fan diameter increase on the same pressure ratio isoline is related to the increase in hub-to-tip ratio. The horizontal pressure ratio isoline also acts as the isoline of mass flow rate, inlet axial velocity and inlet area. To have the same flow coefficient, the fan mean radius decreases with decreasing speed and as a result, the diameter becomes larger. Similarly sweeping hub-to-tip ratio from 0.3 to 0.6 results in larger fans.
The motor electromagnetic design (rating) point is selected considering the high-power demand at take-off, since the power to drive the fan is higher than at cruise flight, as the air is denser at low altitude. The aerodynamic and electromagnetic design spaces are superimposed in Figure 3. The right vertical axis values are for electromagnetic design conditions where the power almost doubles compared to the aerodynamic design point requirements. A high hub-to-tip ratio indicates larger space to fit an electric motor, and this is beneficial for torque generation.
The design space has different challenges at different points. Different size propulsors are illustrated in Figure 4. The outbound propulsors have the size for FPR 1.55 and HTR 0.4 and designated by reference point R. The upper aircraft inbound propulsors are the left top (LT) and the right top (RT) and the lower aircraft inbound propulsors are the left bottom (LB) and the right bottom (RB) propulsors.
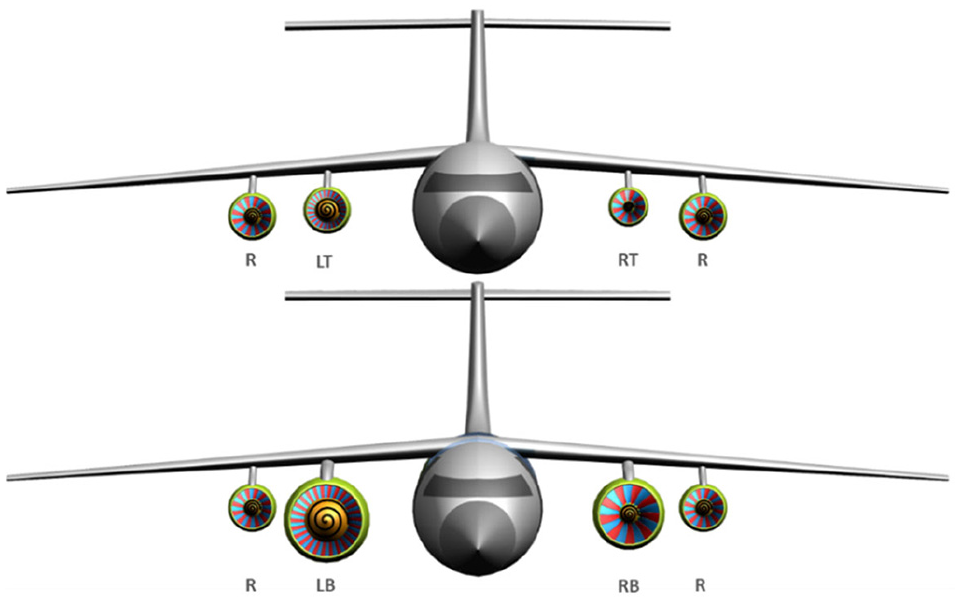
Propulsor comparisons in size.
At the left bottom boundary of the design space, the lowest fan inlet Mach number appears, and this is beneficial in terms of aerodynamics. However, these regions may create installation problems due to the high propulsor diameters. At the right bottom boundary of the design space, the longest blade height occurs. The fan blades at these regions are prone to flutter due to less stiffness when compared to the other design points. The left top boundary with the highest hub-to-tip ratio is associated with the lowest blade height where the influence of the tip gap and end wall losses on the main flow may be higher. The right top of the design space results in the highest fan inlet tip relative Mach number where shock losses become excessive. These rightmost parts also exhibit the highest product of the area and the speed squared (AN 2 ) becoming more important in terms of structural integrity.
Electric motor design
Based on the power and speed requirements, the electromagnetic design of internal rotor, radial flux, surface mounted, permanent magnet machines was carried out. The electric motor diameters were arranged to fit to the space present after the fan rotor exit. The electric motor architecture is given in Figure 5. For the sizing of the electric motor, an analytical approach has been followed. For a conventional design, these methods have been found reasonable for motor performance estimations and are comparable against numerical finite element simulations.20–22 A reasonable first estimate of the torque of the electric motor can be calculated using equation (2). Although based on several simplifications, this is usually adequate for initial sizing and the investigation of leading machine parameters and loadings. For a conventional design, the assumptions adopted in the design of the electric motor are listed below. The effect of current density and rotor poles are investigated separately in Section 3.
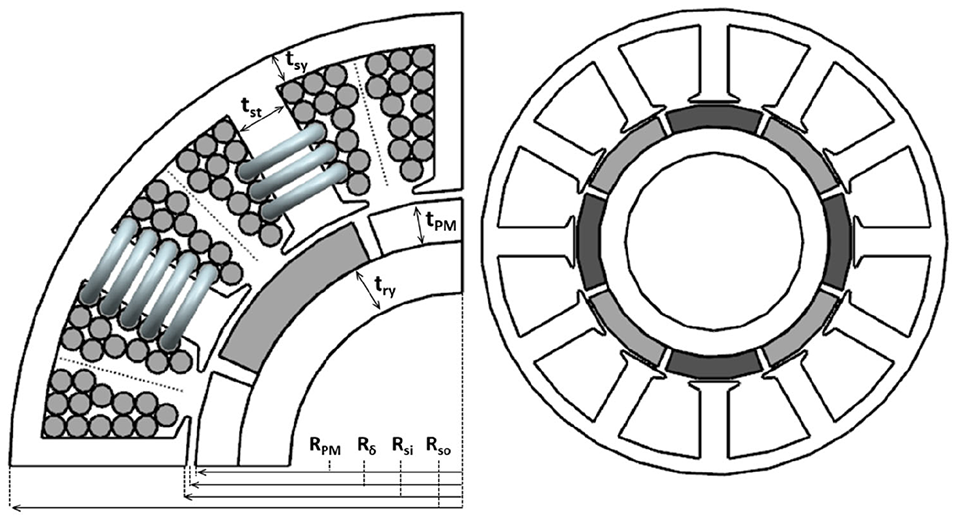
Cross-sectional view of electric motor architecture.
The current density has a direct influence on the torque density but is ultimately limited by the cooling available to the motor. The rms value of the current density (JRMS) was selected as 5 A/mm2 for all designs. This is a comparatively modest current density level but reflect the limited cooling available and the need to achieve a competitive efficiency.
The effective magnetic air gap is the radial distance between the rotor permanent magnet outer surface (RPM) and the inner bore of the stator (Rsi). In general, it is desirable to minimise this gap in order to enhance the magnitude of the magnetic flux density in the gap23,24 although this has been tensioned against considerations such as thermal expansion, rotor-dynamics and manufacturing tolerances. In many applications, it is necessary to incorporate a non-magnetic sleeve to contain the magnets and to ensure that they remain in contact with the rotor core over the full speed range. The containment sleeve thickness, by virtue of being non-magnetic, contributes to the effective magnetic air gap and hence the effective magnetic airgap in this type of machine is often much greater than the mechanical clearance between the outside of the rotor containment sleeve and the stator bore. The ratio of effective magnetic air gap (i.e. including the containment sleeve) to stator outer diameter (2.Rso) was set at 1% for all the designs considered.
Each of the motor designs considered have fractional-slot, concentrated windings and eight rotor poles. The ratio of the number of stator slots to the number of rotor pole was maintained at 3/2 (i.e. 12 stator slots and 8 rotor poles). Given this fixed slot and pole number arrangement, the so-called winding factors (kw) are the same for all designs.
In a stator machine winding the slot regions are not fully occupied by conductor material due to the geometry of the individual conductors and the inevitable spacing that results and the need to accommodate various insulating elements. The proportion of the available slot area which is occupied by conductor (as opposed to voids and insulating materials) is specified in terms of a so-called stator slot fill factor (ffill). The value of fill-factor adopted in this design study is 0.5, a value which is representative of a random wound coil with circular wire. The rotor magnets are assumed to a grade of NdFeB with a remanence (Br) of 1.32 Tesla at room temperature. 25 The magnet (tPM), rotor yoke (try), stator yoke (tsy), and the stator teeth (tst) thicknesses are dimensioned to avoid magnetic saturation of the rotor and the stator iron.


The peak electric loading (linear current density in Ampere/mm, Ŝ) is a function of the current density (J) in the stator slot area (As), slot fill factor (ffill) and the slot pitch (τs) measured at the stator inner radius as given in equation (3). Thus, for a fixed current density and fill factor, the electric loading becomes a function of the stator slot dimensions. Additionally, the magnet coverage and the stator split ratio (Rsi/Rso) are fixed values. Therefore, the electric and the magnetic loadings become coupled and the torque becomes a direct function of the volume (Rδ. La). The active weight, volumetric torque density based on rotor diameter and the gravimetric power density based on overall weight as functions of rotational speed are shown in Figure 6. It should be noted that the power density quoted in these calculated variations corresponds to the active components of the machine and exclude end-windings, cooling jacket, end-caps, bearings, shaft, and support structures.
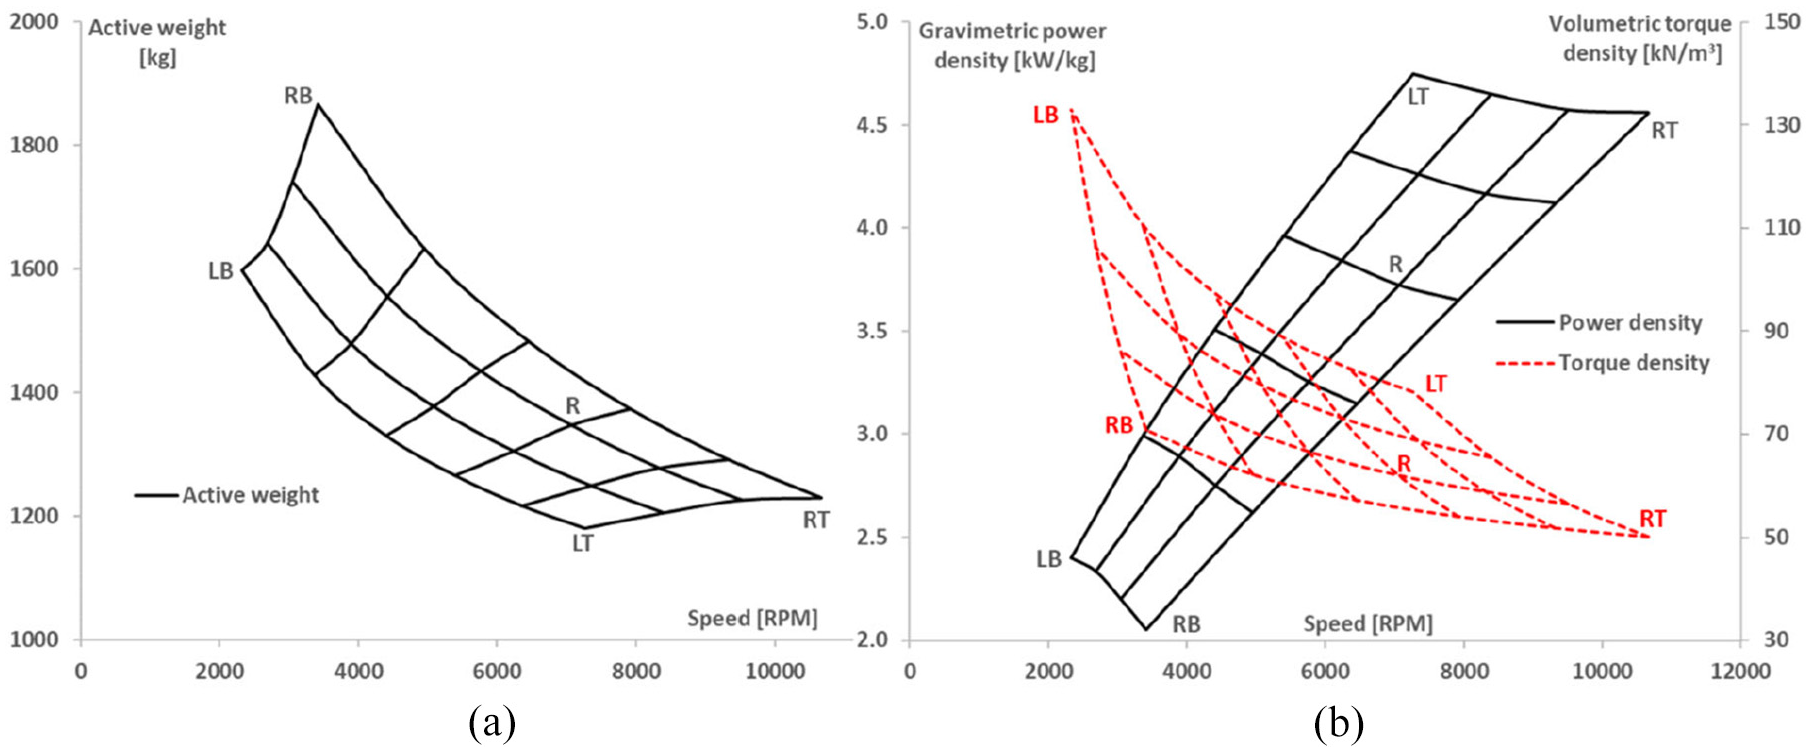
(a) Motor active weight, (b) Power density and torque density.
Since the fan torque increases with diameter, high torque and high diameter results in relatively short electric motor length at the same magnetic loading. This the primary reason that the torque density increases with decreasing speed (Figure 6(b)). With increasing fan hub-to-tip ratio at constant fan pressure ratio, the available space for motor increases. Hence, the torque density of LB is higher than RB. Similarly, torque density of LT is higher than RT. This trend can be generalised for hub-drive electric motors. By way of example, the fan hub-to-tip ratio should be expected higher because of the architecture of a propulsive fuselage aft fan. This results in larger space for a torque-dense, hub-drive, external rotor electric motor. At fixed fan flow and work coefficients, the high pressure ratio fans need to rotate faster to energise the air. This low torque and high speed condition reflects to the electric motor characteristic. Due to low torque, at same magnetic loading, the active length becomes less, making it relatively light. Since the power input is dependent on machine speed then inevitably, the power density of the electric motor increases with increasing speed (Figure 6(b)). The active weight of the electric machines are given in Figure 6(a), which can be considered as the combined effect of the power and the torque densities. The weight of the ALF 502 turbofan baseline which would be replaced is ∼600 kg. The active weight of the reference (R) electric machine is 1347 kg which is far heavier than the ALF 502 turbofan. Despite the lower weights of high-power fans (LT, RT), the required energy source to drive these needs to be higher. Considering the battery energy and power densities, a high percentage of the overall electric propulsion system weight may be composed of batteries. In the next section several design and operational alternatives are discussed to reduce the weight of the electric machine.
Design and operational aspects
In this section, three cases are studied to reduce the weight of the motor. In the first case, the climb schedule of the aircraft is modified such that the maximum torque and the power demand during the flight are reduced. The change in the climb schedule is based on reducing the rate of climb which in turn leads to a sacrifice of aircraft performance. In the second case, without changing the outer dimension limit and the design speed, the rated frequency of the electric motor is increased. This is achieved by increasing the rotor pole number and keeping the stator slot to rotor pole number ratio to 3/2. As a result, higher power densities were obtained, albeit at the expense of reduced efficiency. In the third case, the electric motor current density is increased to realise higher power density which results in increased winding losses which in turn requires enhanced motor cooling. The three cases are studied separately, and the results are summarised at the end of the section with their cumulative effect.
Case A: Modified climb
One difference between a gas turbine-driven fan (turbofan) and an electrically-driven fan is the power capacity of the fan drive. In a similar manner to the fan, the gas turbine core is an air breathing machine and the performance is influenced by air density. At low altitude, the power required to drive the fan is higher but the core is capable of driving the fan due to the dense air. At high altitude, the power required to drive the fan is less but the gas turbine core performance is also diminished because of the low air density. The performance of the electric drive is independent of the air density (other than any effect on motor cooling performance) and the aircraft carries an electric motor with unused capacity during the long cruise flight. To overcome this, the NASA STARC-ABL aircraft BLI fan was sized for cruise and the thrust percentage of the BLI fan was reduced during climb to keep the motor weight low. 6 A similar approach was followed hereafter resulting in a variable percentage thrust for the fan and one turbofan.
It is a common approach to de-rate gas turbine engines during climb. This leads to reduced turbine inlet temperatures and component life does not degrade rapidly. On the other hand, the aircraft reaches cruise altitude slightly later. Assuming the current aircraft is an experimental one, in order to reduce the motor weight, a de-rate approach is applied. The electric propulsor, located inboard, is assumed as a turbofan with de-rate and to avoid aircraft yawing motion, the inboard turbofan on the other wing is de-rated by the same amount. The outboard turbofans on each wing are still operated at full thrust. This is illustrated in Figure 7(a). The de-rate applied to the inboard turbofan is ∼20% during take-off (Figure 7(a)). This continues with a decreasing rate until FL250 and after that altitude, the motor runs the electric propulsor to provide 25% of the total thrust like the outboard engines. Figure 7(a) also shows the climb rate ratio of the new schedule alongside the initial schedule. The de-rate reduces the total thrust and the new climb rate is about 75% of the initial climb rate indicating that the time to reach the cruise altitude is longer in the modified climb. The aircraft trajectories are given in Figure 7(b). The aircraft flying on the initial schedule reaches cruise altitude FL300 about 6.Δt. At this instant, the aircraft on the modified flight schedule is at FL270 requiring seven more minutes to reach FL300.
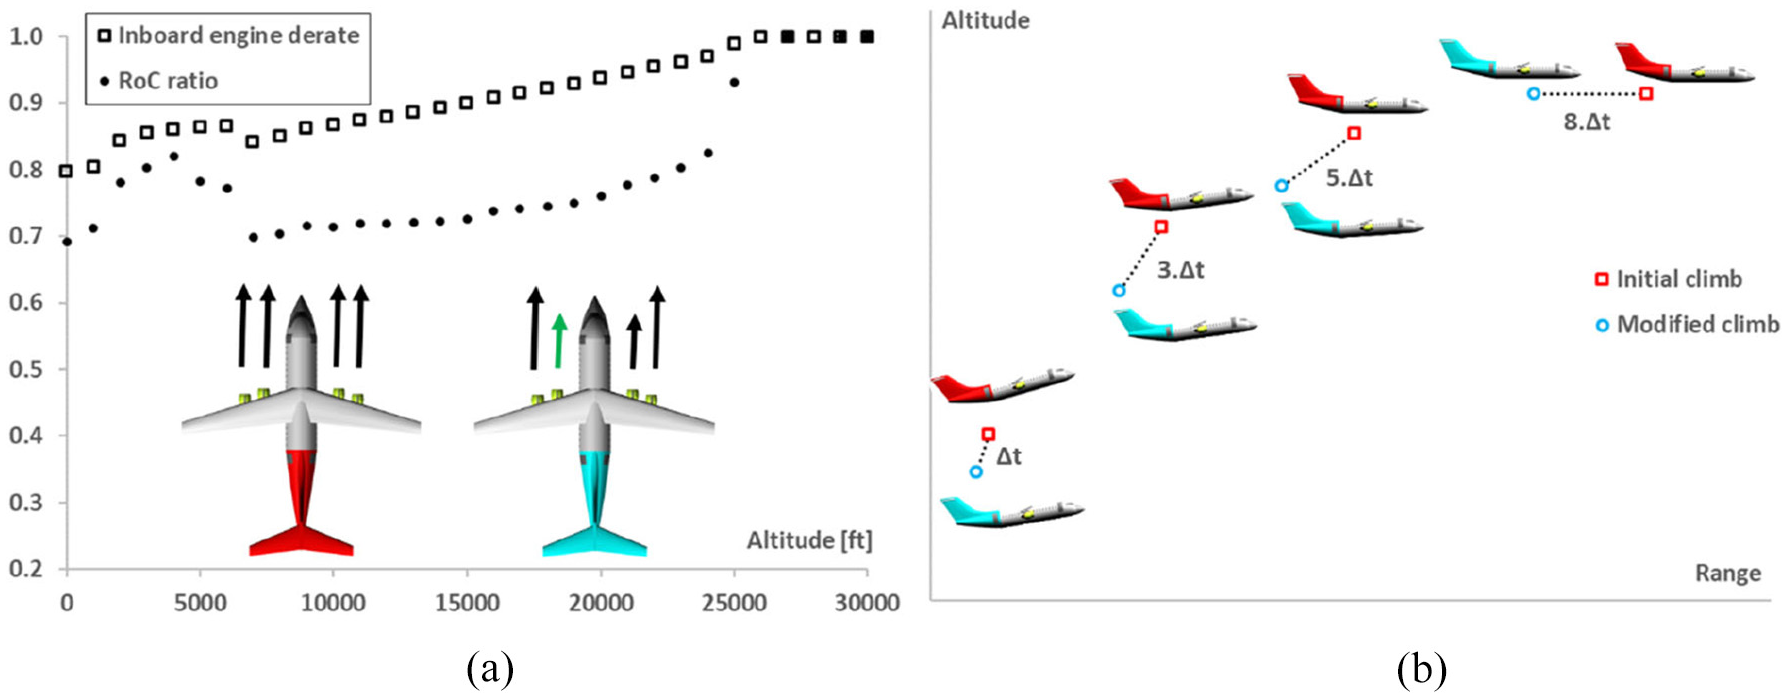
(a) Engine de-rate, climb rate ratio, (b) Climb trajectory.
The fan operates at constant torque (4.1 kNm) until FL 90 and then at constant power (2.62 MW) at the new climb schedule. The aforementioned de-rate schedule is a result of this pre-defined operation. This is given in the motor torque-speed and the power-speed characteristics (Figure 8). With the new schedule, the high torque and the power of the initial climb is avoided by sacrificing the climb rate. The initial rating point given with (+) sign was 6.78 kNm (5.01 MW) with a maximum value of 5.75 kNm (3.98 MW) appearing at climb start. The new rating point given with (x) sign has the value of 4.4 kN (3.25 MW). At the new rating point, the machine becomes shorter leading to a 35% reduction in weight. This corresponds to a 471 kg reduction from the initial value of 1347 kg. The 4.4 kN value may be increased depending on the final needs, that is, accessories power, resulting in a less than 35% reduction in weight, but in the end there is a potential to reduce the machine weight. It should be noted that cruise (2.83 kNm, 2.06 MW) slightly sits below the design point as the aircraft was operated at Mach 0.66 to follow the schedule given in the aircraft manual. If it is operated at maximum cruise speed of 0.72, the cruise operation (square marker) moves to the design point (triangle marker).
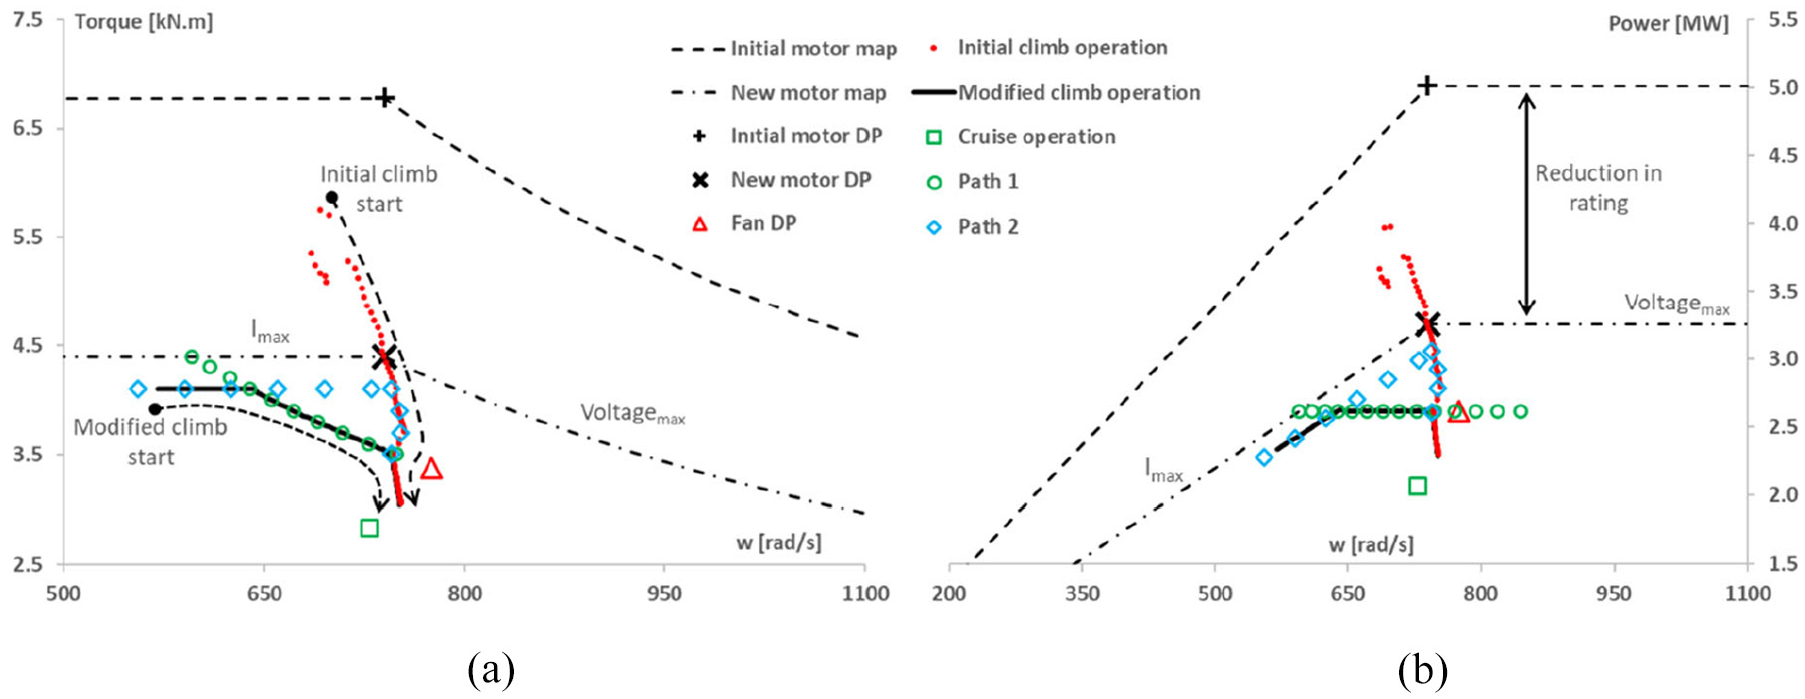
(a)Torque, (b) Power demand.
In addition to the modified climb schedule, it is worth considering two other climb schedules, viz. Path 1 and Path 2 as defined in Figure 8. These are shown with unfilled circle and diamond markers respectively. Path 1 is the constant power climb with the power moving parallel to the maximum voltage line. However, at low altitude, it intersects with the maximum current line and hence does not provide an opportunity to downsize the motor as is the case with the other options. Path 2 is the constant torque climb where the torque moves parallel to the maximum current line. In this case, the de-rate needs to be applied until FL200 which is shorter than the modified climb where the de-rate was applied until FL250. Unless this schedule passes through the flux weakening region and hits the rated voltage border of the motor characteristic, this is also a viable option.
The control of the electric motor at constant torque and at constant power is also dependent on the operation of the fan on its characteristic map. The fan map was taken from a lift fan application and was operated on a predefined operating line using a variable nozzle (Figure 9(a)). 26 The nozzle area ratio to the design value is plotted on the primary axis of Figure 9(b). The nozzle area needs to be increased to allow more flow so the fan moves away from the surge line at low altitude and speed. The magnitude of the modulation is ∼5%–7%. The modulation is mainly a function of the calibrated air speed and once the aircraft reaches CAS 250 kt, the area modulation stops. It is also seen that due to the reduced thrust, the fan operates at a lower characteristic speed in the modified climb.
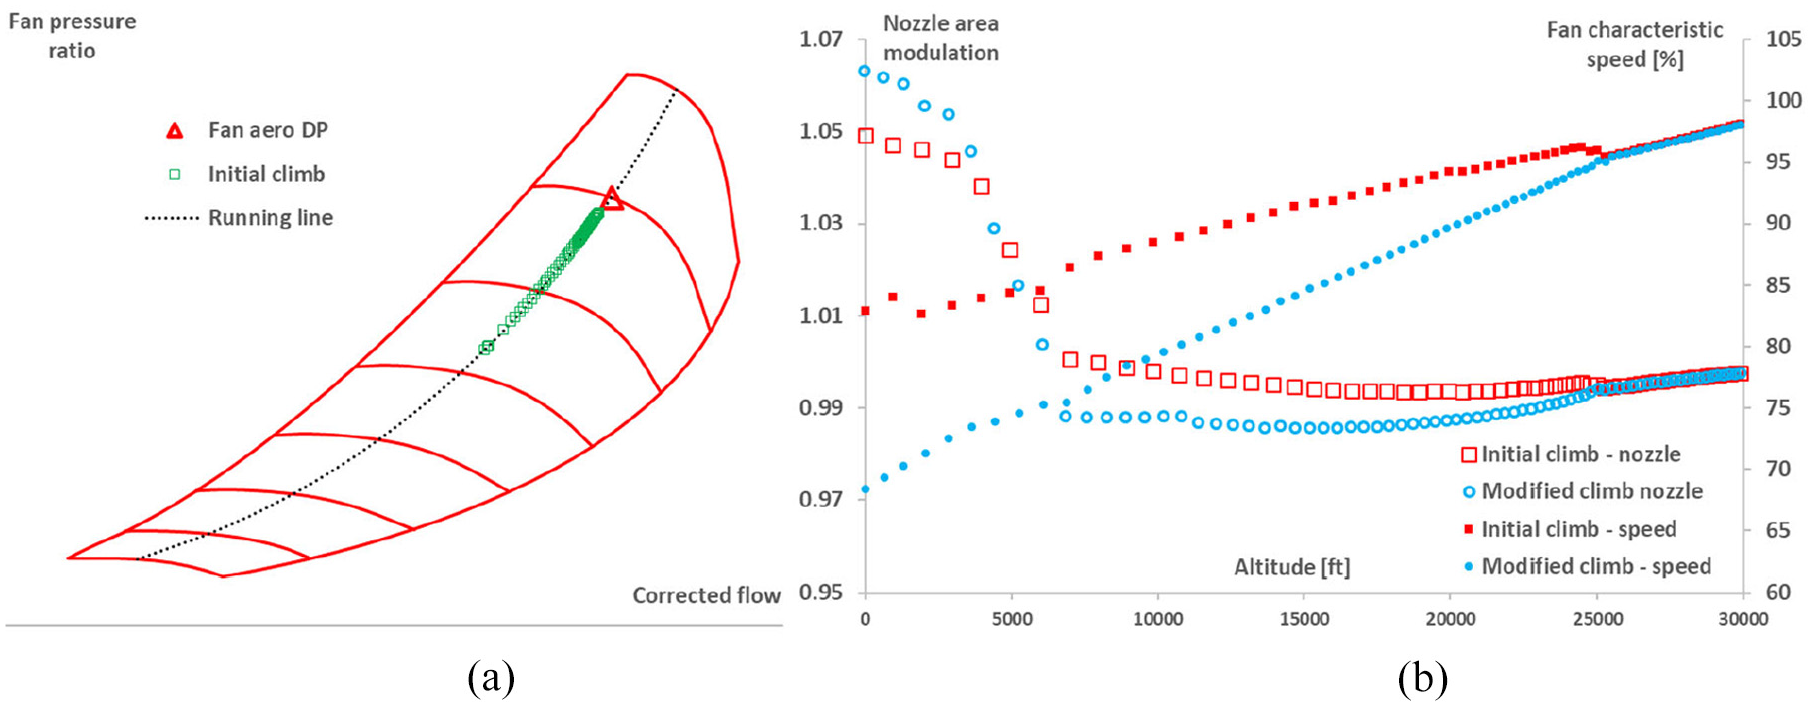
(a) Fan characteristic speed, (b) Variable area nozzle modulation.
Case B: Slot-pole numbers and rated frequency
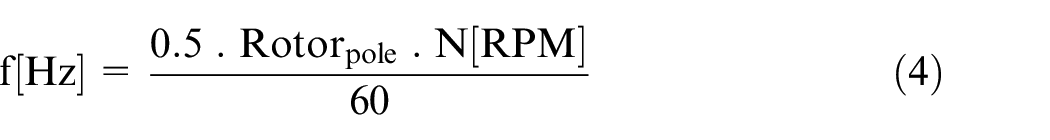
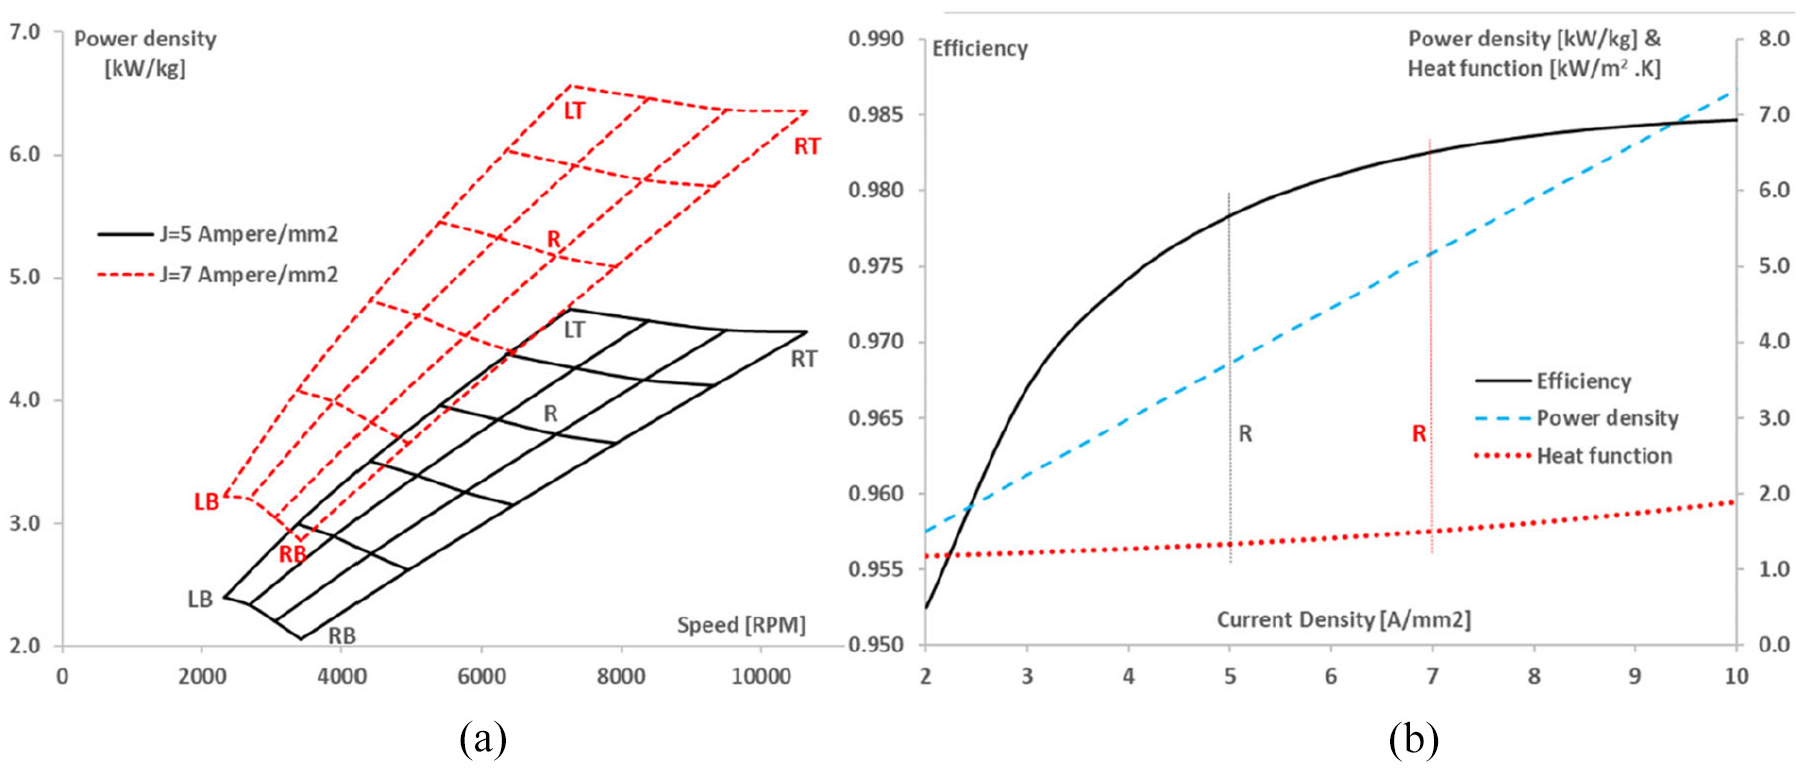
Another means of reducing the weight of the electric motor is to change the pole number and hence the rated frequency. The rated frequency is defined in equation (4). The initial design space featured the same architecture for all motors with 8 poles and 12 stator slots. This resulted in a frequency range between 115 Hz (LB) and 710 Hz (RT). Increasing the pole number is a common approach for increasing the torque density of an electrical machines since the cross-section of the stator core back-iron can be reduced, thus allowing a larger slot and hence higher electric loading to be used with a given current density. However, increasing the rotor pole number and the consequent increase in the frequency does incur a penalty of increased stator iron loss. According to equation (3), and with the same fixed current density of 5 A/mm2 and slot fill factor of 0.5, the linear current density or electric loading will increase. With such an increase in electric loading, the active length of the machine can be reduced to provide the specified torque. Figure 10(a) shows the influence of the increased rated frequency on the power density. The shifted high power density features slot and pole number combinations that makes the rated frequency as close as possible to 1 kHz. For example, the point R in the shifted design space has 942 Hz rated frequency. The power density of machine R increases from 3.7 kW/kg to 7.8 kW/kg. This reduces the machine active weight by 705 kg.
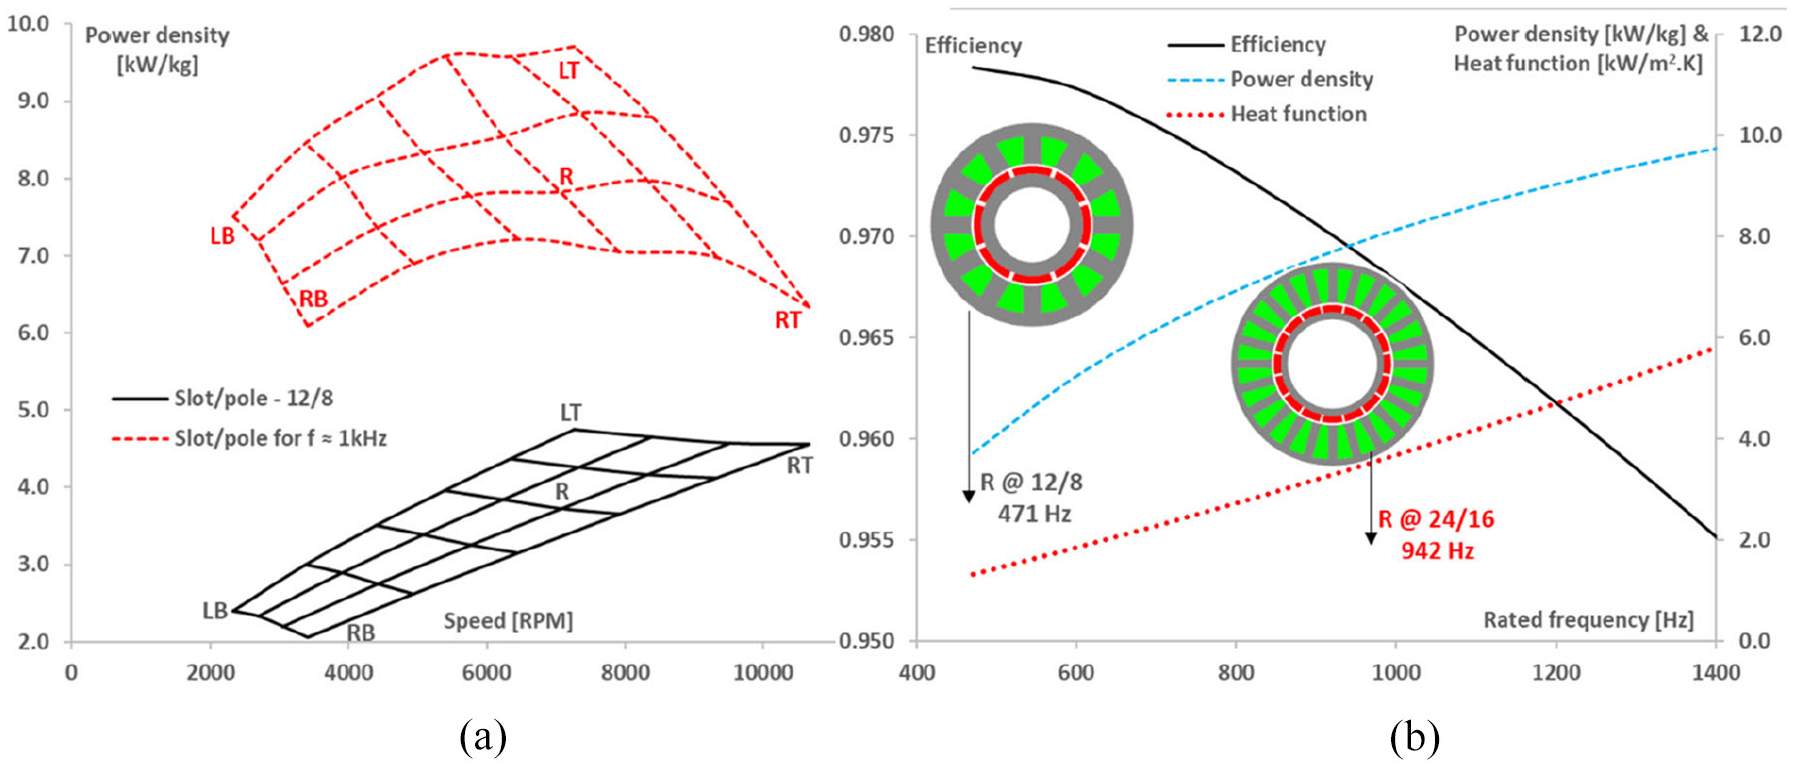
Effect of rated frequency: (a) Power density, (b) Efficiency, power density and heat function.
In Figure 10(b), change of machine R performance is shown as a function of the rated frequency. While the power density increases as a function of the rated frequency, this is at the expense of diminishing efficiency. With the decrease in stator slot area and the active length, the copper loss decreases by virtue of the designs all operating at the same rms current density of 5 A/mm2. However, the overall loss is dominated by the iron loss which is a function of the electrical speed. For that reason, with the increase in electrical speed as a function of the increasing rotor poles, the efficiency of the machine decreases. The copper losses of the machine R are of the order of 12 kW and the iron losses range from 100 kW to 150 kW within the 471 Hz to 942 Hz interval. As a consequence of the iron loss dominance, the shifted 1 kHz design space in Figure 10(a) features almost the same efficiency in the entire domain.
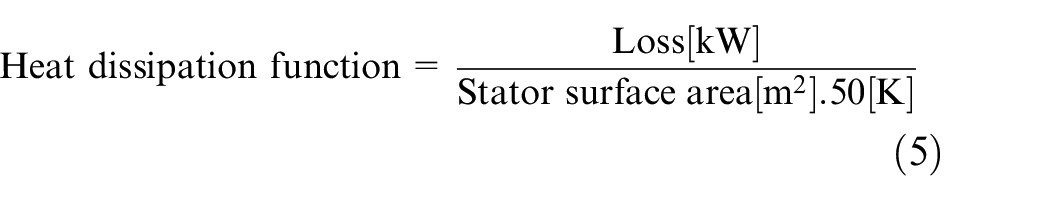
The third parameter shown in Figure 10(b) is the heat dissipation function or heat function. This is the ratio of the loss to motor stator surface area per 50 K temperature difference. The heat dissipation function is defined in equation (5) and is a useful indication of the heat transfer coefficient required to cool the rotor. With the decrease in rotor active length through increasing rated frequency, the surface area of the motor decreases leading to an increase in the heat function. The exact value of the heat dissipation function will depend on:
Heat transfer surface area which can be increased using fins.
The fluid properties of the coolant. If it is air, it is highly dependent on the atmospheric temperature and the density. A closed loop liquid cooling system is less dependent on these variables.
The temperature of the heat sink. This is potentially the fan flow which changes as a function of the altitude, flight speed and fan pressure ratio of the entire flight envelope.
Case C: Current density
Another commonly employed approach for reducing motor weight is increasing the current density (J), albeit that this comes with a significant increase in winding loss. Current density directly determines the electric loading (A) and an increase in this quantity results in proportionate reduction in the active length of the machine required to achieve a given torque. Figure 11(a) shows the benefits of increasing the rms current density from 5 to 7 Amp/mm2, with a marked upward shift in power density over the design space. In this case, the gravimetric power density of machine R increases to 5.18 kW/kg leading to a weight reduction of 378 kg. Figure 11(b) shows the influence of the rms current on various aspects of the performance of motor R. Assuming that sufficient cooling can be provided to sustain the higher level of current density, then the power density linearly increases. Although the winding loss will tend to increase with current density despite the reduction in machine volume (the loss being proportional to the square of the current density while the reduction in volume is linearly proportional to the current density) there is an increase in overall efficiency, albeit with diminishing return because the increase in winding loss is more than compensated for by the reduction in core loss which results from the reduced machine volume. It is also seen that the increase in efficiency reduces the rate at which the heat function increases with current density.
Effect of current density: (a) Power density, (b) Efficiency, power density and heat function.
Summary of motor design options
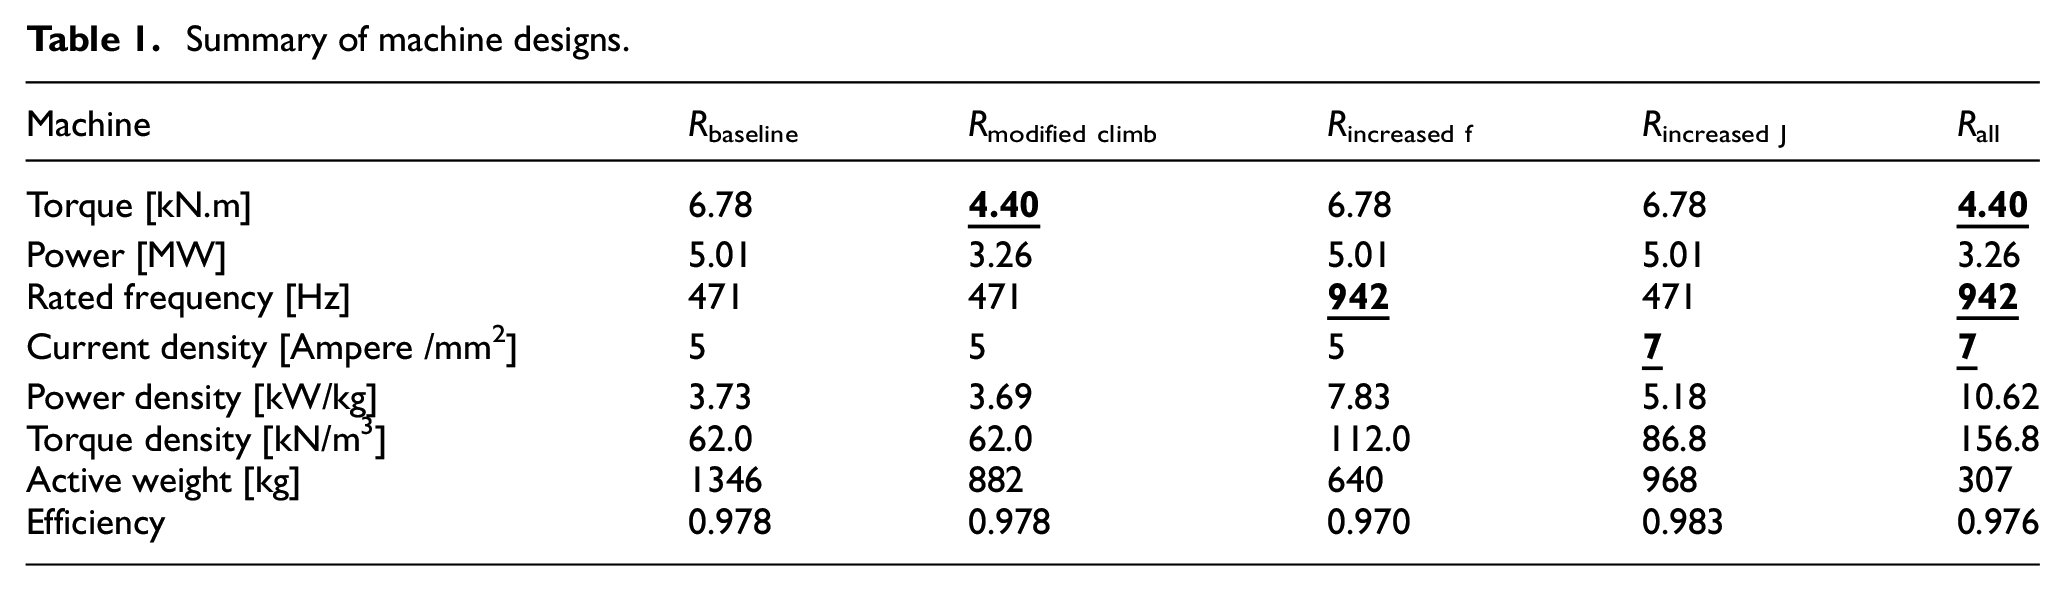
Table 1 summarises the performance measures achieved with the various design modifications described previously in this section. In each case, these modifications to the climb and key machine features were applied in isolation on the baseline R machines. Clearly, there is some scope to apply these cumulatively to the baseline. The resulting performance for a cumulative incorporation of these three modifications is shown in Table 1 under design Rall. It is worth noting that these performance predictions were made for a specific machine design which incorporated these features and not simply by cumulative additions of the performance benefits. As shown, the machine which incorporates all three modifications shows a very considerable improvement in the power density compared to the baseline, with only a marginal reduction in efficiency. Considering the structural components of the machine to be added to the active weight of 307 kg, the electric machine now offers less penalty in weight to replace the ∼600 kg ALF 502 turbofan engine of a retrofit aircraft with experimental purpose.
Summary of machine designs.
Further considerations
In this section, the design space is discussed as a whole in terms of mechanical, thermal, and mission aspects. The fan integrity is an already established technology due to presence of various by-pass ratio fans in service. Due to size and speed requirements dictated by the fan, the stress field in the magnet retaining sleeve is considered as critical and a preliminary analysis has been carried out for different sleeve materials. The tangential stress is calculated assuming the sleeve as a thin shell. This is given in equation (6), where the stress is the sum of stress due to shrinking and stress due to rotation. 27
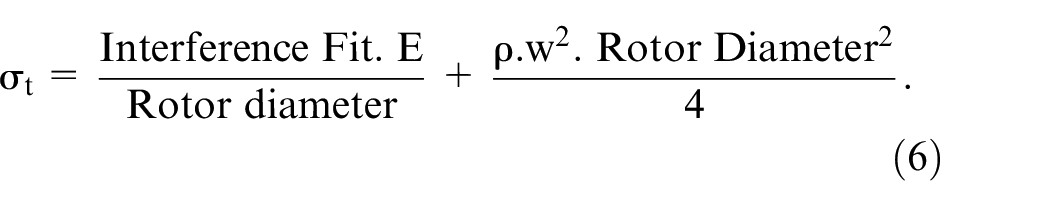
In Figure 12(a), the sleeve stresses are plotted as a function of rotational speed for three different sleeve materials which are Steel (E = 196 GPa, ρ = 7600 kg/m3, σtensile = 500 MPa), Inconel (E = 199 GPa, ρ = 8200 kg/m3, σtensile = 1100 MPa), and Carbon Fibre (E = 140 GPa, ρ = 1620 kg/m3, σtensile = 1400 MPa). The calculations are done assuming an intereference fit of 0.35 mm. 27 Due to high density, Steel and Inconel result in higher stresses but in terms of safety factor w.r.t the tensile limit, steel becomes critical. There are conditions where the safety factor drops to 1.4 for steel (Figure 12(a)). Carbon Fibre gives the highest safety factor. Although it is an expensive application in general, this material can be considered for this application especially if the low speed regions are preferred to be designed as a geared drive. There is a margin to be improved to get higher power density. For a steel application at high rotational speed, the motors can have an internal optimisation in terms of overall diameter, split ratio (rotor diameter to stator diameter ratio) or length for a better safety margin. But in general, in terms of sleeve stresses, low speed region is preferable.
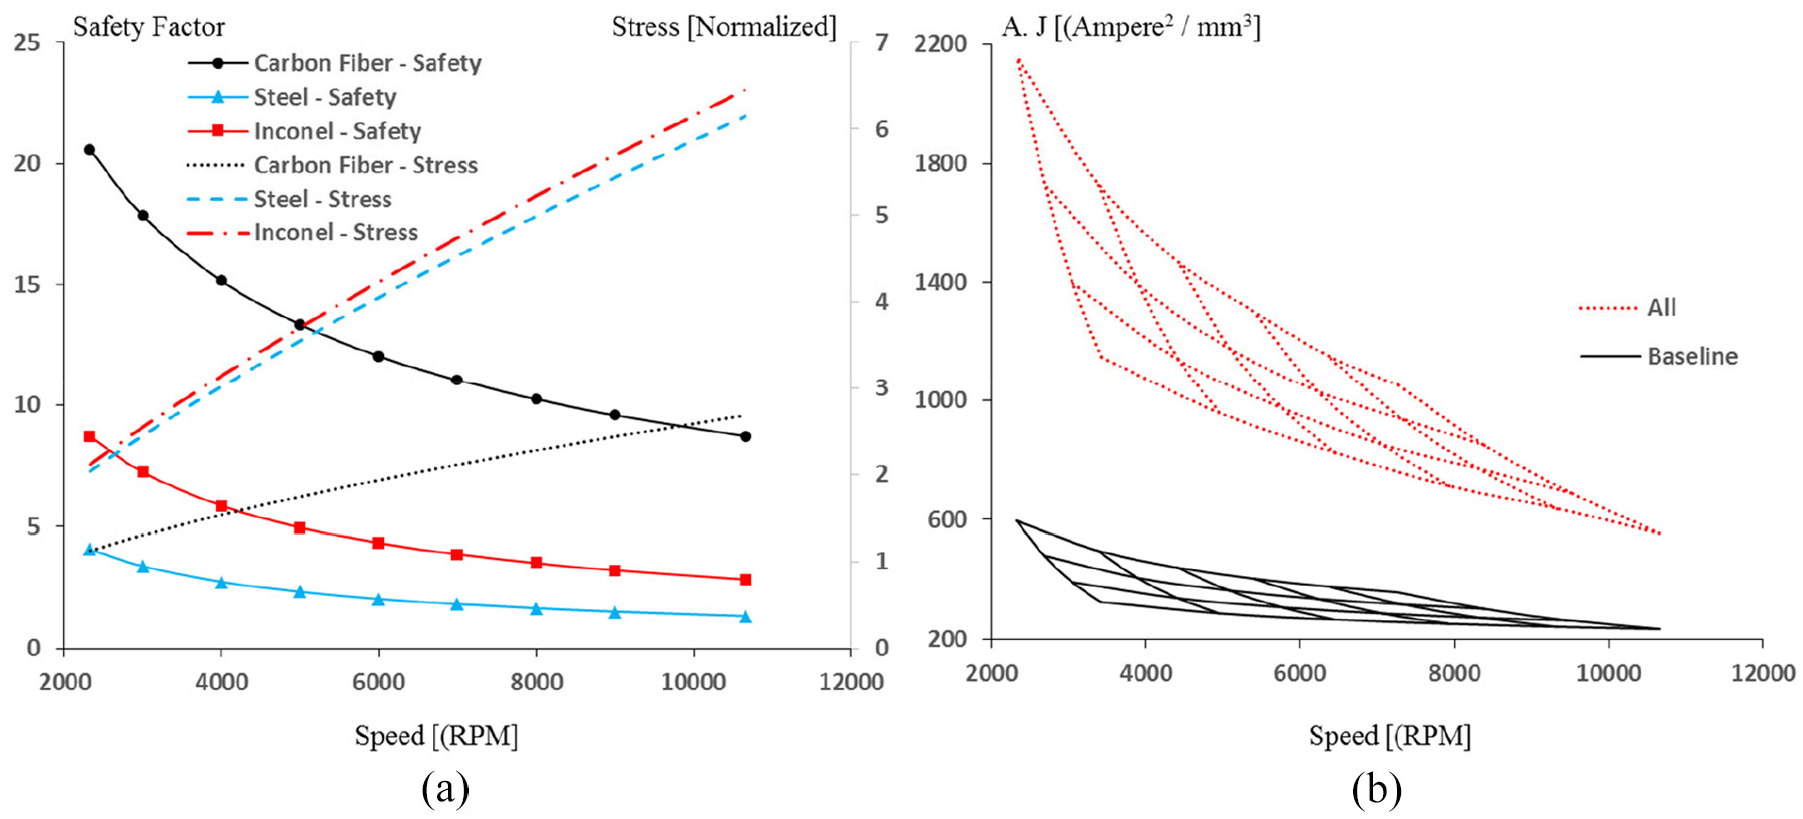
Mechanical and thermal aspects: (a) Safety factor, (b) Product of current loading and current density.
The thermal performance of the system is plotted in Figure 12(b) in terms of the product of current loading (A in Ampere/mm) and the current density (J in Ampere/mm2). It can be concluded that the baseline design space can be cooled by indirect cooling such as air. 23 The cooling requirement increases at lower speeds. The reason for this is that with the increase in diameter, the stator slot area increases. For a fixed current density in the design space, the current loading needs to be higher. For the revised design space (All) which was introduced at Section 3, the reduction in active weight comes with the requirement of increased cooling need. The values here fit for direct cooling such as oil, glycol, or water. It should be noted that the requirement at low speeds are very intense making the design space hard to implement. It would be better to apply a geared drive at these regions such that the power generation relies on speed rather than the torque.
An overall behaviour of the system has been investigated following the conflicting parameters of the mechanical (high speed) and thermal aspects (low speed). The studied aircraft is an experimental one where a dedicated turboshaft is placed inside the cabin to generate electricity for the EDP on one wing. A fully turbo-electric system is assumed without the presence of batteries. The system contributors are the fan blades, fan disk, nacelle, electric motor, inverter, turboshaft engine, generator, rectifier, and the thermal management system. The weight of the fan blades, fan disk, and the nacelle were calculated based on the methodology given by Lollis. 28 It was found that these are direct functions of the rotational speed. The turboshaft engine weight and the power specific fuel consumption were taken from Snyder and Tong. 29 These values are given as a function of the power and are populated from the turboshaft engines in literature. Without loss of generality, the power density of the generator is taken as 6 kW/kg, the power density of the inverter is taken as 13 kW/kg, the power density of the rectifier is taken as 13 kW/kg and the power density of the thermal management system is taken as 0.68 kW/kg based on the study by Jansen et. al. 30 In Figure 13, the overall system weight is plotted including the fuel burnt by the dedicated turboshaft to power the electric propulsor for a 1 h flight.
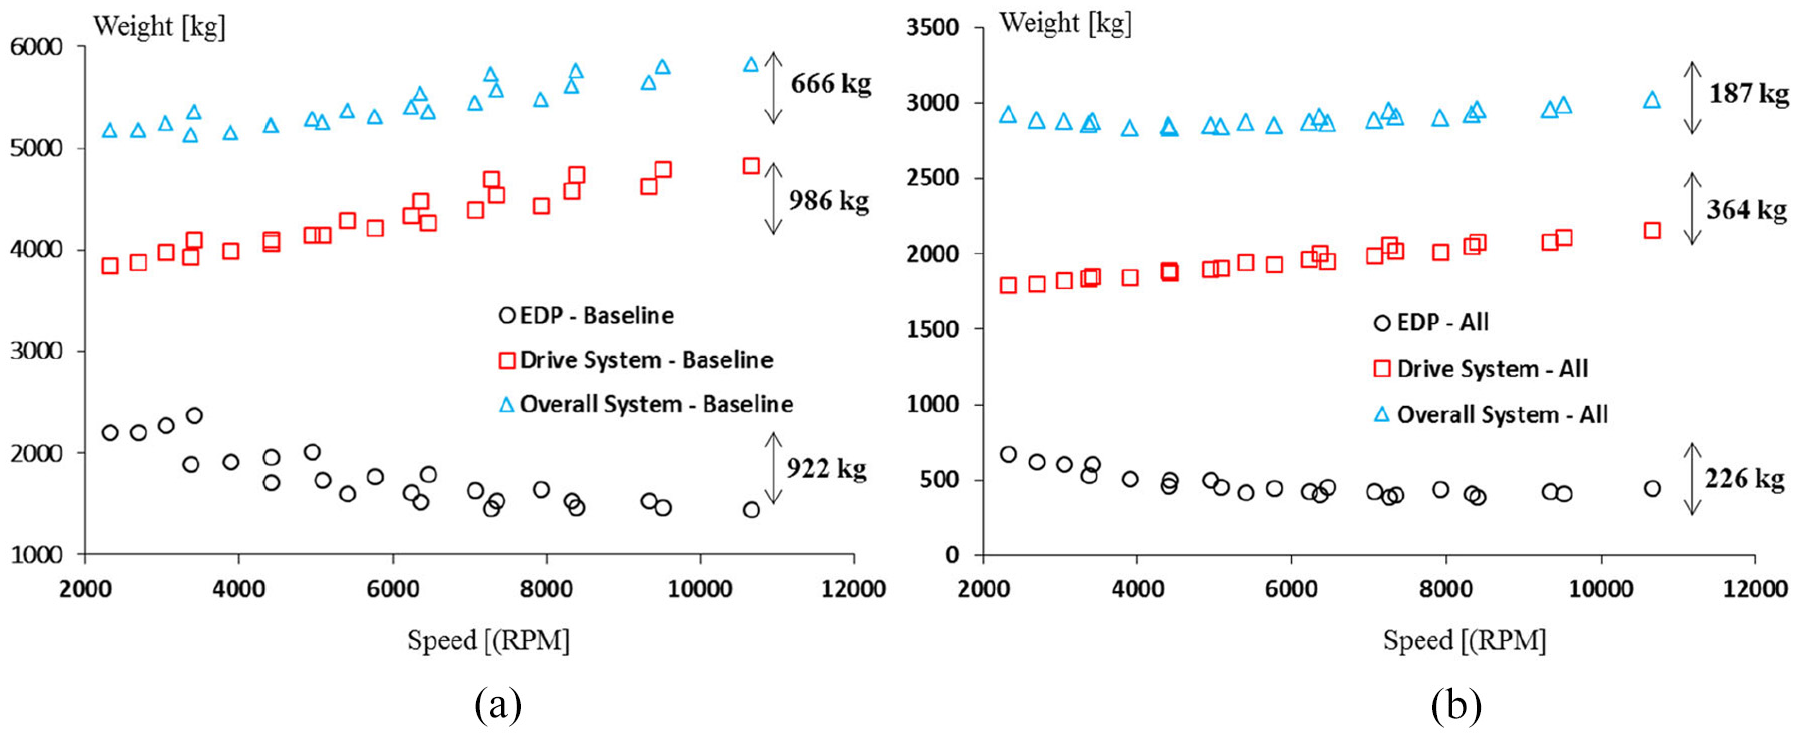
System weight: (a) Baseline design space, (b) All factors included.
System weight is compared in Figure 13(a) and (b) respectively for the baseline design space and the updated design space as described in Section 3. The EDP weight corresponds to the motor, fan and the nacelle. The drive system includes the dedicated turboshaft, inverter, rectifier, thermal management system and the fuel burnt by the turboshaft during a 1 h flight. In the baseline design space there is a 922 kg variation. More importantly, it is seen that the drive system puts much significant weight than the EDP and this weight is directly power dependent. There is a variation of 986 kg in the design space but the drive system add about 4 tons for a single propulsor. Therefore, there is a need for reduction in the power as described in Section 3. When the weight of the EDP and the drive system are superimposed, the overall system weight is obtained. The variation in the design space is 666 kg and the minimum sits around 4000 rpm which corresponds to the 1.35 fan pressure ratio. Considering the intense cooling requirement of the motors driving large fans with high diameter, fan pressure ration in the range of 1.25–1.30, the recommendation is to select an EDP in the fan pressure ratio range of 1.35. After the changes of Section 3 are applied, there is a reduction of 2.5 tons is obtained. The variations in the design space are lower but the minimum still sits around 4000–4500 rpm range corresponding to the fan pressure ratio around 1.35 which is the key conclusion of the overall system assessment.
Conclusions
The scope of this manuscript was to identify the key relationships among a ducted fan and a driving electric motor. Based on the physical and thermodynamic interfaces between the fan and the electric motor, an initial electric design space indicated that the machine weights are far larger when compared to the replaced gas turbine. Three case studies were carried to reduce the machine weight. The first approach involved modifying the climb schedule to avoid torque and power overshoots. This approach is a compromise in the aircraft performance but captures the differences between an electric motor and an air breathing gas turbine core. The lift-to-drag ratio of the studied aircraft platform is 14 and it is believed that a newly designed integrated aircraft featuring lift-to-drag ratios around 18 would bring back the reduced aircraft performance.
The second approach towards decreasing the machine weight was to increase the rated frequency of the motor. This approach is a sacrifice in motor efficiency resulting in an increase in cooling system capacity. The third approach was based on increasing the current density. It was observed that this method is not as drastic as the rated frequency increase method and seems to be a viable option in terms of efficiency. Following the three case studies, an overall system performance was investigated. The major parameter of the system is the power which dominates the differences in the geometrical variations in the design space. This supports the efforts to eliminate the power overshoots and sizing the electric propulsor for altitude conditions instead of take-off.
A battery system was not included to avoid a new design space for hybrid power management. Due to their relatively low energy densities, inclusion of the batteries are expected the penalise the high power parts of the design space (high pressure ratio compact fans). But even in the current turbo-electric case without including them, the high power parts still perform worse in terms of overall system weight. Therefore, the current observations can be expanded to a hybrid system as well.
A fan pressure ratio giving the lowest system weight was observed around 1.35. The system weight decreases with the power but at very low powers (low fan pressure ratio), the power is dominated by torque instead of the speed. Therefore, the system weight starts to increase after a certain point. These low power regions fit better for geared applications.
Footnotes
Appendix
Declaration of conflicting interests
The author(s) declared no potential conflicts of interest with respect to the research, authorship, and/or publication of this article.
Funding
The author(s) disclosed receipt of the following financial support for the research, authorship, and/or publication of this article: The authors would like to express their gratitude to Rolls-Royce plc for supporting this research and permission to publish the paper.