
Abstract
The matching of the turbocharging system with a marine engine is an essential undertaking due to the turbocharger effects on the engine performance, emissions and response, whilst the limited data availability during the ship design phase renders it challenging. This study aims at developing a novel methodology for the matching of a single turbocharger and multiple turbochargers connected in parallel with marine engines. This methodology employs a compressor parametric modelling tool and a zero-dimensional engine model, whilst taking into account the engine operational profile and the turbocharger components flow limitations. The compressor parametric tool is used for the generation of a database with compressor families that can be investigated during the matching procedure. The model of one engine cylinder block is used for mapping the engine performance parameters at a wide engine operating envelope by developing response surfaces. The developed methodology is implemented for the case study of the turbocharger matching with the propulsion engine of an Aframax tanker. The annual fuel consumption and the engine load diagram upper limit are employed as the main objectives for the selection the turbocharging system. The derived results demonstrate that the effective turbocharger matching results in reducing the engine brake specific fuel consumption up to 5%. The identified turbochargers led to the reduction of the ship annual fuel consumption in the range 1.3%–5.3% compared to the reference engine, whilst providing a more expanded load diagram. This study overcomes the limitations of the manual engine turbocharger–matching process providing decision support on the effective turbocharger matching to satisfy contradictory objectives.
Keywords
Introduction
Background
Although new technologies and alternative fuels have been developed to improve the energy efficiency and the carbon environmental footprint of shipping operations, 1 the marine Diesel engines are still considered the main option for powering ocean going vessels. Several improvements have been proposed to increase the energy efficiency of the large marine engines 2 including high temperature materials, 3 exploitation of the exhaust gas waste heat, 4 and the improvement of the engine thermodynamic cycle. 5 However, the turbocharging system is considered crucial, as it results in increased engine power with improved fuel economy, relatively low cost, 6 and acceptable complexity.
Due to the marine engine large size and high cost, the engine–turbocharger matching is a demanding process that needs to be performed at an early stage of the vessel design phase, where the engine performance experimental verification is not feasible and available data for the turbocharging system is limited. Hence, modelling methods of varying complexity have typically been employed the turbocharger selection and its matching with the engine. Pertinent studies were mostly focused on automotive applications, 7 where the engine operation typically includes dynamic (transient) conditions. For marine engines, the main objective of the matching procedure is to provide the required engine air flow rate at the whole engine operating envelope whilst maintaining sufficient compressor surge margin.
Engine−turbocharger matching studies review
The engine−turbocharger matching can be a lengthy process for a new marine engine, due to the large number of the involved parameters, 8 which affects the engine transient response, especially at low loads operation, due to the turbocharging system lag. Alternative configurations were proposed for improving the engine performance and transient response including the sequential turbocharging, 9 the two-stage10,11 turbocharging, the variable geometry turbine turbocharger, 12 the turbocharger cut-out (in cases with multiple turbochargers connected in parallel),13,14 and the hybrid turbocharger.15,16 Nonetheless, the single and parallel turbocharging systems are preferred for most of the marine engines, as they constitute solutions of lower complexity, thus imposing less challenges for their installation, control and maintenance.
The turbocharging system matching is typically carried out by a trial process where the investigated engine performance is evaluated by considering different turbocharging systems. The first efforts to describe the methodology to match a turbocharging system to a Diesel engine were reported in Meier. 17 Based on this methodology, the matching of the turbocharging system was further discussed by Watson and Janota 8 with focus on marine applications and their main challenges. This methodology was based on the correlation of the engine load with the available turbocharger turbine torque taking into account the engine speed and the exhaust gas properties (thermodynamic and physical). Assanis et al. 18 presented a similar procedure to match the turbocharging and turbo-compounded systems of heavy-duty Diesel engines, employing engine thermodynamic models for representing the engine and its components. The performance parameters of the compressor and turbine were estimated for each engine operating point by using the working media states (pressure and temperature upstream and downstream these components) and the turbocharger speed.
Nelson et al. 19 investigated the matching of fixed and variable geometry compressors with a small Diesel engine by employing neural networks to establish compressors families, adjusting the weighting parameters that affect the turbocharger speed, efficiency and volumetric flow rate (VFR) as functions of pressure ratio (PR). Further studies on automotive engine−turbocharger matching are reported in Pesiridis et al. 20 and Tancrez et al. 21 by employing available turbine maps. Similar methodologies were presented for the matching automotive engines with two-stage turbocharging systems.22–24 Yang et al. 25 investigated the matching of electric compound turbocharger with a marine two-stroke diesel engine realising the turbocharger components parametrisation by using scaling factors. The main limitation of preceding studies is that the complete design envelope cannot be covered, thus leading to sub-optimal engine–turbocharger matching.
Modelling studies review
The prediction of the compressor and turbine maps are important for the engine−turbocharger matching. The models employed for the turbocharger components performance estimation can be classified into the following two types: data-driven and physical (or first-principles) models. 8 The physical models are further classified according to the considered spatial dimensions. The physical models offer a more detailed and mathematically rigorous approach for representing the compressor operation, at the expense of increasing the simulation computational cost. On the contrary, the data-driven models allow for a fast estimation of the compressor map operating point.
The compressor design optimisation was investigated in Galindo et al. 26 employing computational fluid dynamics and aided design tools. Less computationally demanding methods that take into account the mass, momentum and energy conversation equation27,28 or only the mass average flow and losses along the flow path considering semi-empirical correlation models for the flow losses through the rotor were presented.29–31 A review of the available physical models for representing the radial turbines performance was presented in Serrano et al. 32 The coupling of a one-dimensional (1-D) model for both compressor and turbine components with a marine Diesel engine simulation model was proposed in Sakellaridis et al. 33
The simplest data-driven modelling approach is based on look-up tables along with the application of interpolation and extrapolation techniques. This approach requires available data sources and provides low parameterisation of the compressor map. Modelling approaches based on polynomial functions and geometric models can more effectively represent the compressor map. An initial model to describe the compressor characteristics was reported in Emmons et al. 34 An extension of this model is presented in Greitzer 35 for axial compressors by using a non-linear parametric tool. Hansen et al. 36 proved that this model can be applied also for small centrifugal compressors. Moore and Greitzer 37 proposed single cubic polynomial equations to describe the entire compressor map and provided their experimental verification. Several alternative approaches with increased parameterisation were subsequently proposed for the analysis and control of compressors aerodynamic instabilities.38,39 The elliptic model was proposed for the compressor map description,40–42 which considers the boundaries of the compressor steady state map and employs elliptic curves to represent the constant speed curves. The compressor maps description can be further improved by using monotonic piecewise cubic interpolation algorithms instead of elliptic curves43,44,45 at the expense of increasing the number of the required parameters, thus reducing the model parameterisation flexibility.
Generally, the data-driven models are considered more effective in terms of simulation time and computational cost, whilst providing a sufficient representation of the compressor, thus supporting the accurate modelling of the propulsion system performance during off-design operation. 46 However, there are several limitations on the development of a generalised parameterisation method for capturing the overall envelope of the compressor map. Leufven and Eriksson 47 developed a method for the geometric representation of the compressor map that was initially tested for automotive applications, and later for marine applications. 48 Although various models were developed based on experimental data, a large number of parameters are required for the sufficient approximation or even the development of the overall compressor map area, thus limiting the usage of these models.
The selection of the appropriate engine simulation model is also important for the matching of the engine with its turbocharging system during the ship design phase. A detailed classification of the models employed for the compression ignition engines was reported in Stiech. 49 The thermodynamic models classification depends on the spatial dimensions that are used to describe the engine components processes, as well as the number of zones that are employed to represent the in-cylinder processes. Cycle mean value models as well as data-driven models and response surfaces have been employed to predict the engine operation with a low computational cost. Although the mean value engine models provide a compromise between the computational cost and the accuracy on the prediction of the engine performance, 50 they still require additional experimental data for their set up, especially when the engine operate with varying settings. 51
Literature review findings
The preceding literature review reveals the following research gaps:
There exists a limited number of methods to facilitate the matching the turbocharging system with a marine engine during the ship design phase, supporting the designer to identify alternative options.
The lack of connection between compressor/turbine parametric models and the engine model was identified with the main challenges being the large number of parameters required to set up the models as well as the needed interfaces to facilitate the engine-compressor-turbine models integration.
The compressor map parameterisation is primarily used for the interpolation and extrapolation of the available experimental data with limited applicability to the engine−turbocharger matching procedure.
The engine−turbocharger matching is typically carried out for the engine design conditions without considering the actual operating profile.
The typical approach employed for the engine-turbocharger matching is based on the individual selection of the compressor and turbine considering the engine design requirements, and the use of an iterative process to estimate the engine performance parameters.
Research aim
This study aims at developing a novel objective-oriented methodology for the selection and matching of the turbocharger with large two-stroke marine Diesel engines, whilst considering the boundaries of the various engine components. This methodology employs a generalised parametric compressor model to develop compressor map families, and an engine cylinder block thermodynamic model of the zero-dimensional type to predict the investigated marine two-stroke diesel engine performance parameters. The engine model results are used to develop the engine performance parameters response surfaces, which are subsequently used to retain a reasonable computational time of the matching procedure. The case study of an Aframax tanker propulsion engine is used for testing the developed methodology and the derived results are compared with the performance parameters of the investigated ship engine.
The original contributions of this study include the following: (a) a novel methodology is developed for the matching of a two-stroke Diesel engine with a single or/and a connected in parallel turbocharging system with special focus on marine applications; (b) the development of a generalised parametric model that describes a reference compressor map and generates compressor maps families using a limited number of parameters; (c) the investigation of the alternative turbocharging systems that can match to a marine engine as well as their effect in the engine performance, and; (d) the selection of the turbocharging system for a vessel’s propulsion engine taking into account the engine actual operating profile and considering the objectives of improving the ship energy efficiency as well as extending the engine load diagram.
The remaining of this article is structured as follows. The proposed methodology overview is provided in Section 2. Section 3 describes the developed engine thermodynamic model and the compressor parametrisation tool. Section 4 provides the description of the developed methodology steps. Section 5 describes the application case study along with the derived results and discussion. The main findings and conclusions of this study are summarised in Section 6.
Methodology overview
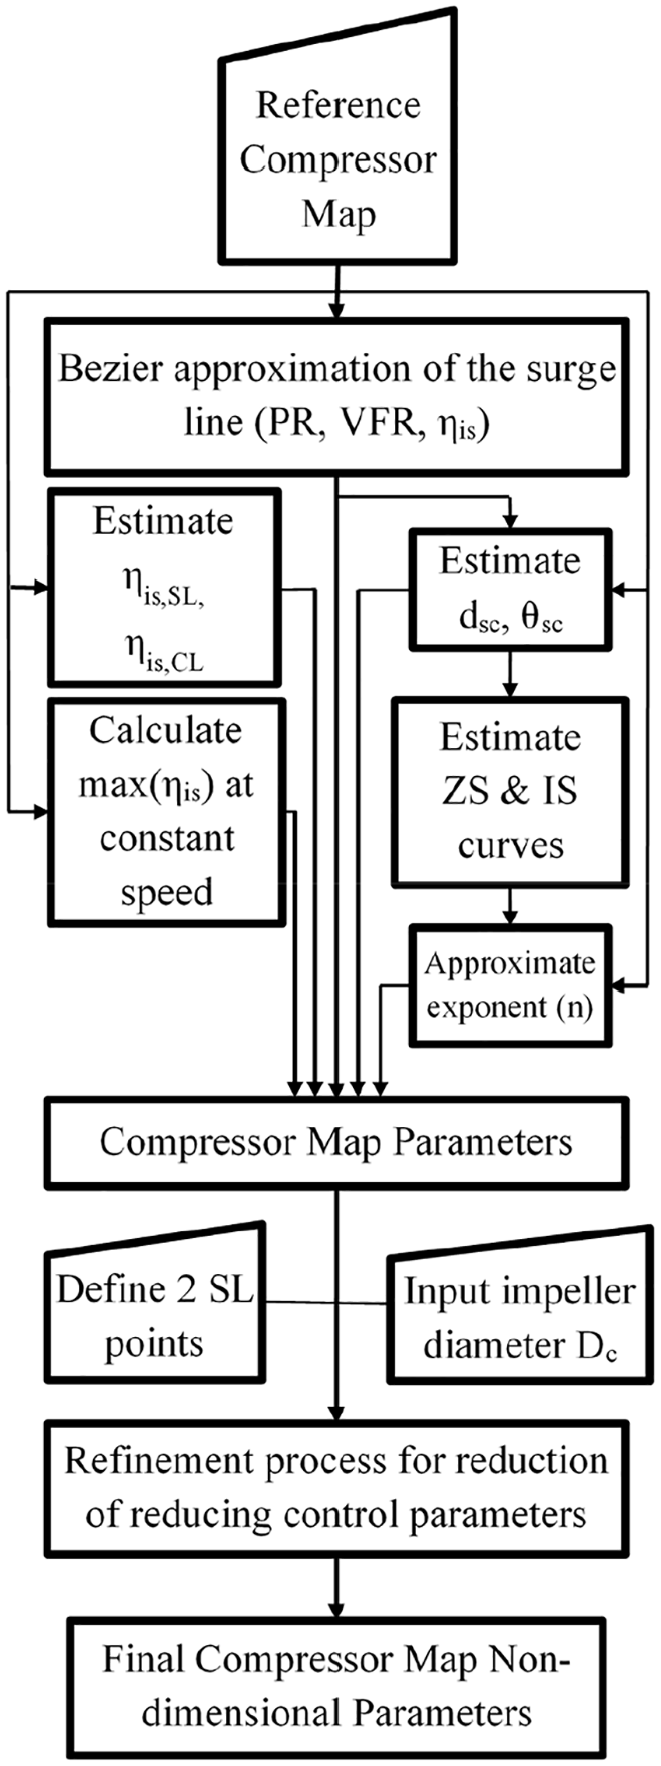
The overall matching procedure, which is described in more detail to the next section, consists of the following three phases: (a) engine performance parameters and compressor maps database development; (b) compressors–engine matching check, and; (c) turbocharger (TC) selection. Each phase includes several steps, which are shown in the flowchart presented in Figure 1. It must be noted that this study considers marine two-stroke engines and turbochargers with centrifugal compressors and axial flow turbines.
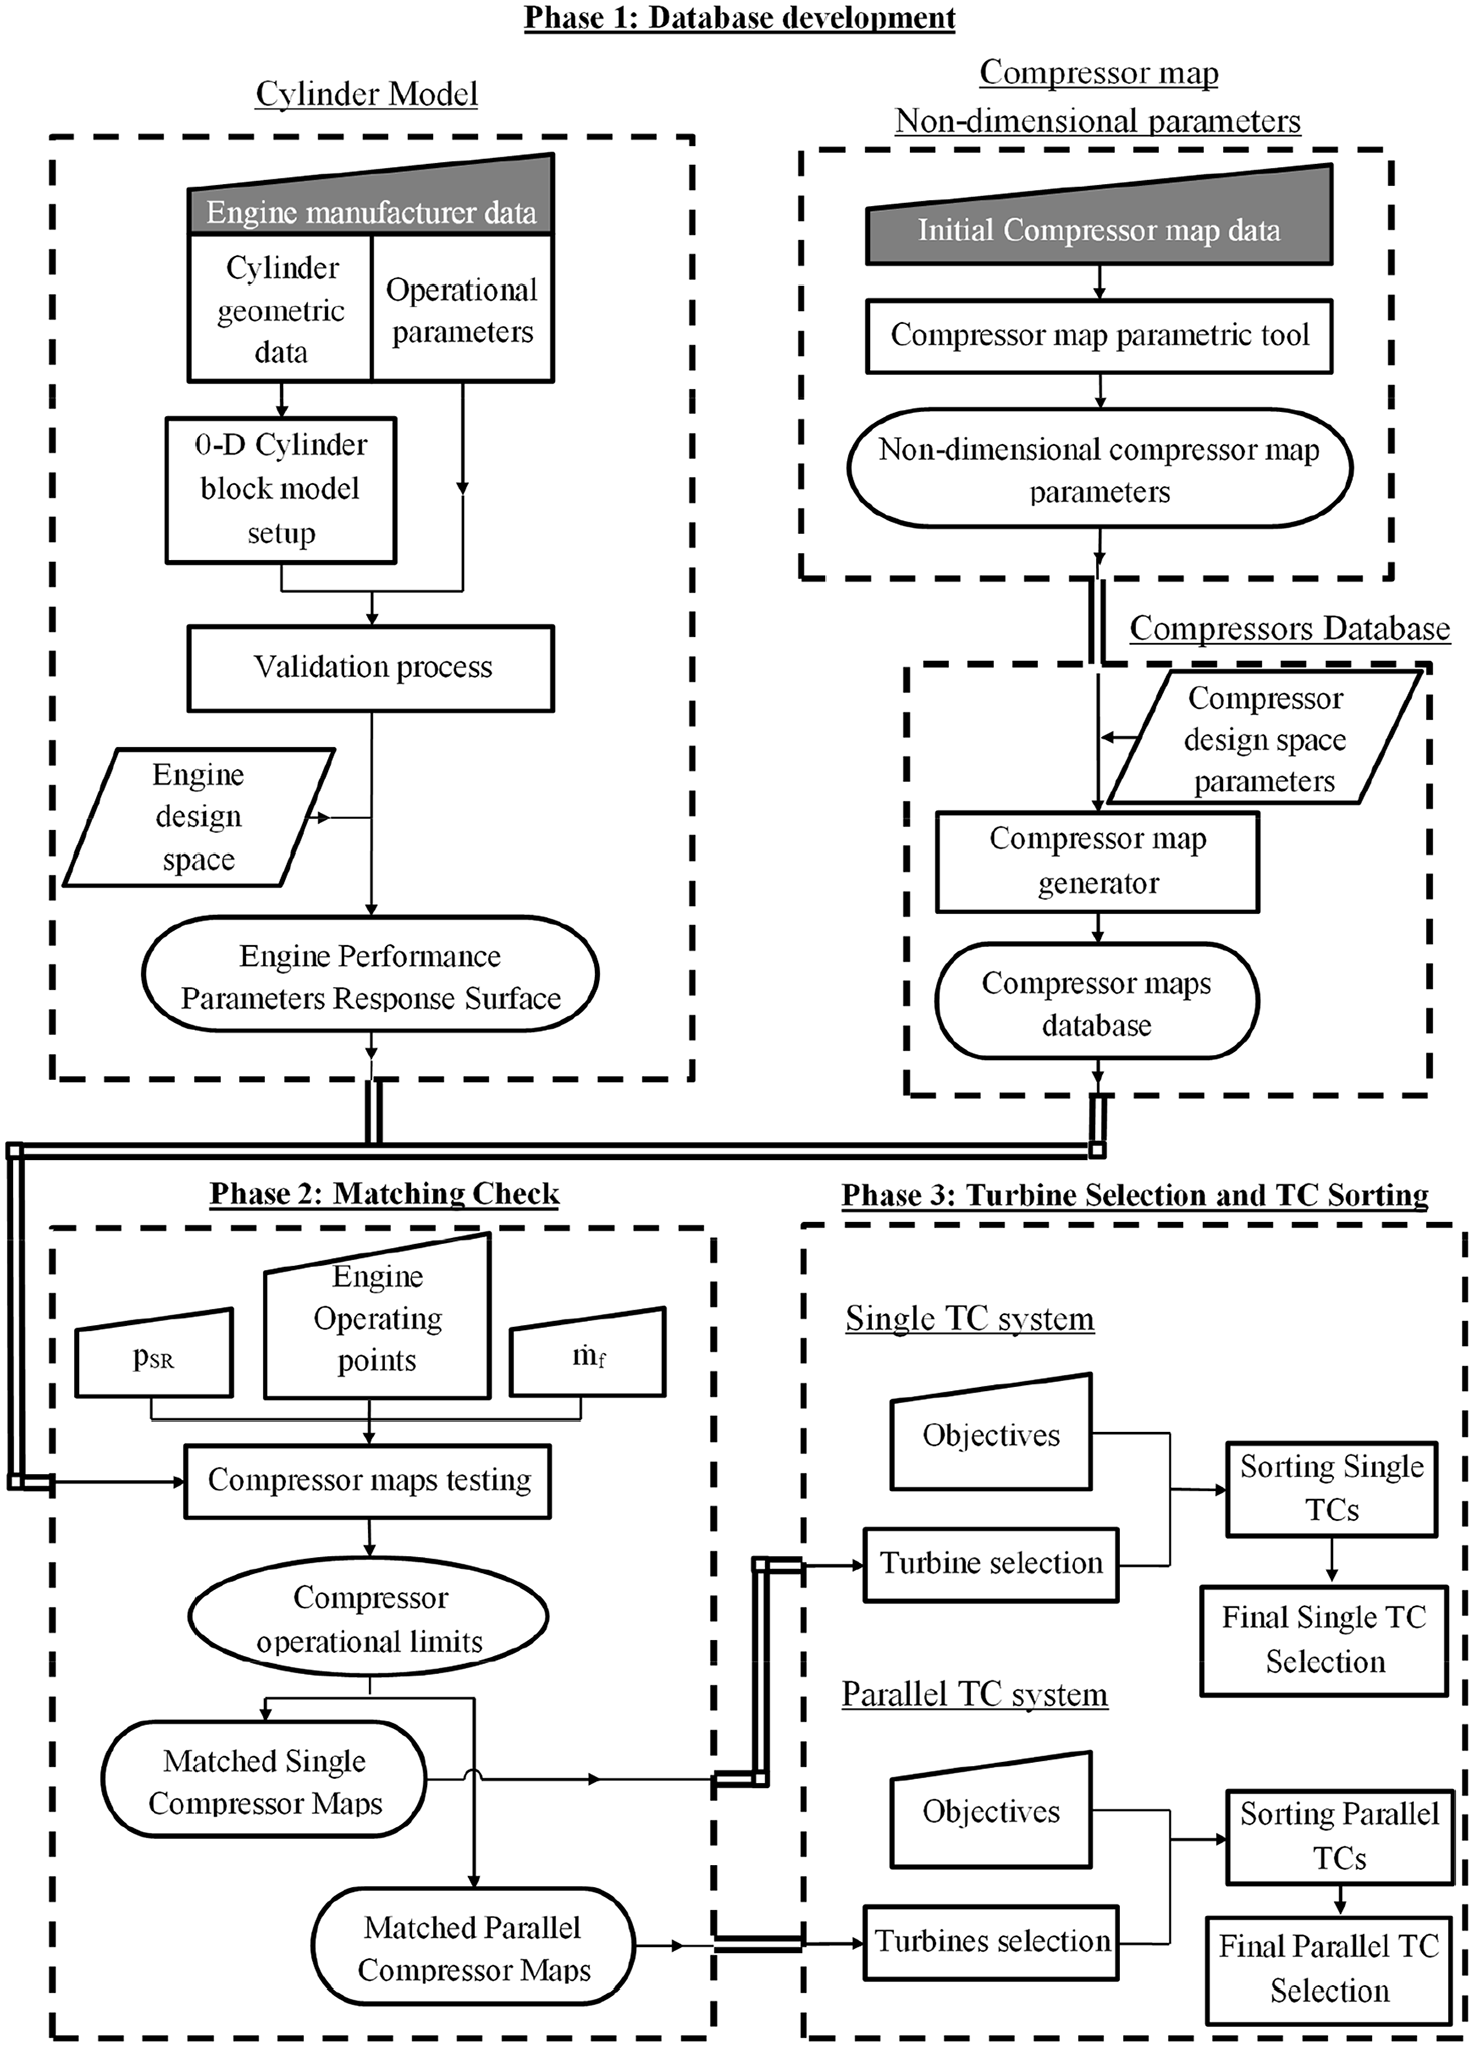
Flowchart of the developed procedure for the single and parallel turbocharger–marine engine matching.
In the first phase, the required information for the matching procedure is derived. This includes: (a) the engine performance parameters response surfaces derived by using the zero-dimensional (0-D) cylinder model; (b) the compressor maps database developed by using the compressor map parametric tool. The methodology allows for the replacement the employed tools with another physical model or database. However, the tools that are developed and used in this methodology are selected considering the limited data availability for the engine−turbocharger matching during the ship design phase.
Focusing on the investigated marine engine and potential turbocharger compressors, the first phase includes the development of the response surfaces that correlate the engine brake power, the exhaust gas temperature and the air mass flow rate as functions of the engine speed, scavenging pressure and fuel mass flow rate. It additionally includes the generation of compressor map families. It must be noted that the compressor is analysed in this phase due to its importance for the delivery of the engine required air amount at the specified pressure, which affects the fuel amount that can be burnt within the engine cylinders, which, in turn, affects the engine performance parameters as well as the engine thermal and mechanical loading.
The non-dimensional parameters required to generate the compressor maps database can be derived by using an existing compressor map (reference map), which is provided as input in a non-dimensional digital format. Those parameters can be estimated using the developed compressor parametric tool, which is able to parameterise any compressor map using a two-step approach. The first step focuses on the identification of the parameters that describe the overall area of the compressor map, taking into consideration the map constant speed curves and the compressor geometric characteristics. In the second step, these parameters are converted to non-dimensional parameters using as control points two points of the surge line of the reference compressor map. Based on this approach, the compressor is described by two different sets of parameters. The database of the new compressor map families can be produced either by changing the compressor geometric characteristics and the desired position of the surge limits, or by modifying both the derived parameters for the reference compressor map.
The second phase of the methodology includes the compressor matching check. Each individual compressor (or pair of compressors) is tested against the engine performance for identifying the compressors (of a single turbocharger or connected in parallel turbochargers) that can match the investigated engine. In this step, both the engine operating profile and the imposed engine operating constraints are considered, which may depend on the specific application. By employing selected criteria, the compressor maps number is reduced and the compressor maps that can potentially match the investigated engine are identified. For the case of the parallel turbocharging system, this step investigates the pairs of the compressors that allow for the operation of the engine at the given operational points.
The third phase of the matching methodology includes the investigation of the turbine performance curves that are suitable to the matched compressor–engine system. When the turbine curves are estimated for each turbocharging system, the final turbocharging system can be selected, taking into consideration several objectives defined from the designer. These objectives may focus on the most efficient operation of the marine engine, given the engine operating profile, or on the selection of the turbocharging system that will allow higher engine load at lower speeds. The final selection of the turbocharging system is performed by using a sorting procedure, which ranks the performance of the alternative solutions against the selected objectives defined by the designer/user. In this study, the sorting procedure is performed using a single objective for the selection of the most suitable solution for the investigated engine.
Models and tools description
Considering that the matching takes place at the initial design phase, the prediction of the engine performance and response as well as the generation of different compressor maps families are addressed via the development of a zero-dimensional (0-D) cylinder model and a compressor parametric tool, respectively. These are described in the subsequent sections.
Zero-dimensional cylinder model description
Due to the limited data availability during the engine−turbocharger matching, a physical model of the zero-dimensional (0-D) type is developed to represent the engine performance. One engine cylinder block (including the cylinder scavenging ports and the exhaust valve) is modelled to keep the model complexity at a manageable level and avoid increased computational effort, also considering that information for the engine turbocharging system is typically not readily available at the engine–turbocharger matching phase. The turbocharging system is substituted with boundary conditions representing the pressure and temperature of the scavenge air and the exhaust gas receivers, whereas additional input parameters include the engine speed and the fuel mass flow rate. The model main output includes the cylinder air mass flow rate, brake power and the exhaust gas temperature (additional parameters can be obtained), which are employed to estimate the overall engine performance parameters at steady state conditions (considering the engine cylinders number).
This model employs either one zone (1-Z) or two zones (2-Z) to represent the various cycle phases as illustrated in the schematic of Figure 2. The former (1-Z) is used to model the compression process (till the start of combustion), whereas the latter (2-Z) is employed to model the combustion and expansion considering an unburnt gas zone and a burnt gas zone. At the exhaust valve opening, the two zones are mixed to form a single zone, which models the exhaust blowdown process. The scavenging process (from the scavenging ports open to close) is modelled by using a two-zone approach considering a fresh air zone and a mixing gas zone. The approach introduced in Nilsson 52 is followed to facilitate the zones management. The ideal gas law along with the mass and energy conversation equations are used for each individual zone, thus enabling the calculation of the working media mass, pressure, temperature and composition.
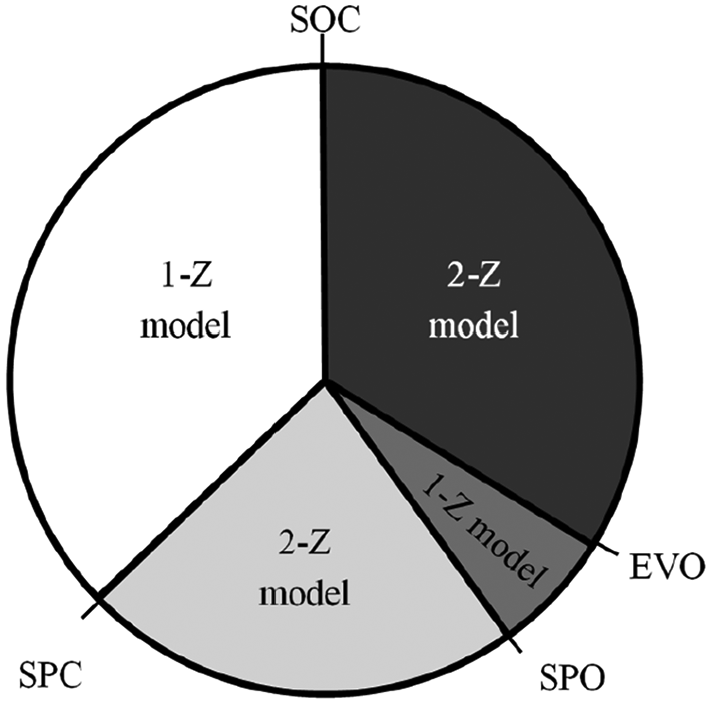
Number of zones employed by the 0-D model for the cylinder cycle various phases.
The combustion is modelled by the Woschni-Anisits model 53 based on a single Wiebe function, which sufficiently represents the combustion in diesel engines.54,55 This model is calibrated in one reference engine operating point and provides sufficient accuracy in a wide engine operating envelope. The combustion start is estimated by using the start of injection (provided as input) and the ignition delay, calculated by employing the Sitkei equation as function of the cylinder pressure, air equivalence ratio and engine speed. 53 The kinetic energy of the injected fuel into the cylinder is estimated based on the Bernoulli equation 56 and the fuel density. The model considers the dissociation effects in the burnt zone by employing a simple kinetic mechanism of 11 species 57 to calculate the species concentration. The working media (air/gas) properties are calculated by using the species mass fractions and thermodynamic properties (specific enthalpy and thermal capacity), which are estimated by the NIST-JANAF Thermochemical tables. 58 The convective heat transfer coefficient is estimated by using the Woschni equation, 53 whereas the heat losses to the various parts of the cylinder walls are calculated considering the respective surfaces temperatures. For the two zones approach, the heat losses are distributed to each zone by considering the respective mass.
The mass flow rates of the exhaust valve and the scavenging ports are calculated by using the orifice pseudo one-dimensional approach 53 as a function of the pressure ratio, the working medium properties upstream the aperture and the effective area, whilst accounting for subsonic or sonic flow conditions. After testing various forms, equation (1) was found sufficient to represent the scavenging ports and exhaust gas valves effective area profiles.
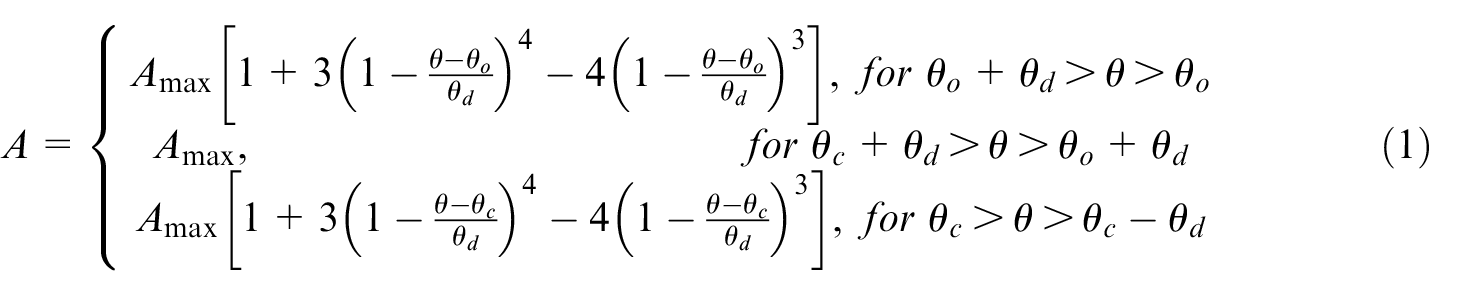
where θo denotes the valve/ports opening timing; θc denotes the valve/ports closing timing, and; θd corresponds to the duration of valve/port opening or closing (it is assumed that the aperture opening and closing durations are the same). When the fuel mass injection profile is unknown, equation (1) can be used to estimate the injected mass fuel flow rate profile providing as input the maximum fuel injected mass flow rate and the injection duration.
The scavenging process is modelled by employing the two-zone model (air zone and exhaust gas zone) reported in Guan et al. 14 A new air zone is formed after the scavenging ports opening, whereas the scavenging model parameter is employed to calculate the mass flow rate from the air to the exhaust gas zones. This parameter is approximated by a sigmoid function that describes its variation between its maximum and minimum values (exhibited at the lowest and highest engine speeds, respectively).
To handle the computational error 52 during a new zone formation in the closed cycle, the adiabatic temperature is used at the first step after the zone formation (the burnt zone volume is zero). When the burnt zone mass exceeds a predetermined limit, the burnt zone temperature is estimated by using the energy conversation equation. A similar approach is followed in the two-zone modelling of the scavenging process, where the initial value of the (newly formed) fresh air zone temperature is assumed equal to the scavenging air receiver temperature. The cylinder model initial conditions are estimated from the provided boundary conditions. The developed model employs the improved Euler numerical scheme using a step of less than 0.5° crank angle (CA). The solution convergence is controlled by considering appropriate criteria.
Compressor map parametric tool
Following a thorough evaluation of the existing models in the pertinent literature37,40,43,48 considering the compressors of the centrifugal type employed in marine two-stroke engines, it was deduced that the Moore-Greitzer’s equation (which employs a limited number of parameters), provides adequate representation of the constant speed curves at the medium speed range and a fair approximation of the compressor operation beyond the surge limit; however it underperforms at the low and very high turbocharger rotational speed ranges. The cubic splines provide a sufficient representation of the speed lines curvature, at the expense of using an increased parameters number. The conic section polynomial equation yields a sufficient estimation of the constant speed curves but requires an accurate estimation of their section boundaries. The most common conic section equation is the elliptic curve equation 47 represented by equation (2) with the exponent (x) taking values different than 2.

Considering the advantages of the evaluated models, the developed parametrisation tool employs the elliptic curve equation for estimating the constant speed curves, as well as cubic splines for predicting the compressor map surge and choke limits with adequate accuracy. This tool parametrises an existing (or reference) compressor map by using two sets of parameters (dimensional and non-dimensional); the former represents the impeller diameter and the surge line position, whereas the latter represents the shape and the range of the speed curves. This allows for the effective control and parametrisation of a compressor map as well as the development of different families of compressor maps using as baseline the reference compressor map.
The description of an elliptic curve requires the estimation of its small and large axes lengths. Referring to the schematic shown in Figure 3, the elliptic curve section with the long axis coincides with the point where the slope of the constant turbocharger speed curve is zero (ZS). This point is usually close to the surge line (SL) point, where the maximum PR for the given speed curve is exhibited. The section with the small axis is located at the point where the curve slope is infimum (IS). The IS point is located close to the choking limit (CL) point, where the maximum VFR for a given speed curve is exhibited. As the compressor maps boundaries do not coincide with the maximum PR and VFR lines, the developed tool integrates a predictive model for the constant speed curve gradient to identify the IS and ZS points at each speed curve.
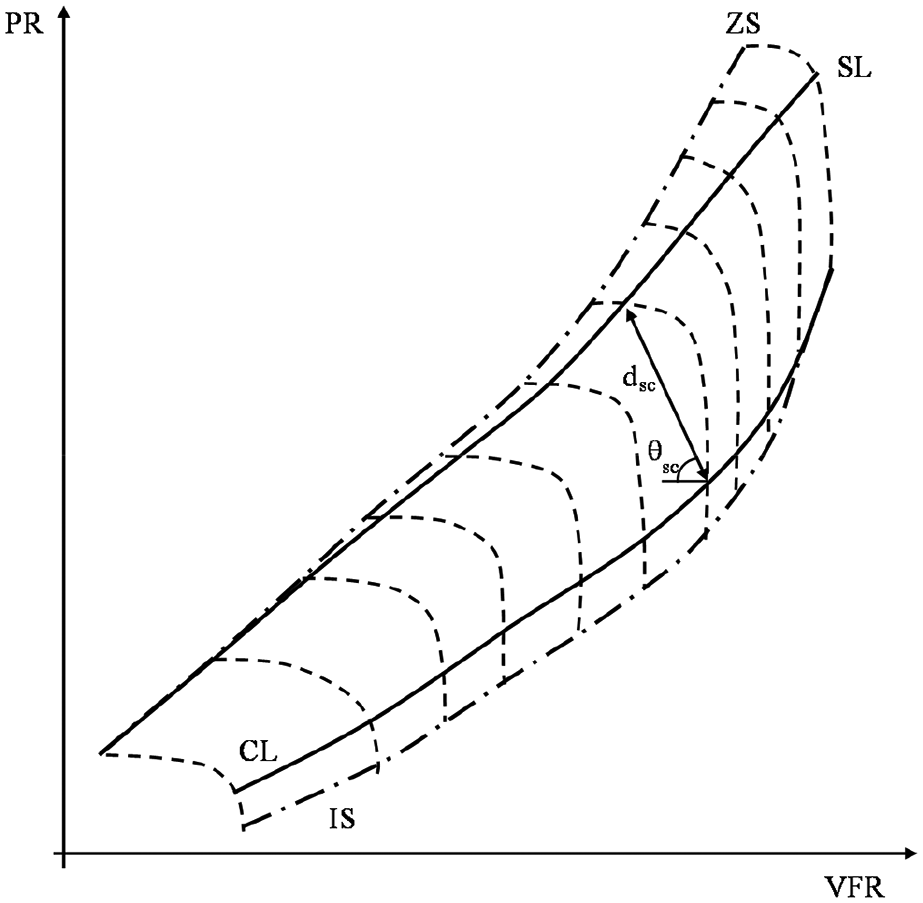
Identification of the surge (SL), choke (CL), zero (ZS) and infimum slope (IS) lines of a compressor map.
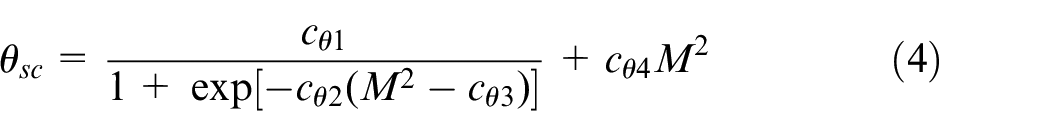
A fifth order Bezier-Bernstein polynomial 59 is employed to represent the surge and choke lines, which provides a compromise between the required parameters number and the obtained accuracy. The first control point of the Bezier curve is located at zero VFR, assuming that there is no volumetric flow rate or pressure increase when the turbocharger rotational speed is zero. To estimate the choke line, its relative location from the surge line is considered. Each constant speed curve is described by one point of the SL and one point of the CL. The relevant position of these points is defined using the relative distance (dsc) and angle (θsc) as shown in Figure 3. Using the Mach number (M) at the compressor impeller tip 45 as independent variable, the following equations corresponding to a polynomial function and a logistic function are employed to calculate the relative distance and angle, respectively:

Although the parameters of equations (3) and (4) are calculated according to the given points of the SL and CL of the reference map, the ZS and IS points coordinates are estimated based on the best fitting of the elliptic curves to the reference compressor map data points. For reducing the uncertainty of the model on predicting both the exponent and the ZS and IS points of each elliptical curve, an investigation study was performed testing several conic sections against marine compressor maps available in the literature. 60 The derived results indicated that the ZS points have approximately 10% less VFR and 1% higher PR than the SL points, whilst the PR of the IS points is lower than the provided CL points only at the medium and low speeds.
Following the correlation between the surge and the choke lines, the IS points are identified by applying a correction factor (cIS) to the estimated relative angle (θsc), using the following equations:


The correction factor of equations (5) and (6) is estimated as a function of the Mach number; its maximum value is 1 when the Mach number is over 0.9. This approach more effectively controls of the elliptic curves throughout the whole range of the compressor map. The conic section curve that describes the PR as a function of the VFR for a given turbocharger speeds is defined according to the following equation:
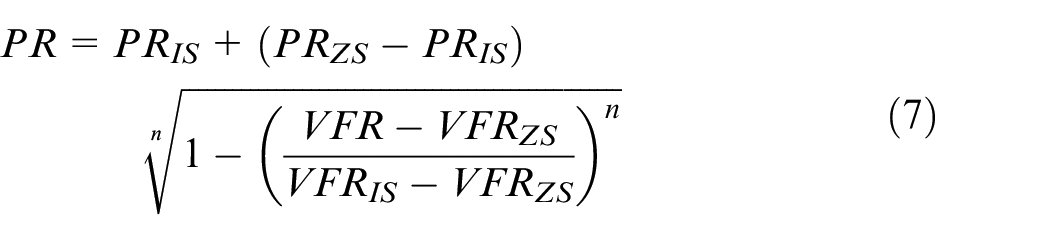
The least square method is employed for the identification of the exponent n in equation (7), taking into account the estimated coordinates (VFR and PR) of the IS and ZS points of the reference compressor map; this exponent is correlated with the Mach number by using a second order Fourier series. Although this approximation increases the required parameters number, it is considered as the most appropriate method to simulate the curvature of the constant speed lines due to their considerable slope variation when the Mach number increases.
To parameterise the reference compressor map, the non-dimensional flow, isentropic head and torque coefficients as defined in Guan et al. 45 are employed. The non-dimensional torque coefficient is correlated linearly with the non-dimensional flow coefficient, 45 whereas the isentropic efficiency is expressed as a function of the VFR at each constant speed curve. The linear correlation parameters estimation between the non-dimensional torque and the flow coefficients is based on the isentropic efficiency values at the SL and CL points. The isentropic efficiency at the SL and the CL is approximated as a function of the Mach number by using a fifth order Bezier-Bernstein polynomial, which provides sufficient accuracy at low and medium turbocharger speeds, whereas greater errors are exhibited at high turbocharger speeds. To address this issue, the maximum isentropic efficiency correction proposed in Guan et al. 45 is incorporated in the developed tool. The maximum isentropic efficiency is estimated by using the following polynomial equation:

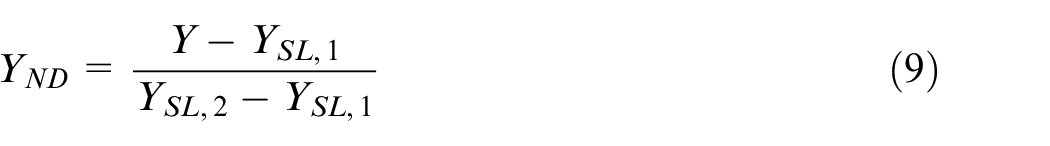
The computational process followed to estimate the reference compressor map parameters is presented in Figure 4. In total, 55 parameters are used. Based on their estimated values, the control parameters that correspond to the control points of the VFR, PR and ηis curves are refined. Two points of the surge line with high and low Mach numbers are selected, and the compressor volumetric flow rate, pressure ratio and isentropic efficiency are expressed by equation (9). Following several trials performed by the authors, it is recommended that the surge line points with the minimum and maximum speeds are selected, as this provided the best approximation of the surge line as well as the overall map, whereas such a selection facilitates the determination of three main limits of the compressor map (surge line, minimum and maximum speeds).
Flowchart of the compressor map parametrisation tool.
where Y represents VFR, PR or ηis.
Methodology main steps description
Engine performance parameters response surfaces generation
The process for developing the engine performance parameters response surfaces is described in the flowchart shown in Figure 5. To overcome the challenge of limited information availability in the ship design phase, the following considerations are made. The controlling variables of the engine parameters response surfaces are the fuel mass flow rate, the engine speed and the scavenge air receiver pressure and their design space is set up by considering reasonable ranges estimated by analysing the engine shop trials measurements from existing engines. The scavenge air receiver temperature as well as the exhaust receiver pressure and temperature are not considered as controlling parameters. The scavenge air receiver temperature can be adjusted by the appropriate selection of the air cooler. The exhaust gas receiver pressure is calculated from the scavenge air receiver pressure and the cylinders block pressure difference; the latter depends on the respective apertures profiles and pressure ratios (hence, the scavenge air receiver pressure). The exhaust gas temperature exiting the cylinder depends on the air equivalence ratio, the cylinder thermodynamic processes, the exhaust valve profile as well as the engine load and speed. The engine model output includes the engine performance and emissions parameters, the working media states as well as the mass flow rates through the scavenging ports and exhaust valve. Response surfaces are developed for the cylinder air mass flow rate, the indicated mean effective pressure as well as the exhaust gas temperature and composition as functions of the scavenge air receiver pressure, the fuel mass flow rate and the engine speed.
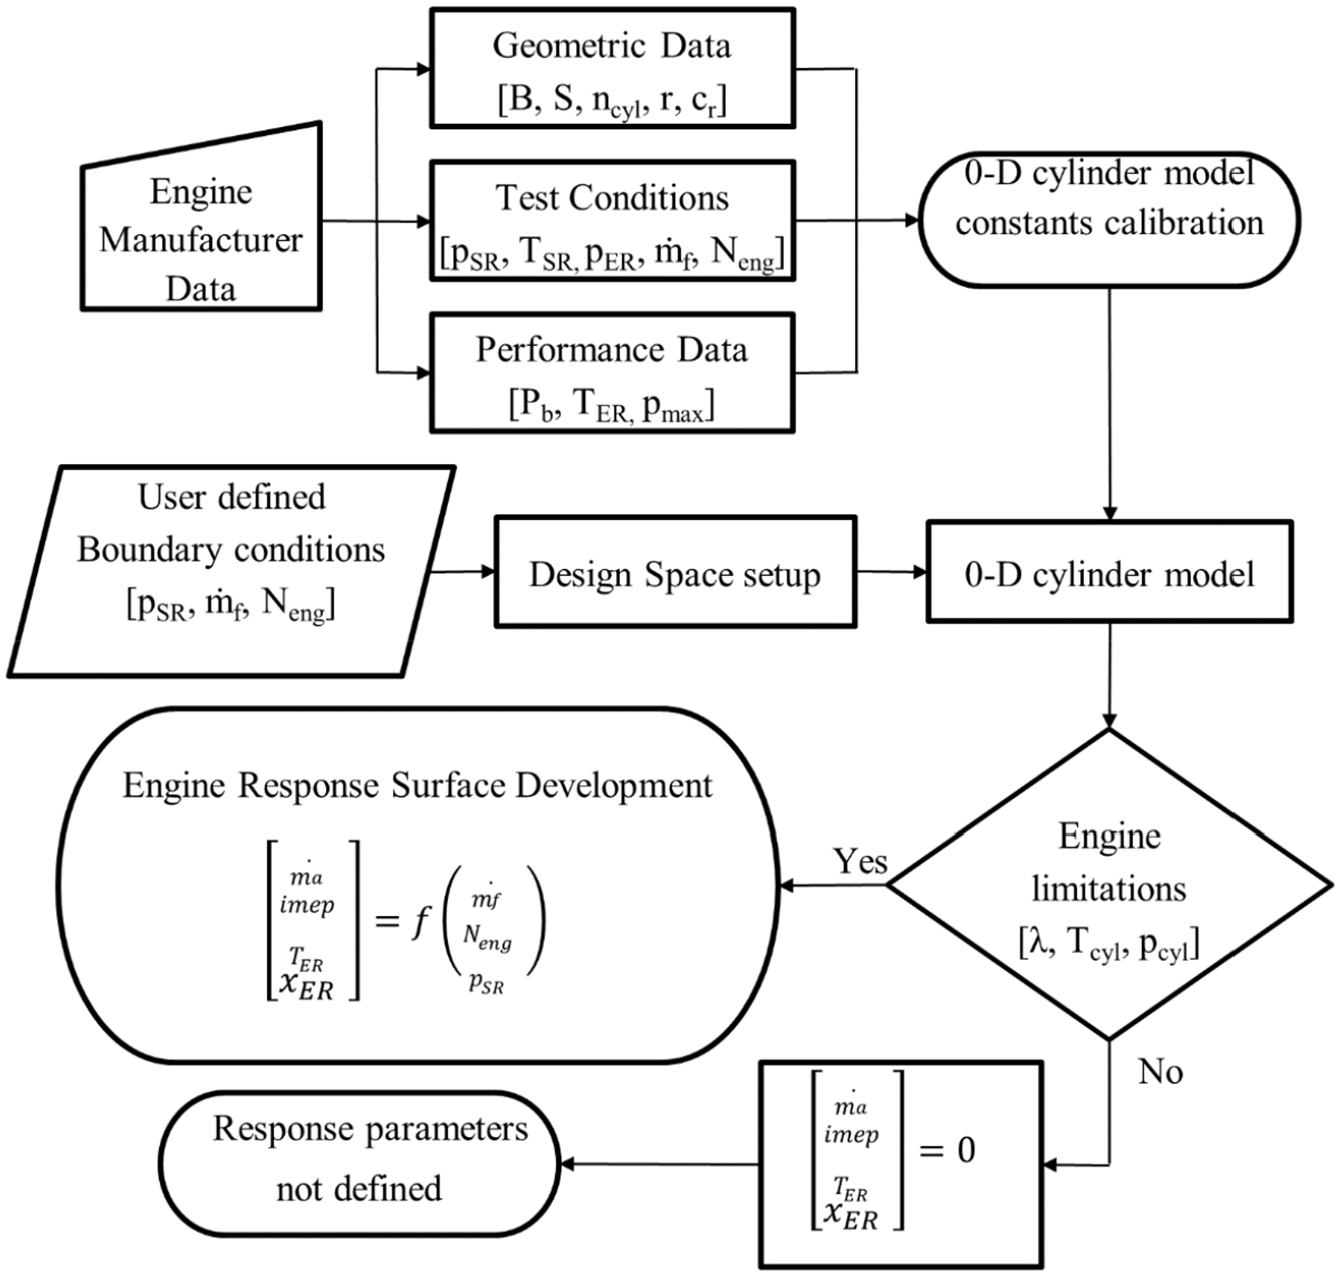
Flowchart of the engine performance parameters response surfaces development procedure.
The cylinder wall temperatures are considered constant in the whole engine operating envelope; however, different values are defined for the piston head, liner, exhaust gas valve and cylinder head. The scavenge air receiver temperature is provided as function of the scavenge air receiver pressure. For each triad of the controlling variables, the cylinder pressure drop is calculated as a quadratic function of the cylinder air mass flow rate (which, in turn, is a function of the apertures geometric area and pressure ratios). Subsequently, the exhaust gas receiver pressure is calculated by subtracting the cylinder pressure drop from the scavenge air receiver pressure. The engine cylinder block model employs an iterative process to provide a converged solution of the air mass flow rate (and thus, the exhaust gas receiver pressure).
The engine settings affecting the engine response and its matching with the turbocharging system are the exhaust valve and scavenging ports timings. The shape and the position of the scavenging ports are determined from the cylinder liner structure, whilst limitations exist for altering the scavenging ports design. Therefore, the scavenging ports timing is considered constant. Additionally, the exhaust valves timing is also assumed to be constant, considering that the main purpose of the proposed methodology is the turbocharging system selection for a given engine and not the optimisation of the engine cylinders design. The combustion model is calibrated for one reference point based on experimental results from shop trials for similar engines.
The engine limitations include the upper limit of the cylinder pressure and temperature as well as the lower limit of the air-fuel equivalence ratio. Following the engine model set up and calibration as well as the determination of the simulation design space, parametric simulation runs are carried out, and the derived results are employed to estimate the engine performance parameters response surfaces. The limits of the design space are defined considering the maximum engine speed limit and expected brake power, which are estimated by employing the published manufacturer data for the given engine geometric characteristics. The scavenge air pressure limits are specified according to the engine manufacturer typical values.
Compressor maps database development
The compressor map database development procedure steps are presented in the flowchart shown in Figure 6. Initially, the parameters (VFR, PR) that describe the surge line position and the compressor diameter of the reference compressor map are determined. The two SL points for the new compressor map can be defined by changing either the SL slope or the maximum compressor PR, considering constrains to ensure that the SL slope remains positive and within the acceptable range.
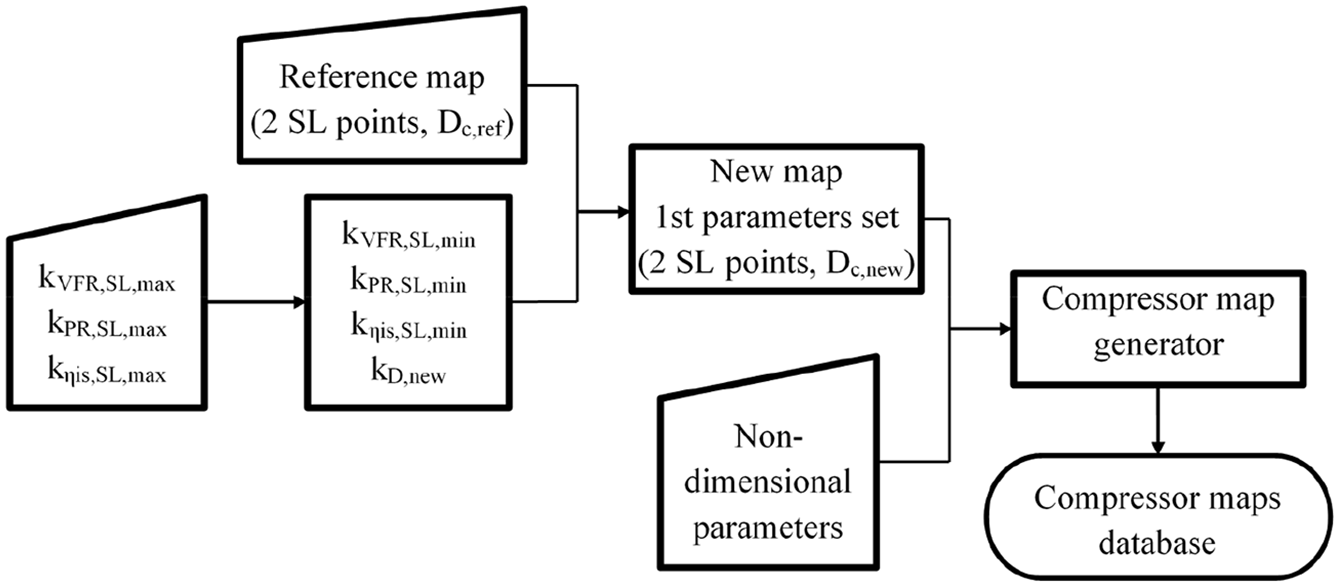
Flowchart of the compressor database generation procedure.
The main parameters that affect the new compressor map are: VFR, PR and ηis of the SL points with the highest Mach number (denoted with SL,max). The scaling parameters (kSL,max,VFR and kSL,max,PR) are introduced (provided as input) for defining the VFRSL,max and PRSL,max of the new compressor map (scaling the VFRSL,max and PRSL,max of the reference compressor map). The VFR scaling parameter (kSL,max,VFR) range was taken between 0.5 and 1.3, whereas the PR scaling parameter (kSL,max,PR) range was taken between 0.65 and 1.025.
The scaling parameters (for both the VFR and PR) that define the SL point at the lowest Mach number are expressed as a function of the respective parameter kSL,max, taking into account the slope of the reference compressor SL, by employing the following equation:

where cSLnew denotes the fit constants that can be estimated by using the reference map data considering the slope of the line that connects the SL points at the maximum and minimum Mach number and their VFR ratio.
The compressor impeller diameter is an important parameter for the generation of the new compressor map, as it affects the SL maximum VFR and is directly linked to the compressor rotational speed. Taking the reference compressor impeller diameter as baseline, the scaling parameter that affects the new compressor impeller diameter is estimated by using the following equation:

where cD,new is a user defined fit constant that correlates the maximum VFR with the compressor impeller diameter.
The set of non-dimensional parameters describes the shape of the constant speed curves considering the shape of the surge and choke lines, the desired maximum isentropic efficiency as well as the curvature of the constant speed curves. The choke line of the new compressor map can be controlled by modifying the coefficients in equations (5) and (6) that affect the choke line distance from the surge limit.
Following the selection of the parameters controlling the new compressor map, the tool described in Section 3.2 is employed to generate the new compressor map constant speed curves and isentropic efficiency. The former is obtained by estimating the VFR and PR of the SL, CL, IS and ZS points as well as the exponent n of the elliptic curves in equation (7). For the latter, the values of the VFR, PR and ηis of the SL and CL are used to calculate the compressor non-dimensional torque and flow coefficients, and subsequently determine the linear functions correlating the non-dimensional torque coefficient with the flow coefficient. Lastly, the compressor isentropic efficiency is calculated by implementing the maximum efficiency correction as described in Section 3.2. The derived coordinates of new compressor map operating points (N, VFR, PR and ηis) are stored in the compressor map database in a digital format.
Compressor matching checking procedure
The compressor matching checking procedure is realised according to the flowchart of Figure 7 and employs the engine performance parameters response surfaces along with the developed compressor maps database to identify the maps that can match the engine considering single or of multiple units connected in parallel. The checking procedure is carried out for several engine operating points (power and speed), which are selected based on the engine application (e.g. engine driving directly a fixed or a controllable pitch propeller), to ascertain that the engine power exceeds the required power. Using the fuel mass flow rate and the scavenge air receiver pressure as input parameters and considering the limits of each compressor map, the engine power is estimated from the developed response surfaces. The compressors are characterised as suitable to match to the investigated engine only when the difference between the estimated and the desired engine power values for each operating point is less than a predefined error (denoted by ε in Figure 7).
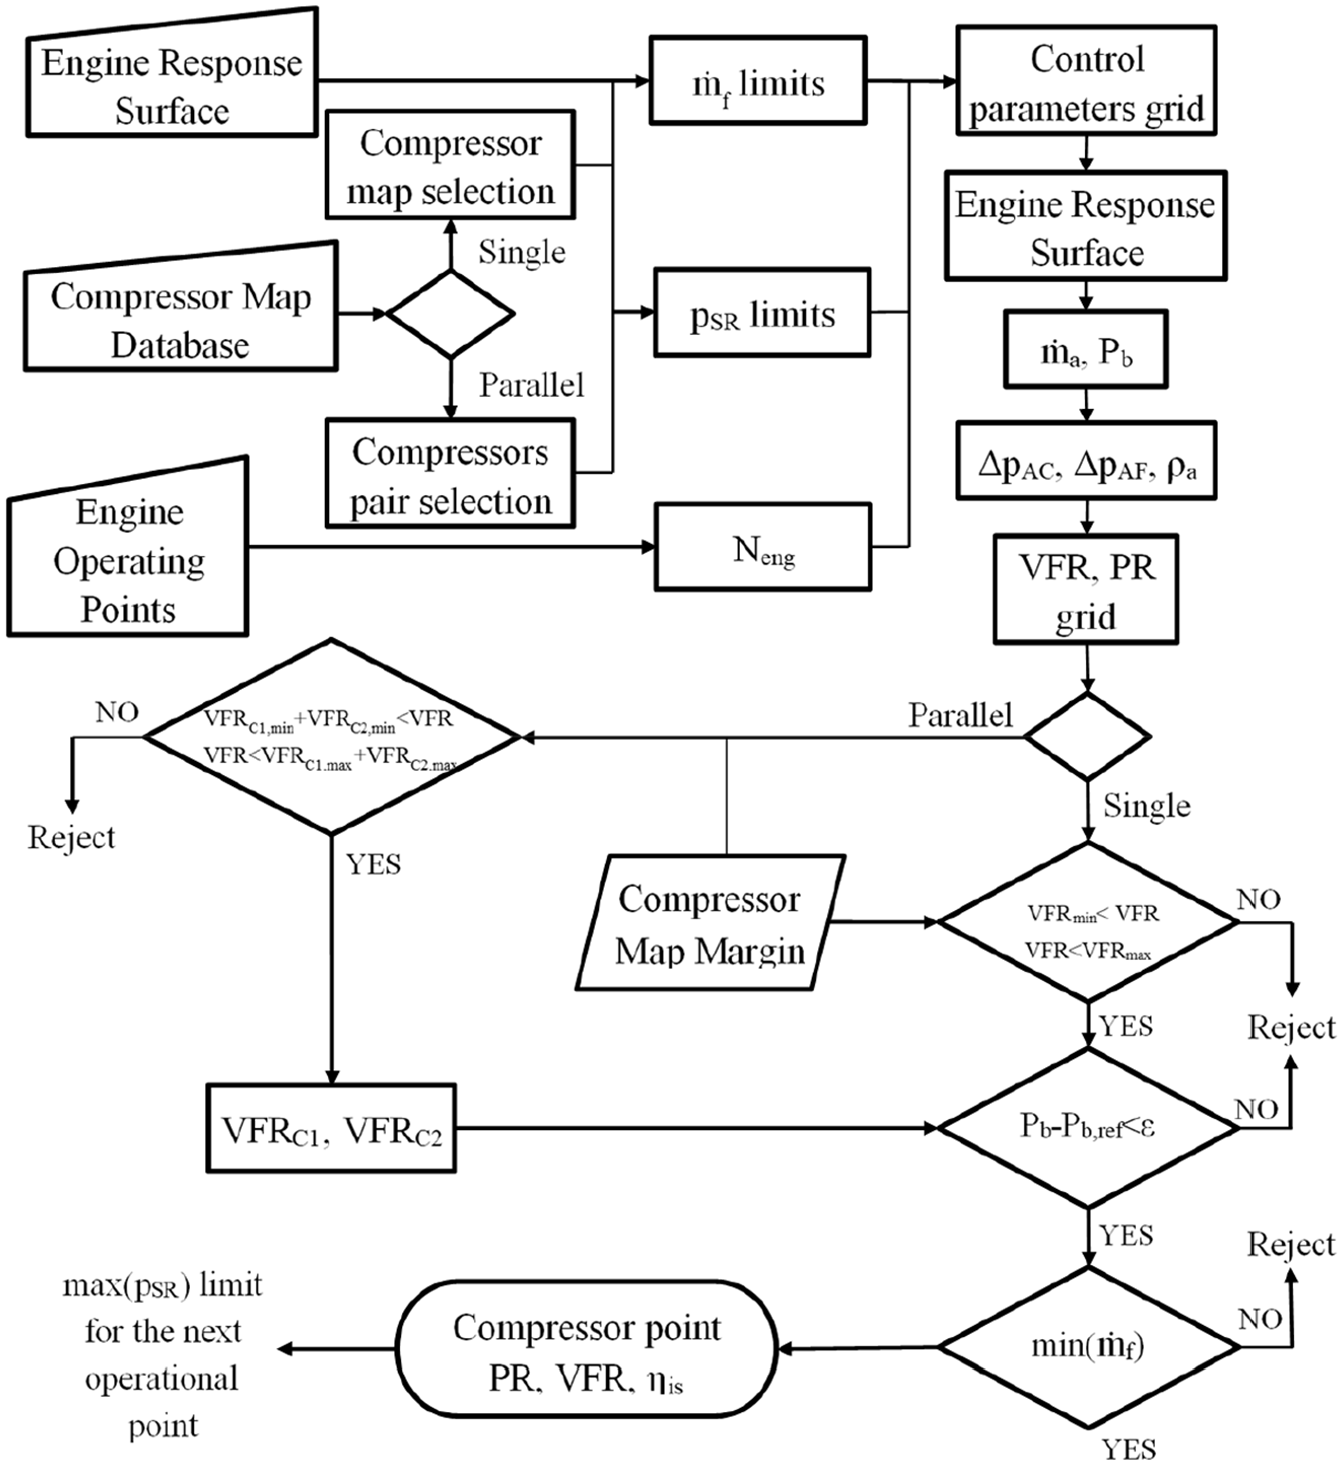
Flowchart of the compressor-engine matching checking procedure.
To reduce the checking procedure computational cost, a grid with the possible combinations of fuel mass flow rate, scavenge air pressure and engine rotational speed is developed for every compressor map. For each combination (from this grid), the required engine air mass flow rate and indicated mean effective pressure are calculated from the engine performance parameters response surfaces, and subsequently the engine brake power is calculated accounting the engine friction losses (estimated as function of the engine rotational speed and the brake mean effective pressure 60 ). The required compressor PR is estimated from the scavenge air receiver pressure and the pressure losses of the air filter and the air cooler. The air filter and the air cooler pressure losses are estimated as quadratic functions of the air mass flow rate.
To identify if each compressor map satisfies the pressure and air flow requirements at every engine operating point, the following two constraints are considered: (a) the existence of a sufficient margin from the compressor map boundaries to avoid the compressor surge and choke, 8 which also facilitates the compressor operating point laying closer to the maximum isentropic efficiency areas; (b) the scavenge air pressure is less than the respective value exhibited at the engine maximum power, thus ensuring a smooth compressor operating curve considering all the selected engine operating points.
The checking procedure starts from the engine operating point with the highest power. Each compressor VFR and PR are calculated for the considered combinations of fuel mass flow rate and scavenge air receiver pressure. If the compressor map satisfies this operating point requirements, the scavenge air pressure upper limit is updated and employed for the next operating point calculation; otherwise, the procedure continues to the next operating point, exploring the operational area of the investigated compressor. The different combinations of the scavenge air pressure and air mass flow rate are evaluated checking if the engine satisfies the required power of the given operating point, and the solution that provides the minimum fuel mass flow rate is selected. When the engine power demand is satisfied considering the requirements and limitations imposed at all the selected engine operating points, it is considered that the checked compressor map can match the investigated engine.
A similar approach is followed for the compressors matching checking procedure for the parallel turbocharging system. The different combinations of the compressor maps from the established database are checked, increasing the compressor configurations number that can match the engine. The volumetric flow rates of both compressors are estimated by considering the same pressure ratio and checking the margins of the selected compressor maps. The initial value of the volumetric flow rate depends on the size of each compressor. The final estimation of the compressors operating points must satisfy the mass conservation equation as well as the volumetric flow rate limits of each compressor map at the given pressure ratio. It is considered that the combinations meeting all the set conditions, limitations and requirements for the given engine operating profile can match the engine.
Turbine selection
The procedure for the turbine selection for each identified compressor map (from Phase 2) is illustrated in the flowchart of Figure 8. Using as input the identified compressor maps (or their combinations for the parallel TCs configurations) and the constraints from Phase 2 (compressors matching checking described in Section 4.3), a trust–region optimisation method
61
is employed to identify the engine fuel mass flow rate and the scavenging air pressure that minimise the absolute deviation between the desired and the estimated engine power for each operating point. This optimisation algorithm uses as initial values for the mass flow rate and the scavenge air pressure, the respective values derived in Phase 2. Subsequently, the exhaust gas receiver temperature, and air mass flow rate are calculated by using the response surfaces (from Phase 1). The compressor operating points (pressure ratio, air volumetric flow rate, turbocharger speed, isentropic efficiency) are taken from the respective calculations of Phase 2. The exhaust gas mass flow rate is calculated by adding the air and fuel flow rates, whereas the exhaust receiver pressure is estimated from the scavenge air receiver pressure and the cylinder pressure difference. The turbine mass flow rate parameter (
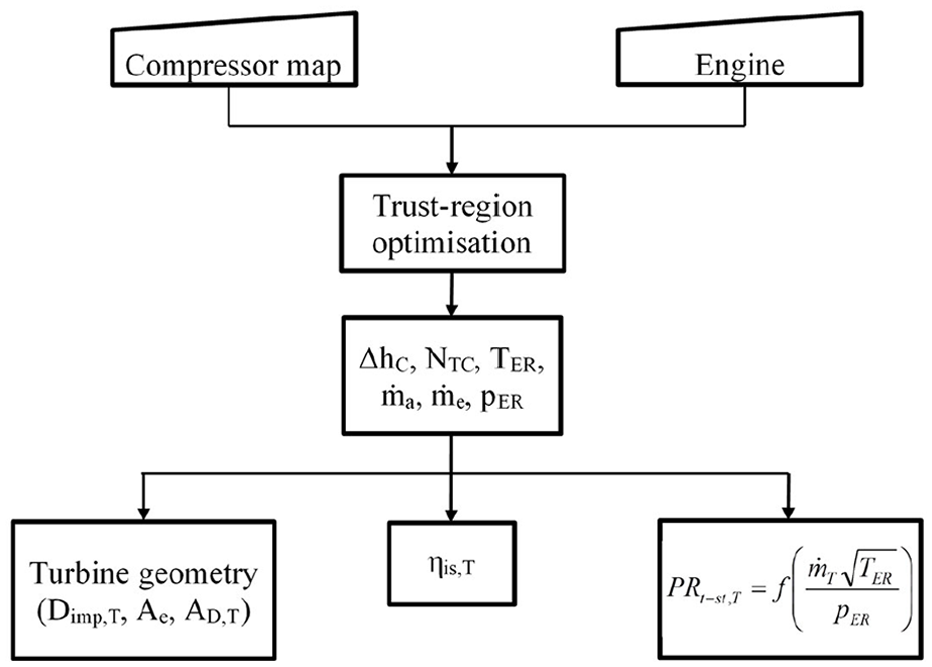
Flowchart of the turbine performance curve estimation procedure.
The geometric characteristics of the turbine are estimated from the required exhaust gas mass flow rate and the required turbine power (estimated from the compressor power and the TC mechanical efficiency); the latter divided by the exhaust gas mass flow rate provides the turbine specific enthalpy drop (

The final estimation of the turbine diameter is performed by selecting its average value (taking onto account all the considered engine operating points). Subsequently, the effective turbine area is estimated considering typical turbine wheels geometric characteristics (radii ratios). The turbine total to static isentropic efficiency is estimated by using the turbine specific enthalpy difference and the total to static pressure ratio as well as the exhaust gas properties. Lastly, the turbine mass flow parameter curve is estimated for both the single and parallel turbocharging systems.
Objective-oriented turbocharging system selection
The last step of Phase 3 addresses the turbocharger selection based on an objective-oriented approach and follows the flowchart of Figure 9. This study employs objectives related to either the ship energy efficiency or the resultant engine load diagram area. The justification for their selection rationale is provided in the next paragraph. However, additional or different objectives can be selected depending on the specific ship type, operating profile or other attributes.
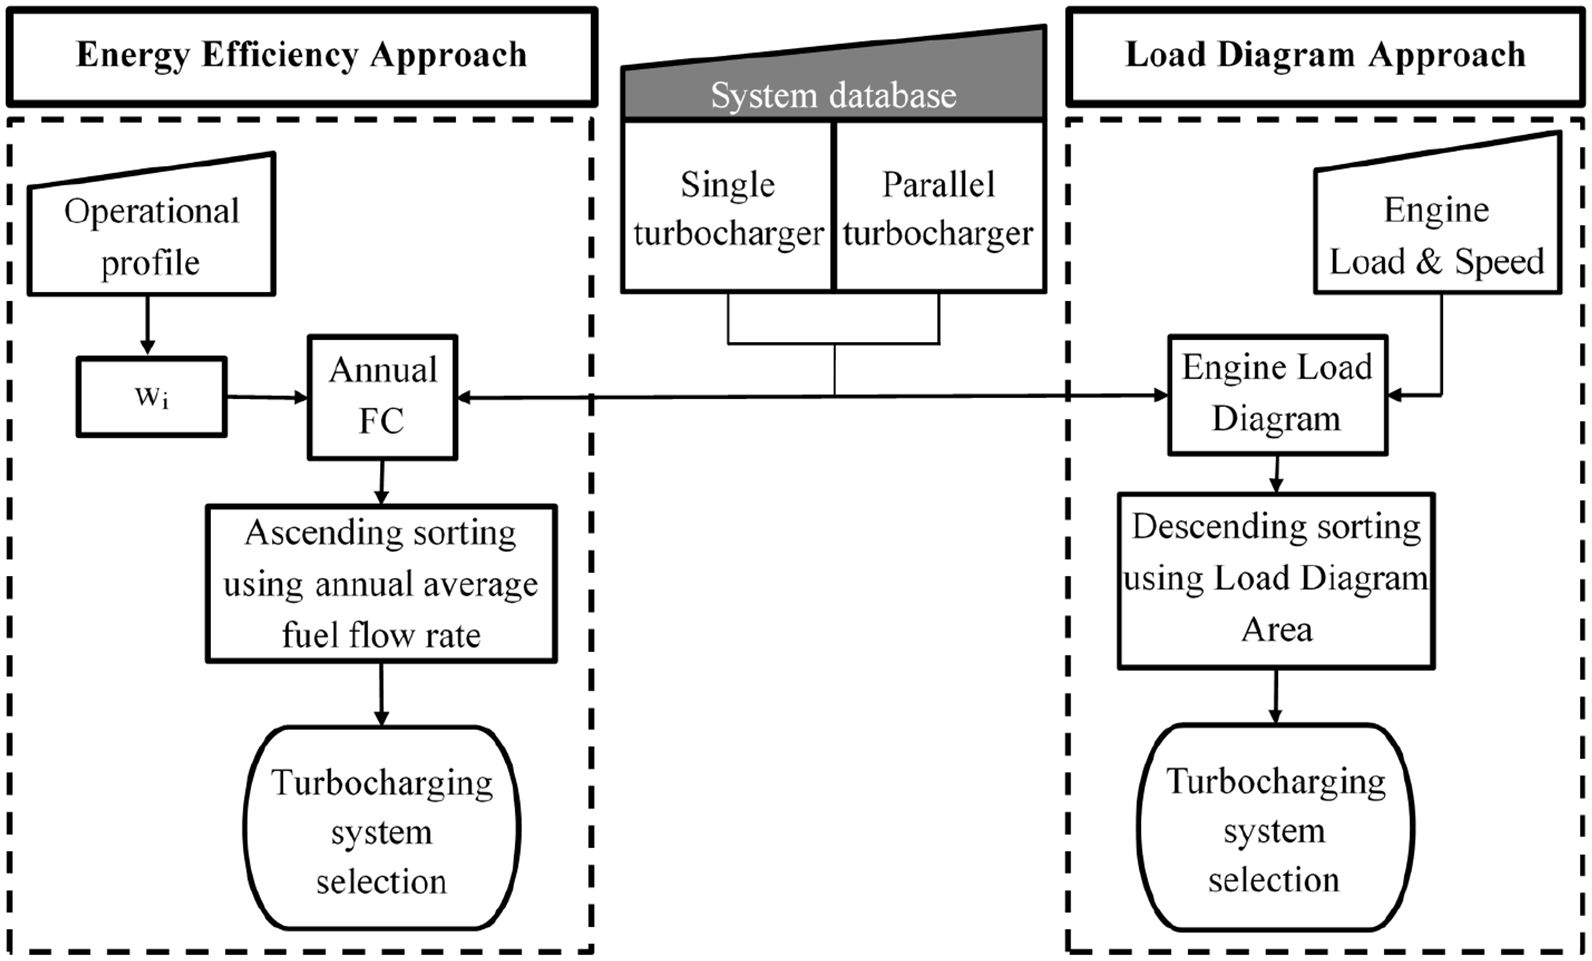
Flowchart of the objective-oriented turbocharging system selection considering the ship energy efficiency objective (left) or the engine load diagram objective (right).
For ocean-going ships, the turbocharging system selection affects the propulsion engine (engine henceforth) performance parameters and as a result the ship energy efficiency. As the engine operates in a wide range of conditions (affected by the ship speed, propulsion system type, environmental conditions, hull/propeller fouling, etc.), the expected engine operating profile plays a crucial role for the turbocharging system selection. Typical annual engine operating profiles can be derived by analysing operational data from existing ships. Apart from the turbocharging system impact on the vessel energy efficiency, the engine load diagram limits are affected by the surge limits of the selected compressor(s). In addition, the selection of the engine fuel governor limiters affects the engine performance in dynamic conditions, such as turning circle, zig-zag and acceleration manoeuvres, especially when the engine directly drives a fixed pitch propeller. To determine the engine limiters, the engine operation needs to be investigated at various conditions including low speeds with high load demand, thus evaluating the turbocharger capability to supply the required engine air flow and scavenge air receiver pressure.
For the ship energy efficiency approach, the considered objective for the turbocharger selection is the annual average fuel mass flow rate (
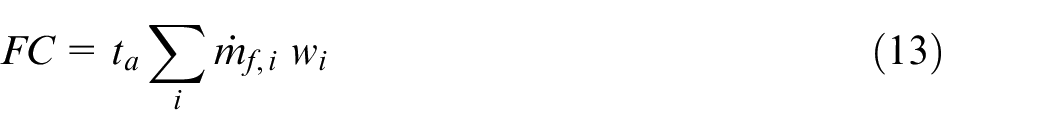
The weighting factors (wi ) at each engine operating point (coinciding with the operating point frequency of occurrencing) are calculated as the ratio of the engine operating hours at each operating point over the total annual engine operating time (ta).
For the engine load diagram approach, the objective for the turbocharging system selection is the resultant load diagram area targeting high power output (especially at low and medium engine speeds), allowing for setting the scavenging limiter (fuel rack position as function of the scavenge air receiver pressure) to provide higher fuel mass flow rates at lower engine speeds. The turbocharger selection is performed by comparatively assessing the load diagram areas of the identified engine-turbocharger matches from the Phases 2 and 3. It must be noted that this study does not consider additional constraints regarding the engine response under dynamic conditions.
Application case study
The developed methodology is applied for the matching of a single and a parallel turbocharging system to a marine diesel engine, which is used for the propulsion of an Aframax tanker, directly driving the ship fixed pitch propeller. The two different approaches described in Section 4.5 are considered, employing the fuel efficiency and the engine load diagram envelope, respectively. The characteristics of the ship, propulsion engine and propeller as well as the ship resistance are considered known from the previous design steps. The installed propulsion engine is the MAN B&W 7S60MC–C6, 63 which is a two-stroke diesel engine employing a single turbocharging system along with an air cooler and an electric driven blower; the latter is activated at low loads (up to 40%). Although this is a relatively outdated–series engine, it is quite popular engine type installed in a considerable fraction of the existing ocean-going fleet of similar size. This engine is used herein for accomplishing the main target of this study, which is to present and validate the proposed methodology and compare the derived results with an actual case data. The details of the investigated Aframax tanker and its propulsion system components are presented in Table 1.
Main characteristics of the investigated ship, engine and propeller.
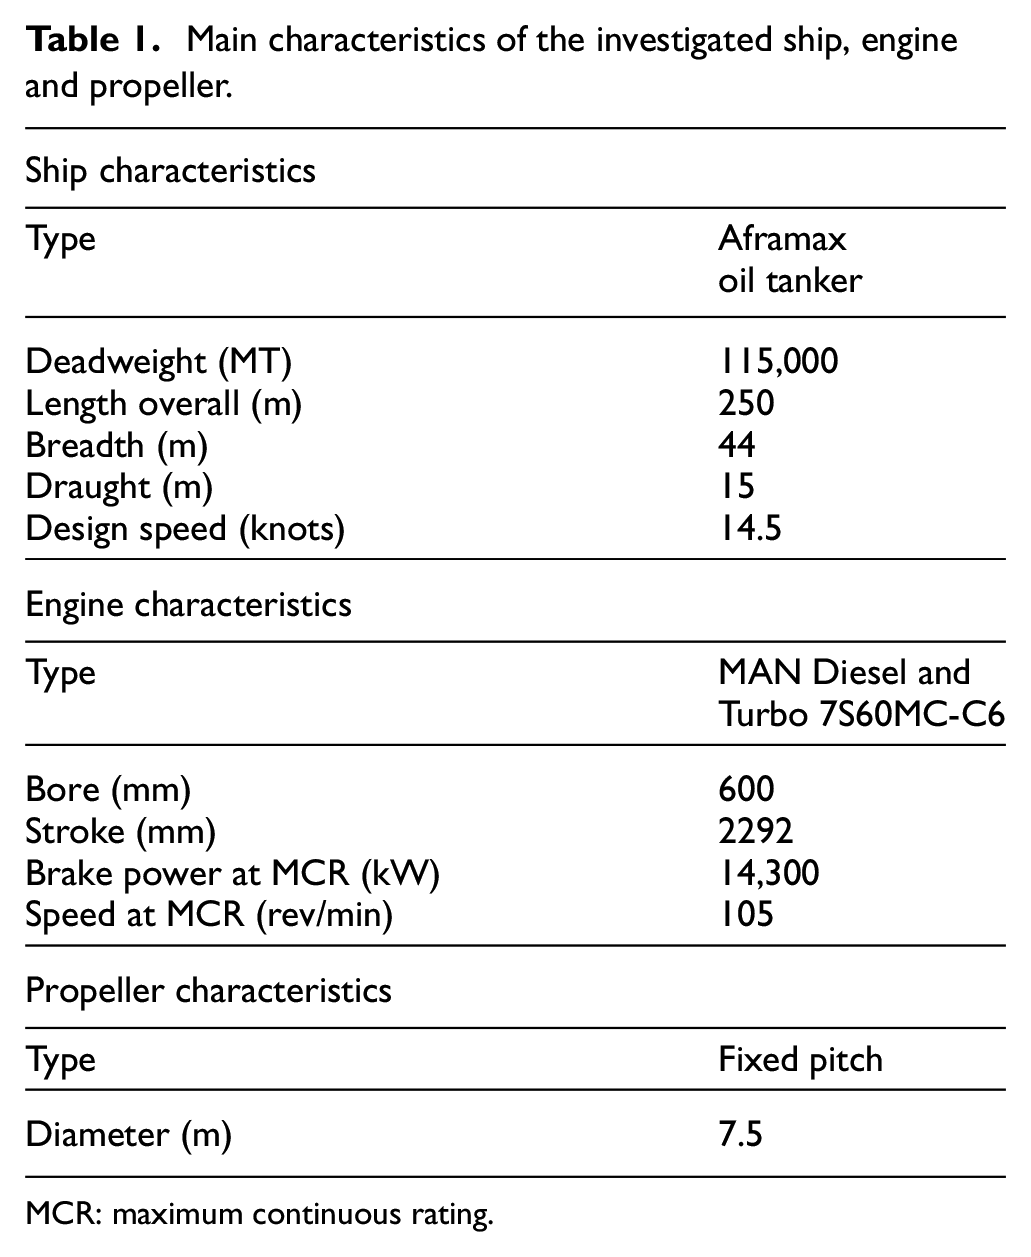
MCR: maximum continuous rating.
The presented methodology results are validated by comparing the derived performance parameters of the matched engine-turbocharger combinations to the respective parameters of the considered vessel propulsion engine. In addition, the methodology effectiveness on identifying turbochargers that can improve either the baseline engine energy efficiency and/or expand its load diagram is assessed. The electric driven blower is neglected in the present study, considering that the proposed methodology investigates the vessel performance at medium and high vessel speeds.
The engine–turbocharger matching procedure requires the engine operating points (in terms of power and rotational speed). This study employed the ship speed profiles reported in Banks et al. 64 for Aframax tankers to estimate the engine load/speed profiles. Initially, the ship resistance is calculated for each vessel speed, assuming calm sea conditions along with clean hull and the propeller conditions. Then, an iteration is performed until the engine speed is converged, taking into account the advance ratio, the propeller torque, the shaft efficiency, 65 the propeller open water efficiency, the relative-rotative efficiency, the hull efficiency as well as the delivered power to the propeller. Thenceforth, the engine speed and power that correspond to each vessel speed are calculated. The estimated engine operating profiles for the considered tanker in both laden and ballast conditions are presented in Figure 10.
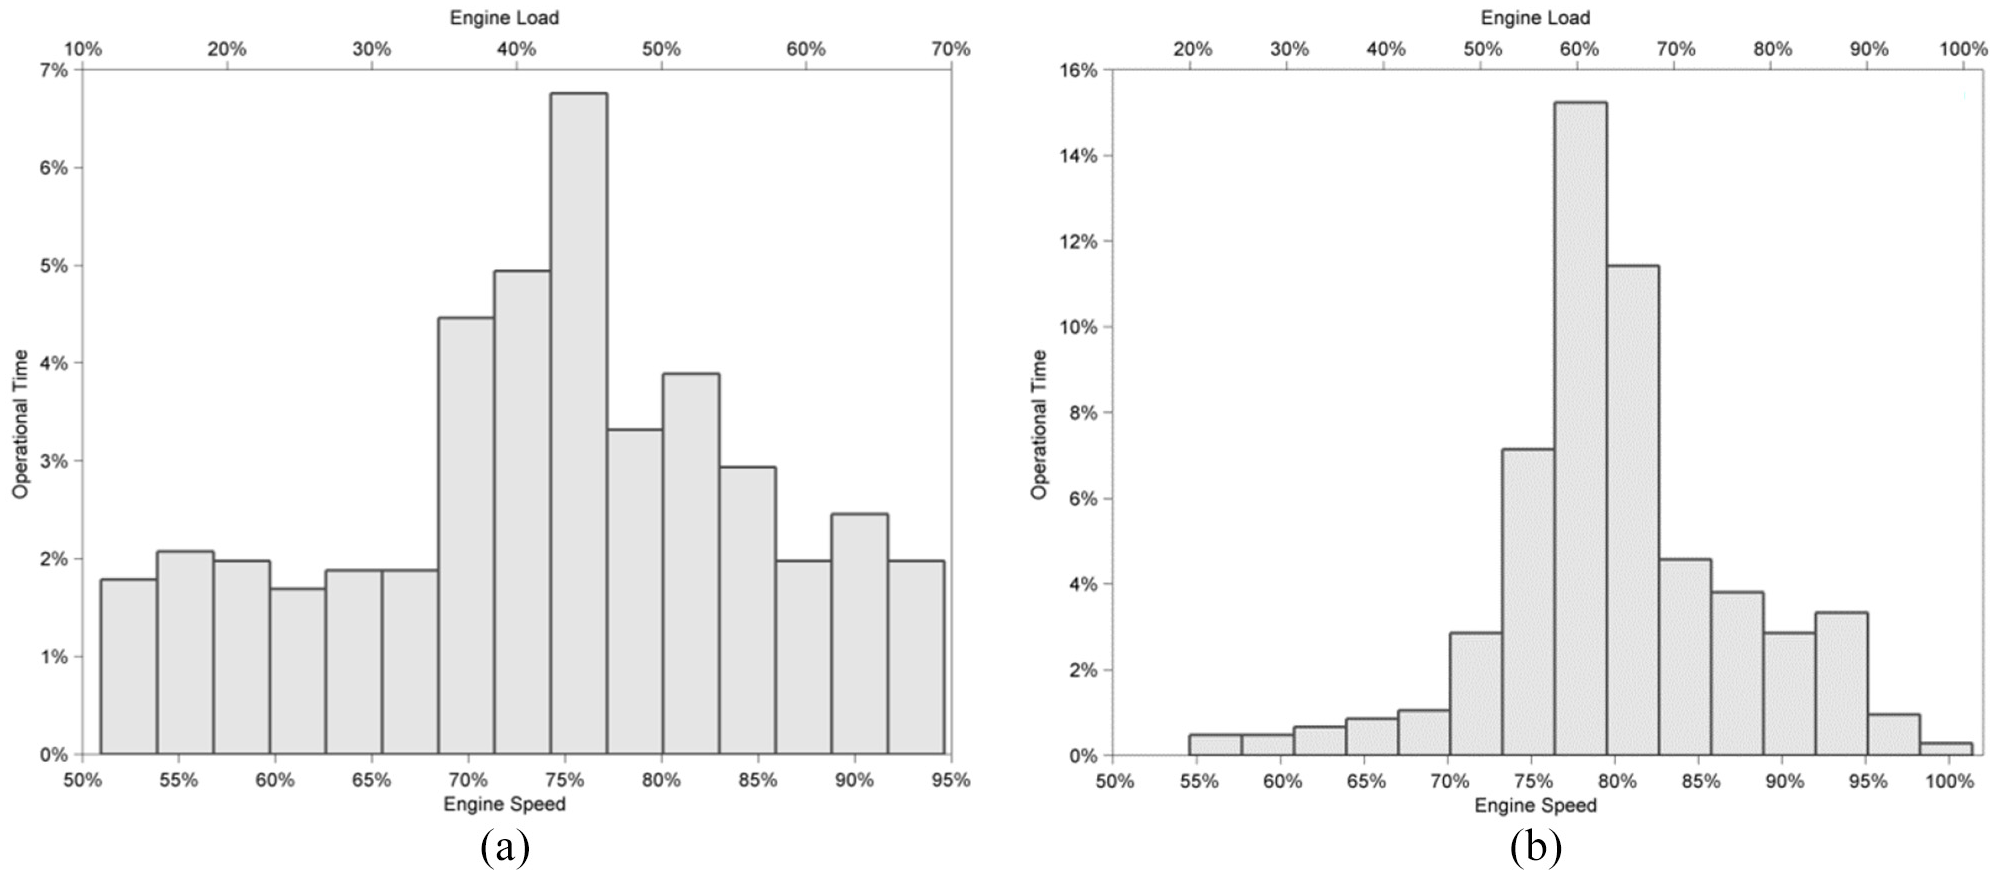
Operating profiles for the considered Aframax tanker propulsion engine for (a) ballast conditions and (b) full laden conditions.
Engine model results and validation
The engine steady state operation is simulated using the developed 0-D single cylinder model considering as boundary conditions the pressure and temperature of the scavenge air receiver as well as the exhaust gas receiver pressure (taken from the engine shop trials). The combustion model was calibrated for the 100% load and employed to predict the engine performance parameters in the considered operating envelope. The derived results were validated against the respective engine shop trials data. The deviations of the simulation results from the respective experimental data are provided in Table 2. It can be deduced that the model predicts with sufficient accuracy the cylinder pressure, the exhaust gas receiver temperature and the engine power, as the maximum obtained error was 4.5%, whilst the majority of the investigated parameters were predicted with errors less than ±1%. Subsequently, the design space of the engine boundary conditions was defined, and simulation runs were performed. Based on the derived results, the engine performance parameters response surfaces were generated.
Percentage error between shop trials and simulation results at various engine loads.
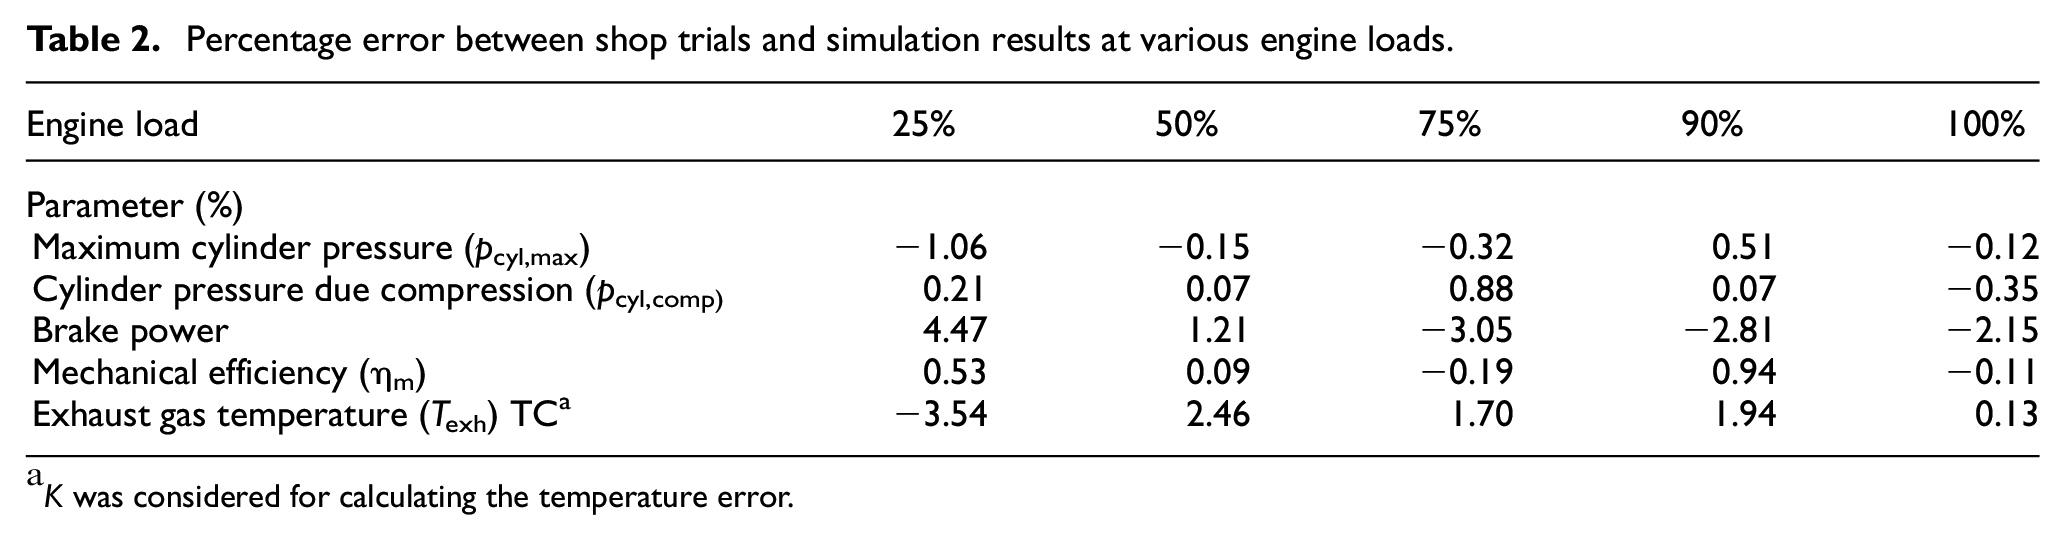
K was considered for calculating the temperature error.
Parametric compressor map tool results and validation
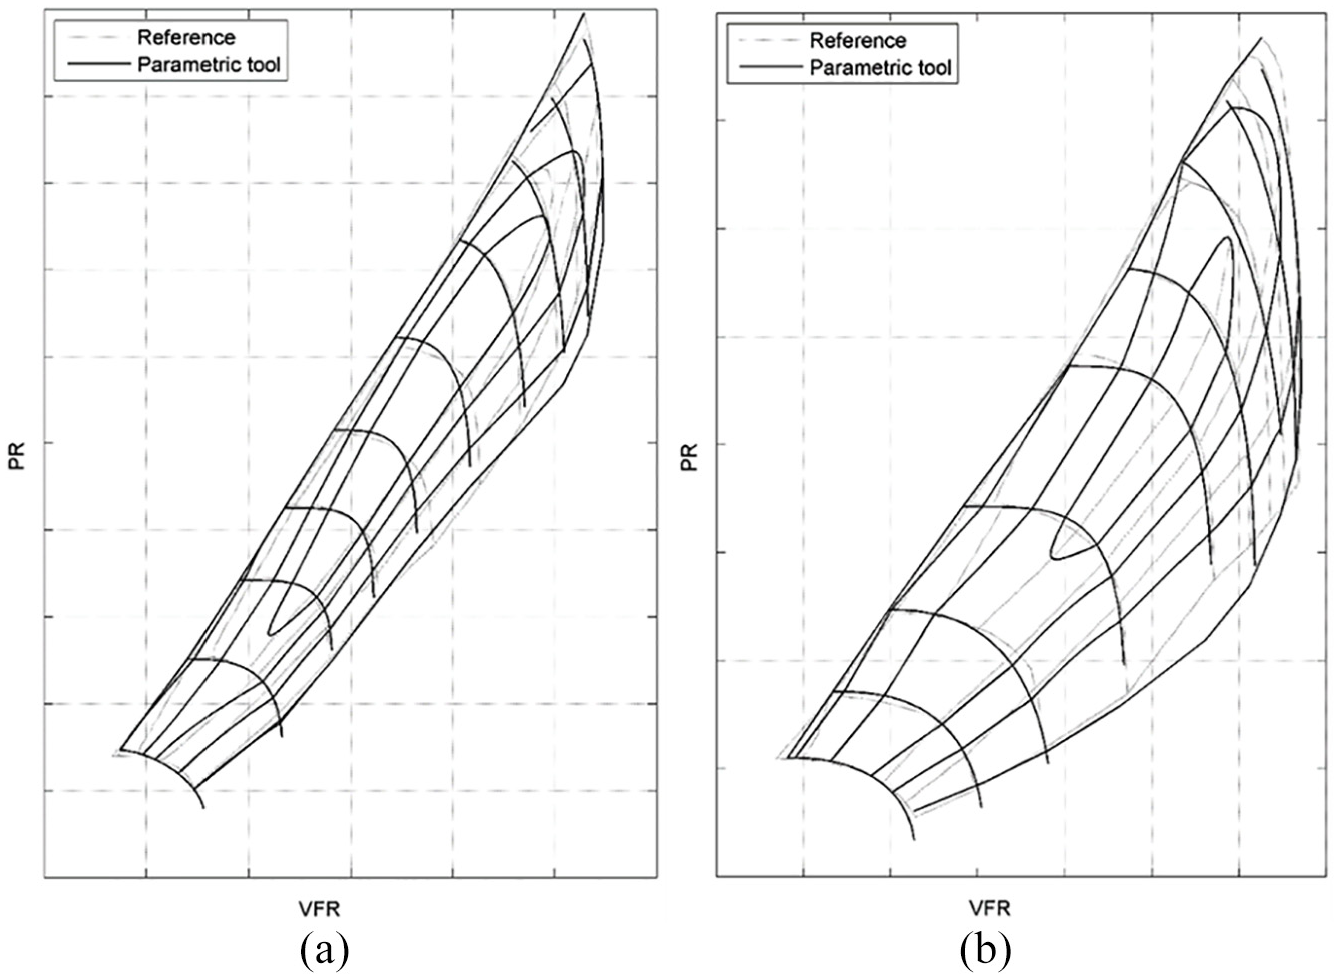
The parametric compressor map tool was employed for the parametrisation and generation of two maps from marine turbochargers compressors, which were taken from Ono et al. 60 and Karlsen. 66 The parametric tool managed to generate the non-dimensional parameters (required to describe the compressor map and control the map characteristics).
Based on these estimated parameters, the approximation of the considered two compressor maps constant speed and efficiency curves were carried out, which compared against the actual maps as shown in Figure 11. It can be observed that the derived constant speed and efficiency curves were predicted with adequate accuracy as the maximum absolute error was found to be around 2.2%. The approximation of the reference maps indicates the importance of the accurate estimation on the map boundaries. In both cases, higher error values were exhibited on the estimation of the distance between the choke and the surge lines at medium turbocharger speeds (respective deviations between the estimated constant speed curves and the turbocharger manufacturer speed curves). This is attributed to the wide range of the compressor speed. As it is also inferred from Figure 11, the parametric tool predicted with adequate accuracy the compressor isentropic efficiency contours (demonstrating the effectiveness of the employed approach using the maximum isentropic coefficient correction). Aligned with the preceding observations, the higher error values in the prediction of the compressor isentropic efficiency are exhibited in the regions of the choke lines in the moderate speeds.
Single and parallel turbocharging system matching procedure results
As discussed in Section 4.2, only the coordinates of the surge line (SL) point with the highest speed (corresponding to the maximum pressure ratio and volumetric flow rate) are modified for generating the compressor maps database. The compressor diameter and the coordinates (PR and VFR) of the SL point with the lowest speed depend on the SL point with the highest speed. The remaining non-dimensional parameters are as calculated for the reference compressor map. For generating the compressor maps, the maximum pressure ratio was selected in the range from 2.8 to 5, whilst the maximum volumetric flow rate was estimated considering the maximum engine volumetric flow rate (as derived from the respective engine response surface).
For the investigated case study, 144 different compressor maps were generated, which are used for the single turbocharger-engine matching procedure. The boundaries of a generated compressor maps set are presented in Figure 12. In addition, 10,440 different and unique combinations of compressor pairs were produced for the case of the turbocharging system with turbochargers pairs connected in parallel. It is expected that the turbocharger manufacturers can provide compressors that can have the map(s) identified in the next steps of this study or very close alternatives, as they employ various techniques including the use of diffusers with different geometric characteristics and impeller outlet trimming to customise the compressors of their available families, which cover more extended ranges of flow and pressure ratio.
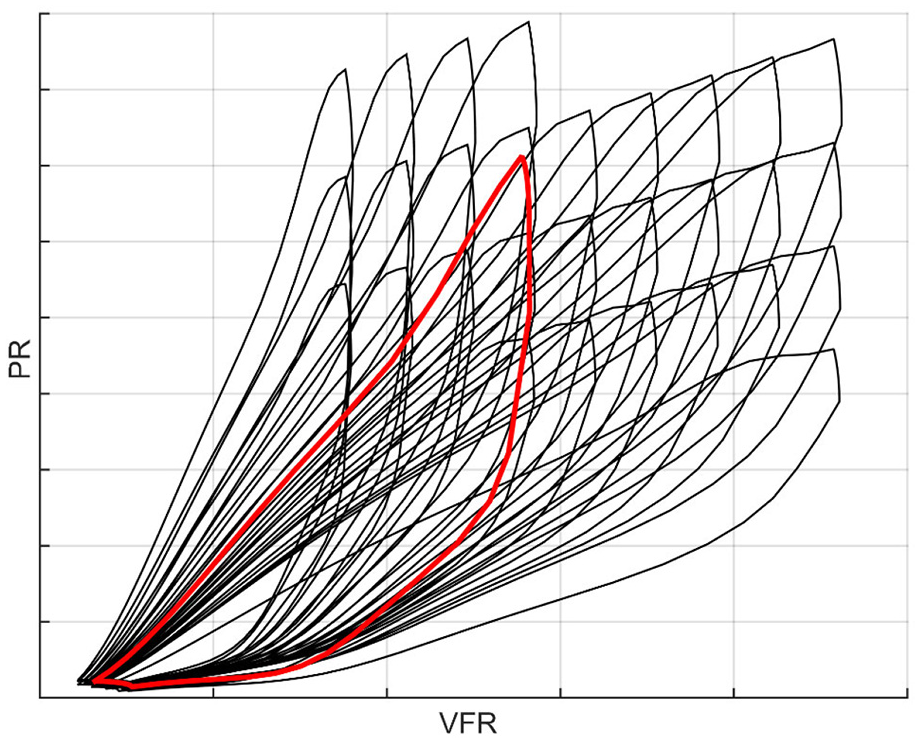
Boundaries from a sample of the generated compressor maps. The reference compressor map boundaries are superimposed in red.
During the compressor matching checking, a margin of 30% from the VFRs of SL and CL points of the single and parallel turbocharging systems was considered to avoid the compressor operation close to its surge and choke limits. This also ensures the operation of the selected compressor within the areas of high isentropic efficiency, which ensure the improved turbocharger and engine efficiencies.
Based on this constrain, 31 compressors (from the initial number of 144) were identified that can match the engine with a single turbocharger system, whereas 131 pairs of compressors were identified for the case of the parallel turbocharging system. Subsequently, the turbine maps for each compressor were estimated and the engine performance parameters were calculated.
The derived brake specific fuel oil consumption (BSFC) of all the matched combinations (engine-compressor-turbine) for the cases of the single and parallel turbocharging systems as well as the BSFC of the considered engine (both for the entire engine operating envelop) are presented in Figure 13. It can be inferred from these results that there is a leeway to further reduce the engine BSFC (up to 5 g/kWh for the load range 45%–60%; parallel turbocharging can provide slightly lower BSFC), therefore the selection of the appropriate turbocharger is of vital importance for improving efficiency. In addition, the requirements for the engine load diagram need to be satisfied.
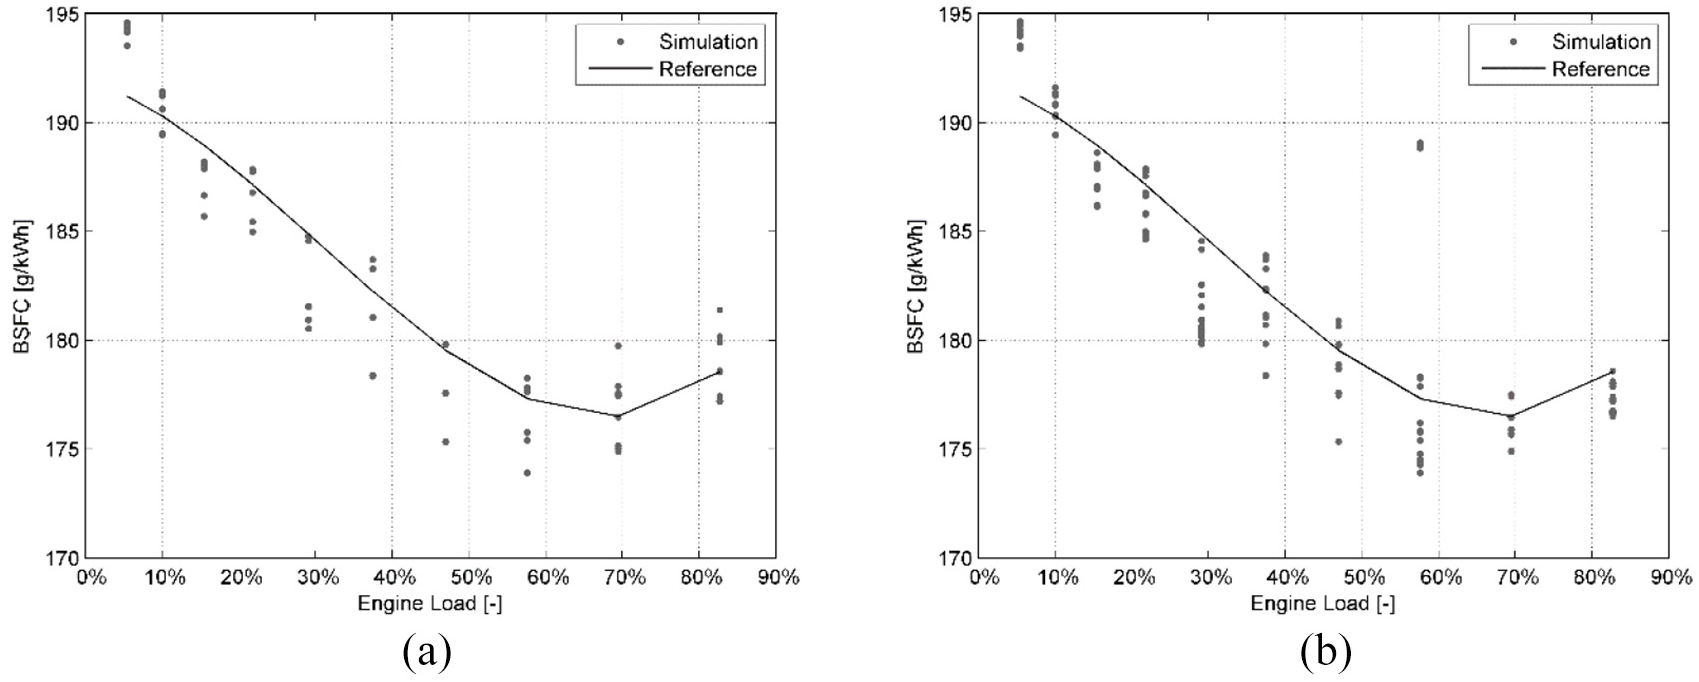
Comparison of the BSFC of the reference engine and the matched engine-turbocharging system with (a) a single turbocharger and (b) connected in parallel turbochargers.
Turbocharging system selection
Ship energy efficiency objective
When the matching procedure objective is to minimise the annual fuel consumption (FC) (calculated by equation (13) for the engine operating profiles shown in Figure 10), the turbocharger with compressor map ID125 was selected for the single turbocharger system. This turbocharger provided the lowest FC, which was found to be 5% lower than the highest calculated FC. Thus, it is considered as one of the most energy efficient options.
For the parallel turbocharging system, the following two alternatives were identified: (a) two identical turbochargers with compressors maps ID64; (b) two turbochargers of different size with the compressor maps ID73 and ID55. Both provided the lowest FC, which was found to be 8.5% lower than the respective highest estimated FC (considering parallel TC systems), and almost the same with the FC obtained with the selected single turbocharger system. The calculated FCs for the selected single and parallel turbocharging systems are approximately 2% lower than that obtained with the main engine installed in investigated vessel (reference engine) for the same operating profile.
The operating profiles shown in Figure 10 correspond to calm water sea conditions. The matching procedure was also carried out for the cases of the ship operation at increased resistance conditions (due to sailing at adverse weather conditions or hull fouling). Respective engine load operating profiles were estimated considering 10%, 20% and 30% resistance increases compared to the calm water resistance. The derived results including the matched single and parallel turbocharging systems along with the calculated FC and its percentage deviation from the reference system FC are presented in Table 3.
Comparison of the turbocharging system selection results for different resistance curves.
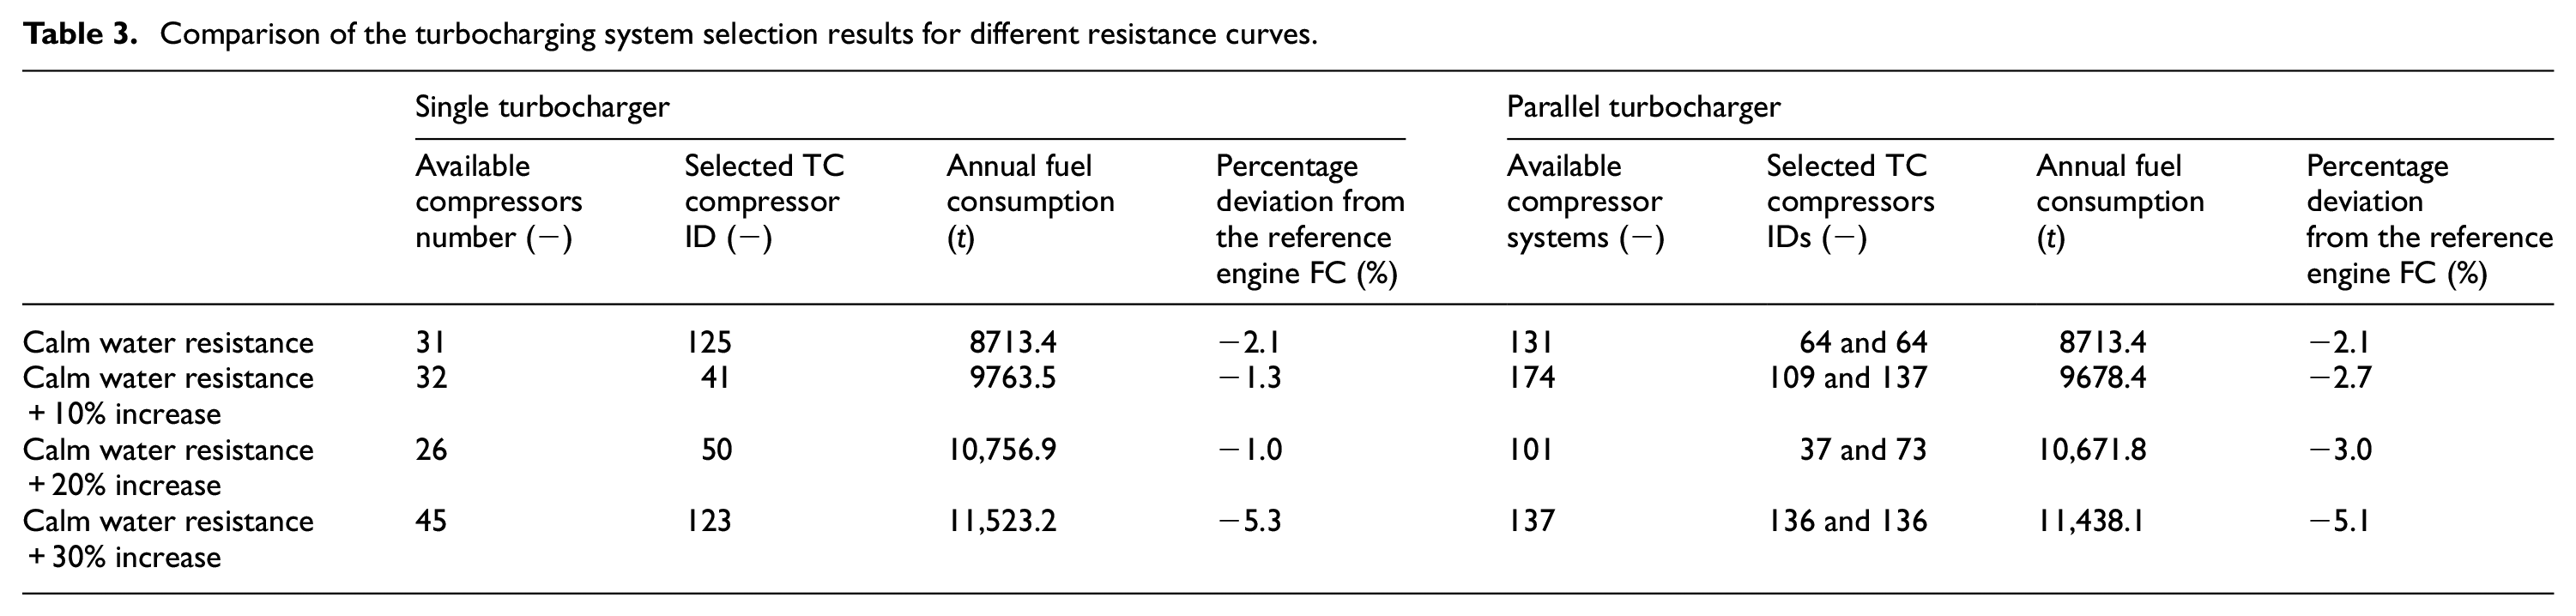
Based on these results, it is inferred that the different engine operating profiles affect the selection of the turbocharging system. Although the deviation from the reference engine FC decreases for the cases of 10% and 20% increased resistance, it is considerable in the last investigated case (30% increased resistance). This trade-off is attributed to the deviation of the matched engine BSFC from the reference engine BSFC curve (as function of the engine load). Finally, the increased resistance conditions eliminated several of the single and parallel turbocharging systems selected for the operating profile at calm water conditions. The single turbocharging system ID125 (selected at calm water sea conditions) is still considered as a solution for the cases with increased resistance, although is not the most energy efficient solution. A comparison of the compressor map with ID125 with the reference compressor map as well as with the compressor map with ID123 (the most efficient solution for the case of 30% increased resistance from calm water conditions) is provided in Figure 14.
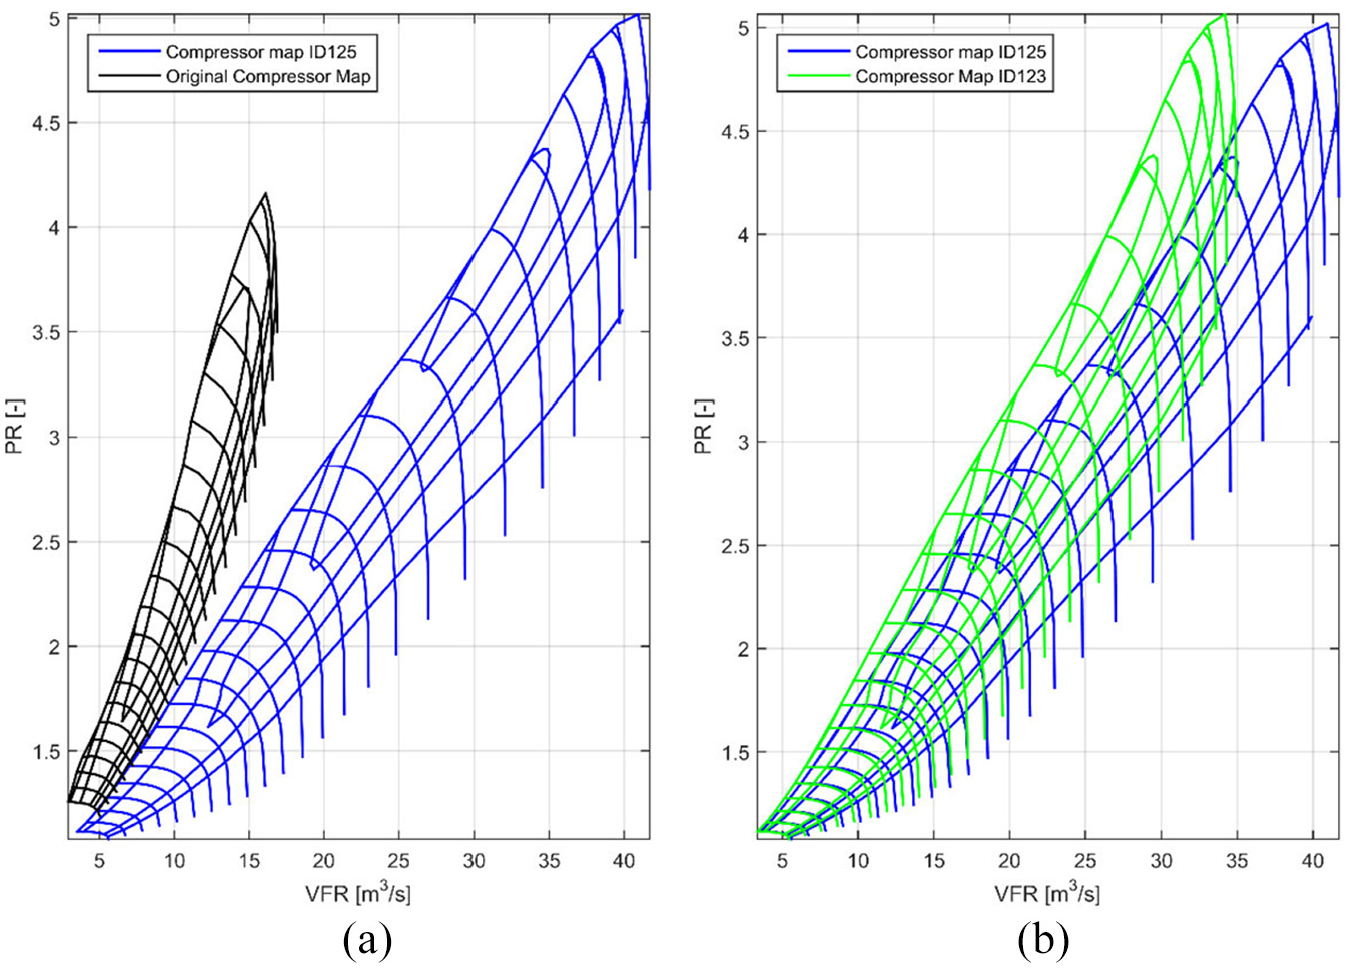
Comparison of (a) reference compressor map against the compressor map with ID125 and (b) compressor maps with ID125 and ID123.
Engine load diagram area objective
For the case where the matching procedure objective is to maximise the engine load diagram area targeting to increase the engine power, the single turbocharging solutions are evaluated considering the extend (upper limit) of the engine load diagram. Figure 15 presents the engine load diagrams derived for the cases of the compressor maps with ID133 and ID125 (the latter also provided the lower annual FC at calm water conditions). In addition, the reference engine load diagram (adopted from the engine manufacturer 63 ) as well as the load diagram derived for the reference compressor map (considering the TC installed in the investigated engine) are shown in Figure 15.
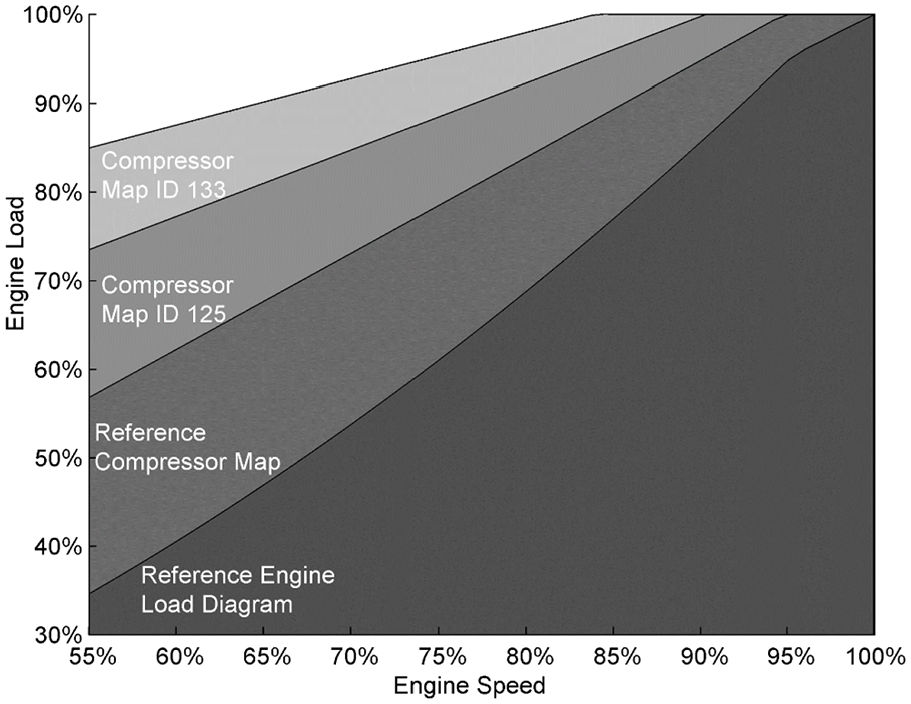
Comparison of the reference engine load diagram against the limits of the reference turbocharger and the single turbocharging systems that correspond to the compressor maps ID125 and ID133.
It must be noted that the reference engine load diagram set by the engine manufacturer exhibits stricter limits (load diagram limit curves are in lower engine loads) compared to the reference compressor load diagram. In this respect, stricter limits are expected for the cases of the identified compressors (ID133 and ID125), however their respective load diagrams are expected to be more extensive (in comparison to the reference engine one). The single turbocharging system with the compressor map ID125 extends the load diagram limits (higher loads at low speeds) compared to the limits estimated for the reference compressor map. The single turbocharging system with the compressor map ID133 provides the greater extension of the engine load diagram.
The load diagrams presented in Figure 15 were evaluated in steady conditions and assuming that there are no additional limitations in respect to the engine and turbocharger components materials as well as the allowed exhaust gas temperature. Although these limitations may confine the engine load diagram, this study provides a fair estimation of the engine load diagram that can be used to evaluate the engine and ship response (under dynamic conditions) during the initial ship design phase. A similar procedure can be performed for the parallel turbocharging system, investigating the most appropriate combination of turbochargers to match the reference engine. Nonetheless, it must be highlighted that for making decisions on the selection of single or parallel turbocharging systems, there are many parameters that need to be considered, including the reduced mechanical inertia of parallel turbochargers, the available space for installation on board, the maintenance and operational costs and the engine dynamic response.
Conclusions
This study developed a novel objective-oriented methodology for the selection and identification of the turbocharging system for marine two-stroke engines, considering the limitations on the data availability in the design phase, aiming to provide decision support to propulsion system designers. This methodology consists of three phases. The first phase focused on the parameterisation of an existing compressor map using non-dimensional parameters allowing for the generation of compressor map families as well as the development of response surfaces to describe the engine performance parameters. The second phase evaluated the generated compressor maps identifying appropriate maps for single and parallel turbocharging systems that can match the investigated engine. The third phase estimated the turbine performance curves and realised the turbocharging system selection considering the objectives of either the minimisation of the annual fuel consumption based on a given operating profile or the extension of the engine load diagram limits.
To support this methodology, two tools were developed. The compressor parametric tool allows for the description of a complete compressor map using a limited number of parameters and generates a family of compressor maps. An engine thermodynamic model was employed to generate response surfaces for the engine performance parameters.
The presented methodology was tested for the selection of single and parallel turbocharging systems for the case study of the propulsion engine of an Aframax tanker considering the operating profile of the engine power demand as well as the compressor surge limits.
It was found that the employed thermodynamic model predicted the engine performance parameters with adequate accuracy, as the maximum obtained error was 4.5%, whilst the majority of the investigated parameters were predicted with errors less than 1%.
The parametric compressor map tool was sufficiently estimated the compressor maps of two compressors, exhibiting errors on the predicted compressor parameters in the range of 2.2%. The highest errors were observed in the regions of the choke lines in moderate speeds mainly attributed to the wide range of the compressor speed.
For matching the investigated engine, 31 compressors (out of the generated 144) for the single turbocharger system and 131 compressors pairs (out of 10,440) for the parallel turbocharging system were identified appropriate. The resultant engine brake specific fuel consumption was found to vary up to 5 g/kWh, indicating the importance of the engine−turbocharge matching for the engine efficiency.
Considering the annual fuel consumption as the turbocharger selection objective and taking into account actual engine power demand profiles, single and parallel turbocharging systems were identified resulting in fuel savings in the range of 1.3%−5.3% compared to the reference engine. Moreover, single turbochargers that lead to an extended engine load diagram (allowing for the engine operation at higher loads) were identified, one of them being the unit that also provided the lowest fuel consumption.
This study results demonstrated the potential of the developed methodology to improve the vessel energy efficiency and extend the engine torque limits. The developed engine−turbocharging system tool provided the turbocharging system components maps as well as appropriate turbocharging system alternatives based on the selected objectives. Hence, it is concluded that this methodology can provide decision support to improve the fuel consumption for an existing propulsion system by identifying the characteristics of the turbocharger components as well as quantifying expected fuel savings. The presented methodology followed a modular approach, allowing for the substitution of any tool with alternative models or experimental data, which may be provided directly from the manufacturers. Consequently, this methodology is useful for the initial design phase to evaluate and engine−turbocharging system performance and select the most appropriate turbocharger(s). Although the methodology is developed for marine Diesel engines, following minor modifications for the setting up of the engine models, it can be used for turbocharger matching in other engine types. In addition, the proposed methodology is flexible allowing for the selection of the objective function by the designer; for example, an objective function that combines the energy efficiency criteria along with the load diagram criteria, whilst considering cost and reliability criteria is proposed for future study. It must be noted that this study did not consider the engine response under dynamic conditions. Future studies will focus on the transient investigation and comparative assessment of the identified turbocharging systems for various ship manoeuvres.
Footnotes
Appendix
Author contributions
Conceptualisation, P.M., E.B, G.T.; methodology, P.M., E.B., G.T.; software, P.M.; validation, P.M., E.B., G.T.; formal analysis, P.M., G.T.; writing – original draft preparation, P.M., G.T.; writing, review and editing, P.M. E.B, G.T.; visualisation, P.M.; supervision, G.T., E.B.; project administration, E.B., G.T.
Declaration of conflicting interests
The author(s) declared no potential conflicts of interest with respect to the research, authorship, and/or publication of this article.
Funding
The author(s) disclosed receipt of the following financial support for the research, authorship, and/or publication of this article: This work was partially supported by the ‘HOLISHIP – Holistic Optimisation of Ship Design and Operation for Life Cycle’ project that which was funded from the European Union’s Horizon 2020 research and innovation programme under grant agreement N° 689074. The authors greatly acknowledge the funding from DNV AS and RCCL for the Maritime Safety Research Centre (MSRC) establishment and operation. The opinions expressed herein are those of the authors and should not be construed to reflect the views of EU, DNV AS, RCCL.