
Abstract
The ASTM D6424 standard is used for general aviation piston engine knock detection and is tested for unleaded fuel candidates. Issues are discussed regarding the identification of knocking cycles, filtering frequency bands, and the effects of down-sampling for this knock detection technique. The knock tests were performed on the Continental TSIO-520-VB engine at 12,000 ft for take-off and cruise conditions using three different fuels, the standard leaded 100LL avgas and two unleaded fuel candidates. The ASTM D6424 knock detection method has its own particular disadvantages, which are detailed and compared to other knock detection methods including the third derivative of pressure signal and discrete wavelet transform. Updates to the standard include a minimum sampling rate of 0.2 CAD. Additionally, the current standard does not contain recommendations for filtering the cylinder pressure which results in over detection of knocking cycles with the two new aviation fuel candidates tested. Recommendations are provided regarding the pressure signal processing prior to ASTM D6424 knock-characterization.
Introduction
In Spark Ignition (SI) engines, knock is associated with the auto-ignition of a portion of the air-fuel mixture ahead of the propagating flame front.1,2 This rapid heat release results in high local pressure and produces a shock wave. This shock wave causes a combustion chamber resonance that is amplified by the engine structure to produce the familiar knocking sound. Knock is an inherent problem of SI engines, and has been studied extensively in literature.3–6 The engine’s compression ratio, and the spark advance angle during operation are both limited by knock. Aircraft piston engines are widely used for aviation in North America and still use leaded fuel to limit knock intensity. The 100 octane Low-Lead (100 LL) aviation gasoline (avgas) is the fuel commonly used in the aviation industry which contains lead in the form of Tetra-Ethyl Lead (TEL). The TEL additive is mainly used to modulate the aviation gasoline octane levels to avoid knock and engine failure. The addition of TEL in aviation gasoline also requires the addition of Ethylene DiBromide (EDB) as a scavenger to remove lead oxide from the combustion chamber. These additives are harmful to the environment, and began to be phased out of the automotive industry beginning in the 1970s and completely phased out in 1993 in Canada and 1996 in the United States. In Canada, piston aircraft engines are the second largest source of lead emissions, accounting for 17% of total emissions. 7 In the US, the aircraft piston engines produce 45% of all airborne lead emissions. 8 Studies indicate that near some airports, the lead concentration exceeds EPA limits. 9 Despite extensive efforts to find an unleaded replacement fuel for aircraft piston engines in the 1990s, no fuel that meets all the requirements was found. Therefore the aviation industry has been exempt from the leaded fuel ban. 10 To address these issues, the US Federal Aviation Administration (FAA) started an initiative in 2012 to find an alternative fuel to 100 LL. 11 This collaboration between industry and government is known as the Piston Aviation Fuels Initiative (PAFI). 12 The mission of the PAFI program is to evaluate unleaded fuel replacement candidates and identify those fuels able to meet the existing general aviation aircraft fleet requirements considering the production and distribution cost, availability, and environmental and health impacts of fuels. 13
In Canada, Environment and Climate Change Canada (ECCC), Transport Canada, and Canadian Owners and Pilots Association (COPA) initiated a project with the National Research Council Canada (NRC) and the University of Alberta to coordinate with the US efforts to conduct testing on the unleaded aviation fuel candidates. Currently, research has been performed to determine various alternative unleaded fuels available and their production and availability. 14 Engine testing has been done with a few varieties of these fuels. 15 Then using response surface methodology, these different fuels have been statistically examined for their performance and emissions compared to 100 LL.13,16 This shows the importance of research, testing, and analysis of unleaded fuel replacement for general aviation.
Switching to unleaded fuels for aircraft piston engines will have the vital benefit of significantly reducing the amount of airborne lead, which will improve air quality and public health. Fuel anti-knock quality is one of the most important parameters that govern the occurrence of knock in SI engines. Since the lead additive to 100 LL avgas raises the octane number, which is used to avoid harmful engine knock, maintaining similar knock characteristics is essential for the unleaded fuel candidates. Engine knock tends to occur at high engine loads and is also a complex function of fuel chemistry. Engine knock has consequences, including induced engine vibration, increased rate of heat transfer to the cylinder walls, and physical engine damage due to an increase in thermal and mechanical stresses. Also, the engine indicated efficiency is limited by knock.1,17,18 Aircraft engines present a unique challenge since they operate at high loads during takeoff and it is essential to maintain power during this critical stage of flight. Even during the cruise, comparable to highway driving of an automobile, an aircraft engine can operate at a relatively high load of 80%. Additionally, many aircraft engines operate at fixed spark timings and rely on the pilot to set the air-fuel ratio.
FAR 33, sub-part D, section 33.47 mandates aircraft piston engines to operate safely without knocking throughout the range of intended operating conditions. 19 The Advisory Circular (AC) 33.47 20 has been used traditionally for knock detection; however, it does not mention the technique that needs to be used to meet the requirement. Knock is not only dependent on fuel properties, and other parameters like charge temperature, equivalence ratio, engine compression ratio, turbocharger boost pressure, spark timing, and combustion chamber design affects the knock intensity level. 3 However, using fuels with low anti-knock quality is the major reason for engine knock. 21 Technically, knock is determined by the temperature and pressure history of the end-gas and the anti-knock quality of the fuel, which is measured by the Motor Octane Number (MON), 22 Research Octane Number (RON), 23 and Super-Charge Performance Number (SCPN). 24 These three indexes are measured on a highly calibrated Cooperative Fuel Research (CFR) engine.25,26
RON and MON are not enough to describe the knock resistance of aviation fuels. For aviation gasoline, ASTM D 909 24 standard specifies SCPN as a new index. SCPN is a critical fuel performance index for aviation gasoline, and it is an indication of rich mixture anti-knock quality. Aviation engine manufacturers use SCPN as a specification measurement related to the matching of fuels and engines. 27 For aviation turbo-charged piston engines, SCPN is essential, as these engines run at higher pressures for a given in-cylinder temperature compared to automotive engines. This fuel rating is determined by comparing the knock-limited power of the test fuel to the reference fuels under standard operating conditions defined in ASTM D 909. 24 The reference fuels used for this rating are PRF with 85 octane number and a mixture of iso-octane and 6.0 mL TEL per US gallon. The knock-limited power for the test fuel is compared to the blend of the reference fuels, and the SCPN for the sample is defined by interpolation of the Indicated Mean Effective Pressure (IMEP) at the air-fuel ratio that produces maximum knock-free IMEP.
Inaccurate identification of engine knock deteriorates the engine performance and reduces the engine life-time. 28 Various methods have been developed for knock detection in SI automotive engines. These methods are mainly based on in-cylinder pressure measurement, engine block vibration, and heat release analysis. In-cylinder pressure measurement is one effective way of knock intensity measurement; however, piezoelectric pressure transducers are not used for knock measurements in commercial engines due to their high cost and low durability. Indirect knock measurements using block accelerometers are typically used for knock detection in SI engines. In this way, several cylinders can be controlled using one low-cost sensor. Another method is to use the spark plug as an ionization probe. The probe detects knock through the sharp increase in ionization due to abnormal combustion. There exist other approaches based on heat loss due to knocking combustion. Such methods may not be applicable for light knock detection, and are challenging to implement for efficient engine knock detection and control.29–31 Considering a wide variety of knock detection methods, ASTM D6424 32 is the only standard test procedure that covers ground based octane rating procedures for SI aircraft piston engines.
One effective knock detection method uses the knock related pressure peak compared to the pressure, which corresponds to normal combustion. The increased rate of pressure rise due to knocking combustion is another method for knock detection; however, the method is not accurate as the rate of pressure rise is affected by several knock independent factors. 33 The peak in-cylinder pressure can be used as another approach for knock detection. The drawback of this method is that it relies on pressure signal post-processing and is not accurate for light knock detection. 34 The minimum value of the pressure third derivative due to the abrupt curvature change corresponds to a sharp knock pressure peak is another method for knock detection.35,36 Abnormal heat release due to the end-gas auto-ignition affects the rate of heat release signal. By using the gradient of heat release rate at descent as the knock index, 37 end-gas auto-ignition can be detected at various intensities. Hence knock detection methods based on the rate of heat-release analysis are of interest; however, the method suffers from the high computational time that makes it difficult to be implemented for fast and real-time knock detection. 38
The knock detection methods based on frequency domain analysis are interesting as these methods can be easily developed and implemented for real-time knock detection and control.39,40 These methods work based on high-frequency pressure fluctuations that occur during knock as there is a strong correlation between the frequency amplitude and the amount of end-gas auto-ignition. Such knock detection methods usually work based on the maximum amplitude of the pressure oscillation frequency. Examples are the band-pass filtering of the pressure signal over the knock frequency range 41 ; Root Mean Square (RMS) of pressure oscillations, 42 discrete Wavelet transform (DWT) of the knock signal,43,44 and the integral of the absolute value of pressure oscillations. 45 A simple knock detection strategy can be developed by extracting the knock related pressure peak considering the maximum amplitude or the maximum peak-to-peak value of band-pass filtered pressure signal. 46 The DWT is another method for knock detection, and it provides the knock signal history at discrete scales within the crank angle window. Moreover, the DWT is computationally efficient, which makes it suitable for real-time knock detection. The DWT is constructed using the Multi-Resolution Technique (MLT) proposed in Mallat. 47 In this method, the signal is decomposed into a set of basis vectors of increasing scale resolution and decreasing time resolution. The MLT provides a signal analysis at different scales in which the frequency resolution is better for the low frequency at the expense of reduced time resolution and is coarser at higher frequencies but at a finer time resolution. This method applies to measured pressure signals in which low frequencies tend to develop and exist over a longer duration, whereas the high knock frequencies tend to exist for short bursts. Knock detection using DWT is of interest as it considers knock cyclic variability and identifies knocking cycles from normal cycles.43,48
Knock detection methods based on engine block vibration analysis are playing crucial roles in today’s engine spark timing control systems. These methods work based on the identification of the frequency range of knock induced vibrations followed by band-pass filtering of the vibration signal. 49 The frequency response methods explained above are implemented for knock detection. The only difference is that signal processing is performed on the signals generated from block accelerometers rather than piezoelectric pressure transducers. Joint time-frequency knock detection methods help to improve knock detection accuracy using vibration sensors.39,50 This measurement method has also been extended to the use of acoustic microphones for knock analysis. 33
Model-based knock detection methods are gaining attention with the possibility of integrating Field Programmable Gate Array (FPGA) for engine control.51,52 In this method, the end-gas auto-ignition is modeled with the solution of a detailed chemical kinetic mechanism.53,54 The drawback of this approach are: (1) it is computationally expensive, (2) accurate reaction mechanisms are not available for all fuels in the market, and (3) the development of reaction mechanisms for commercial fuels is not easy.55,56 This method becomes more computationally extensive when it is integrated with 3D computational fluid dynamics models, 57 where solving thousands of reactions and transporting the hundreds of related species between zones becomes impractical for realtime implementation. Data driven machine learning methods have also been explored for knock detection and emissions prediction, however, these methods require extensive engine testing and data collection for accurate predictions.58,59
Another simplified approach is to implement an empirical Arrhenius model coupled with Livengood-Wu integral for knock detection.60,61 For this purpose, Arrhenius model coefficients need to be tuned based on experimental measurements from rapid compression machines or shock tubes. Another technique is to tune the Arrhenius coefficients with the help of detailed chemical kinetics for different pressures, temperatures, and equivalence ratios if the reaction mechanism is known. The significant drawbacks of this method are (1) it is not able to accurately predict the Negative Temperature Coefficient (NTC) regime, and (2) the model accuracy reduces with the presence of Exhaust Gas Recirculation (EGR) and water injection used for advanced engine knock control.62,63 This technique has been used in literature for knock detection and control. 64 An alternative procedure is to use look-up tables65,66 instead of using the Livengood-Wu integral. The look-up tables are usually created based on the off-line solution of chemical reactions in a Constant-Pressure (CP) and Constant Volume (CV) reactors for a range of temperature, pressure, and fuel equivalence ratios. The model accuracy can be increased with adaptive parameter estimation schemes. 65 The model accuracy depends on the operating range that the model parameters are tuned. If the model parameters are correctly tuned, then the technique can be used for cycle-by-cycle knock detection and control.
The methods developed in the literature for knock detection have many similarities in the prediction of knock onset and intensity. 2 The goal of this work is not to develop a new knock detection method, but to focus on ASTM D6424 knock detection method used in general aviation, and compare it to the other practical methods developed in the literature: third derivative of pressure trace,35–37 and DWT.43,48 This analysis is performed based on Continental TSIO-520 six-cylinder engine measurements in an altitude chamber at the NRC. In-cylinder pressures and cylinder head temperatures were recorded for all cylinders and are used to calculate knock indexes. The knock analysis was conducted with a dynamic mixture lean-out where the air/fuel ratio was increased. During each mixture sweep, in-cylinder pressure and the altitude chamber data were collected. The engine is tested at high load operating points which are subject to detonation behavior. These operating points involve high intake manifold pressures. Engine operating temperatures and oil temperatures are kept at maximum allowable limits, while induction and cooling air temperatures are maintained at extreme hot day conditions for severe case testing. This work highlights the effects of pressure signal processing on the ASTM D6424 knock detection method and its robustness.
Experimental setup
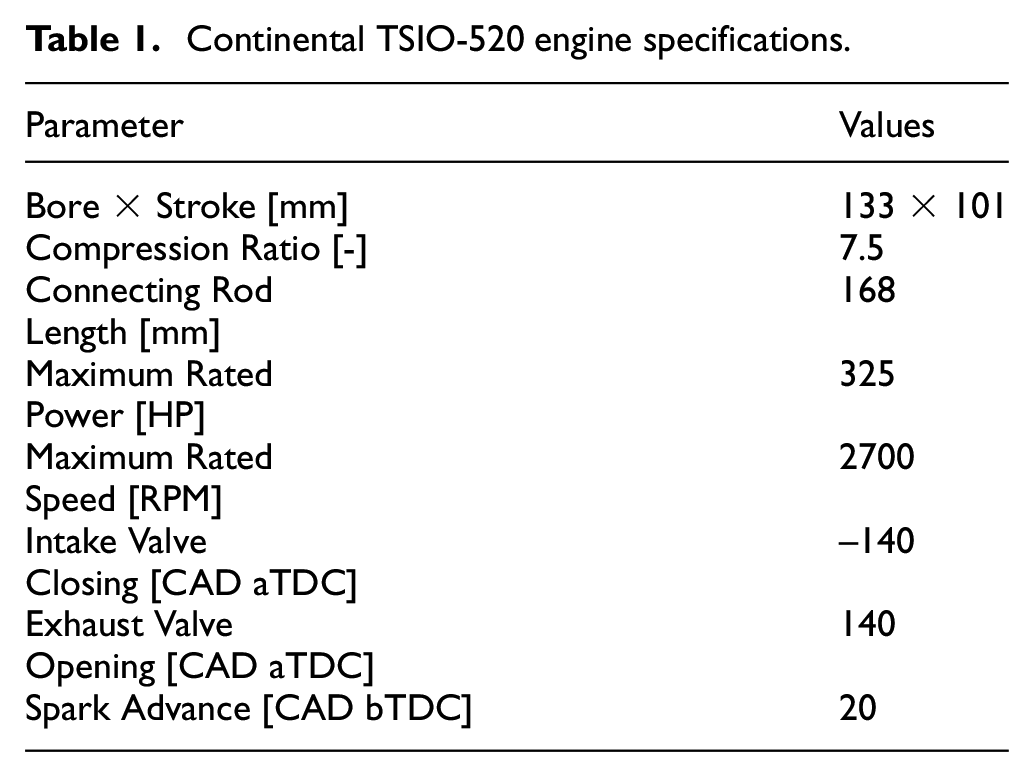
The experiments were performed on the Continental TSIO-520 six-cylinder, air cooled, horizontally opposed aircraft engine manufactured by Teledyne Continental Motors. 67 This engine is representative of engines used in many general aviation aircraft. The experiments were performed in the NRC altitude chamber and the chamber conditions were set for 12,000 ft. The altitude chamber provides conditioned air (pressure, temperature, and humidity) to simulate altitudes of up to 52,000 ft. A schematic of the NRC altitude chamber is shown in Figure 1. The engine specifications are listed in Table 1. AVL GH14D recessed mounted piezoelectric pressure transducers were installed in all six cylinders to acquire in-cylinder pressure. In-cylinder pressure, cylinder head temperatures, and exhaust gas temperatures were recorded and the resolution for in-cylinder pressure measurement was 0.1 crank angle degree (CAD). For knock analysis in this work, 700 cycles were collected for each steady-state operating point.
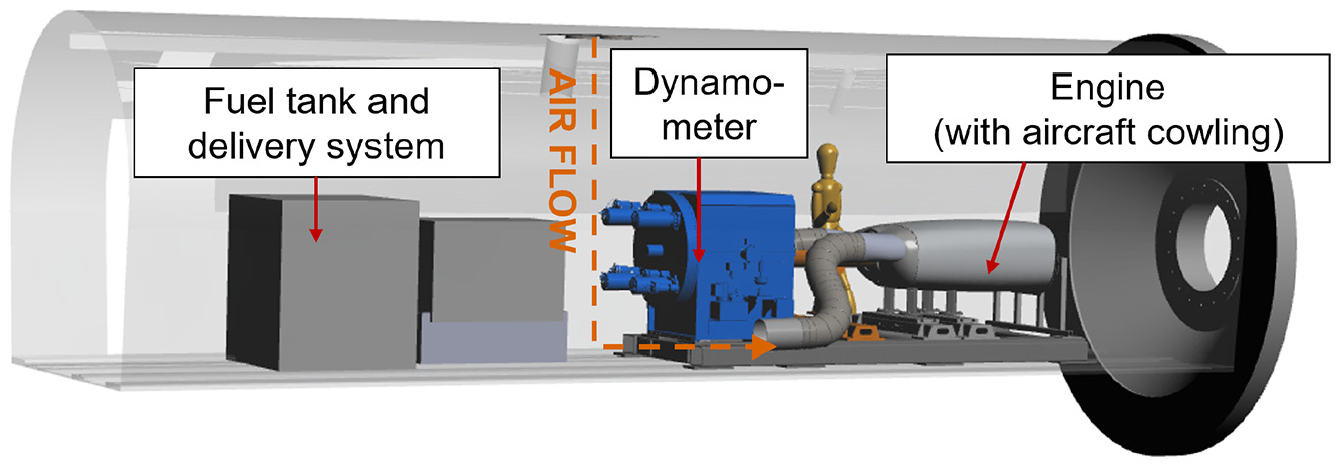
NRC altitude chamber layout.
Continental TSIO-520 engine specifications.
The test procedure is the modified version of the PAFI test procedure detailed in Federal Aviation Administration.
68
The PAFI test procedure has evolved from ASTM D6424.
32
The data collection was performed on the test stand to simulate take-off/maximum power and cruise conditions at 12,000 ft for two different engine speeds of 2450 and 2700 RPM as listed in Table 2. The extended version of this table is in the appendix, including the transient number (TR) which defines the specific measurement and detailed experimental conditions for take-off and cruise conditions. The engine was set at full rich (
Engine operating conditions for knock tests.
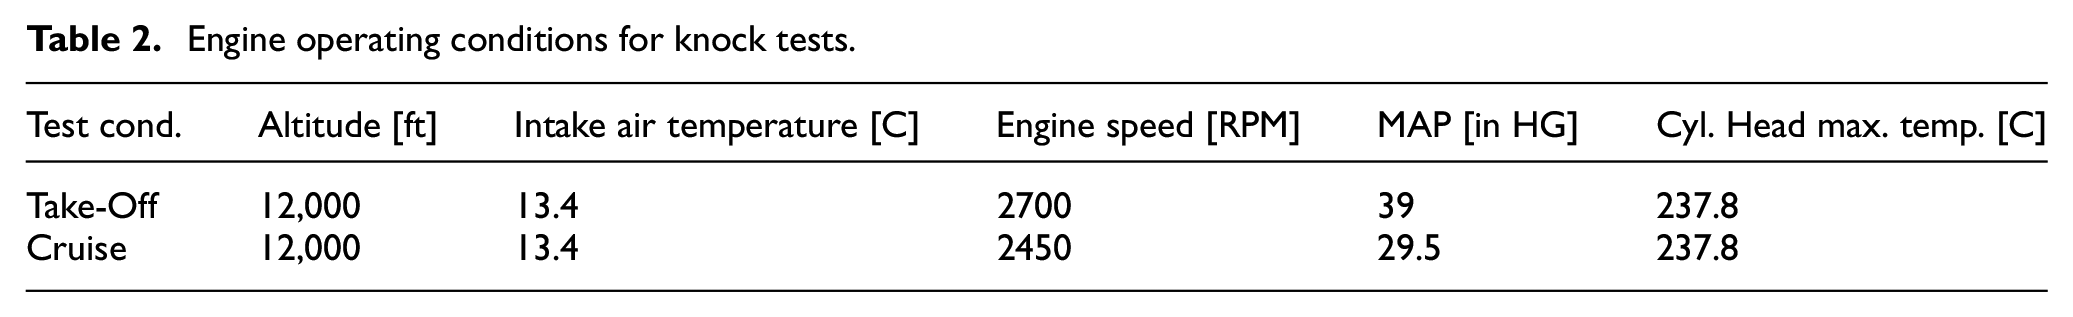
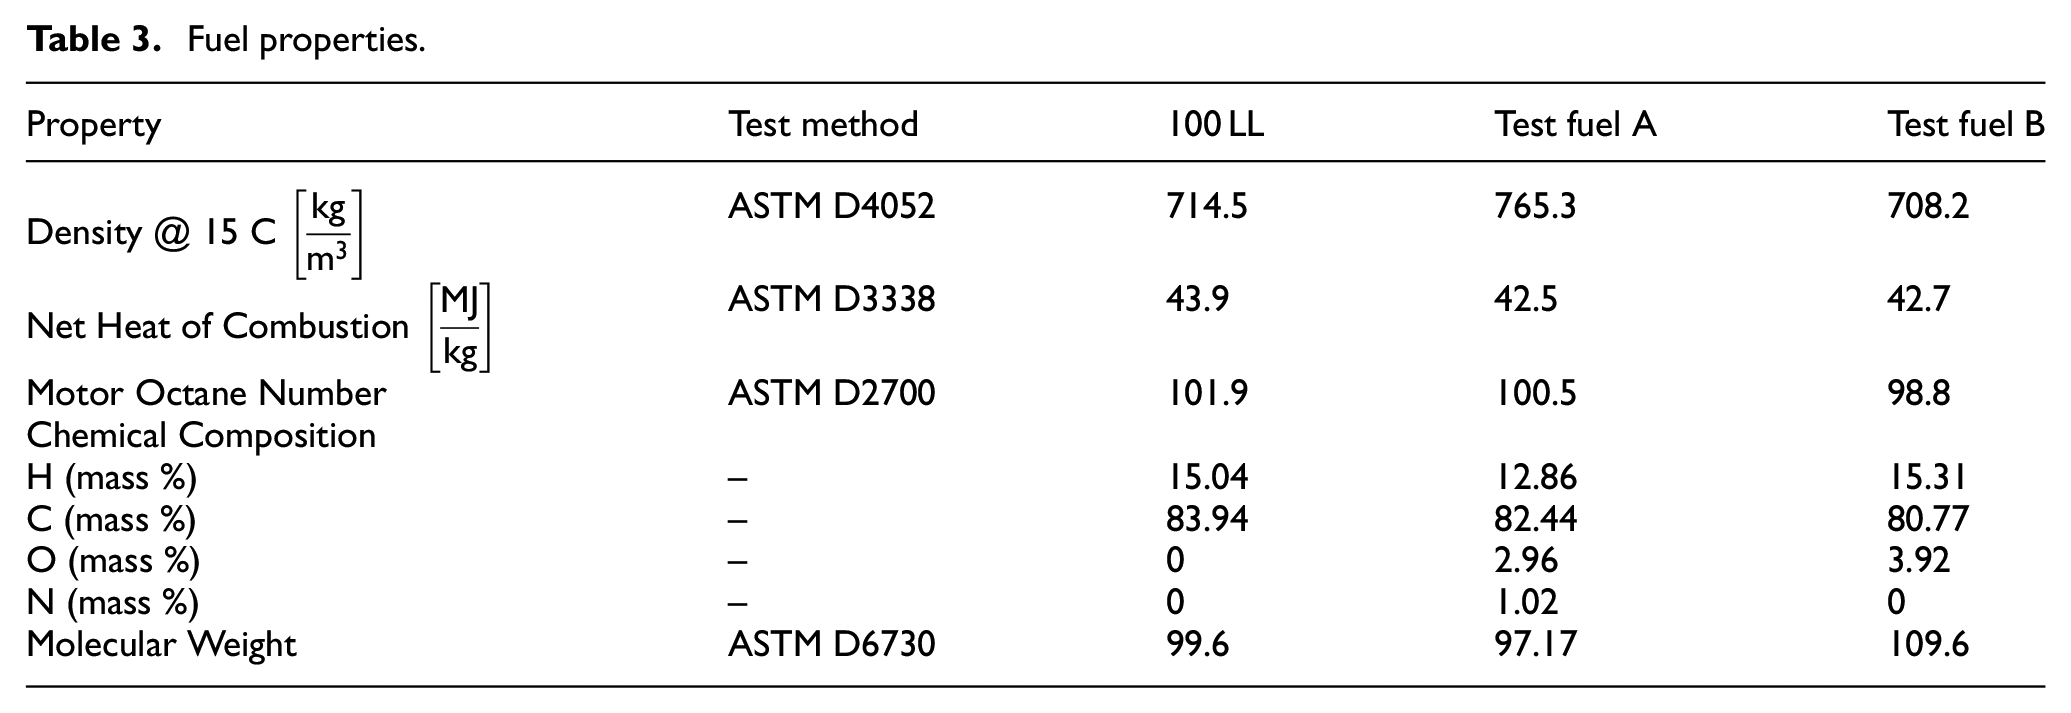
Exhaust gas temperature was measured using a K type thermocouple installed with manufacturer’s recommended location within 5 cm of the exhaust stack flange. Cylinder head temperatures were measured using J type thermocouples. The maximum cylinder head temperature was kept within 6°C of the manufacturer’s recommended maximum temperature limit (238°C). All cylinder head temperatures were maintained within 28°C of the specified maximum. These settings were maintained throughout the engine knock testing. The operating point is considered as a knocking operating point when 2% of the measured cycles have knock numbers of more than 10 bar. 68 The cylinder head and exhaust gas temperatures were monitored during the tests to avoid overheating. The locations of each sensor used in this work is shown in Figure 2. For all experiments in this work, the engine spark timing was constant at 20 CAD bTDC. 69 The tests were performed with 100 LL gas first and then repeated with unleaded fuel candidates A and B (see Table 3). Fuels A and B are the fuels selected amongst other fuel candidates to move on to the PAFI phase II program, which involved extensive full-scale engine and aircraft testing. These fuel candidates are being tested extensively for their high-octane, and high-heat-content to generate a comprehensive database to support the conversion of their ASTM test specification into production specifications. Both unleaded fuel candidates are oxygenated high octane number fuels and with fuel properties close to the 100 LL fuel. As fuel candidate B has the lowest octane number it is used for the filter design. The experiment parity was maintained over the examined operating conditions for each tested fuel by controlling the induction air properties, effective altitude and engine cooling to the same level throughout. It was determined that the sixth cylinder experienced the most significant knock of all the six cylinders. Therefore, all knock investigations presented in this work are for this cylinder.
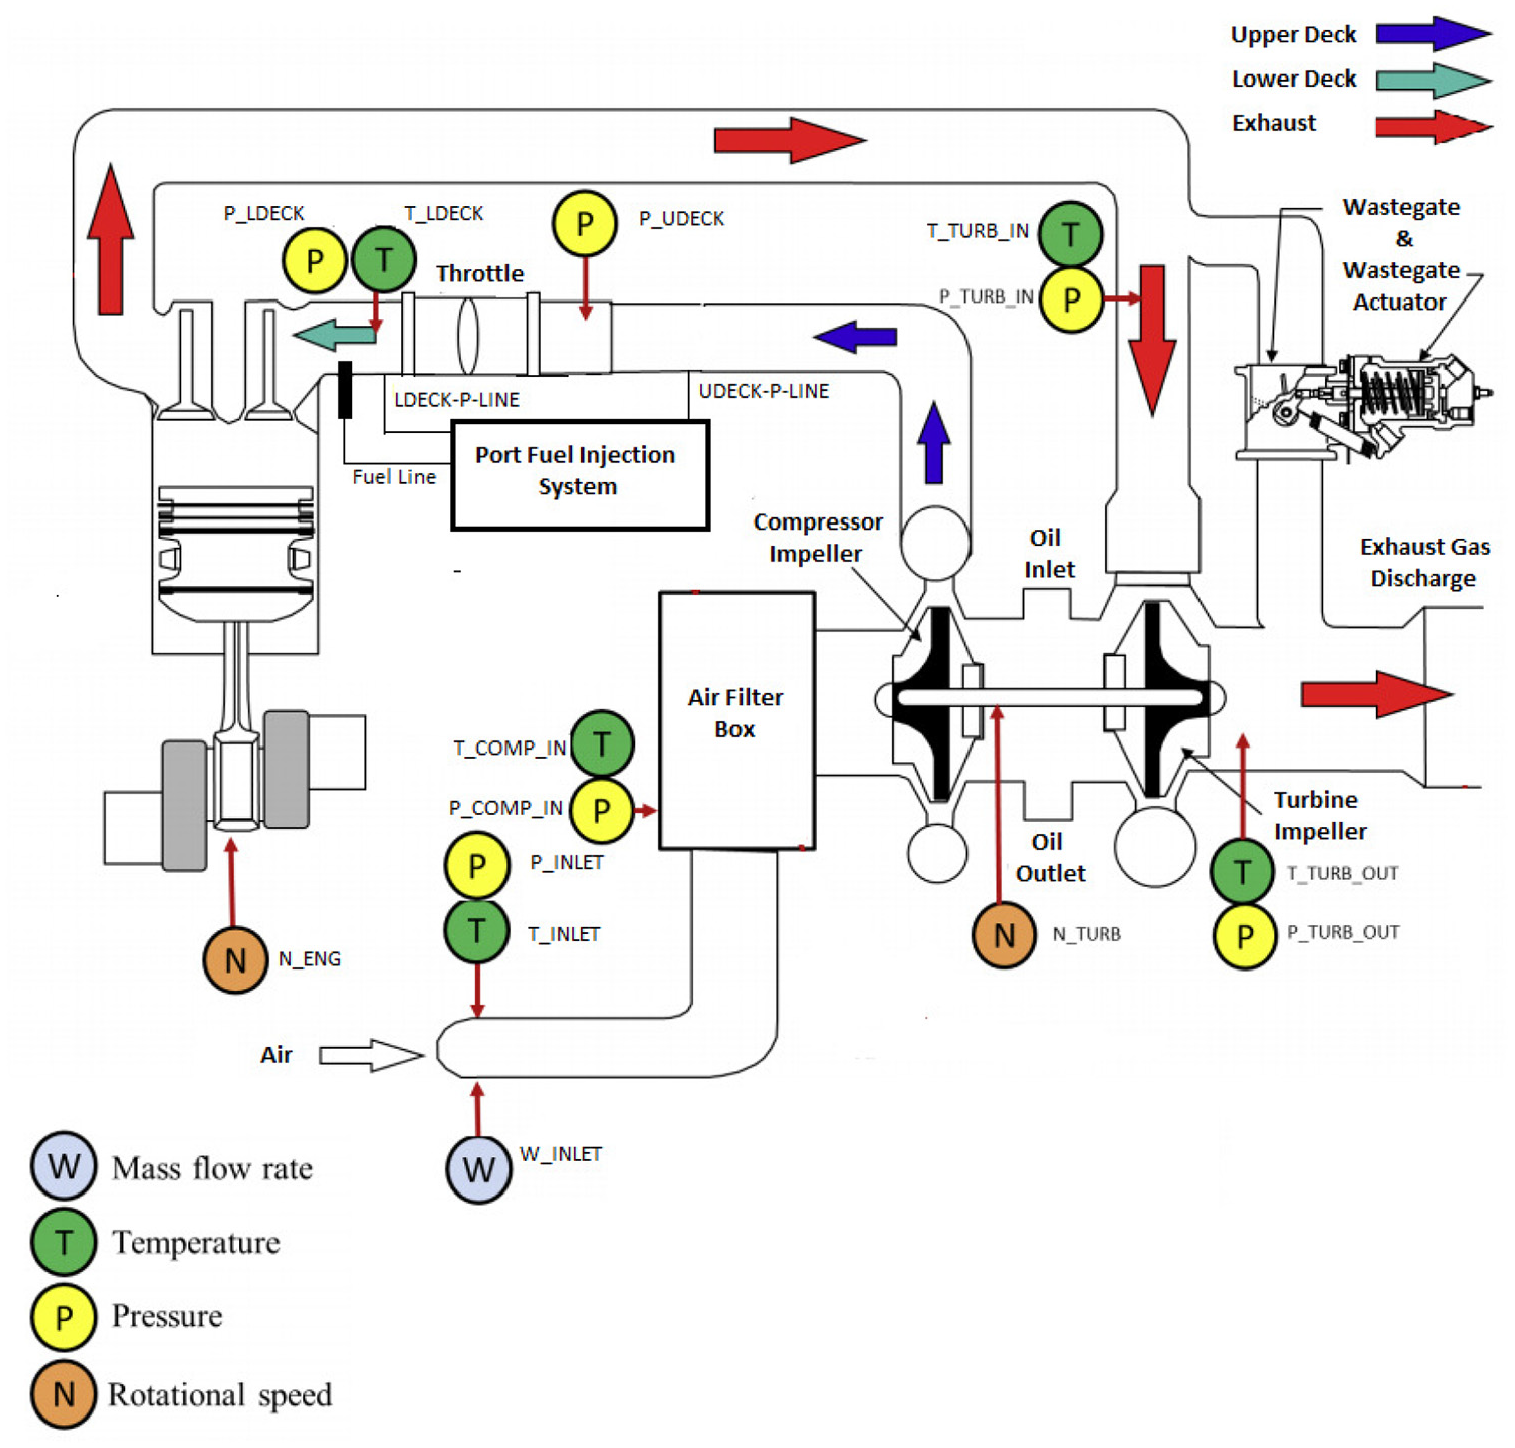
Engine measurement instrumentation. 70
Fuel properties.
Filtering effects
The signal processing of the measured in-cylinder pressure has a significant effect on the knock detection methods presented in this work. Not only are there various suggestions of which filter to use but also the suggestion not to use any filter but rather use the raw measured pressure signal for knock index calculations. The ASTM D6424 32 standard does not contain any recommendation regarding the post-processing of the measured pressure signal before calculating the knock index. In the PAFI test, 68 which has been developed from the ASTM D6424 standard, it is suggested that the raw pressure data is first conditioned using a digital Finite Impulse Response (FIR) low-pass filter with cutoff frequency of 15.1 kHz. The details of the filter design were not reported in Federal Aviation Administration, 68 which makes it difficult to compare the filter used in Federal Aviation Administration 68 to the one designed and implemented in this work. The designed filter will then be referenced to the unfiltered data.
Filter design
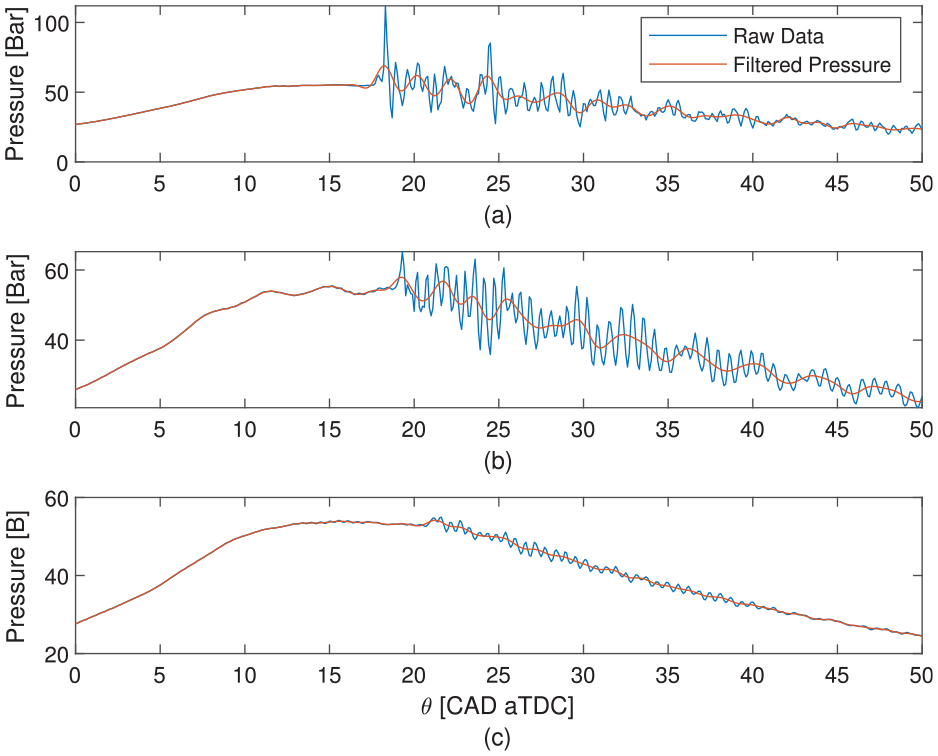
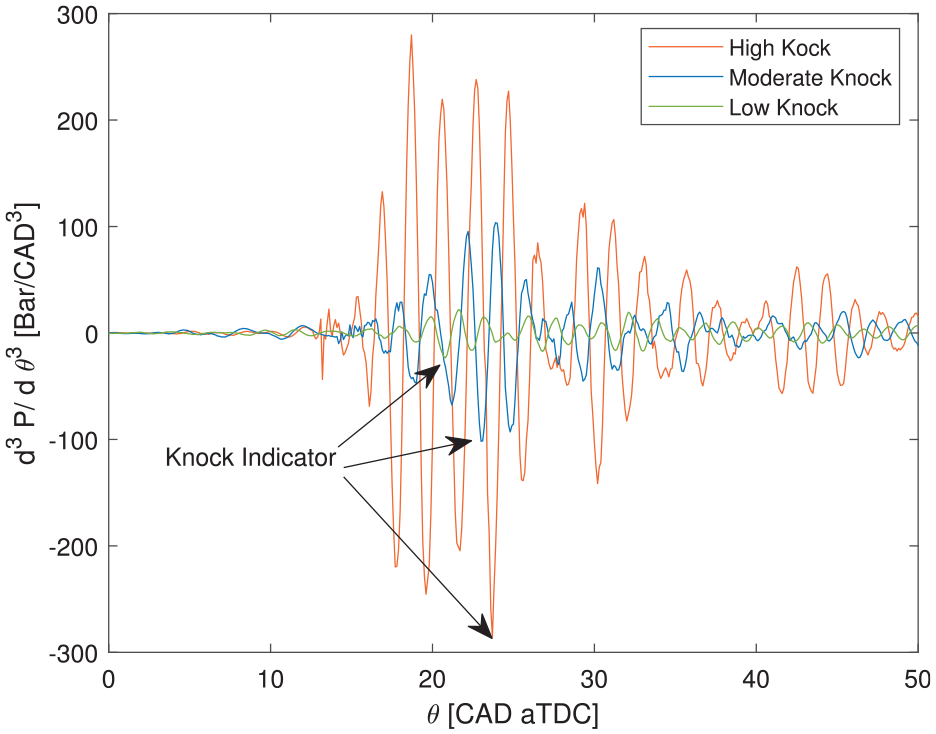
The measured in-cylinder pressure versus crank angle for low, moderate, and high knock operating cycles are shown in Figure 3. The measured moderate and high knock pressure signals show high-frequency pressure oscillations near maximum in-cylinder pressure. The location of the pressure transducer has a significant effect on the frequencies of oscillations, and the actual in-cylinder pressure oscillation intensity could be different from the measurements. 43 In this work, the in-cylinder pressure transducers were mounted vertically in the cylinder head between the intake and exhaust valves according to Teledyne Continental recommendations.
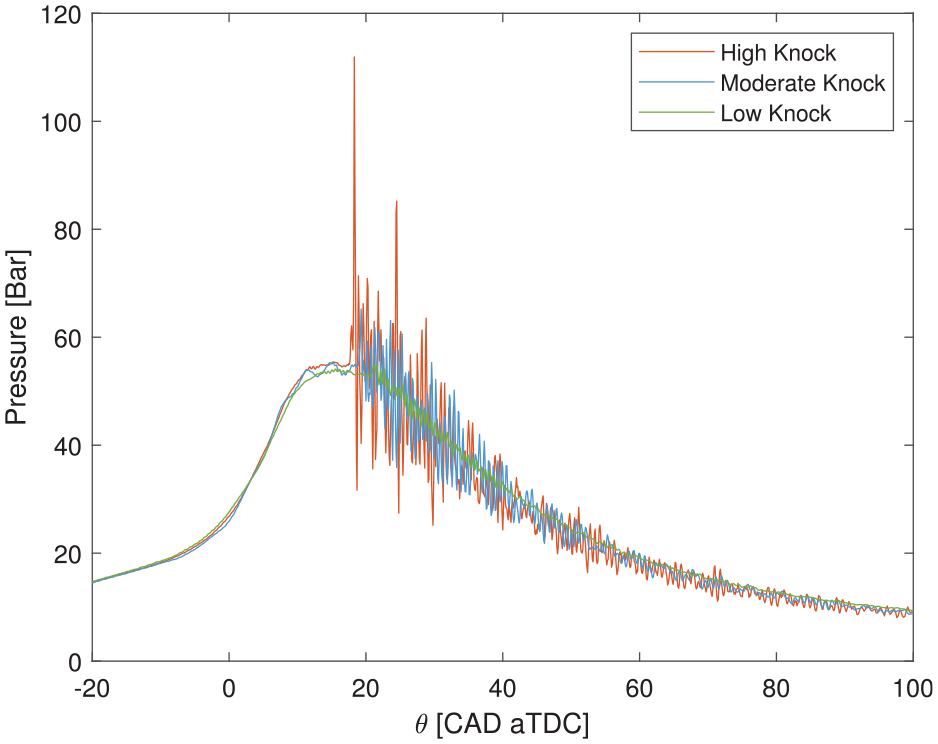
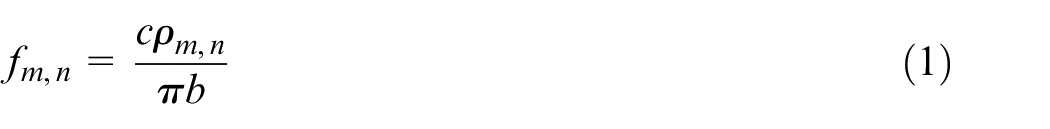
The high-frequency oscillations are analyzed from 20 CAD bTDC (spark timing) to 50 CAD aTDC. Acoustic theory 70 is used to determine the frequency of the pressure oscillations induced by engine knocking. The modes of oscillations are calculated using Draper’s Equation43,49,70 as
where
Frequency modes in TSIO-520VB engine cylinder.
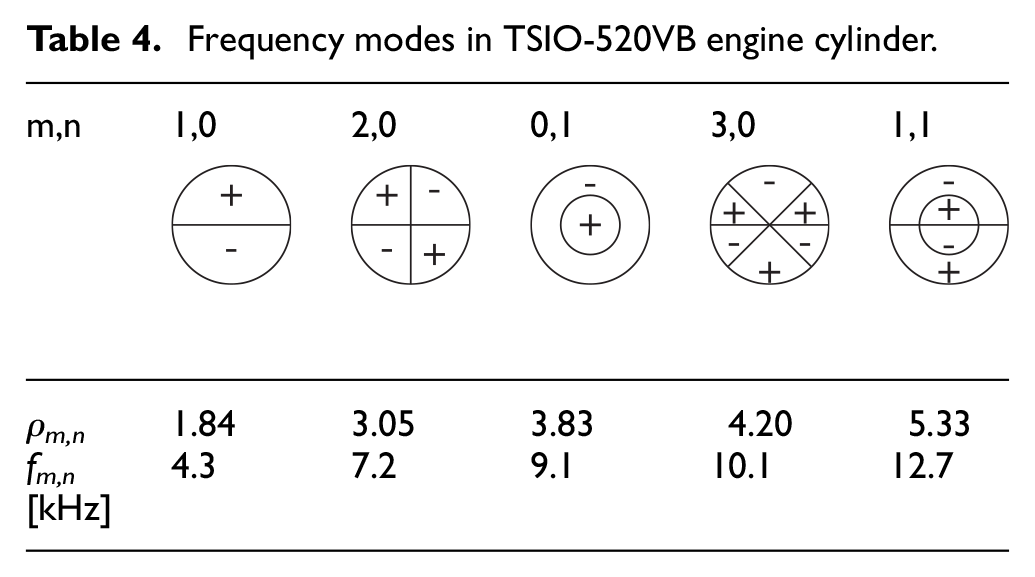


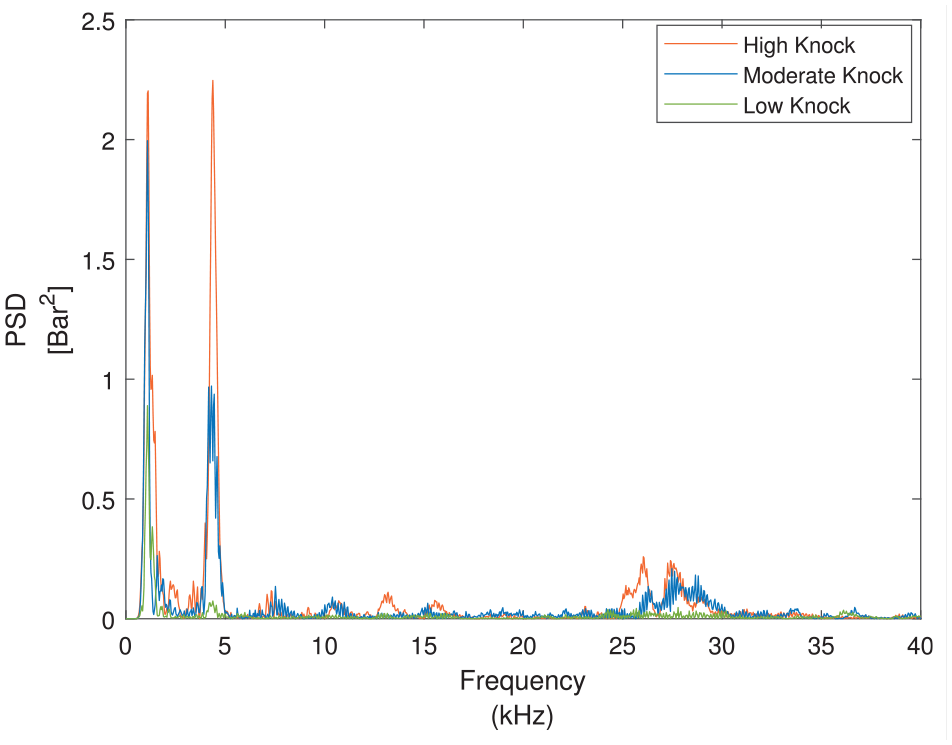
The PSD of the pressure signal for low, moderate, and high knock operating conditions is shown in Figure 4. Comparing the peak of the knock and high-knock PSDs to the circumferential frequencies predicted by the acoustic analysis in Table 4 indicates that the peaks at 4.2–4.6 kHz coincide with the first circumferential mode (
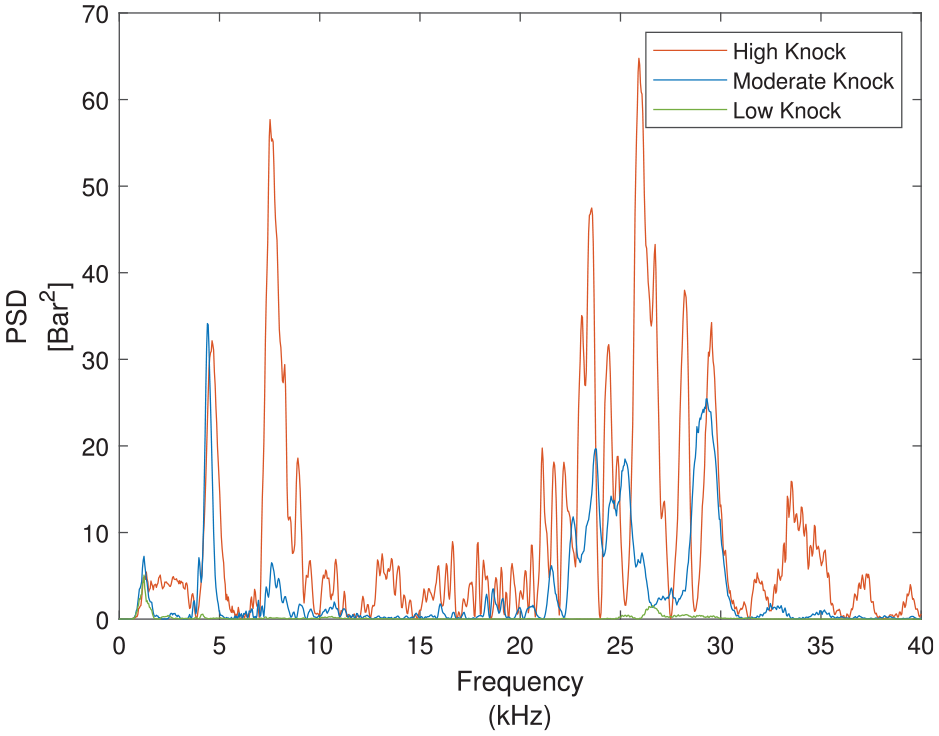
In order to define low and high cut-off frequencies of the band-pass filter, PSD of the high knock pressure signal is calculated using the raw measured in-cylinder pressure signal. The filter is a fifth-order Butterworth high-pass filter with a cut-off frequency of 3.8 kHz. The PSDs of the pressure signals are shown in Figure 4 for the take-off conditions listed in Table 2. A fifth-order Butterworth band-pass filter is then designed with the pass-band frequencies of 3.8–40 kHz to include those high frequencies for knock calculations. This filter is different from the FIR filter designed in Federal Aviation Administration. 68 The filter performance is shown in Figure 5. The filter performance is acceptable, and the filtered pressure traces are smooth, specifically in the early stages of the knock event (15–25° aTDC).
The ASTM standard requires that in addition to the high load take-off operating condition the cruise operation must also be checked for knock intensity. The PSD values of the high, moderate, and low knock pressure signals for cruise conditions is shown in Figure 6. The cruise condition operating point used to calculate the PSD values are listed in Table 2. Compared to the PSDs of the take-off high-knock pressure signals shown in Figure 4, the first circumferential mode is the dominant mode for cruise condition. For this reason, the upper cut-off frequency of the band-pass filter used for knock index calculation can be reduced to 10 kHz for cruise conditions. This is expected as the cruise condition is a lower load operating condition compared to take-off.
Impact of down-sampling
Section A1.1.3 of the ASTM D6424
32
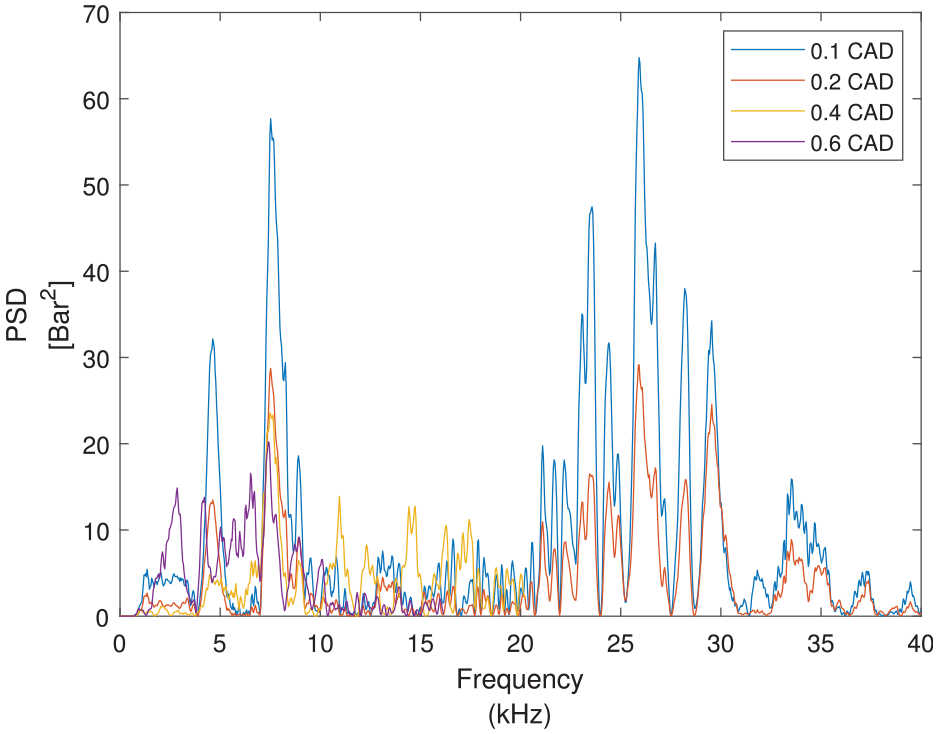
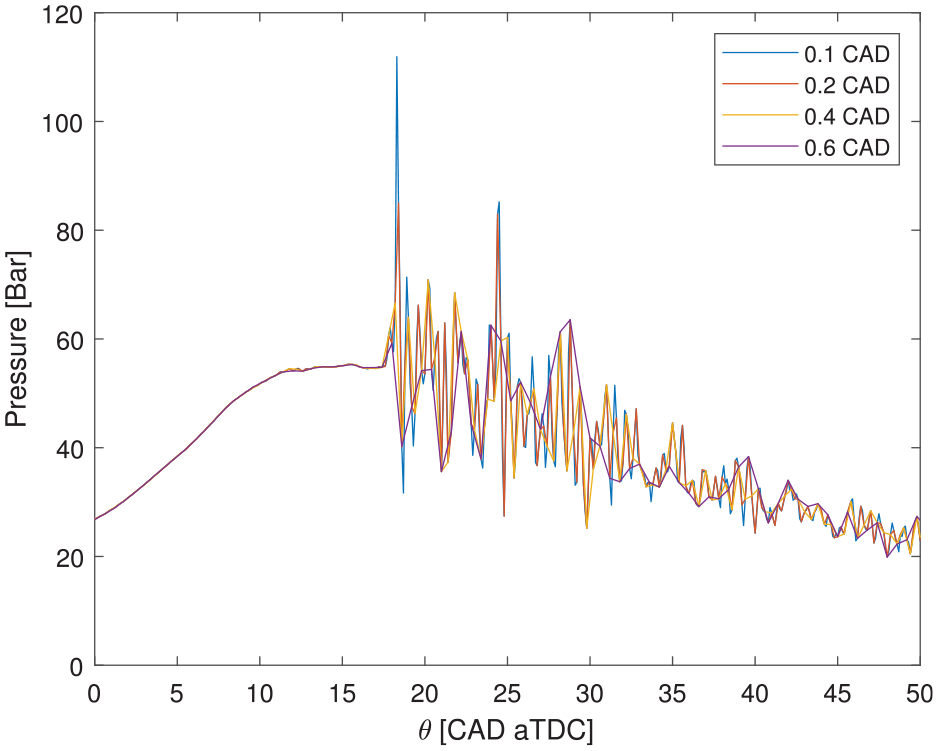
recommends a data sampling interval of 0.4 CAD. To reduce the computational speed requirements of the knock analysis it is valuable to see if the sample rate can be reduced. This investigation is done by down-sampling the 0.1 CAD measured data. The effects of down-sampling on the knock analysis are detailed first. Figure 7 shows the down-sampled high knock pressure single-cycle data with 0.1, 0.2, 0.4, and 0.6 CAD resolution resulting in sampling frequencies of 162, 81, 40.5, and 32.4 kHz. Figure 8 shows the corresponding down-sampled pressure traces at an engine speed of 2700 RPM. The content of the pressure signal in the 21–31 kHz range (see 0.1 CAD (162 kHz) sampled data) is aliased to the 10–20 kHz range in the 0.4 CAD (40.5 kHz) sampled data, and to the 2–10 kHz range in the 0.6 CAD (32.4 kHz) sampled data. To resolve the power spectral density of the data up to
Filtering effects on ASTM D6424 standard
Knock detection in aviation piston engines is typically performed based on ASTM D6424. 32 In the ASTM D6424 standard, the knock index is determined by comparing the absolute relative pressure changes of the expansion period to the compression period. The knock index is calculated 32 as
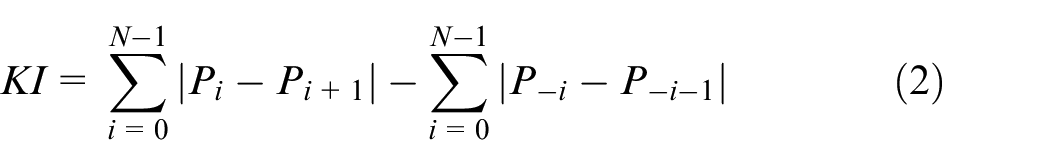
where
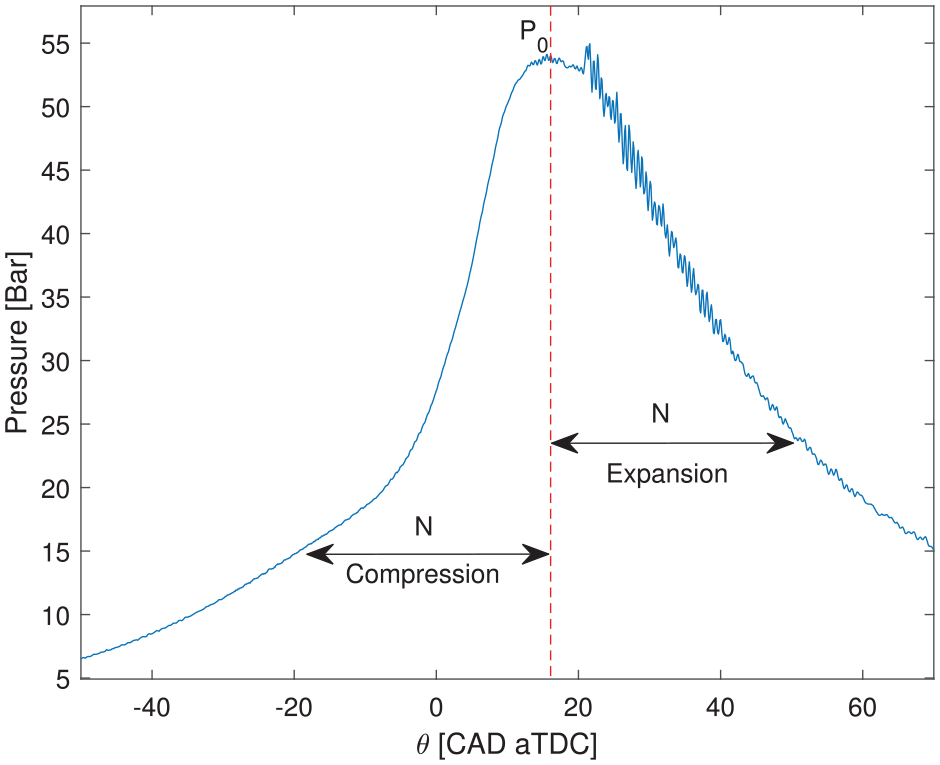
Pressure signal with the location of
The ASTM D6424 standard
32
does not contain any recommendation regarding the post-processing of the collected pressure for knock calculations. For at least some conditions, this leads to inaccurate knock estimation. The filtering effects on the knock magnitudes calculated based on ASTM D6424 are discussed for the unleaded fuel B first. The normalized probability density estimate of the ASTM knock numbers calculated based on the unfiltered pressure trace is compared to the ones calculated based on filtered pressure signals in Figure 10. The normalized PDE,
where
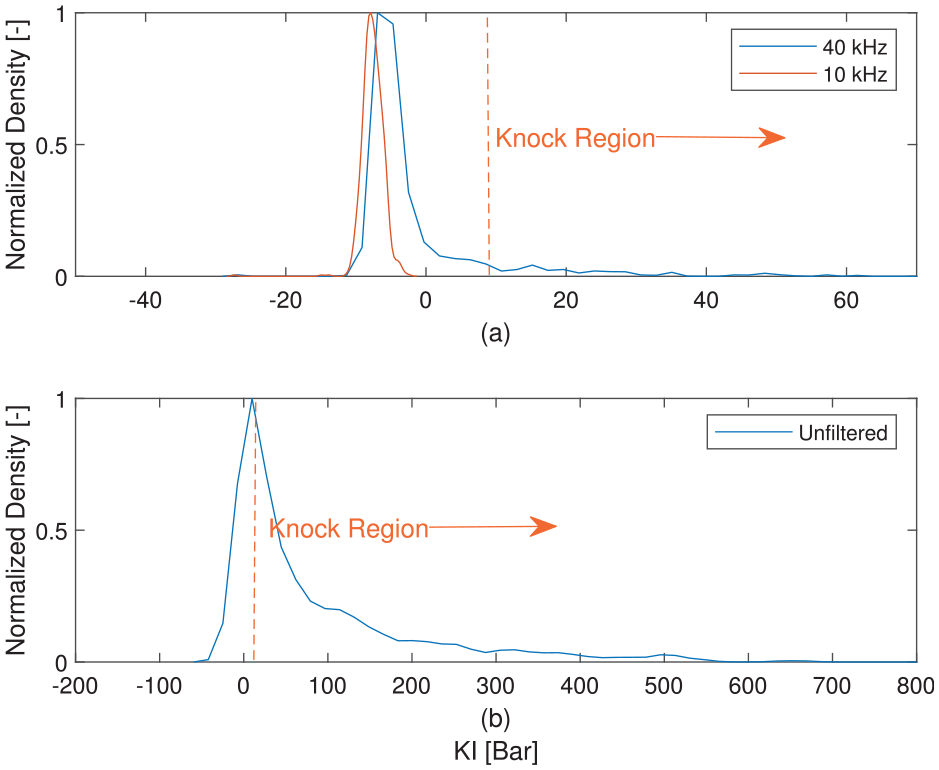
Knock analysis based on unfiltered in-cylinder pressure concludes that 70% percent of the measured cycles experience knock (ASTM knock index greater than 10), as seen in Figure 10(b). However, examining the data closely it is known that having knock in 70% of measured cycles is not correct.
Figure 10(a) shows the normalized probability density estimate using the in-cylinder pressure trace filtered with the band pass filter with a 10 kHz upper cut-off frequency. This filter is designed based on cruise PSD analysis. The results using this filter indicate that the take-off operating point (see Table 2) is knock free, while the observations indicate this is an operating point experiences high knock cycles. Next, the in-cylinder pressure traces are filtered using the Butterworth low-pass filter with a 40 kHz cut-off frequency which indicates only 10% of the measured cycles are knocking cycles (see Figure 10). This confirms the results presented above for the filter design, where it is shown that frequencies up to 40 kHz are required for accurate knock detection for take-off operation. Using the cut-off frequency of 40 kHz provides a realistic percentage of knocking cycles and shows that filtering has a significant effect on the knock index when using the ASTM D6424 standard.
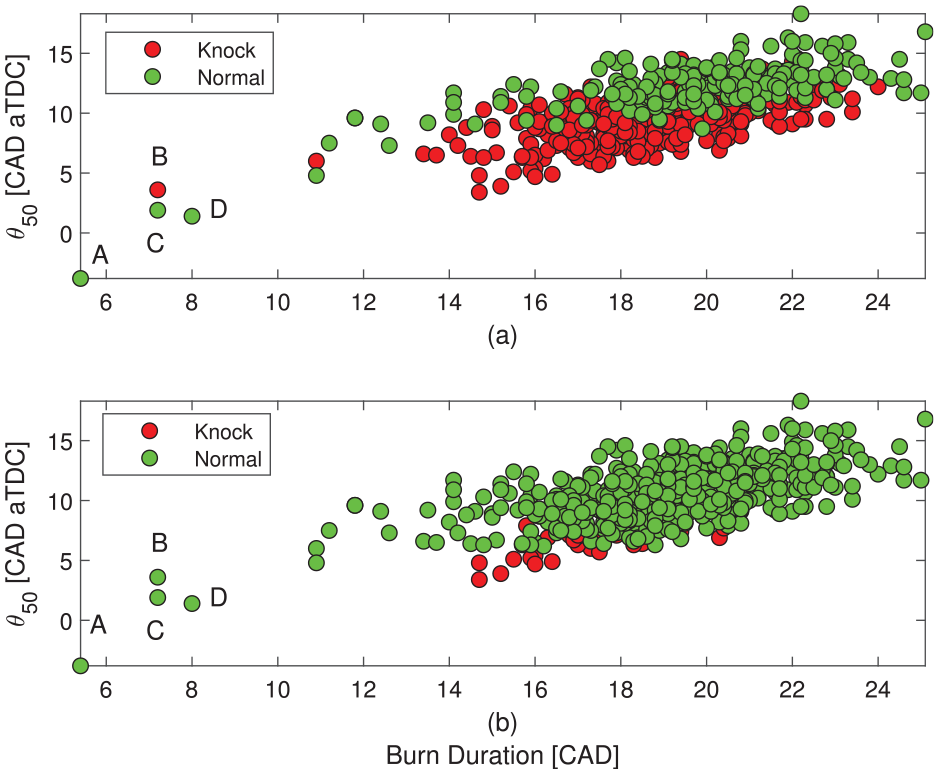
Figure 11 shows the combustion timing,

where
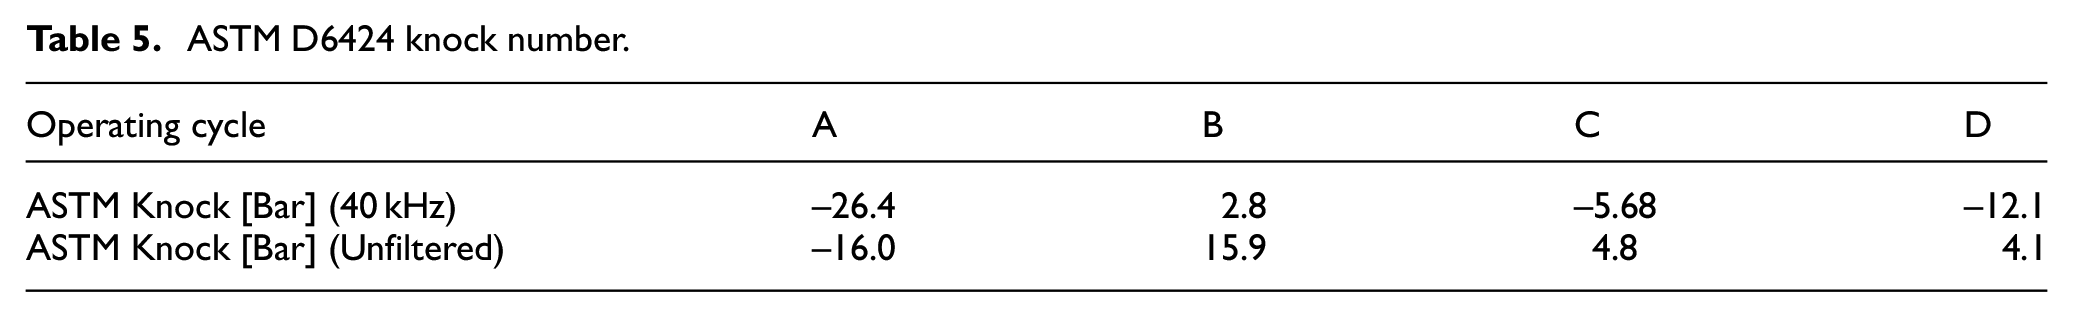
ASTM D6424 knock number.
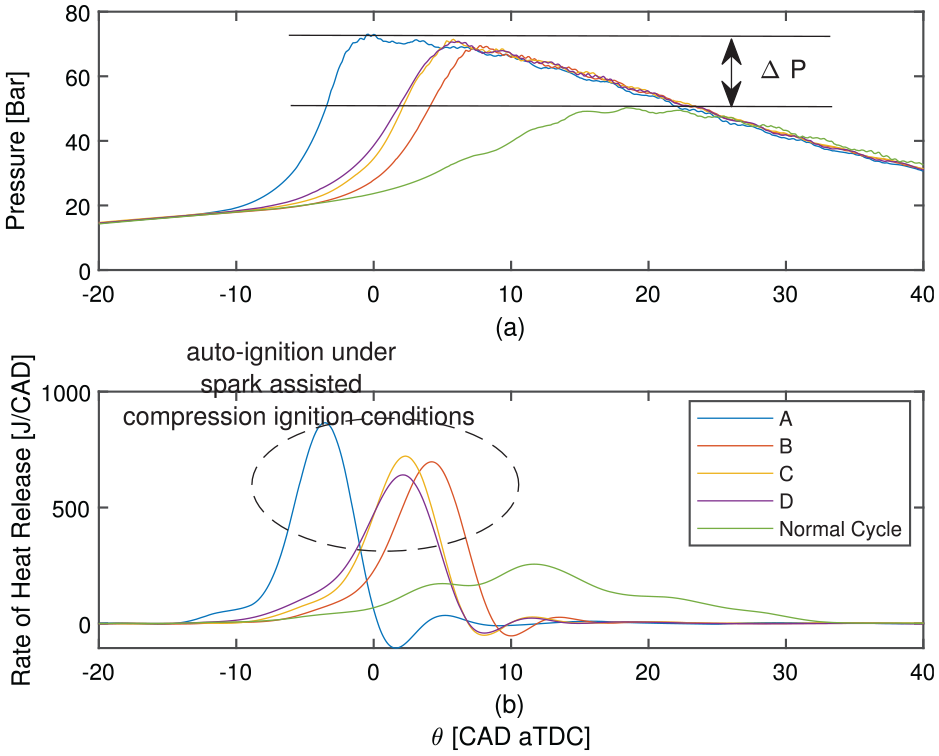
Auto-ignition under spark assisted compression ignition conditions usually leads to high in-cylinder pressure and temperatures. This combustion mode is different from a knock, or super-knock
3
and the mechanism underlying this mode of combustion without knocking is not well known.73,74 This mode of combustion can be distinguished from normal SI combustion using the rate of heat release, rate of pressure rise, burn duration, and maximum in-cylinder pressure as depicted in Figure 12. Figure 12 shows the pressure trace and heat release rate of the four operating cycles selected in Figure 11 and compared to a normal operating cycle. The most significant difference between these cycles and the normal cycle is the amplitude of the rate of pressure rise at combustion onset, maximum in-cylinder pressure, the maximum rate of heat release, and burn duration. The magnitude of the maximum pressure signal for cycle A is almost two times the magnitude of the maximum pressure of the normal cycle (
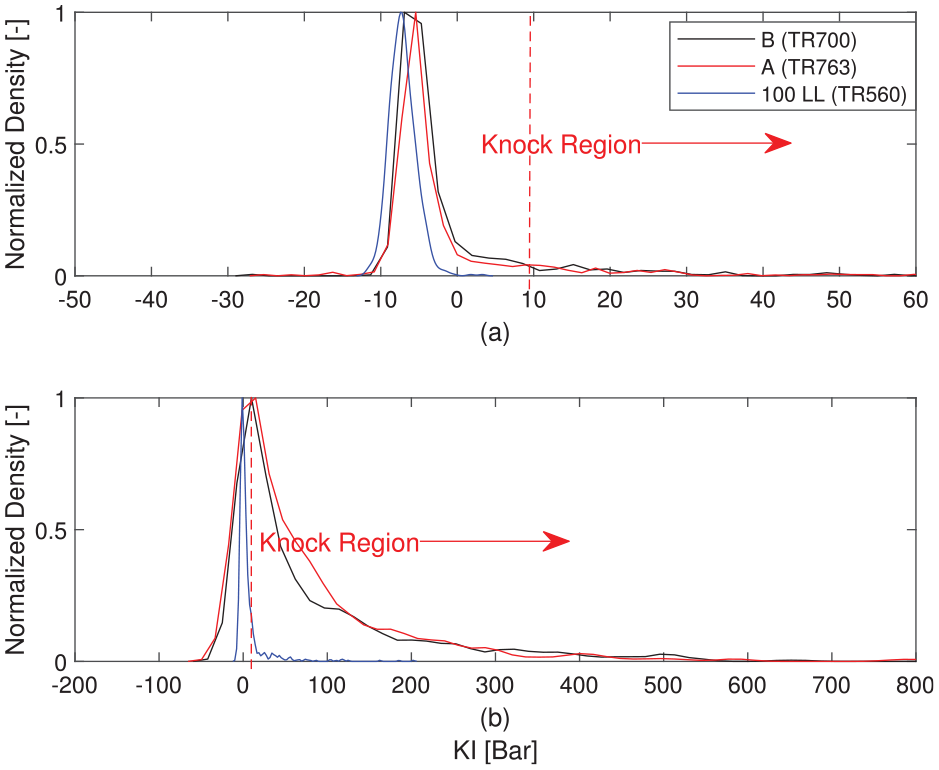
Next, the fuel type effects on knock distribution and intensity of a heavy knock take-off operating point are investigated. Figure 13 shows the normalized probability density estimate of the ASTM knock number for the high knock operating points tested with the fuels listed in Table 3. As observed, fuel types A and B show a similar knock distribution, which is both higher than the reference 100 LL knock intensity. The operating points shown in Figure 13 are collected for take-off (see Table 2) at same condition except for
Experiment – normalized probability density estimate of the ASTM Knock number calculated based on (a) fifth-order Butterworth low-pass filtered pressure signal with 40 kHz cut-off frequency, and (b) unfiltered pressure signal (see take-off Table 2, Table A.1-TR560, Table A.3-TR763, Table A.5-TR700).
Performance characteristics (averaged values).
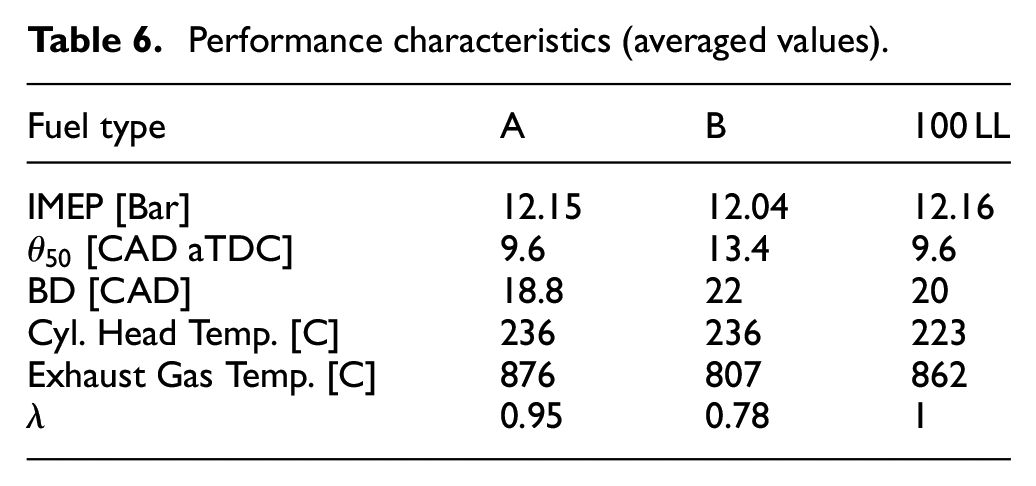
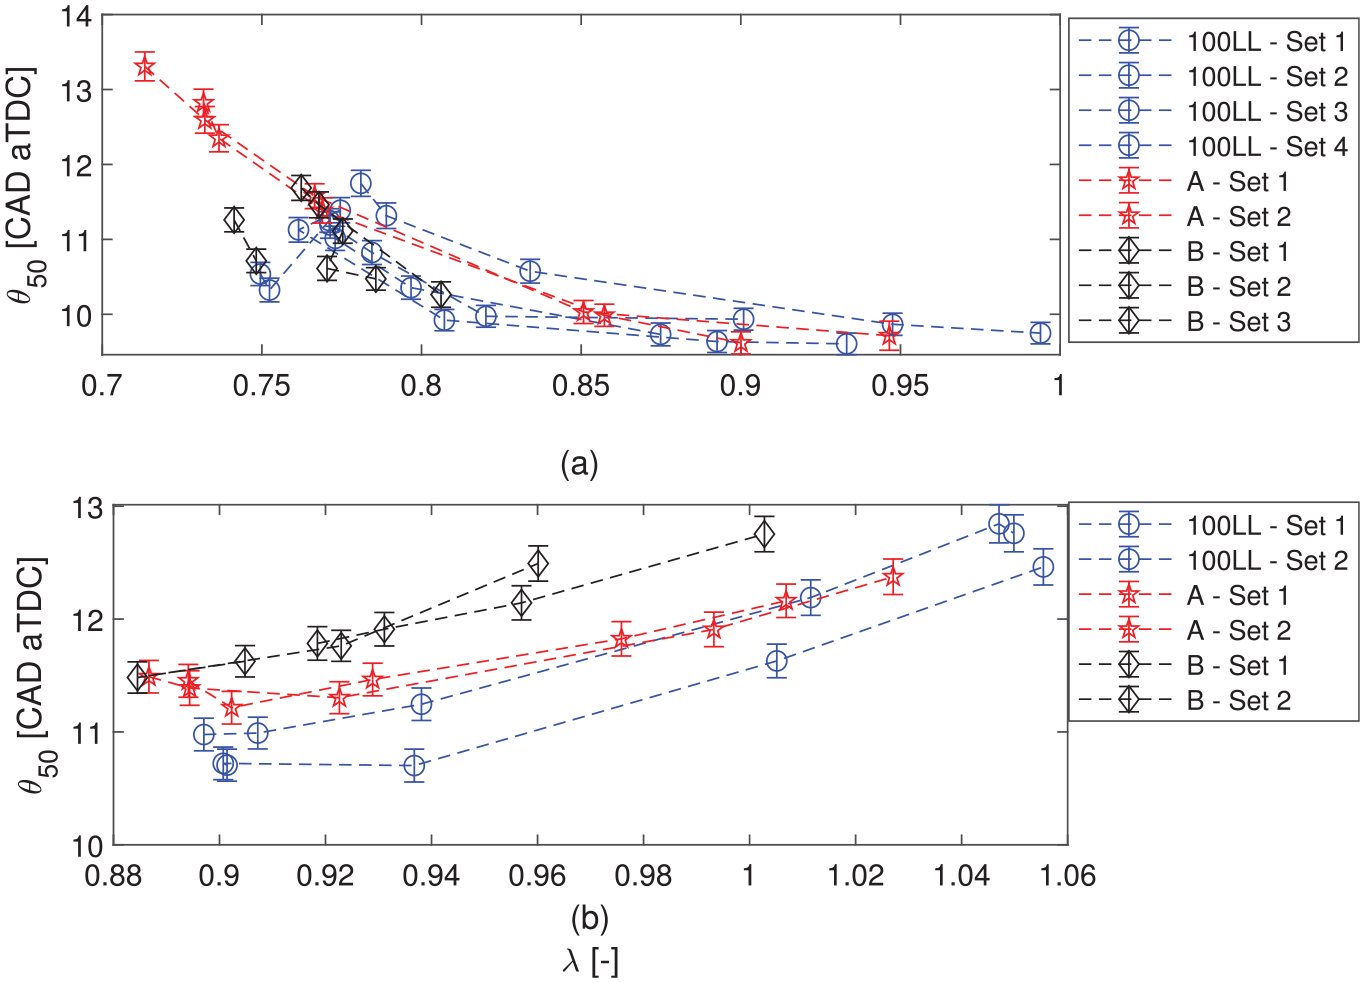
Figure 14 shows the combustion timing vs burn duration for the operating points investigated in Figure 13. The 95% probability of the combustion timing versus burn duration for each operating point is calculated and shown on the same figure. The results indicate that the distribution of cycles for the 100 LL fuel presents a tighter grouping, which could be indicative of the more predictable behavior of the fuel regarding combustion timing and burn duration. Fuel A presents a wider distribution, pointing toward a more correlative relationship between the two variables. The fuel B behavior seems to be in between the other two. Fuels A and B have a similar combustion timing and burn duration distributions, while the 100 LL fuel distribution is less compared to fuels A and B. The Pearson Correlation Coefficient (PCC) of fuel A is relatively high, while the PCC value for the 100 LL has dropped considerably. The PCC value for fuel B is also less than fuel A, but higher than 100 LL. Looking now at the aspect ratio of both the combustion timing and burn duration distributions, which is a metric of how aligned the groupings are, a higher aspect ratio was observed for the fuel A. These results indicate that the level of variation of the flame propagation process varies with the fuel composition, which directly affects the knock intensity level.
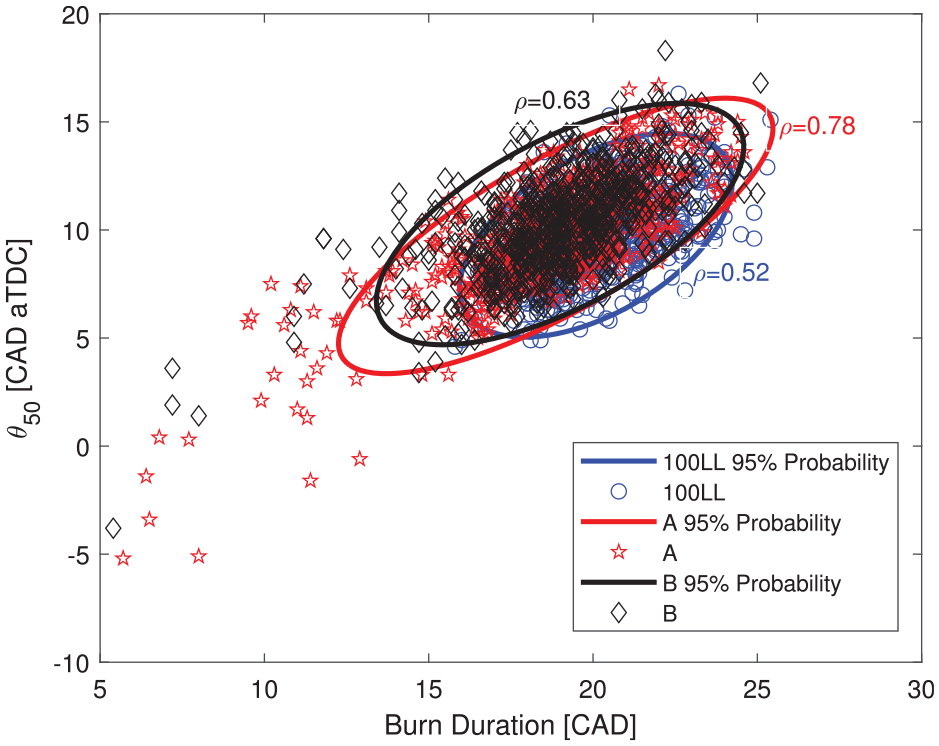
Combustion timing versus burn duration for operating points shown in Figure 13.
The ASTM knock detection robustness is investigated next. The ASTM knock values based on unfiltered, 10 kHz and 40 kHz cut-off frequency filtered cylinder pressure are shown in Figure 15. The ASTM knock values calculated based on the unfiltered and filtered pressure signals using a fifth-order Butterworth low-pass filter with 40 kHz cut-off frequency can detect the cycles with high knock numbers; however, with different magnitudes. The
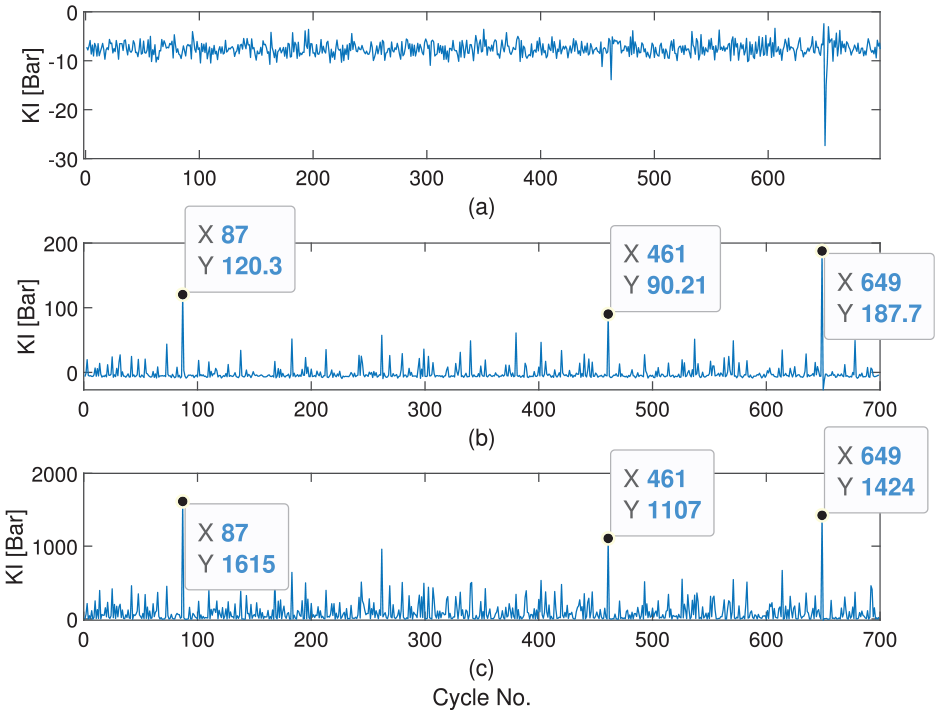
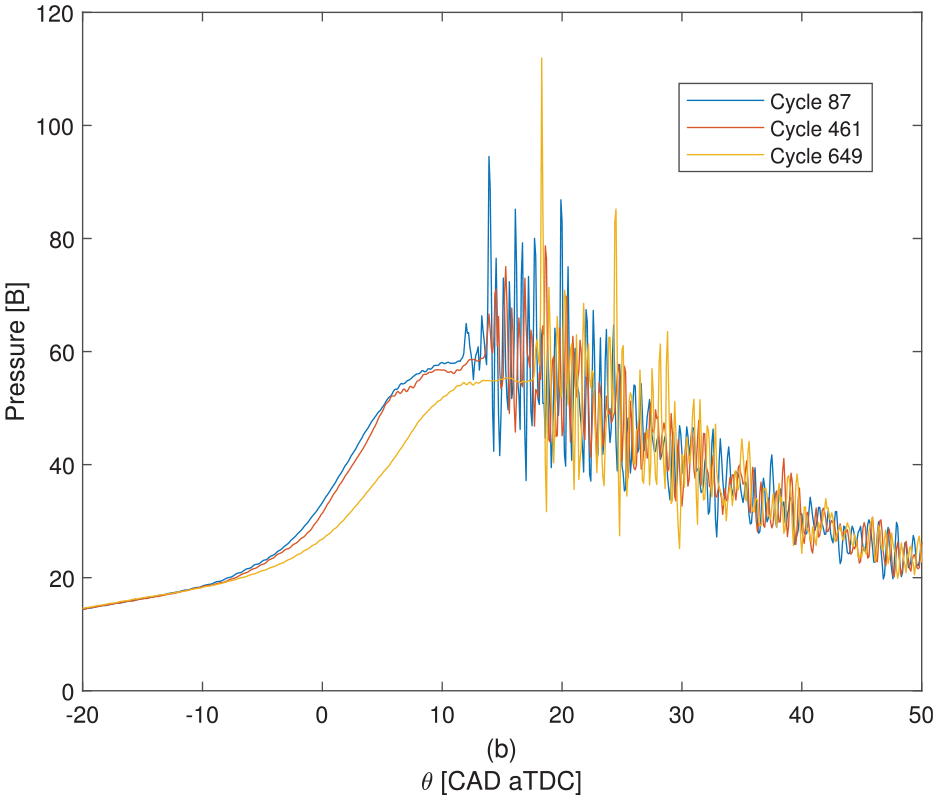
The ASTM knock values calculated based on a low-pass filtered pressure signal with 10 kHz cut-off frequency detects this operating point as a normal operating point. As shown in Figure 16, cycles 87, 461, and 649 are knocking cycles while Figure 15(a) demonstrates these cycles as knock-free cycles. Therefore, the ASTM knock numbers based on the low-pass filter with 10 kHz cut-off frequency failed to detect the known knocking cycles 87, 461, and 649 as cycles with high knock intensities.
This shows that the filtering of the pressure signal considerably changes the ASTM knock values and the knock detection results. These observations confirm that current ASTM D6424 32 standard requires modification to allow for accurate knock index calculation when using new unleaded fuels. The current standard of not filtering the cylinder pressure, results in over detection of knocking cycles with these two new aviation fuel candidates tested. In addition, the method is incapable of detecting cycles with auto-ignition under spark assisted compression ignition conditions experienced with unleaded fuels.
Mixture sweep knock test results
The calculated ASTM knock numbers based on a fifth-order Butterworth low-pass filter with a cut-off frequency of 40 kHz and the knock numbers calculated based on unfiltered pressure signals are shown in Figures 17 to 19 for take-off and cruise mixture lean-out experiments, respectively. The engine was set at full rich for each operating condition first, and the fueling rate was reduced gradually until knock intensity exceeds the specified limit defined in ASTM D6424, 32 and PAFI. 68 The operating points collected for these experiments are listed in Tables A.1–A.6 in the Appendix.
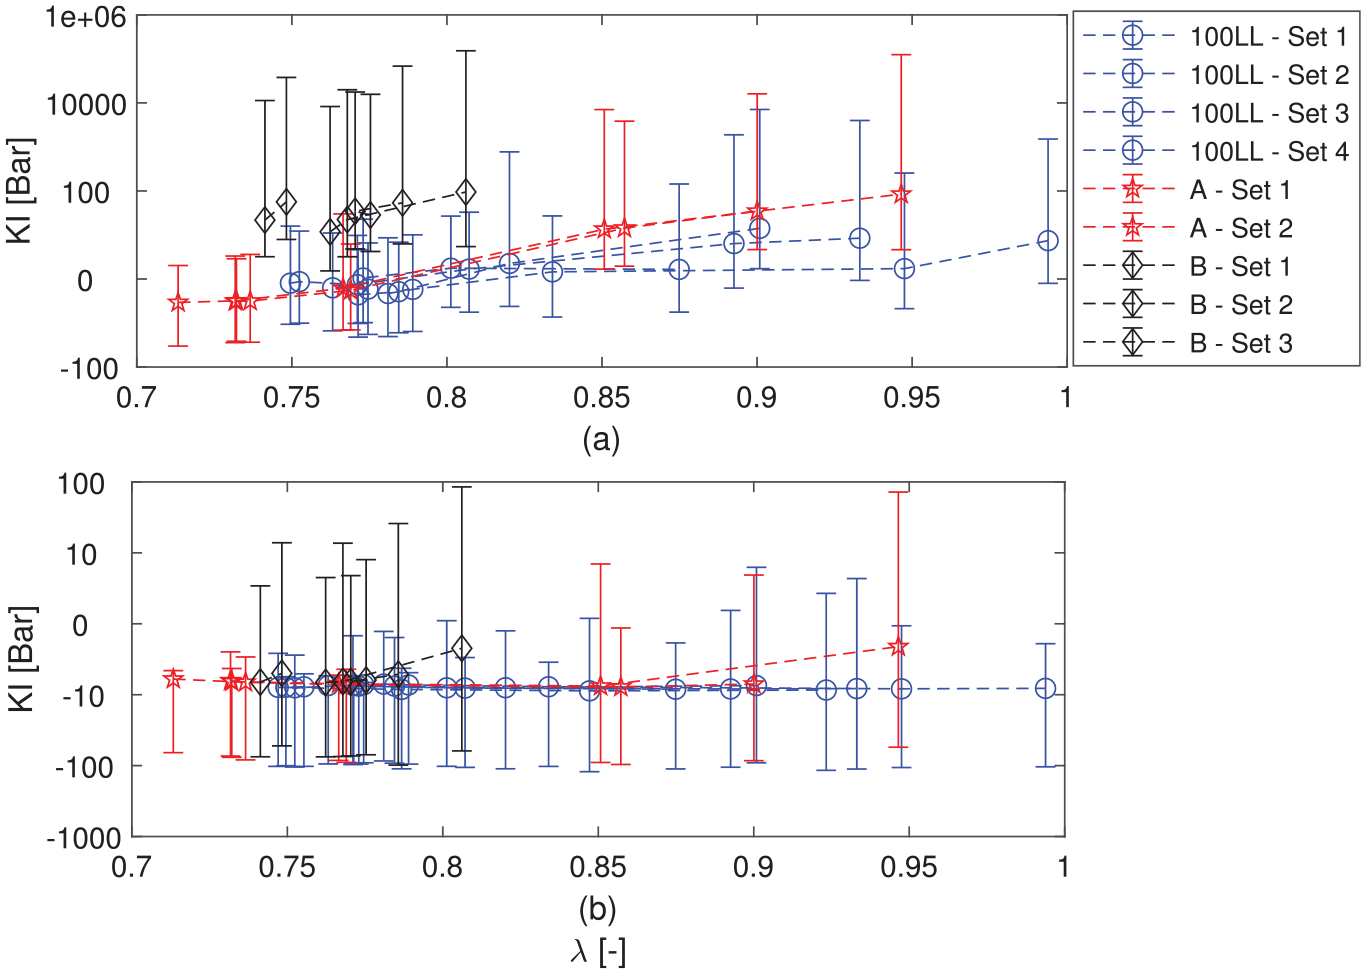
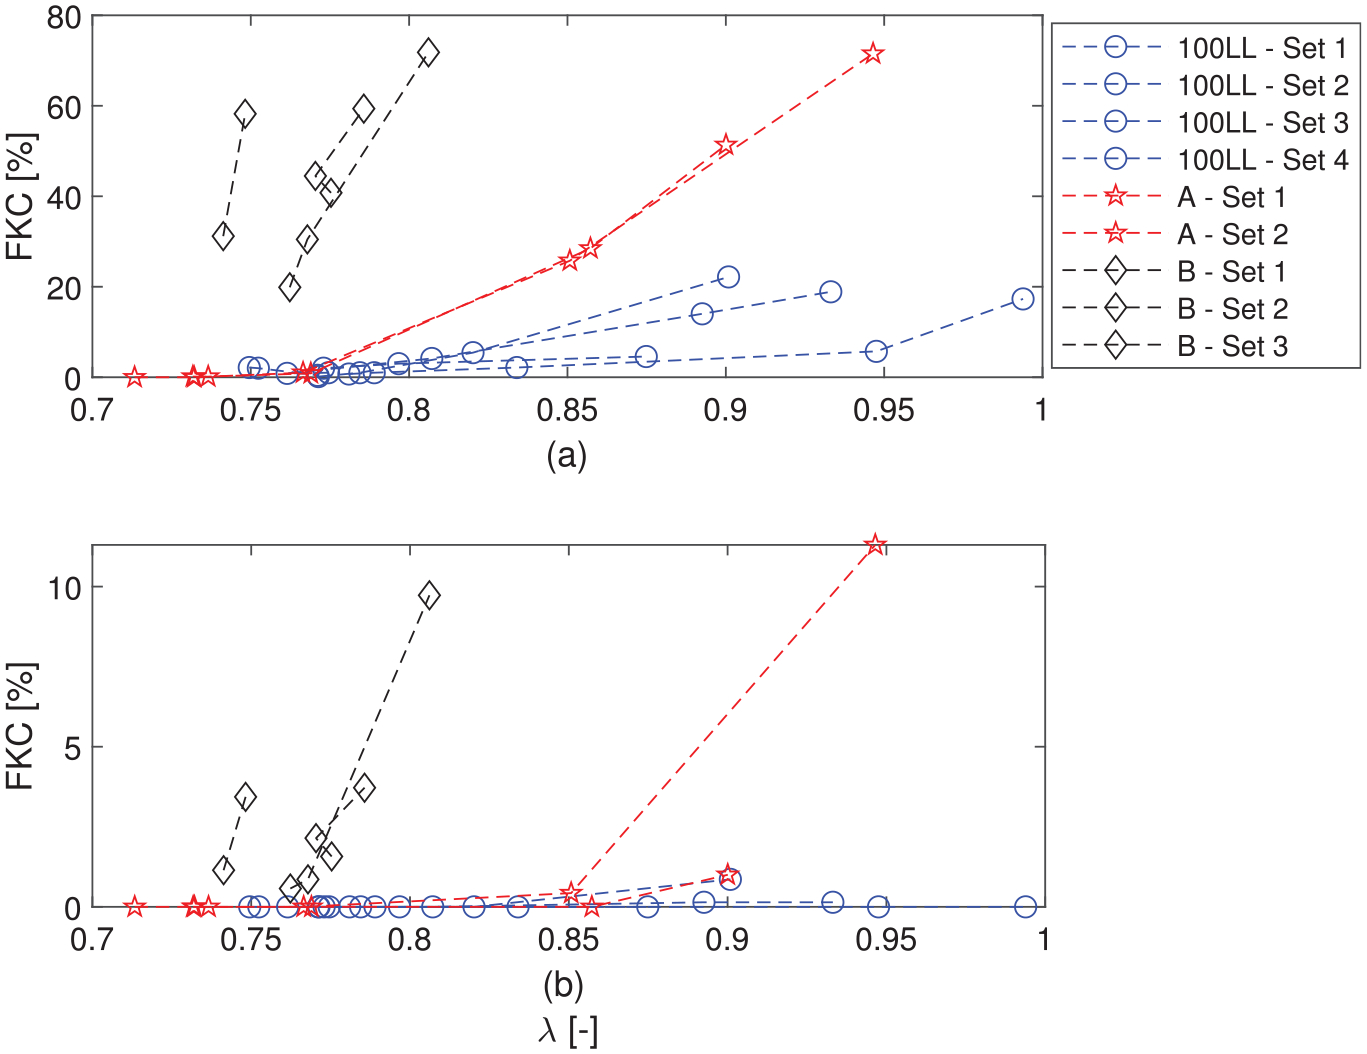
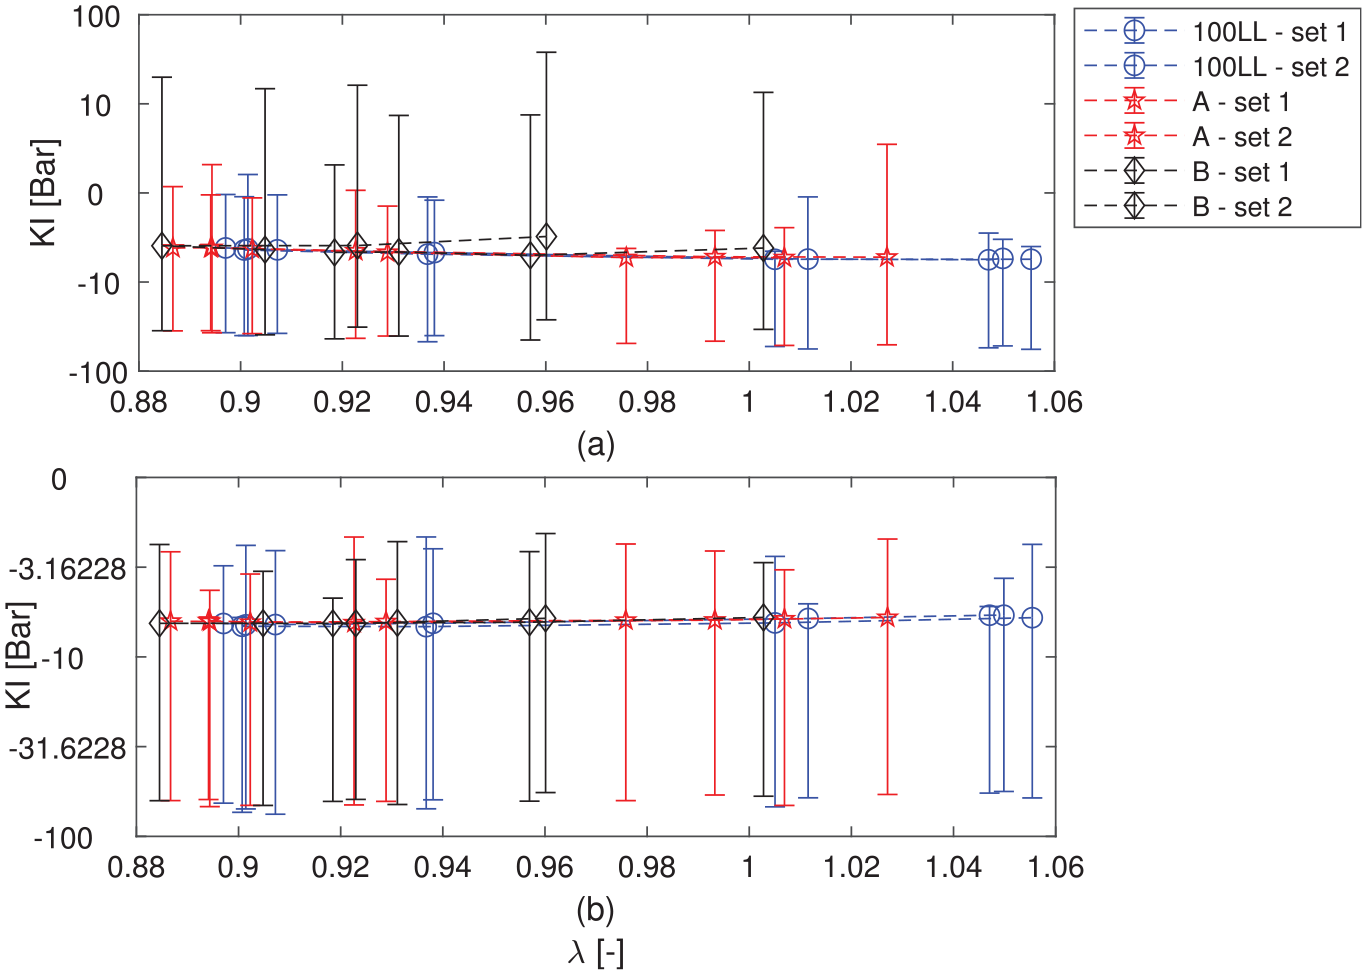
Figure 17(a) shows that the knock values calculated based on the unfiltered pressure trace increases with mixture lean-out during take-off for all fuels tested. However, as shown in Figure 17(b), the knock intensity calculated based on the filtered pressure trace reduces with mixture lean-out for 100 LL avgas fuel. This trend opposes the outcome of the unfiltered knock analysis.
For alternative unleaded fuel A, the measurements indicate that the average knock value reduces until lambda reaches 0.83 and then the knock intensity increases with further mixture lean-out. This suggests when the filtered pressure trace is used there is an optimal fuel-air mixture to minimize the knock index. There is no expected optimal mixture and this trend is caused by the incorrect filtering cut-off frequency as shown throughout this work. This trend is not seen in the unfiltered knock index for fuel A. This shows that not only does filtering affect the magnitude of the knock index but also the trends seen during combustion variations.
The calculated knock values for fuel B indicates an increase in knock intensity during mixture lean-out when either the unfiltered or filtered data is used. However, the knock index for fuel B rises earlier in the mixture lean-out and also achieves a higher knock index when compared to 100 LL avgas or fuel A, when either filtering option is used. In addition to the different trends seen in the mixture lean-out due to filtering, there is a significant difference in the magnitude of the ASTM knock index. For the take-off condition presented in Figure 17, the unfiltered data provides a smooth transition from negative knock index to positive values. However, both alternative unleaded fuels reach knock indexes that indicate high knock cycles (
The fraction of knocking cycles determined based on unfiltered and filtered pressure signal during mixture lean out is shown for take-off in Figure 18. As observed, the fraction of knocking cycles calculated based on unfiltered data is significantly higher compared to the filtered ones. The fraction of knocking cycles increases during the mixture lean out for both filtered and filtered signals. These results indicate that the pressure signal processing plays a crucial role in interpreting an operating point as a knocking or knock-free cycle.
Next, the cruise condition mixture lean-out is investigated. The knock values calculated based on filtered pressure trace for cruise condition show the knock intensity increases for all fuels tested with mixture lean-out, as shown in Figure 19(b). This trend is opposite from knock values calculated based on unfiltered pressure signal shown in Figure 19(a) where the knock magnitudes based on unfiltered pressure trace reduces with mixture lean-out. These results indicate that all three fuels have a similar mixture lean-out trend during cruise conditions; however, the signal processing of the pressure trace significantly changes the knock values and can even reverse the trend.
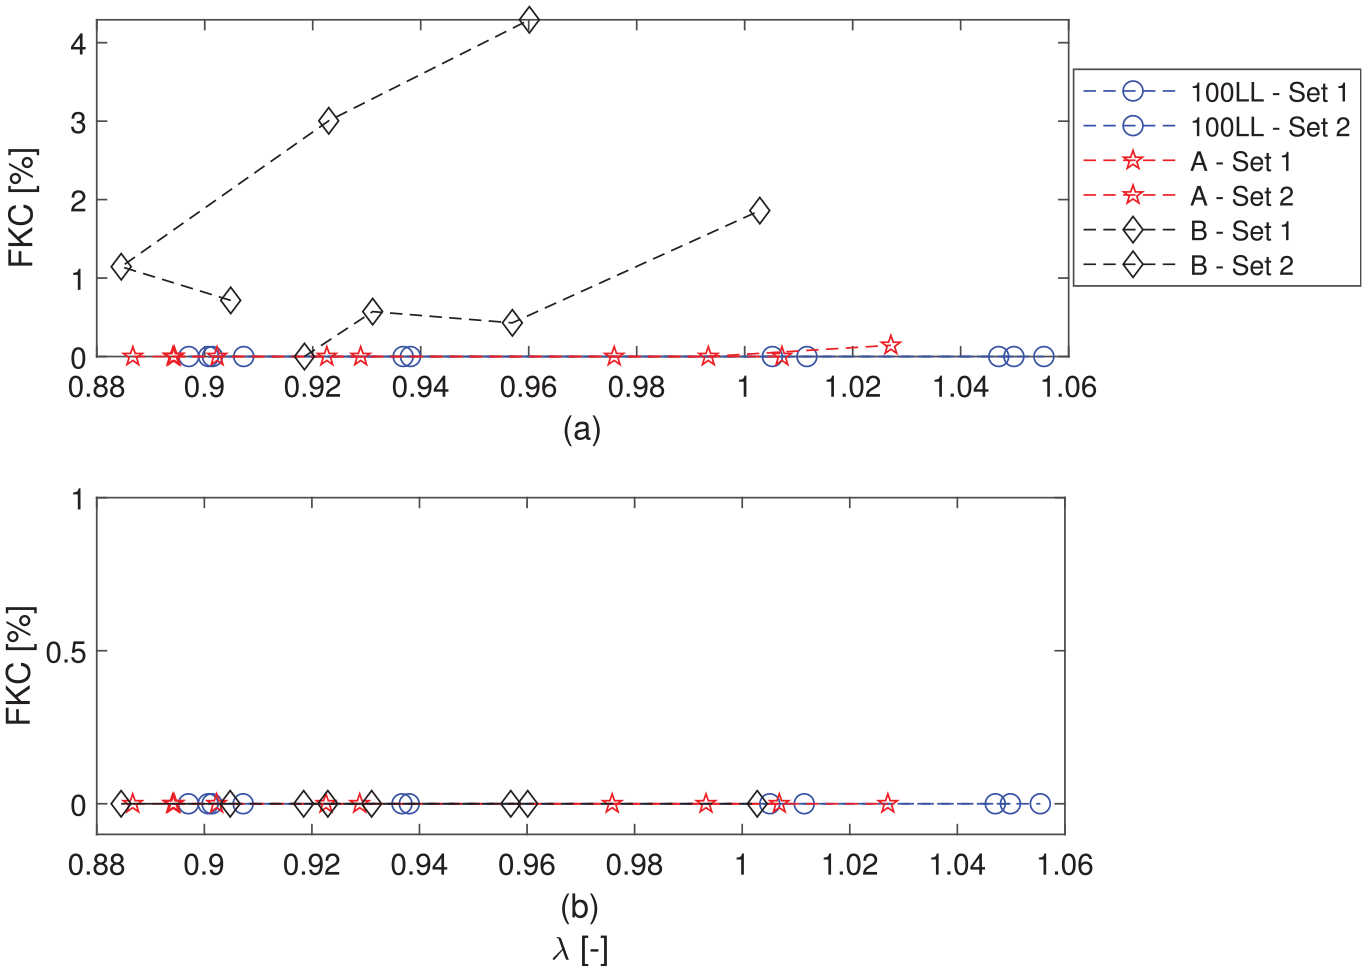
The fraction of knocking cycles during mixture lean-out is investigated for cruise mixture lean-out experiments, and the results are shown in Figure 20. The knock intensity values calculated based on unfiltered pressure signal increases during mixture lean-out for fuel B (see Figure 20(a)). The fraction of knocking cycles identified based on unfiltered pressure signal for fuel A and 100 LL is extremely low. The knock values calculated based on the filtered pressure signals indicate all operating points as knock-free points.
The mixture lean-out effect on combustion parameters is discussed to understand the relationship between combustion indexes and the knock intensity. Combustion timing and burn duration values are calculated for the take-off and cruise conditions and the results are shown in Figures 21 and 22. The combustion timing is advanced by 3.6, 2, and 1.4 CAD for fuels A, 100 LL, and B, respectively, during the take-off mixture lean-out. The knock intensity increases with advanced combustion timing and reduced burn duration as shown in Figures 20 and 21. The knock intensity is highly sensitive to combustion timing for the unleaded fuel candidates compared to 100 LL. For example, for 1.4 CAD combustion timing advance (Figure 21a) for fuel B during take-off mixture lean-out, the knock intensity (Figure 17a) increases almost nine times, considering ASTM knock numbers calculated based on unfiltered pressure trace. The combustion timing is retarded during cruise mixture lean-out with increased burn duration for all tested fuels. With retarded combustion timing and increased burn duration, the knock intensity will also be reduced. These observations are consistent with the literature.75–77 This confirms the knock index trends seen with the ASTM knock index using the unfiltered pressure trace is capturing the correct trends during mixture lean-out.
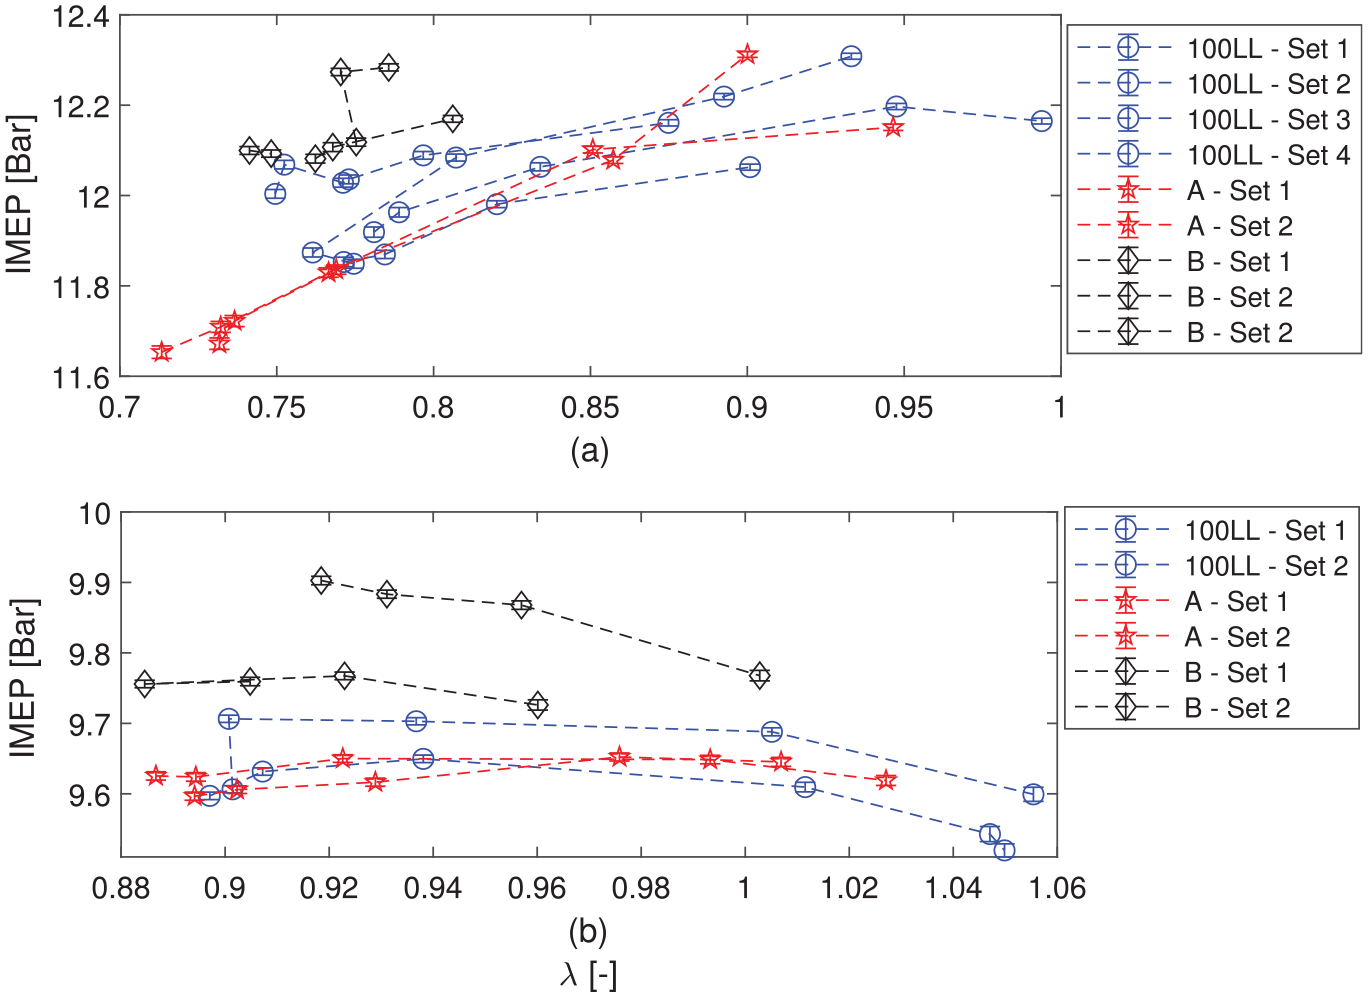
The effects of fuel mixture lean-out on IMEP is shown in Figure 23. The engine IMEP with fuels A and B are within the same range as the reference 100 LL fuel. The difference between the engine IMEPs for fuel types A, B, and 100 LL is mainly attributed to the fuel properties, the fuel lower heating values, and the fueling rate. IMEP slightly increases during take-off mixture lean-out; however, the IMEP values are reduced during cruise mixture lean-out. The combustion timing is advanced during take-off with mixture lean-out, as shown in Figure 21. With advanced combustion timing, expansion work increases leading to increased IMEP. For cruise conditions, the combustion timing is retarded with mixture lean-out, which reduces the expansion work. Retarding the combustion timing is an effective method for knock intensity reduction as this reduces the peak pressure and end-gas temperature; however, it could have an adverse effect on engine output power and fuel efficiency. Techniques like EGR 78 and water injection62,79 can be used for combustion timing and knock control in aviation SI engines. Both methods lower flame temperature and speed, so giving useful reductions in knock intensity with delayed combustion timing. These results indicate that one major challenge for aviation SI engines is to optimize combustion timing considering engine knock tendency. Therefore, to meet future general aviation fuel economy and emission reductions, knock phenomenon in boosted low-speed general aviation piston engines need to be well understood.
Comparison with other knock methods
The mixture sweep knock test results are also calculated using the third derivative of the pressure signal35,36,80 and Discrete Wavelet Transform (DWT).43,48 The method of third derivative of pressure signal is one effective robust pressure-based method used in commercial software 81 for knock detection and analysis. This method is based on the rate of change of pressure trace curvature over the period that auto-ignition occurs. 35 End-gas auto-ignition is associated with an abrupt increase in pressure trace following by a narrow pressure peak due to rapid heat loss. A rapid change from positive to negative curvature is associated with a large negative third derivative of pressure signal.36,80 However, a major problem with differentiating the pressure signal is the measurement noise. Pressure signal is filtered first as differentiation is a noise amplifying process. Figure 24 shows the variation in third derivative of pressure signal for the pressure signals shown in Figure 3.
The DWT method is a reliable frequency-based analysis method for knock detection as it includes the knock signal history at a discrete scale within a predefined crank-angle window. This frequency-based method is suitable for real-time knock detection and control in internal combustion engines. 43 DWT is computationally efficient as the discrete wavelet decomposition needs to be done for the knock frequency band only. In this work, DWT with a Daubechies-8 (16 coefficients) basis function, is used to analyze the knock quantity of the pressure signal. 43 The DWT is one way to represent a signal by using digital filtering techniques. Traditionally low-pass and high-pass, with the finite impulse response, are used. In this work, a three-level filter bank is created where the signal is decomposed into the high frequency and low-frequency coefficients.82,83 The classical DWT is computationally efficient; however, the DWT method with Daubechies is not recommended for a system with high measurement error. 43
A comparison during take-off is made between knock values calculated based on ASTM D6424 (Figure 17), the third derivative of pressure signal (Figure 25(a)) and DWT (Figure 26(a)). The ASTM knock number values calculated based on the unfiltered pressure data have the same increasing trend seen with the third derivative of the pressure signal and DWT during mixture lean-out. Additionally, when using the unfiltered data, the ASTM knock index matches the trends seen in the knock index of the third derivative of pressure and DWT for the individual fuels. A similar result can be seen for the cruise condition, where the unfiltered ASTM D6424 knock index (Figures 19), the third derivative of pressure knock index (Figure 25(b)), and the DWT knock index (Figure 26(b)) match. Again this suggests the ASTM knock values calculated based on unfiltered data are better suited to capture the correct trends during mixture lean-out.
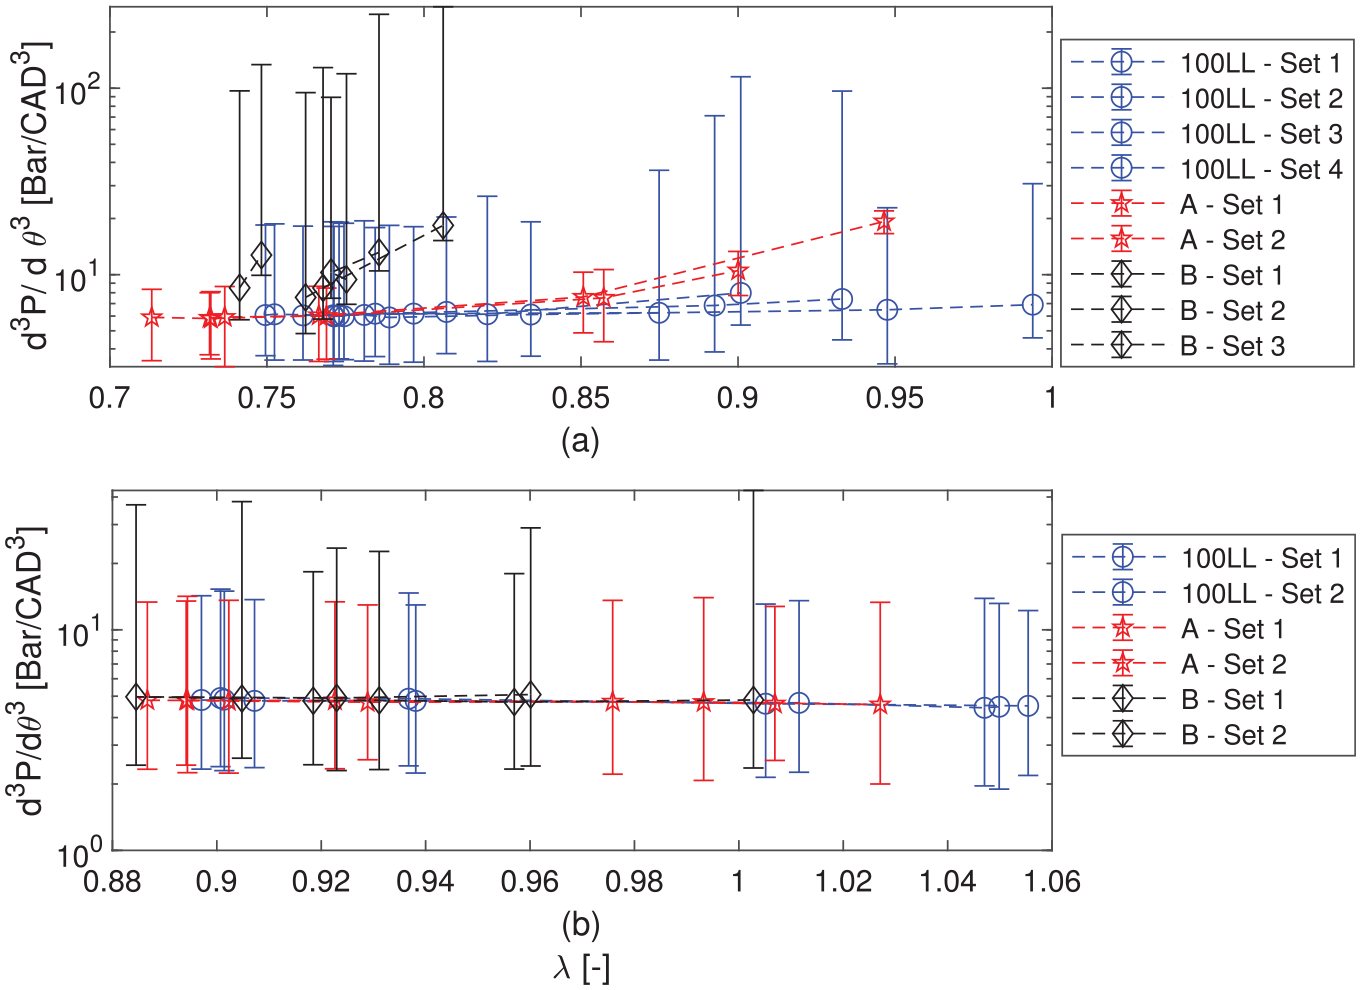
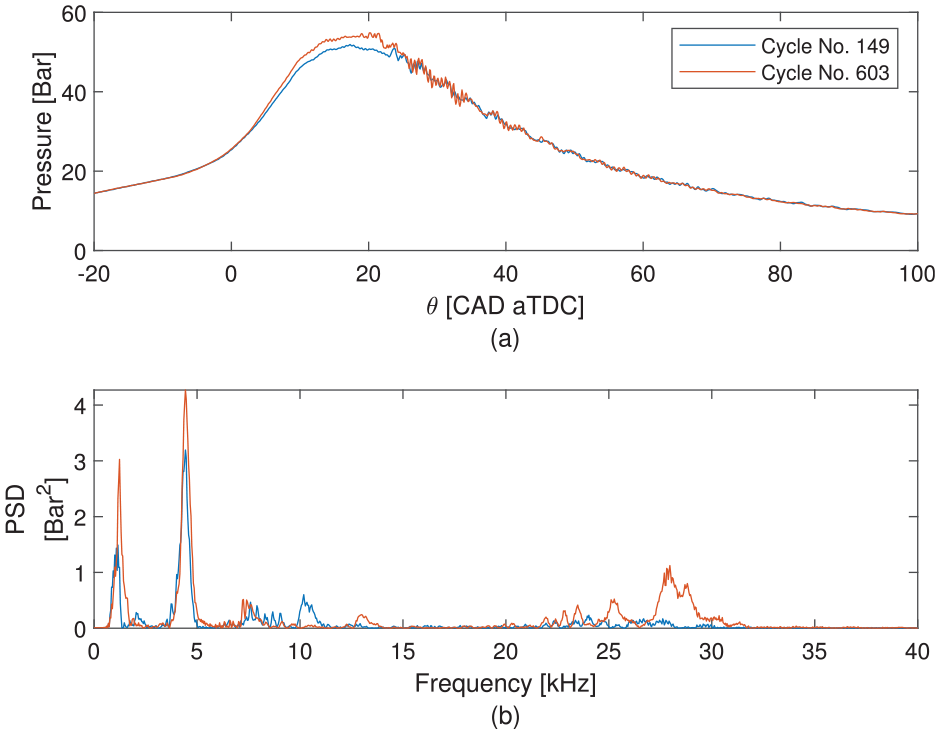
Although the trend is more acceptable for ASTM knock numbers calculated based on unfiltered pressure trace, the estimated values are high. For example, ASTM knock values calculated based on unfiltered pressure trace for transient number 700 listed in Table A.5 detects cycle no. 149 and 603 as cycles with high knock numbers (ASTM Knock Number of 15 & 18 Bar, respectively). However, A closer look at these cycles (Figure 27) reveals that they are representative of normal (knock free) engine operation.
Conclusions
The ASTM D6424 method is the standard used in the aviation industry for knock detection and engine certification. This work explored the impact of using unleaded aircraft fuels with this standard knock index calculation. Using measurements from the TSIO-520 engine tested at the NRC altitude chamber at a simulated altitude of 12,000 ft allowed for various knock indexes and data processing options to be explored with the standard 100 LL avgas and two alternative unleaded candidates. The effects of post-processing of the pressure signal on knock detection were detailed for the ASTM knock detection standard. It is found that the post-processing of the pressure signal significantly affects the calculated knock values, and appropriate pressure signal processing needs to be completed before the implementation of the knock detection algorithm. One improvement to the ASTM standard is the need for the minimum sampling frequency to be increased to least 0.2 CAD if aliasing is to be avoided. The results indicate that knock values calculated based on unfiltered pressure data per ASTM D6424 recommendations are not accurate and over-predict the number of knocking cycles. The use of a Butter-worth filter with a cut-off frequency of 40 kHz has enabled the accurate detection of knocking cycles when the current ASTM D6424 standard is used.
During mixture lean-out tests, the proposed filter was tested against the standard unfiltered data implementation of the ASTM knock detection method. It was discovered that the application of different post-processing methods not only change the magnitude of the knock index but also change the trend seen as the mixture is varied. The results of the ASTM knock detection method were then compared to the third derivative of pressure and DWT knock indexes, where the ASTM knock method using the unfiltered data matched the trends seen in the other two knock detection methods. However, the magnitude of the ASTM knock index suggested that many cycles were high knock cycles as they were above the currently recommended threshold in the ASTM D6424 standard. This suggests the unfiltered pressure signal should be used to capture the correct trends in knock changes; however, the threshold that determines knocking cycles from regular cycles must be updated. The value of this threshold will require additional engine testing on various engines to determine a knock intensity threshold that works universally. Also, ASTM D6424 cannot detect cycles with auto-ignition under spark assisted conditions experiencing high maximum in-cylinder pressure that can damage the engine instantaneously, and the ASTM standard recommendations regarding sampling frequency need to be modified. Therefore, further studies are required for pressure signal processing prior to the implementation of the ASTM D6424 knock detection method for new unleaded fuel candidates.
Footnotes
Appendix
Declaration of conflicting interests
The author(s) declared no potential conflicts of interest with respect to the research, authorship, and/or publication of this article.
Funding
The author(s) disclosed receipt of the following financial support for the research, authorship, and/or publication of this article: Funding by Mitacs IT08540, National Research Council (NRC) of Canada, Transport Canada, Environment and Climate Change Canada, and Canadian Owners and Pilots Association (COPA) is gratefully acknowledged.